 Wan Youwei
 Pan Binhui1
 Tang Xinfa
- 1School of Economic Management and Law, Jiangxi Science and Technology Normal University, Nanchang, Jiangxi, China
- 2Changsha Health Vocational College, Changsha, Hunan, China
- 3Industrial and Commercial Bank of China Limited, Changsha, Hunan, China
Introduction: Quantifying carbon emissions and identifying their drivers are essential for formulating effective climate policies in key economic zones. This study analyzes the decoupling effects and driving factors of carbon emissions in China’s Yangtze River Delta region from 2008 to 2022.
Methods: Using provincial-level energy balance sheets, carbon emissions were estimated via a top-down approach. The extended Generalized Divisia Index Method (GDIM) decomposed emission drivers, and a novel decoupling index model was developed by integrating GDIM with traditional decoupling analysis to quantify factors’ contributions.
Results: Total carbon emissions exhibited an initial increase followed by a decline, with an overall reduction exceeding 65%. Economic scale was the primary driver of emission growth, while output carbon intensity was the dominant mitigating factor; energy consumption carbon intensity and energy intensity showed significant emission reduction potential. Most decoupling indices were positive, indicating measurable decoupling progress, with Shanghai achieving strong decoupling (index: 1.5603) during 2014–2016. Decoupling effects transitioned from weak to strong and back to weak across sub-periods, highlighting robust mid-term efforts that weakened later. Output carbon intensity promoted decoupling, whereas energy scale inhibited it.
Discussion: Policy recommendations include developing region-specific carbon reduction strategies, enhancing low-carbon technology R&D and implementation, and continuously optimizing energy structure to sustain decoupling efforts.
1 Introduction
Under the increasingly severe global climate change context, carbon emissions have emerged as a focal issue of international concern. With the signing and implementation of the Paris Agreement, nations worldwide are committed to exploring practical and effective carbon reduction pathways to address environmental challenges induced by greenhouse gas emissions. As the largest developing country experiencing rapid economic growth, China faces tremendous carbon reduction pressure due to its continuously rising energy consumption and total carbon emissions. In response, the Chinese government has actively answered international calls by solemnly proposing the “Dual Carbon Goals” in 2020, demonstrating major-country responsibility and unwavering commitment in combating climate change. This strategic target not only necessitates achieving a historic transition from carbon peaking to carbon neutrality within a compressed timeframe but also requires profound green transitions and structural adjustments across all dimensions of socio-economic development. The formulation of this goal aligns with the core principles of the Paris Agreement’s nationally determined contributions (NDCs) framework and reflects China’s determination to promote global climate governance through multi-dimensional transformations in energy systems, industrial patterns, and technological innovation.
The Yangtze River Delta region, serving as a core engine and frontier of China’s economic development, occupies a pivotal position in the national economic landscape. Characterized by its highly advanced manufacturing sector, thriving service industries, and dense transportation networks, it concentrates substantial industrial activities and population flows (Cui et al., 2024). Despite accounting for merely 1/26 of the nation’s land area and approximately one-sixth of its population, this region contributes 24.2% of China’s GDP (2022). However, it faces significant challenges due to high carbon dependency, with its total carbon emissions reaching 1.78 billion tons (representing one-fifth of the national total) (Cao et al., 2024). Although energy consumption per unit of GDP has declined by 54.3% since 2008, structural decarbonization remains urgent. Researching carbon emissions in the Yangtze River Delta is not only an intrinsic demand for regional green transformation but also a core component of national strategy implementation, global climate governance participation, and new development paradigm construction (Tang et al., 2024b; Tang and Wang, 2025). Its significance lies in dismantling administrative barriers through institutional synergy, driving industrial upgrading via technological innovation, and balancing regional development through spatial optimization, ultimately providing a replicable “Chinese Solution” for achieving carbon neutrality in high-density global economic zones.
The core role of researching carbon emission decoupling effects lies in breaking the traditional positive correlation between economic growth and carbon emissions, achieving economic expansion while reducing or stabilizing carbon emissions, thereby advancing sustainable development (J. Liu et al., 2022). Concurrently, studies on carbon emission decoupling play a pivotal role in promoting green transition, alleviating climate and environmental pressures, and enhancing economic resilience. The Yangtze River Delta region currently faces dual pressures of economic growth and emission reduction, making research on practical pathways for regional low-carbon transformation imminently. Consequently, such studies not only provide a decision-making basis for green integrated development in the Yangtze River Delta but also contribute critical empirical insights to China’s exploration of synergistic pathways for economic growth and ecological conservation. By investigating the intrinsic linkages and dynamic equilibrium mechanisms between economic growth and carbon emissions, this research holds immeasurable strategic significance for achieving China’s “dual carbon goals”.
2 Literature review
In recent years, research on carbon emission decoupling effects has flourished within interdisciplinary domains encompassing environmental science, economics, and energy studies. Scholars have employed cutting-edge methodologies and models to dissect the intricate relationship between economic growth and carbon emissions while identifying pivotal driving factors influencing this dynamic (Wang and Wang, 2019). Decomposition analysis techniques (Su and Ang, 2023), Structural Decomposition Analysis (SDA) and particularly Index Decomposition Analysis (IDA), are instrumental in unveiling drivers behind energy consumption and pollutant emission variations by quantifying their impacts on energy systems and environmental outcomes (Wang et al., 2021; Zha et al., 2019). Compared to SDA, which faces constraints from data collection challenges, IDA demonstrates superior applicability through less stringent data requirements and flexibility across various aggregation levels (Moreau et al., 2019). Consequently, IDA has emerged as the prevailing technique for analyzing pollutant emission drivers in energy-environment studies, with its logarithmic mean variant gaining prominence for its path independence and residual-free properties (Tang et al., 2024a).
2.1 Research on carbon emission factor decomposition
In current research on carbon emission factor decomposition, the Logarithmic Mean Divisia Index (LMDI) (De Oliveira-De Jesus, 2019; Laporte et al., 2024; Li et al., 2024; Tian et al., 2024; Wang and Zhen, 2024) method has gained prominence owning to its operational simplicity and residual-free properties. However, as academic exploration of decomposition methodologies deepens, limitations in existing index decomposition approaches including LMDI have become apparent. These include susceptibility to result bias caused by interdependencies among factors when decomposing target variables into multiplicative components, and inability to concurrently evaluate multiple absolute factors, potentially overlooking critical influencers. To address these challenges, Vaninsky proposed the Generalized Divisia Index Method (GDIM), which overcomes factor interdependencies inherent in conventional decomposition techniques (Vaninsky, 2014). GDIM enables simultaneous quantification of multiple absolute and relative factors’ impacts on carbon emission variations while distinguishing inter-factor correlations to prevent double-counting.
The Generalized Divisia Index Model is a statistical decomposition model that quantifies the driving effects of multiple factors (Shao et al., 2016; Zhang et al., 2022). Its core aim is to break down changes in a target variable into contribution values from multiple absolute or relative driving factors. Its mathematical basis involves constructing a Jacobian matrix to analyze the partial derivatives of the target function with respect to each factor, eliminating the residual - term issue of traditional methods like LMDI (Ma et al., 2025; Zhou et al., 2025). In carbon emission analysis, GDIM can factor in both absolute indicators and relative ones. It can calculate each factor’s contribution to carbon emission changes. Supporting dynamic analysis across periods, GDIM can precisely identify key driving factors, offering unbiased scientific support for policymaking.
Recent applications demonstrate GDIM’s analytical efficacy in practical scenarios (Chen et al., 2023; Li J. et al., 2023; Li W. et al., 2023; Shen et al., 2024; Zhu et al., 2024; Zhu et al., 2025). For instance, scholars have pioneered its use in investigating socioeconomic drivers of industrial volatile organic compounds (VOCs) emissions across China and its 30 provinces. This approach facilitated comparative analysis of provincial contributions to national VOCs emissions and detailed examination of region-specific influencing mechanisms (Zhang et al., 2023). Another study applied GDIM to analyze recent emission trends in Fujian Province’s construction sector, identifying key drivers through entropy weight-TOPSIS methodology. This integrated framework quantitatively assessed temporal variations in emission reduction capacities by evaluating economic, energy, social, and technological factors (Li et al., 2025). Nevertheless, current research remains predominantly industry-focused, with regional-level applications yet to achieve comprehensive implementation.
2.2 The role of carbon emission factor decomposition
Factor decomposition of carbon emissions facilitates the identification of drivers behind emission variations, thereby providing a scientific basis for formulating carbon mitigation policies, while decoupling effect analysis enables the evaluation of current policy efficacy and informs iterative policy refinements to achieve carbon reduction and decoupling targets. Decoupling analysis, widely employed to assess asynchronous dynamics between carbon emissions and economic growth, fundamentally stems from governmental responses to emission cost pressures under growth-driven economic mechanisms (Tapio, 2005). However, existing studies predominantly focus on determining “whether decoupling occurs” rather than investigating causative drivers, resulting in limited capacity to identify determinants of decoupling transitions or quantify factor-specific contributions to decoupling effects (Magazzino et al., 2023; Wang et al., 2017). This knowledge gap undermines evidence-based policymaking for carbon decoupling. Recent advances integrate decomposition techniques with decoupling frameworks: Scholars have applied the GDIM to decompose industrial carbon emission drivers in China, elucidating emission trajectory determinants through velocity decoupling (temporal dynamics) and quantitative decoupling (magnitude differentials) (Liu et al., 2024). Furthermore, innovative extensions incorporate innovation factors into GDIM and Decoupling Effort Index (DEI) models, dissecting them into three variables—innovation input efficiency, innovation input carbon intensity and innovation input scale—to compare their differential impacts on emissions and decoupling across high-emission subsectors (Liu et al., 2022). By synergizing factor decomposition with decoupling models, this integrated approach clarifies the coevolutionary pathways of economic growth and emission reduction, evaluates policy effectiveness, and identifies optimal strategies for achieving win-win development and decarbonization (Ye et al., 2025).
2.3 Research contribution
Based on existing research, this paper first employs an expanded GDIM decomposition method to analyze the driving factors behind the evolution of carbon emissions in the Yangtze River Delta region. Building upon this analysis, it constructs a carbon emission decoupling index model to identify the key factors contributing to strong decoupling effects, weak decoupling effects, and non-decoupling effects in the region. Compared with previous studies, the marginal contribution of this paper lies in: in terms of methodological approach, this study innovatively applies the expanded GDIM decomposition method to dissect the driving factors behind carbon emission trends in the Yangtze River Delta region from 2008 to 2022. This approach enables a more precise and comprehensive understanding of how individual factors influence regional carbon emissions. It simultaneously extends the practical application of the GDIM decomposition method to regional-level analyses, offering new perspectives and methodological guidance for research on regional carbon emissions. On the other hand, this research integrates the GDIM decomposition method into the traditional decoupling model to formulate a novel decoupling indicator defined as the ratio of carbon reduction effort to economic growth factors. This approach serves to evaluate the actual effectiveness of emission reduction policies. Concurrently, it systematically delineates regional decoupling efforts across different time periods, providing clearer visualization of the efficacy of various regions’ decarbonization endeavors. This integration achieves an organic combination of factor decomposition and decoupling analysis, enabling in-depth exploration of carbon emission decoupling effects and their underlying drivers while simultaneously offering theoretical support for policymakers to formulate scientifically sound carbon decoupling strategies.
3 Research methods and data sources
3.1 Generalized divisia index decomposition method (GDIM)
Index decomposition analysis (IDA) treats each decomposed driver variable of the target variable as a continuously differentiable function of time t. By differentiating these functions with respect to time t, the method derives the contribution rates of changes in each driver variable to the target variable. The mapping relationships between the target variable and its driving factors are explicitly expressed in functional form as shown in Equations 1, 2:
In the equation: Z represents the target variable (carbon emissions); X denotes the factor variables influencing Z (energy consumption, population, regional gross product (GRP));
Substitute Formulas 3, 4 into Formula 5 to obtain the following Formula 6:
In the equation: t0 and t1 are the reference time and current time, respectively. If expressed in vector form, it can be written as Formula 7:
In the formula:
Vaninsky argues that the above decomposition method fails to adequately account for the interdependence among factor variables, potentially causing analysis bias. To address this, he proposes adding constraint Equation 8 to the GDIM to restrict the correlation between decomposition factors.
Its vector form is:
Substitute Equation 9 into GDIM, and the decomposition vector can be expressed as Equation 10:
In the formula,
In the GDIM, the absolute and relative indicators must be included simultaneously, and both types of indicators must be logically associated. The target variable must be expressible as a multiplicative function of the absolute and relative indicators to ensure the Jacobian matrix can be constructed. In the GDIM, GDP, population, and energy consumption are core driving factors that significantly influence carbon emissions through different mechanisms. GDP is the dominant factor in explaining changes in carbon emissions, manifesting through economic scale effect, economic structure effect, and technological compensation effect. The impact of population on carbon emissions is twofold in nature–scale - wise and structure - wise. Population growth directly increases energy consumption demand, leading to a rise in carbon emissions. Meanwhile, the accelerated urbanization process concentrates more people in high - energy - consuming cities, further exacerbating carbon - emission pressures. Energy consumption is the key medium through which GDP and population drive carbon emissions, with its pathways including the total energy effect, energy structure effect, and energy intensity effect. In the GDIM model, GDP, population, and energy consumption jointly explain changes in carbon emissions via three pathways—scale expansion, efficiency improvement, and structural optimization (Wen et al., 2022).
3.1.1 Carbon emission factor decomposition
According to the Kaya identity, carbon emissions are decomposed into the following equation:
From Equation 11, the following limitations arise in carbon emission decomposition: ①Exclusive focus on absolute factors: Only the absolute factor of population size (P) is considered, while neglecting other absolute drivers such as total output (G) and energy consumption (E). This oversimplification fails to capture the multidimensional dynamics of emissions. ②Insufficient sensitivity to energy consumption changes: When E increases (with other factors constant), the second term (G/E, reflecting energy intensity) decreases, while the third term (E/P, per capita energy use) increases. However, these opposing effects cancel out in the equation, leaving the overall carbon emissions (C) unchanged—a critical flaw in isolating energy-related impacts. ③Omission of latent factors: Key relative metrics like carbon intensity of energy consumption (E/C) are not incorporated, limiting the model’s ability to assess structural decarbonization efforts. To address these limitations, this study adopts the Generalized Divisia Index Method proposed by Vaninsky. The decomposition steps are as follows.
① The expression for driving factors of carbon emissions in the YRD region is constructed as follows:
In the formula: C represents carbon emissions; G stands for output scale; GC indicates output carbon intensity; E is energy scale; EC refers to energy consumption carbon intensity; P represents population scale; PC is per capita carbon emissions; PG stands for per capita output scale; GE indicates energy intensity.
Furthermore, by transforming Formulas 12–14, the following Equation 15 are obtained:
② Construct the Jacobian matrix for each driving factor. Let function C(X) represent the contribution of driving factor X to carbon emission changes, and build a Jacobian matrix ΦX composed of the first - order partial derivatives of each factor as shown in Equation 16:
③ Determine the contribution of each driving factor. Based on the principle of the GDIM decomposition method, the change in carbon emissions ΔC in the YRD region will be decomposed into the sum of the contributions of each factor, as shown in Equation 17:
In the formula:
Based on the above-mentioned factor decomposition, the change in carbon emissions
3.2 Fundamental assumptions and data input requirements
The Generalized Divisia Index Method (GDIM) operates under the core assumption that changes in carbon emissions can be multiplicatively or additively decomposed into contributions from multiple driving factors, necessitating factor separability and functional form consistency. It presumes that drivers such as economic scale, industrial structure, and technological efficiency exhibit temporal continuity and differentiability, enabling marginal contribution decomposition via total or partial differential equations. Critically, GDIM requires path independence, ensuring decomposition results remain invariant to the sequence of variable changes, thus guaranteeing uniqueness and comparability of outcomes. Violations occur if data exhibit significant nonlinear interactions or abrupt structural breaks, necessitating corrective measures like segmented decomposition or dynamic adjustment terms.
GDIM demands comprehensive, high-precision time-series data for both absolute and relative indicators: Absolute Indicator, Include metrics like economic output, total energy consumption, population size, and sector-specific activity data. These require complete coverage over the analysis period without gaps. Relative Indicators: Such as energy intensity (energy use per GDP unit), carbon intensity (emissions per energy unit), or technological efficiency metrics. These must be dimensionally consistent with absolute indicators and standardized to prevent scale-induced biases.
3.3 Decoupling index model based on GDIM
Carbon emission decoupling efforts refer to the policy measures taken to reduce carbon emissions without harming economic growth. In the study of carbon emission decoupling, eliminating the carbon emissions caused by economic growth factors can further evaluate the effectiveness of decoupling efforts. Based on the GDIM decomposition results,
As shown in Equation 18, there is a passive correlation between the economic growth factor and the carbon reduction efforts, and the economic growth factor has been separated from other factors. Based on this, this paper constructs a new decoupling indicator, defined as the ratio of carbon reduction efforts to the economic growth factor, to explore the actual effectiveness of carbon reduction policies.
In the Formula 19,
Further decomposition yields the decoupling effects of each carbon - emission reduction effort:
In the Formula 20:
3.4 Data source
This paper employs a top - down allocation accounting method based on the provincial energy balance sheet to estimate the energy consumption and carbon emissions of each city. The specific calculation Formulas 21–24 are as follows:
Where,j represents the rows in the provincial energy balance sheet, that is, the energy consumption categories;
The carbon emission accounting methodology adopted the “2006 IPCC Guidelines for National Greenhouse Gas Inventories”. Carbon emission coefficients for various energy sources were derived from data published by the Energy Research Institute of the National Development and Reform Commission (NDRC) in 2003. Provincial-level carbon emissions were estimated based on energy consumption data from provincial energy balance sheets and their corresponding carbon emission coefficients. In the research process, provincial energy balance sheets were sourced from the China Energy Statistical Yearbook (2008–2023). Gross Regional Product and year-end total population for individual cities were obtained fromprovincial statistical yearbooks over the years and the China City Statistical Yearbook. To eliminate the influence of price fluctuations, the gross output value was deflated using constant 2008 prices. For a small number of missing values, linear interpolation was applied based on data from adjacent years to ensure data integrity and enhance the reliability of the research.
4 Empirical results and analysis
4.1 Carbon emissions measurement results
As illustrated in Figure 1a, the total carbon emissions in the YRD Basin showed a gradual climb trajectory from 2008 to 2022. Notably, Jiangsu Province accounted for the largest share of emissions, with its annual carbon emissions persistently increasing and reaching 915 million tons by 2022. This represents an average contribution of 41.93% to the basin’s total emissions during the period, underscoring Jiangsu’s pivotal role in determining the success of regional carbon reduction targets. Simultaneously, Zhejiang Province’s carbon emissions exhibited a gradual upward trajectory, reaching 497 million tons by 2022, accounting for an average of 23.92% of the total emissions in the YRD Basin. Anhui Province mirrored Jiangsu’s growth pattern, with emissions rising to 448 million tons in 2022, representing a 19.84% average regional contribution. In contrast, Shanghai demonstrated fluctuating growth trends: emissions increased from 237 million tons in 2008 to a peak of 291 million tons in 2013, followed by a gradual decline to 287 million tons by 2022, maintaining an average share of 14.3%.
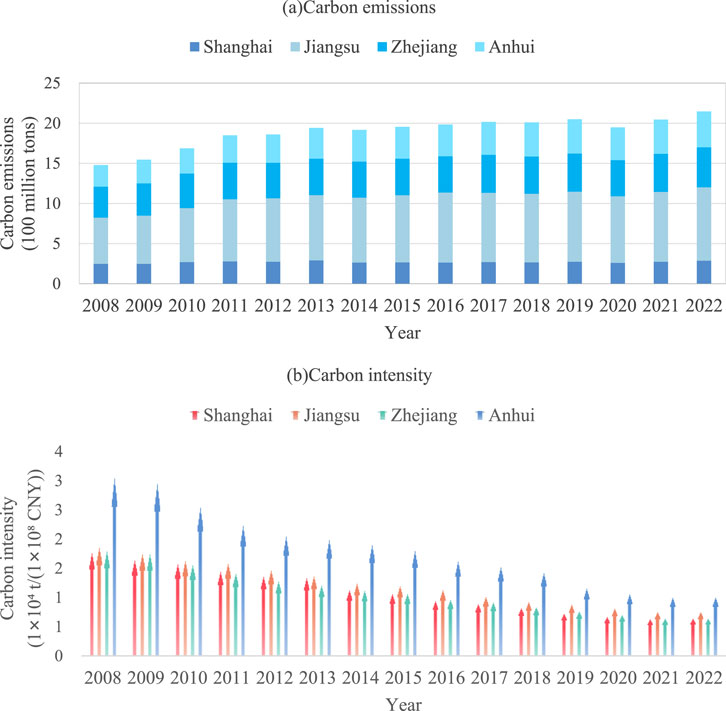
Figure 1. Carbon emissions and carbon intensity of the Yangtze River Delta Region from 2008 to 2022. (a) Carbon emissions, (b) Carbon intensity.
As shown in Figure 1b, the carbon intensity of the YRD Basin exhibited a significant downward trajectory during 2008–2022, with cumulative reductions exceeding 65%, reflecting the substantial progress achieved through regional economic transition and structural adjustments. Notably, Anhui Province demonstrated the most remarkable performance, achieving a 69% reduction in carbon intensity over the study period. This success primarily stems from sustained optimization of heavy industrial layouts and sectoral restructuring, which drove accelerated decoupling between carbon emissions and economic growth. Zhejiang Province ranked second in carbon intensity reduction, maintaining an average carbon intensity of 164 tons/million RMB. Jiangsu Province reduced its carbon intensity from 215 tons/million RMB in 2008 to 74 tons/million RMB in 2022—a decrease of 141 tons/million RMB—while Shanghai achieved a reduction of 125 tons/million RMB, indicating that high-emission regions exhibited more pronounced decarbonization efforts compared to lower-emission counterparts. Under the strategic framework of 'coordinated ecological conservation and governance,’ future carbon mitigation in the Yangtze River Basin should emphasize heterogeneous growth poles and prioritize differentiated policy pathways to amplify region-specific decarbonization efficacy.
4.2 Decomposition of driving factors of carbon emissions
Based on the principles and formulas of the Generalized Disney Index Method (GDIM), this study employs R language to decompose the driving factors of carbon emissions in the YRD region. To dynamically visualize the impacts of each factor on carbon emission changes, the contribution rates of individual factors were cumulatively calculated on an annual basis with 2008 as the base period, as illustrated in Figure 2. The eight factor variables are categorized into three major groups for systematic analysis, with detailed classifications and average contribution rates summarized in Table 1. The key findings are as follows.
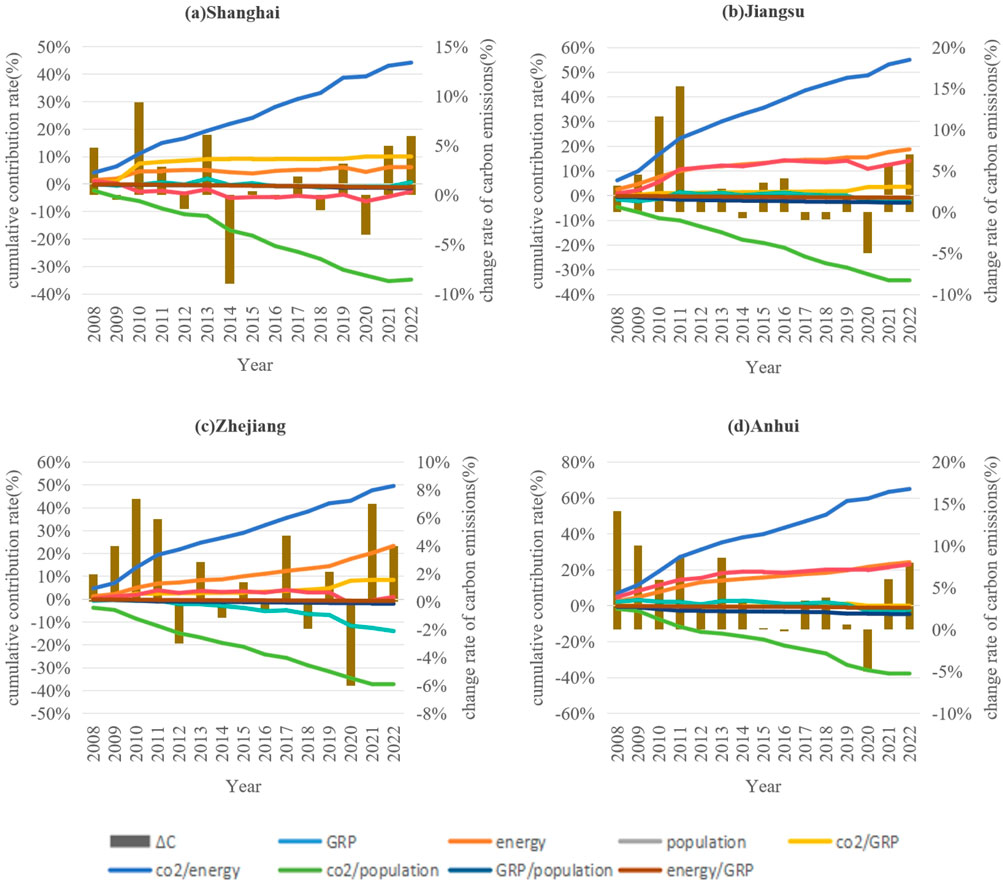
Figure 2. Contribution rate of each factor and change rate of carbon emissions of the Yangtze River Delta Region from 2008 to 2022. (a) Shanghai, (b) Jiangsu, (c) Zhejing, (d) Anhui.
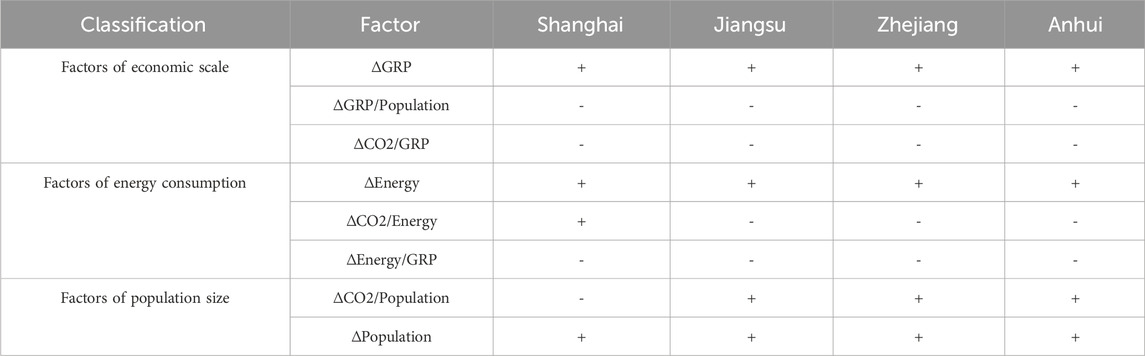
Table 1. Classification and average contribution of carbon emission factors in the Yangtze River Delta region from 2008 to 2022.
4.2.1 Analysis of economic scale factors
Regional Gross Domestic Product serves as a critical metric for evaluating living standards within a geographic area, reflecting both economic development levels and the material prosperity of residents. From 2008 to 2022, the YRD region achieved an average annual GDP growth rate of 8.9%. Energy, as a fundamental production factor, inevitably drives increased consumption alongside economic expansion, leading to substantial CO2 emissions. Consequently, rapid economic development has emerged as the dominant contributor to carbon emission growth in this context.
The cumulative contribution rate of GRP to carbon emission growth in the YRD region is evident in the incremental analysis. By 2022, GRP accounted for 44.26%, 55.03%, 49.56%, and 65.04% of cumulative emission increases across the four jurisdictions respectively. In Shanghai, the GRP contribution rate remained positive but exhibited an overall downward trajectory during 2008–2022, declining to 1.13% by 2022 (a 3.07% reduction from 2008 levels). Similar declining trends were observed in Jiangsu, Zhejiang, and Anhui provinces. The peak contribution rates for Jiangsu and Zhejiang occurred in 2010 at 6.84% and 6.77%, respectively, while Anhui’s peak reached 7.94% in 2011. These patterns indicate a diminishing driving effect of GRP on regional carbon emissions.
The primary driver stems from industrial structure advancement and service-oriented transition. For instance, Shanghai has relocated traditional heavy industries to peripheral areas while focusing locally on low-emission industries such as integrated circuits and biomedicine, significantly reducing energy consumption per unit of GDP. The proportion of tertiary industries in the Yangtze River Delta rose from 51% in 2008 to 56.5% in 2022, with Shanghai’s figure reaching 73% (2022). Service sectors such as finance and technology R&D generate only 15%–20% of the carbon emissions per unit of GDP compared to manufacturing, consequently enabling a gradual decoupling of GRP growth from carbon emissions.
Regarding the variable ∆GRP/Population, the decomposition results reveal that its contribution rate to carbon emission changes consistently exhibited marginal negative effects, with cumulative contribution rates of −1.54%, −2.87%, −2.01%, and −4.68%, respectively. This indicates that per capita income growth exerted a slight yet persistent inhibitory influence on emission trajectories, albeit with limited overall impact.
Output carbon intensity refers to the CO2 emissions per unit of Gross Regional Product (GRP), where a reduction in output carbon intensity indicates lower emissions generated while maintaining equivalent economic value. This metric reflects the efficiency relationship between carbon emissions and economic growth.From 2008 to 2022, the output carbon intensity in the YRD region exhibited a consistent downward trend. The variation in output carbon intensity (ΔCO2/GRP) exerted the strongest inhibitory effect on carbon emission growth among all contributing factors, with cumulative inhibitory contribution rates of −34.76%, −34.42%, −37.38%, and −37.66% respectively. These values surpassed the combined effects of all other inhibitory factors. In this study, ΔCO2/GRP captures the impact of low-carbon transitions in economic development on emissions, primarily reflecting the influence of production technology advancements on emission dynamics. As technological innovation accelerated, the deployment of low-carbon technologies significantly enhanced the decarbonization of production processes. Consequently, ΔCO2/GRP demonstrated marked reductions, translating into substantial emission mitigation effects. This underscores that technological progress currently serves as the dominant determinant in addressing carbon emissions, aligning with global strategies for sustainable development.
In the Yangtze River Delta region, the mechanism through which technological progress reduces carbon intensity primarily manifests in three interconnected dimensions: direct innovation in production technologies, indirect upgrading of industrial structures, and synergistic policy-market coordination. Specifically, advancements in production technology innovation are achieved through: Optimization of industrial processes; Digital-enabled energy efficiency management; Substitution with clean technologies. For instance, Jiangsu’s steel sector has applied hydrogen-based metallurgy technology, reducing carbon emissions per ton of steel by 30%, while Shanghai Baosteel utilized AI algorithms to optimize blast furnace combustion efficiency, lowering coal consumption by 15%. Additionally, industrial structure upgrading has been facilitated through the digital economy, which reduces information costs and optimizes resource allocation, thereby advancing industrial sophistication. In terms of policy-market synergy, green innovation is incentivized via mechanisms such as carbon pricing signals to guide investments, green financial support, and the emission-reduction effects of fiscal policies.
4.2.2 Analysis of energy consumption factors
Different industries exhibit distinct patterns of emission characteristics and carbon energy consumption. The industrial sector, particularly heavy industries like cement and steel production, serves as a major energy consumer. These energy-intensive industries rely heavily on coal and other fossil fuels for production activities, resulting in massive carbon emissions. In contrast, service-oriented industries—characterized by asset-light operations and lower energy demands—demonstrate significantly smaller energy consumption and correspondingly reduced carbon emission scales. In the YRD region, the contribution rate of energy consumption to carbon emissions has consistently remained positive. By 2022, cumulative contribution rates across the region reached 6.19%, 18.79%, 23.33%, and 24.28% for key jurisdictions. Notably, Shanghai’s cumulative contribution rate (6.19%) was substantially lower than those of Jiangsu, Zhejiang, and Anhui provinces. This disparity underscores Shanghai’s industrial structure, which features a smaller proportion of energy-intensive sectors, thereby achieving relatively lower carbon emission levels despite its energy consumption profile. Furthermore, Shanghai’s service-oriented development paradigm has substantially reduced energy dependence while generating a price premium effect through its low-carbon technologies.
In this study, ΔCO2/Energy exhibits the impact of low-carbon transitions in energy consumption on carbon emissions, primarily examining structural shifts in energy composition. The reduction of energy consumption intensity–driven by industrial restructuring, energy efficiency improvements, clean energy substitution, technological innovation, and policy-market synergies–constitutes a pivotal factor in advancing regional low-carbon development and achieving economic-environmental coordination. Decomposition results reveal that the contribution rate of energy carbon intensity to emissions fluctuated between positive and negative values, yet exhibited an overall increasing trend. By 2022, cumulative contribution rates reached 0.74%, −1.71%, −13.9%, and −2.15% respectively, indicating progressively enhanced emission suppression effects. Notably, Zhejiang Province demonstrated significantly stronger inhibitory impacts than other regions during its 13th Five-Year Plan period (2016–2020), attributable to its leadership in establishing a Clean Energy Demonstration Zone and deepening market-oriented energy resource allocation reforms. These institutional innovations accelerated structural decarbonization, aligning with empirical achievements in energy transition governance.
4.2.3 Analysis of population scale factors
Population growth exerts a statistically significant influence on carbon emission increases in the YRD region. Despite a declining annual population growth rate, the region’s large demographic has sustained an average net annual increase of 2.02 million people. By 2022, the population totals for key jurisdictions reached 24.75 million, 85.15 million, 65.77 million, and 61.27 million respectively. This expansion intensifies demand for energy, transportation, and essential goods, directly driving carbon emission growth. During 2008–2022, population growth rates across the region were recorded at 33.2%, 11.75%, 30.0%, and 0.1%, corresponding to cumulative contribution rates of 9.9%, 3.7%, 8.7%, and 0.1% to emission increases. These metrics highlight the dual pressure of demographic inertia and consumption-driven emission pathways in urbanizing economies. The significant impact of population growth on carbon emissions in the Yangtze River Delta region is fundamentally attributed to the co-effect of the scale effect, disparities in structural transition, and technological mitigation capacity.
Regarding ΔCO2/Population, the decomposition results are similar across the four regions, with an overall negative contribution rate, indicating a suppressive effect. This outcome arises from two factors: first, per capita output scale is a relative metric, and its corresponding carbonization from two absolute metrics is difficult to synchronize; second, per capita output scale acts on correlated indicators through the GDIM formula, but when calculating the impact on carbon emission changes in growth poles, only a portion of it is accounted for, with the remainder allocated to correlated indicators. Both scenarios may lead to a suppressive effect of per capita output scale, while also implying that the welfare benefits derived from development lag behind the economic growth of the poles. The contribution rate of per capita carbon emissions to overall carbon emissions is primarily reflected in factors such as population urbanization and consumption patterns. The total carbon emissions in the entire Yangtze River Delta region have remained stable for many consecutive years, with its low-carbon transition leading the nation. Additionally, residents predominantly adopt low-carbon lifestyles, which explains why per capita carbon emissions exhibit a suppressive effect on the region’s carbon emissions in the results.
4.3 Analysis of the decoupling effect of carbon emissions
This section reflects the reality of achieving a win-win scenario between development and emission reduction in the YRD region through decoupling indicators, as well as the actual effectiveness of government emission reduction policies. Based on Formula 20, this paper calculates decoupling indicators for the period 2008–2022 and its sub-periods, as shown in Table 2. Figure 3 illustrates the changing trends of decoupling indicators in the YRD region.
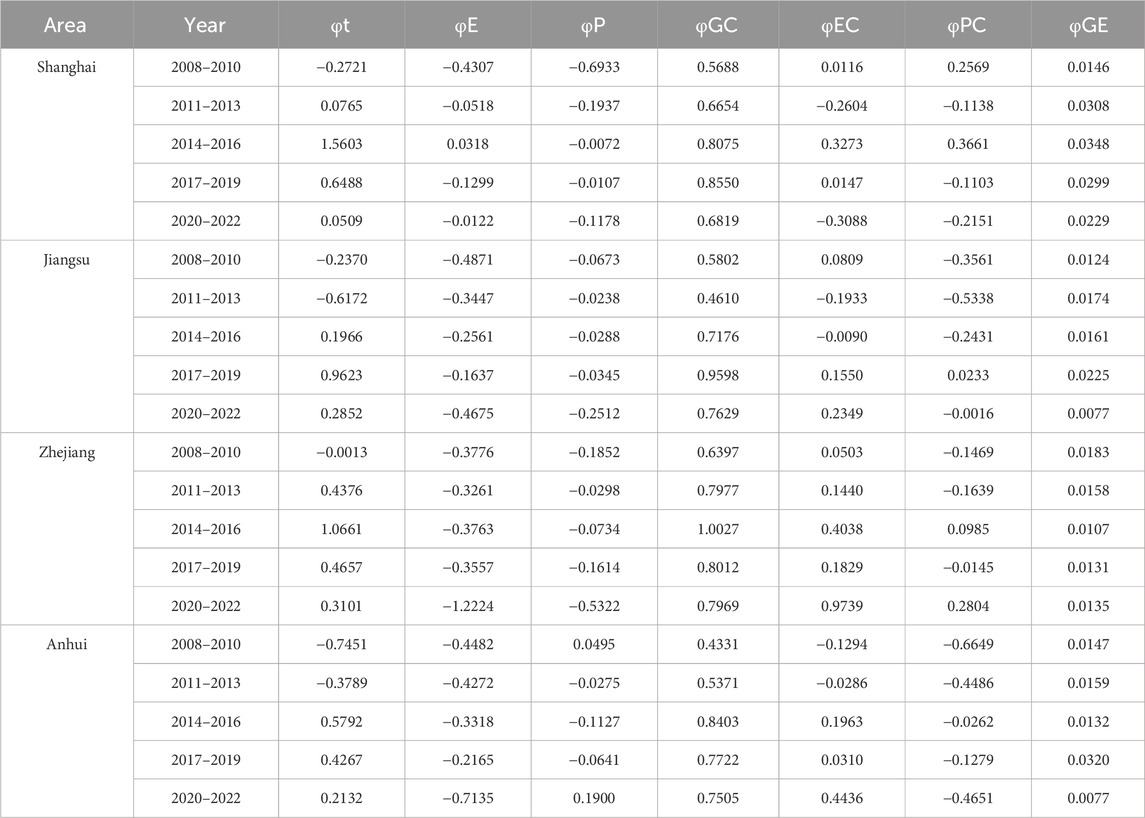
Table 2. Carbon emission decoupling effect in the Yangtze River Delta region.
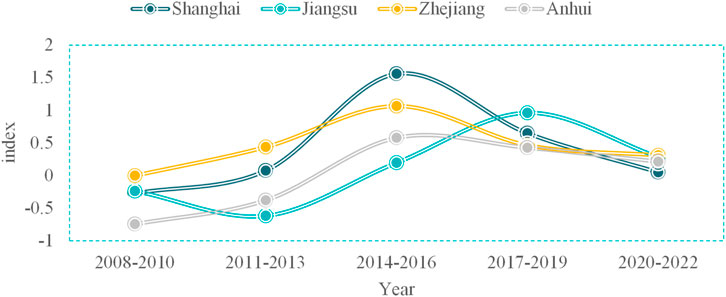
Figure 3. Evolution trend of decoupling effects of carbon emissions in the Yangtze River Delta Region.
As shown in Table 2 and Figure 3, during the entire study period from 2008 to 2022, most decoupling indicator values in the YRD region were positive, indicating the presence of a decoupling effect. This suggests that the region’s decoupling efforts partially offset the carbon emission increase driven by economic growth. This signifies that relevant regions and departments have worked hand in hand, adhering to joint efforts in ecological conservation and coordinated governance, achieving significant results in strengthening environmental protection. By resolutely pursuing a green and low-carbon development path, they have driven high-quality development in the YRD region, with marked and sustained improvements in regional carbon emission reduction. Specifically, the decoupling indicator values for provinces and municipalities in the YRD region generally rose first and then declined. The lowest values occurred during the 2008–2010 period, all negative, indicating no decoupling effect—meaning drivers acted as obstacles in the carbon emission decoupling process. In contrast, the peak values emerged during 2014–2016, with Shanghai’s decoupling indicator reaching 1.5603 and Zhejiang’s at 1.0661, demonstrating a strong decoupling effect. The decoupling indicator values in the YRD region have undergone an evolutionary process from 'negative decoupling’ to 'strong decoupling’ and then to 'weak decoupling’. This trajectory is closely linked to China’s 12th Five-Year Plan, which first incorporated carbon reduction as a binding target and decomposed national goals into regional carbon intensity annual assessments. The results demonstrate significant progress in carbon emission control and industrial green transformation in the YRD region over the past decade.
As shown in Table 2, Shanghai’s decoupling indicator value significantly increased to 1.5603 during 2014–2016, demonstrating a strong decoupling effect. This was primarily driven by the pivotal role of output carbon intensity in facilitating carbon emission decoupling. Concurrently, energy scale, per capita carbon emissions, output carbon intensity, and energy intensity also contributed positively to this process. However, during 2020–2022, its decoupling indicator value declined to 0.0509, primarily due to the inhibitory effects of output carbon intensity, energy scale, and population scale on decoupling. This indicates that Shanghai implemented stronger carbon emission decoupling policies in earlier stages, while the intensity of decoupling efforts relatively weakened in later periods. Specifically, the energy consumption carbon intensity shifted from acting as a catalytic driver. During 2014–2016 to a constraining factor in the carbon emission decoupling process during 2020–2022. This reversal stemmed from Shanghai’s pandemic-induced energy structure adjustments, which triggered increased carbon emissions and impeded decoupling progress. Notably, the catalytic role of energy intensity in carbon emission decoupling has remained relatively stable over the past decade, with its contribution rate persisting within the range of 0.2–0.35 from 2011 to 2013 to 2020–2022. This suggests that since 2010, Shanghai’s industrial structure optimization and energy technology innovation have reached a stabilized phase, enabling consistent improvements in energy utilization efficiency.
In five sub-periods, the decoupling indicator values for Jiangsu Province were −0.2370, −0.6172, 0.1966, 0.9623, and 0.2852, respectively, oscillating between weak decoupling and negative decoupling states. The overall trend exhibited an initial increase followed by a decline, indicating a gradual improvement in the decoupling relationship between economic growth and carbon emissions in Jiangsu Province. From the perspective of decoupling indicator values across various factors, output carbon intensity plays a pivotal role in driving the decoupling process of carbon emissions. Concurrently, energy intensity has also actively contributed to advancing decoupling dynamics. Notably, compared to the 2011–2013 period, the contribution rate of energy consumption carbon intensity increased by 0.4283 during 2020–2022, underscoring its untapped potential for decoupling. Future decarbonization efforts should prioritize optimizing energy consumption carbon intensity by accelerating renewable energy adoption, leveraging recent policy innovations, and reducing structural dependence on traditional fossil fuels.
The decoupling indicator value for Zhejiang Province rose from −0.0013 in 2008–2010 to 1.0661 in 2014–2016, then gradually declined to 0.3101 in 2020–2022, reflecting an initial strengthening followed by a weakening of the decoupling effect. This trajectory was primarily driven by shifts in energy scale and output carbon intensity. While the energy scale decoupling indicator remained stable during 2008–2019, it surged from −0.3557 to −1.2224 in 2020–2022, indicating a significantly intensified inhibitory effect on carbon decoupling during the pandemic. These dynamics underscore Zhejiang’s evolving progress in advancing energy conservation and emission reduction policies alongside structural adjustments in its energy mix. While coal’s share in energy consumption has gradually declined, it remains dominant, with absolute consumption continuing to grow substantially. Analysis of decoupling indicators reveals that both output carbon intensity and energy consumption carbon intensity exhibit positive values, indicating their pivotal roles in driving carbon emission decoupling. In contrast, per capita carbon emissions and energy intensity show relatively minor contributions to decoupling, with their average contribution rates below 4%-a trend consistent across provinces including Zhejiang. Consequently, future decarbonization strategies should prioritize unlocking energy intensity’s latent decoupling potential through structural optimization and technological innovation to achieve strong decoupling effects.
In Anhui Province, the decoupling relationship between economic growth and carbon emissions exhibited negative decoupling during the 2008–2013 period, shifting to weak decoupling from 2014 to 2022. During the weak decoupling phase, output carbon intensity, energy intensity, and energy consumption carbon intensity collectively played pivotal roles in advancing carbon emission decoupling, with their positive contributions effectively driving emission reductions. Conversely, in the negative decoupling phase, per capita carbon emissions and energy scale exerted dominant influence, significantly inhibiting decoupling progress due to their amplified carbon lock-in effects. Notably, during the negative decoupling phase, energy consumption carbon intensity was predominantly leveraged to expand production scale for economic growth, while investments in carbon abatement technologies remained inadequate. This phenomenon reflects the persistence of extensive economic growth patterns in Anhui Province, which have yet to undergo substantial optimization. Despite supplementary emission reduction policies, these efforts failed to counteract carbon emission increments driven by economic expansion, resulting in ineffective decoupling outcomes. To achieve robust decoupling, Anhui must prioritize three strategic shifts: scaling up R&D investments in carbon capture, utilization, and storage technologies; transitioning toward intensive growth models characterized by smart manufacturing and digital energy management systems; and capitalizing on the 'collaborative governance framework’ for ecological conservation and industrial transformation. These measures should be reinforced by implementing sectoral carbon budgets and enhancing the provincial carbon pricing mechanism to align with China’s 'Dual Carbon’ policy imperatives.
4.4 Comparative discussion
This study, employing GDIM decomposition, reveals that economic scale factors persistently constitute the primary driver of carbon emission increases in the Yangtze River Delta region, with energy consumption factors also contributing significantly. Output carbon intensity and per capita output scale prove critical in mitigating carbon emissions, aligning with Conclusion from Zhu (Zhu et al., 2025). However, a divergence emerges as Conclusion Zhu posits that per capita output scale exerts a relatively weaker influence on volatile organic compounds (VOCs) emission changes. This discrepancy stems from Conclusion Zhu’s predominant focus on VOCs emissions, which are distinct from the carbon emissions central to this analysis.
The decoupling indicators reveal that output carbon intensity is identified as the key factor facilitating carbon emission decoupling, whereas energy scale constitutes the primary barrier to achieving decoupling. The Yangtze River Delta region exhibits a progression from weak to strong and back to weak decoupling. These findings broadly align with Study (Shen et al., 2024) Shen’s conclusions. Notably, Shen emphasizes that investment-driven carbon reduction better promotes decoupling effects, likely attributable to its exclusive focus on decomposing driving factors within China’s industrial carbon emissions—a contextual disparity from this regional analysis. Additionally, Shen reports an overall decoupling trajectory of “no decoupling–strong decoupling–no decoupling,” diverging from the pattern observed here. This discrepancy likely stems from the Yangtze River Delta’s status as a more developed region, which had already attained weak decoupling in the early 2000s.
5 Conclusion and suggestions
5.1 Conclusion
There are significant differences in the influence of various driving factors on carbon emissions in the YRD region. From 2008 to 2022, the economic scale factor has always been the main factor driving the increase in carbon emissions in the YRD region, followed by the contribution of energy consumption factors. At the same time, the population size has also continuously promoted the increase in carbon emissions in the YRD region, but its contribution is relatively small. Energy scale is also a vital factor promoting the increase in carbon emissions in Jiangsu, Zhejiang, and Anhui. Especially in Zhejiang Province from 2020 to 2022, the energy scale even surpassed the economic scale to become the largest factor promoting the increase in carbon emissions. Among the factors promoting the reduction of carbon emissions, output carbon intensity and per capita output scale have always played a key role, and the contribution of per capita output scale to promoting the reduction is particularly significant from 2008 to 2022; the carbon intensity of energy consumption has a relatively prominent contribution to promoting the reduction only in Shanghai and Zhejiang; however, energy intensity has always played a role in promoting the reduction in the entire Yangtze River Delta region. In addition, carbon emissions per capita have both promoting and reducing effects on the YRD region.
Regarding the overall period from 2008 to 2022 and its five sub - stages, most of the decoupling index values in the YRD region are positive, that is, there is a decoupling effect. In the five sub - stages, the decoupling effect in the YRD region has experienced a process of “weak decoupling - strong decoupling - weak decoupling”, indicating that the decoupling intensity is relatively large in the medium term but weakened in the later stage; the decoupling index in Zhejiang Province has always been positive and has the smallest change range, reflecting that Zhejiang is at the leading level in carbon emission governance; the change range of the decoupling effect in Shanghai is large and the decoupling degree has gradually decreased since 2016; the decoupling index values in Jiangsu are all lower than the minimum value required to achieve a strong decoupling effect, showing negative decoupling and weak decoupling effects; in contrast, the decoupling effect in Anhui is relatively small. It showed a negative decoupling effect in the first two stages and a weak decoupling effect from 2014 to 2022 and is an area that requires key attention for future carbon emission reduction in the YRD region. From the perspective of the decoupling index values of various factors, output carbon intensity is the key factor promoting carbon emission decoupling, and energy scale is the main factor inhibiting the achievement of decoupling. Among other factors, the carbon intensity of energy consumption, carbon emissions per capita, and energy intensity have a promoting effect on carbon emission decoupling, while population size has an inhibiting effect on carbon emission decoupling.
5.2 Policy recommendations
1. The heterogeneity in carbon emission decoupling effects across the Yangtze River Delta region presents a critical opportunity for advancing synergistic macro-level governance. Research reveals significant disparities in decoupling performance among key economic hubs. For instance, Zhejiang Province and Shanghai Municipality consistently demonstrate robust decoupling outcomes, achieving exhibits weaker decoupling dynamics, failing to attain decoupling status between 2008 and 2013. Policy formulation must thus adopt differentiated approaches: Zhejiang and Shanghai require intensified support to sustain and stabilize their trajectory toward strong decoupling, while Anhui emerges as a priority zone for targeted intervention, necessitating region-specific policies to catalyze effective emission decoupling. Under the framework of integrated governance in the lower Yangtze River Basin, policies must account for provincial realities and developmental needs. By strategically aligning industrial layouts with regional strengths and shortcomings in decoupling capabilities, policymakers can ensure the efficacy and applicability of coordinated carbon reduction strategies.
2. Scale up support for low-carbon technology research, development, and application to facilitate a coordinated green and low-carbon transition across the Yangtze River Delta region. Research findings indicate a consistent decline in the output carbon intensity across the Yangtze River Delta (YRD) region from 2008 to 2022, reflecting the impact of low-carbon advancements in economic development on carbon emissions. This trend underscores technological progress as the decisive factor in addressing carbon emissions. Consequently, it is imperative to adhere to the principle of synergistic governance within the YRD, leveraging the comparative advantages of provincial technological capabilities to fully harness the carbon-reduction effects of technological innovation. To achieve this, a dual-path approach is essential: Establishing an “industry-university-research-application” integrated green low-carbon technology innovation consortium. By consolidating cross-regional innovation resources, this model accelerates the transition of low-carbon technologies from R&D to scaled deployment, addressing fragmentation in resource allocation and inefficiencies in commercialization. Developing regional-synergistic near-zero carbon demonstration clusters. Through standardized, cross-administrative low-carbon pilot zones, this initiative resolves efficiency losses caused by fragmented governance, enabling dual-driven advancement of technology diffusion and policy coordination.
3. Continuous optimization of the energy structure and reduction of energy carbon intensity constitute pivotal measures for achieving carbon emission reduction and decoupling in the Yangtze River Delta Basin. Research findings reveal that energy scale andoutput scaleremain critical drivers of carbon emission growth and barriers to decoupling effects, with particularly pronounced impacts in Zhejiang and Anhui provinces. Nevertheless, the persistent dominance of secondary industries across Jiangsu, Zhejiang, and Anhui—coupled with high energy intensity during industrialization—inevitably links economic expansion to rising energy consumption and carbon emissions. Consequently, to advance regional decarbonization and decoupling, targeted strategies must address core challenges of energy scale expansionand high-carbon industrial structures, accounting for provincial resource endowments and developmental disparities. Provincial-specific clean energy development must be accelerated: Jiangsu should leverage the comparative advantage of its photovoltaic industry chain to expand hydrogen energy application scenarios, while Anhui can harness the geographical potential of southern Anhui’s mountainous terrain to advance pumped hydro storage projects, concurrently establishing the Yangtze River Delta Green Energy Storage Base. Concurrently, the establishment of a Yangtze River Delta Green Power Trading Center should be prioritized to enable inter-provincial renewable energy quota sharing and mutual assistance, alongside deploying digital technologies to enhance resource utilization efficiency through smart grid integration and AI-driven management systems.
This article is committed to decomposing the driving factors of carbon emissions in the YRD region and conducting an in-depth study on the decoupling effect of carbon emissions in this area. However, it acknowledges its own limitations and suggests that further research is necessary to enhance the understanding of this intricate system. Firstly, it has strong data dependency, requiring complete and high - precision multidimensional time - series data. Missing data or outliers can significantly increase result deviation. Secondly, there are issues of computational complexity and subjectivity. The construction of the Jacobian matrix relies on manually defined target functions, and factor selection is easily influenced by prior knowledge. Moreover, high - dimensional operations lead to exponentially increasing computational burdens, making real - time analysis difficult. Thirdly, the linear hypothesis assumption posits a linear additive relationship among factors, failing to capture nonlinear interactions in actual systems and thus underestimating the contributions of complex interactions. Lastly, there is insufficient dynamic adaptability. The model has a lag in responding to exogenous shocks, such as sudden policy changes or technological breakthroughs. It needs to be combined with scenario - simulation models to compensate.
Data availability statement
The original contributions presented in the study are included in the article/supplementary material, further inquiries can be directed to the corresponding authors.
Author contributions
WY: Investigation, Data curation, Software, Conceptualization, Resources, Visualization, Formal Analysis, Writing – review and editing, Writing – original draft, Project administration, Supervision, Validation, Funding acquisition, Methodology. PB: Writing – review and editing, Writing – original draft, Methodology. XY: Writing – original draft, Writing – review and editing, Methodology. YY: Writing – review and editing, Writing – original draft. YJ: Writing – original draft, Project administration, Writing – review and editing. TX: Writing – original draft, Writing – review and editing, Project administration.
Funding
The author(s) declare that no financial support was received for the research and/or publication of this article.
Conflict of interest
Author YJ was employed by Industrial and Commercial Bank of China Limited.
The remaining authors declare that the research was conducted in the absence of any commercial or financial relationships that could be construed as a potential conflict of interest.
Generative AI statement
The author(s) declare that no Generative AI was used in the creation of this manuscript.
Any alternative text (alt text) provided alongside figures in this article has been generated by Frontiers with the support of artificial intelligence and reasonable efforts have been made to ensure accuracy, including review by the authors wherever possible. If you identify any issues, please contact us.
Publisher’s note
All claims expressed in this article are solely those of the authors and do not necessarily represent those of their affiliated organizations, or those of the publisher, the editors and the reviewers. Any product that may be evaluated in this article, or claim that may be made by its manufacturer, is not guaranteed or endorsed by the publisher.
References
Cao, L., Pan, N., Lu, Y., and Su, W. (2024). Digital innovation and urban resilience: lessons from the yangtze river Delta region. J. Knowl. Econ. 15 (4), 19775–19794. doi:10.1007/s13132-024-01932-x
Chen, L., Ma, M., and Xiang, X. (2023). Decarbonizing or illusion? How carbon emissions of commercial building operations change worldwide. Sustain. Cities Soc. 96, 104654. doi:10.1016/j.scs.2023.104654
Cui, L., Wang, J., Chen, X., and Song, M. (2024). Regional policy options for carbon peaking in the yangtze river Delta under uncertainty. J. Environ. Manag. 364, 121445. doi:10.1016/j.jenvman.2024.121445
De Oliveira-De Jesus, P. M. (2019). Effect of generation capacity factors on carbon emission intensity of electricity of Latin America and the Caribbean, a temporal IDA-LMDI analysis. Renew. Sustain. Energy Rev. 101, 516–526. doi:10.1016/j.rser.2018.11.030
Laporte, J. P., Román-Collado, R., and Cansino, J. M. (2024). Key driving forces of energy consumption in a higher education institution using the LMDI approach: the case of the Universidad Autónoma de Chile. Appl. Energy 372, 123797. doi:10.1016/j.apenergy.2024.123797
Li, Y., Chen, H., Yu, P., and Yang, L. (2024). The application and evaluation of the LMDI method in building carbon emissions analysis: a comprehensive review. Buildings 14 (9), 2820. doi:10.3390/buildings14092820
Li, X., Wu, J., and Lin, C. (2025). Decarbonizing provincial construction industry under the “‘dual carbon’” goals: assessing reduction capacities and charting optimal pathways. Build. Environ. 272, 112639. doi:10.1016/j.buildenv.2025.112639
Li, J., Ma, Z., Sun, H., and Chen, W. (2023). Driving factor analysis and dynamic forecast of industrial carbon emissions in resource-dependent cities: a case study of ordos, China. Environ. Sci. Pollut. Res. 30 (40), 92146–92161. doi:10.1007/s11356-023-28872-4
Li, W., Wen, H., and Nie, P. (2023). Prediction of China’s industrial carbon peak: based on GDIM-MC model and LSTM-NN model. Energy Strategy Rev. 50, 101240. doi:10.1016/j.esr.2023.101240
Liu, J., Yang, Q., Ou, S., and Liu, J. (2022). Factor decomposition and the decoupling effect of carbon emissions in China’s manufacturing high-emission subsectors. Energy 248, 123568. doi:10.1016/j.energy.2022.123568
Liu, Y., Gan, L., Cai, W., and Li, R. (2024). Decomposition and decoupling analysis of carbon emissions in China’s construction industry using the generalized divisia index method. Environ. Impact Assess. Rev. 104, 107321. doi:10.1016/j.eiar.2023.107321
Ma, P., Liu, H., and Zhang, X. (2025). A study on the decoupling effect and driving factors of industrial carbon emissions in the beibu gulf city cluster of China. Sustainability 17 (9), 3993. doi:10.3390/su17093993
Magazzino, C., Pakrooh, P., and Abedin, M. Z. (2023). A decomposition and decoupling analysis for carbon dioxide emissions: evidence from OECD countries. Environ. Dev. Sustain. 26 (11), 28539–28566. doi:10.1007/s10668-023-03824-7
Moreau, V., Neves, C. A. D. O., and Vuille, F. (2019). Is decoupling a red herring? The role of structural effects and energy policies in Europe. Energy Policy 128, 243–252. doi:10.1016/j.enpol.2018.12.028
Shao, S., Liu, J., Geng, Y., Miao, Z., and Yang, Y. (2016). Uncovering driving factors of carbon emissions from China’s mining sector. Appl. Energy 166, 220–238. doi:10.1016/j.apenergy.2016.01.047
Shen, C., Zhang, J., Pang, J., and Xu, H. (2024). Study on industrial carbon emissions in China based on GDIM decomposition method and two decoupling effects. Environ. Sci. Pollut. Res. 31 (10), 15648–15670. doi:10.1007/s11356-024-32055-0
Su, B., and Ang, B. W. (2023). Structural decomposition analysis applied to energy and emissions: frameworks for monthly data. Energy Econ. 126, 106977. doi:10.1016/j.eneco.2023.106977
Tang, X., and Wang, J. (2025). Deep reinforcement learning-based multi-objective optimization for virtual power plants and smart grids: maximizing renewable energy integration and grid efficiency. Processes 13, 1809. doi:10.3390/pr13061809
Tang, X., Hao, G., Wang, Y., Wan, Y., Wang, J., Luo, Y., et al. (2024a). Synergistic development pathways: an exploratory study on the urban–rural mutual assistance model and low-carbon transformation of henan’s power supply industry towards dual-carbon goals. Energies 17 (24), 6497. doi:10.3390/en17246497
Tang, X., Liu, S., Wang, Y., and Wan, Y. (2024b). Study on carbon emission reduction countermeasures based on carbon emission influencing factors and trends. Environ. Sci. Pollut. Res. 31 (9), 14003–14022. doi:10.1007/s11356-024-31962-6
Tapio, P. (2005). Towards a theory of decoupling: degrees of decoupling in the EU and the case of road traffic in Finland between 1970 and 2001. Transp. Policy 12 (2), 137–151. doi:10.1016/j.tranpol.2005.01.001
Tian, L., Chai, J., Zhang, X., and Pan, Y. (2024). Spatiotemporal evolution and driving factors of China’s carbon footprint pressure: based on vegetation carbon sequestration and LMDI decomposition. Energy 310, 133299. doi:10.1016/j.energy.2024.133299
Vaninsky, A. (2014). Factorial decomposition of CO2 emissions: a generalized divisia index approach. Energy Econ. 45, 389–400. doi:10.1016/j.eneco.2014.07.008
Wang, Q., and Wang, S. (2019). Decoupling economic growth from carbon emissions growth in the United States: the role of research and development. J. Clean. Prod. 234, 702–713. doi:10.1016/j.jclepro.2019.06.174
Wang, Y., and Zhen, J. (2024). Drivers and strategic options for renewable energy development in China: LMDI-Elasticity analysis perspective based on photovoltaic and wind energy. Energy 309, 133078. doi:10.1016/j.energy.2024.133078
Wang, Y., Xie, T., and Yang, S. (2017). Carbon emission and its decoupling research of transportation in Jiangsu Province. J. Clean. Prod. 142, 907–914. doi:10.1016/j.jclepro.2016.09.052
Wang, Y., Huang, Y., Bai, H., Wang, G., Hu, X., Kumar, S., et al. (2021). Biocompatible and biodegradable polymer optical fiber for biomedical application: a review. Biosensors 11 (12), 472. doi:10.3390/bios11120472
Wen, H., Chen, Z., Yang, Q., Liu, J., and Nie, P. (2022). Driving forces and mitigating strategies of CO2 emissions in China: a decomposition analysis based on 38 industrial sub-sectors. Energy 245, 123262. doi:10.1016/j.energy.2022.123262
Ye, F.-F., You, R., Yang, L.-H., Lu, H., and Xie, H. (2025). A novel data-driven rule-base approach with driving factor decomposition for multi-scenario prediction on carbon emission reduction. Comput. and Industrial Eng. 206, 111217. doi:10.1016/j.cie.2025.111217
Zha, D., Yang, G., and Wang, Q. (2019). Investigating the driving factors of regional CO2 emissions in China using the IDA-PDA-MMI method. Energy Econ. 84, 104521. doi:10.1016/j.eneco.2019.104521
Zhang, N., Lv, L., Zhao, M., Xiang, M., Bai, Z., and Luo, H. (2022). A comparative study of stage characteristics and factorial decomposition of CO2 emissions between China and the USA. Environ. Sci. Pollut. Res. 29 (32), 48769–48783. doi:10.1007/s11356-022-18811-0
Zhang, X., Fan, M., Shao, S., Song, X., and Wang, H. (2023). Socioeconomic drivers and mitigating strategies of volatile organic compounds emissions in China’s industrial sector. Environ. Impact Assess. Rev. 101, 107102. doi:10.1016/j.eiar.2023.107102
Zhou, Z., Jiang, P., and Chen, S. (2025). Decomposition of carbon emission drivers and carbon peak forecast for three major urban agglomerations in the yangtze river economic belt. Sustainability 17 (6), 2689. doi:10.3390/su17062689
Zhu, S., Zhou, T., Qiu, X., Zhang, X., and Geng, Y. (2024). Uncovering socio-economic driving forces of volatile organic compounds emissions in the beijing-tianjin-hebei region of China. Environ. Impact Assess. Rev. 109, 107638. doi:10.1016/j.eiar.2024.107638
Keywords: carbon emissions, Yangtze River Delta, generalized divisia index method (GDIM), decoupling effects, driving factors
Citation: Youwei W, Binhui P, Yaru X, Yan Y, Jiajia Y and Xinfa T (2025) Decoupling effect of carbon emissions in the Yangtze River Delta region based on GDIM factor decomposition. Front. Environ. Sci. 13:1622372. doi: 10.3389/fenvs.2025.1622372
Received: 03 May 2025; Accepted: 09 September 2025;
Published: 19 September 2025.
Edited by:
Katundu Imasiku, Georgia Institute of Technology, United StatesReviewed by:
Cong Chen, University of Science and Technology Beijing, ChinaYaqi Wu, North Minzu University, China
Copyright © 2025 Youwei, Binhui, Yaru, Yan, Jiajia and Xinfa. This is an open-access article distributed under the terms of the Creative Commons Attribution License (CC BY). The use, distribution or reproduction in other forums is permitted, provided the original author(s) and the copyright owner(s) are credited and that the original publication in this journal is cited, in accordance with accepted academic practice. No use, distribution or reproduction is permitted which does not comply with these terms.
*Correspondence: Wan Youwei, d2h5dXZAMTYzLmNvbQ==; Tang Xinfa, eGluZmF0YW5nQHNpbmEuY29t