 Caterina Cacciatori1,2*
 Giulio Mariani1Sara Comero1
 Enock Kiminta3
 Anham Salyani4Jackie Myers2
 Vincent Pettigrove2Bernd Manfred Gawlik1
- 1European Commission, Joint Research Centre (JRC), Ispra, Italy
- 2Aquatic Environmental Stress Research Group (AQUEST), RMIT University, Bundoora, VIC, Australia
- 3Kenya National Water Resource Users Association (KeNAWRUA), Nairobi, Kenya
- 4World Water Quality Alliance, Nairobi, Kenya
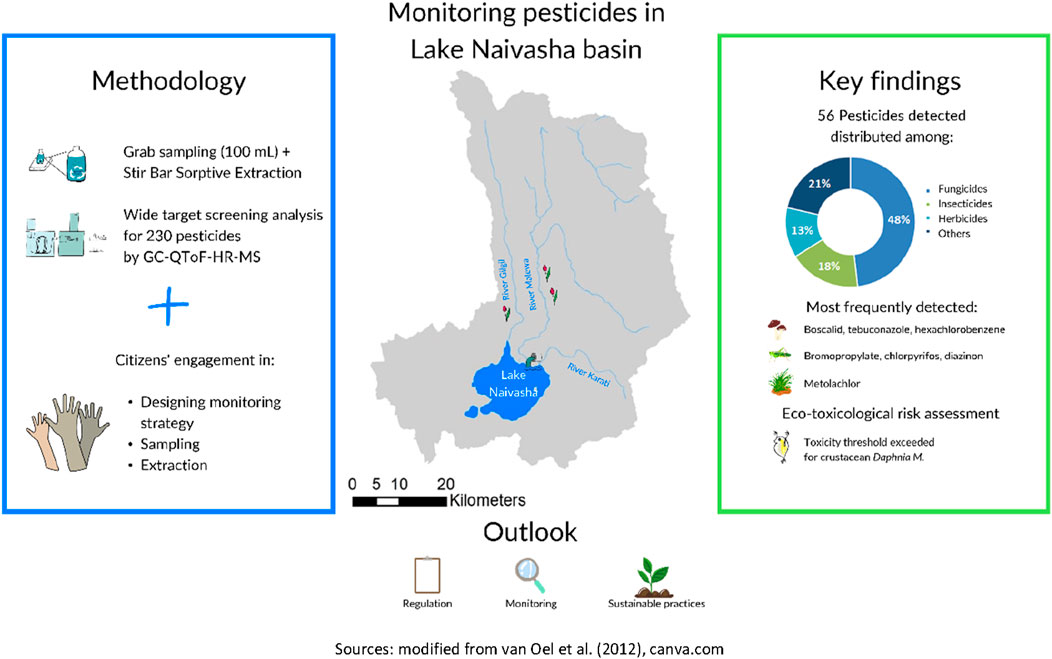
The presence of pesticides in surface water samples from the Lake Naivasha catchment area in Kenya was investigated using Stir Bar Sorptive Extraction (SBSE) and Gas Chromatograph with Quadruple Time-Of-Flight High Resolution Mass Spectrometry (GC-QToF-HRMS). A total of 56 pesticides were detected, belonging to different classes including fungicides (48.2%), insecticides (17.9%), herbicides (12.5%), and other categories. The most frequently detected pesticides were the fungicides boscalid, fluopyram, hexachlorobenzene, tebuconazole, herbicide metolachlor, and insecticides bromopropylate, chlorpyrifos, diazinon, and the synergist piperonyl butoxide. The site with the highest pesticides detections was adjacent to Lake Naivasha, near a wastewater treatment plant discharge. Toxicological risk assessments revealed that the acute toxic unit threshold for crustaceans (TU = 0.01) was exceeded in several samples, primarily due to the presence of chlorpyrifos and diazinon. Notably, chlorpyrifos, banned for all agricultural purposes in Kenya in 2024, was detected in several samples. These findings highlight the presence of pesticides in Kenyan water bodies, posing potential risks to aquatic ecosystems and underscore a need for stricter regulation, ongoing monitoring, and the adoption of sustainable agricultural practices to minimise the impact of pesticides on the environment.
Highlights
• In the Lake Naivasha catchment, Kenya, 56 out of 230 pesticides screened were detected.
• Fungicides represented the most frequently detected pesticide class, accounting for 48.2% of all detected pesticides.
• Atrazine (herbicide), fluopyram and tebuconazole (fungicides), were found in the highest frequencies and concentrations.
• The study emphasizes the importance of comprehensive pesticides screening and the integration of citizen science to enhance water quality monitoring efforts.
1 Introduction
The expansion of agricultural activities in Kenya over the past 3 decades has led to a significant increase in the import and consumption of pesticides. With over 40% of the Kenyan population employed in farming (Kenya National Bureau of Statistics, 2020), the demand for pesticides soared, increasing from 6,400 tonnes in 2015 to 15,600 tonnes in 2019 (Tostado et al., 2022). This trend mirrors the global increase in pesticide use, driven by intensified agricultural production and the ever-growing demand for food (Tilman et al., 2011).
The environmental impacts of pesticide use are far-reaching, contributing to biodiversity loss, soil and sediment absorption, and groundwater contamination (Onyango et al., 2024). Studies have confirmed the presence of pesticide residues in Kenyan water bodies, including Lake Naivasha (Abbasi and Mannaerts, 2019; Okonji et al., 2023; Onyango et al., 2024; Otieno et al., 2012). Onyango et al. (2014) reported that 59% of pesticides applied in the Lake Naivasha catchment, an area that has experienced significant agricultural intensification between 1989 and 2019, are rated as moderately to extremely toxic. Furthermore, 22% of the pesticides applied around Lake Naivasha are on international concern lists due to their toxicity to humans and non-target organisms and their persistence in the environment (Onyango et al., 2014). In Lake Naivasha, chlorpyrifos ethyl has been detected in concentrations ranging from 4.3 ng/L in the dry season to 25.7 ng/L in the wet season (Otieno et al., 2012). The absence of diazinon and carbofuran, despite their extensive use, suggests the need for more sensitive monitoring strategies. To address this, Abbasi and Mannaerts (2019) employed passive samplers in Lake Naivasha catchment, capturing continuous contamination data over a month. They estimated the total concentration of detected organochlorine pesticides to reach a maximum of 81 ng/L at the lake site. The presence of organochlorines has also been reported in samples from 2015 (Onyango et al., 2024). While these studies are crucial for understanding contamination in the Lake Naivasha catchment, the screens are limited to a few legacy pesticides and do not account for any new products in use.
The need for comprehensive monitoring and assessment of pesticides pollution in water bodies has become increasingly pressing. Recent studies highlight the importance of moving beyond traditional target screening approaches, which focus on a limited set of pesticides, and expanding data collection to include alternative sources, such as earth observation, modelling and citizen science. Citizen science initiatives provide a valuable complement, engaging local communities in water quality monitoring and expanding existing networks (Earthwatch Institute, 2024).
While Kenya has a relatively robust governmental data collection system, citizen science data remain scarce (Earthwatch Institute, 2024). Successful collaborations such as those between Kenya and Tanzania, demonstrate the potential for collective participatory monitoring of transboundary water resources, exemplified by the World Water Quality Alliance (WWQA) supported Mara River basin initiative (Earthwatch Institute, 2024). However, without government backing or other source of financial sustainability, these initiatives face financial constraints, limited participation, and scaling challenges. Despite these challenges, community involvement has been instrumental in raising environmental awareness and enhancing conservation initiatives (Richards and Syallow, 2018).
In Kenya, Water Resources Users Associations (WRUAs) facilitate participation and local co-management of water resources, effectively engaging hard-to-reach groups, such as women, youth, and marginalised communities (Buytaert et al., 2016). However, citizen science experiences in Kenya have primarily focused on monitoring general physico-chemicals parameters such as pH, water temperature, dissolved oxygen, turbidity, nutrients and conductivity. This study is the first in Kenya to utilise citizen science for assessing pesticide contamination in surface waters.
The European Commission Joint Research Centre (EC-JRC), in collaboration with the United Nations Environment Programme’s (UNEP) Global Environment Monitoring System for Freshwater and the UNEP convened WWQA, has launched “The Gems of Water” citizens’ engagement initiative. Aiming to integrate citizen science with advanced wide-screening technology to monitor water quality, this initiative selected Kenya as a pilot study due to its conducive environment for citizen science and the need for pesticide monitoring in its expanding agricultural sector.
This paper presents the findings of a monitoring campaign conducted in partnership with the Kenya National Water Resource Users Association (KeNAWRUA) in the Lake Naivasha catchment. This area holds significant environmental, social and economic value, characterised by high biodiversity and providing water for domestic, irrigation, and industrial purposes (Omondi et al., 2018). It is also a main hub for horticultural and floricultural fields, contributing to 70% of Kenya’s cut-flower exports (Otiang’a-Owiti and Oswe, 2007).
The study employed Stir Bar Sorptive Extraction (SBSE) to extract contaminants from grab-water samples collected from four different influents to Lake Naivasha and within the lake itself. SBSE is a proven method for detecting pesticide residues in surface waters (Campanale et al., 2021), and has been successfully applied for citizen science initiatives as part of “The Gems of Water” in other countries (Cacciatori et al., 2024; Cacciatori et al., 2025). In addition to the monitoring campaign, toxicological risk assessments were conducted, to better understand the potential hazards linked to measured concentrations, and to guide development of effective management strategies to mitigate these risks.
This study presents an assessment of pesticide contamination in the northern part of Lake Naivasha. Data on pesticide occurrence were obtained by piloting a novel citizen science approach that combines local engagement and advanced screening techniques. Unlike traditional monitoring conducted by the authorities, citizens engagement involves local stakeholders in the sampling and extraction process, increases spatial and temporal coverage, while empowering community’s understanding of their environment and water resources. The initiative demonstrates the potential of citizen science to enhance monitoring capacity and prioritise chemicals for monitoring or further restriction. Finally, the study also includes a toxicological risk assessment to identify potential environmental risks associated with pesticides contamination.
2 Materials and methods
2.1 “The Gems of Water” citizens engagement activity
The “Gems of Water” citizen engagement workflow, outlined in Cacciatori et al. (2024) and further developed in Cacciatori et al. (2025), describes the involvement of citizens for monitoring water quality in various locations around the world. By following simplified sample and extraction protocols and using equipment provided by the Joint Research Centre (JRC) of the European Commission, citizens implement the SBSE technique to water samples they collect (Cacciatori et al., 2023). Participating in this initiative, local groups identify areas of water quality concern, mainly nearby intensive agricultural activities, and monitor surface waters for up to 230 pesticides. The stir bars are then sent back and analysed at the JRC, where Gas Chromatograph with Quadruple Time-Of-Flight High Resolution Mass Spectrometry (GC-QToF-HRMS) is used for analysis and quantification of detected compounds. In Kenya, the involvement of local citizens happened thanks to a contact in KeNAWRUA, who operates in the area of Lake Naivasha. A total of four citizens have been engaged in the collection and extraction of water samples.
2.2 Study area
Sampling was carried out in the Lake Naivasha catchment, located in the central Rift Valley Region of Kenya, just north-west of the capital Nairobi (Figure 1). Samples were collected from four rivers, the Gilgil, Malewa, Karati and Maraigushu, and from within Lake Naivasha. The Gilgil and Malewa Rivers are perennial inflows to the lake, while the Karati and Maraigushu Rivers flow intermittently (Ramsar Sites Information Service, 2024). GPS coordinates for the sampling sites are provided in Supplementary Table S1. Sample were collected from one location in each of river (G, M-1, K, M-2) and from three locations within Lake Naivasha (N-a, N-b, N-c), with N-b situated at the outlet of a wastewater treatment plant. The lake, rich in biodiversity, serves as the primary water provision for surrounding communities in a region otherwise scarce in water. Regarding land-use, the upper catchment supports small-holder farms growing maize, beans and vegetables. The middle catchment includes both agricultural and large-scale livestock farming, while the lower catchment is dominated by floriculture (Onyango et al., 2024).
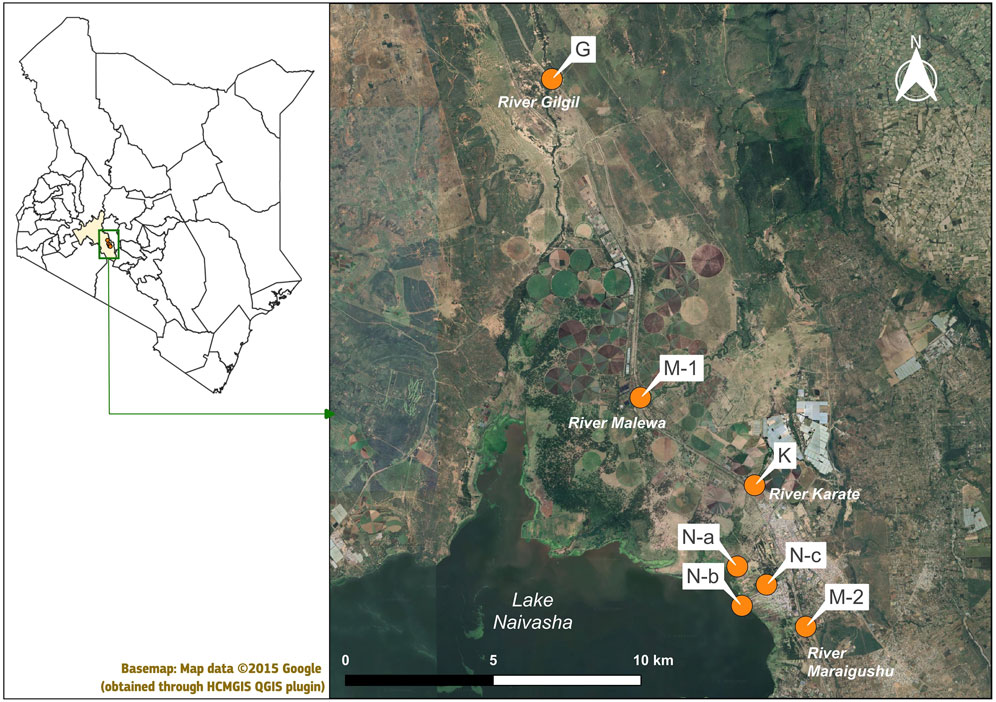
Figure 1. Map of sampling locations in the catchment of Lake Naivasha.
2.3 Materials
Stir bars (2 mm × 0.5 mm, PDMS coating) were provided by Gerstel (Germany). Before use, stir bars were conditioned at the JRC Water Laboratory (300 °C for 6 h) under nitrogen flow using a tube conditioner (Gerstel, Germany). Two field blank stir bars were used to assess potential contamination during transport and extraction. The method screened 230 pesticides (Supplementary Table S2). Native standard solutions for the calibration curves were purchased from Restek GC Multiresidue Pesticide Standard Kit 32562 (Pennsylvania, United States) and internal standard solution 13C12-labelled trans-Nonachlor was purchased from Cambridge Isotope Laboratories Inc. (Massachusetts, United States).
2.4 Sample collection and extraction
Seven grab surface water samples (100 mL) were collected in amber glass bottles on the 20 and 24 October 2023 by citizen scientists involved through KeNAWRUAs (Figures 2A,B). The sampling locations were decided through online dialogue with the representative of NaWRUAs, based on his expertise and knowledge of local waterways and surrounding land use. October 2023 reported a rainfall increase compared to previous month, through an onset of short rains. Nevertheless, the timing of sampling was mainly determined by logistical constraints, rather than on rainfall patterns or agricultural cycles. Grab samples were collected using a sampling stick (2 m in length) from an easily accessible location on the bank of the rivers. The extraction procedure using the stir bars, modified based on Lerch et al. (2018) and optimised in Cacciatori et al. (2025), was performed on 23 and 25 October 2023, depending on sampling date. In short, one pre-conditioned stir bar was placed into each amber glass bottle containing 100 mL of site water using a magnetic stick. Before extraction, pre-prepared internal standard solution (13C12-labelled trans-Nonachlor) diluted in acetone (1 mL, 0.5 ng), a final concentration of 5 ng/L. The internal standard solution was delivered ready to use to the groups in ampoules and was added by participants to each water sample using a disposable glass pipette. The internal standard was used as surrogate to assess the recovery of target analytes during sample preparation and extraction. Detailed protocols for sampling and extraction have been shared with participants and can be consulted in Cacciatori et al. (2023).
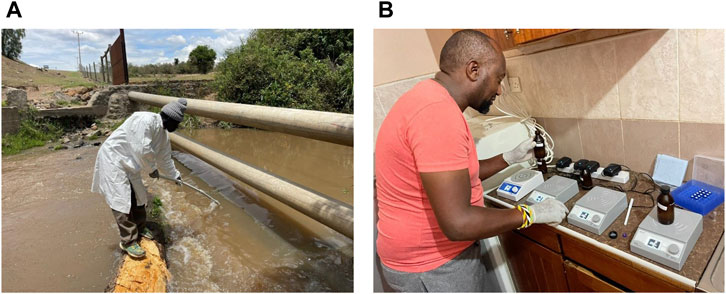
Figure 2. Citizens collecting (A) and extracting (B) samples.
The bottles were placed on a magnetic stirrer plate and left to extract for 5 h at 800 rpm. After extraction, the stir bars were removed from the amber glass bottles using the magnetic stick and placed into separate pre-labelled vials. Vials were shipped back to the JRC Water Laboratory for chemical analysis, using DHL service. The shipment time lasted around a week. Stir bars were found to retain chemicals up to 6 weeks at a maximum temperature of 25 °C based on an isochronous stability study (Cacciatori et al., 2025). The period of 6 weeks was chosen to indicate an estimated maximum shipment time.
2.5 Chemical analysis
At the JRC laboratory, stir bars were dried under a constant stream of nitrogen, desorbed and analysed. The desorbed volume is representative for the whole 100 mL sample; all dissolved compounds that were initially present in the 100 mL samples are recovered and transferred to the analysis system. The analyses were performed using a Gas Chromatograph with Quadruple Time-Of-Flight 7250 (Agilent Technology, United States of America) coupled with a Multi-Purpose Sampler (MPS) connected to a Thermal Desorption Unit (TDU2) and a Cooling Injection System CIS-4 (GERSTEL, Germany). The Multi-Purpose Sampler (MPS) automatically moves the desorption tubes containing the stir bars from the support trays to the TDU, one at time, for desorption. All chemicals were separated and analysed on HP-5MS UI capillary column (length = 30 m, internal diameter = 0.25 mm, film thickness = 0.25 um, Agilent Technology, United States of America). The calibration curve ranged from 10 to 250 ng/L and was quantified using internal standard 13C12-labelled trans-Nonachlor. For compounds detected below 10 ng/L, the calibration range was extended to include lower concentrations. This extension was based on the lowest reliably detectable concentration for each compound, as determined by the instrument’s sensitivity and signal-to-noise ratio. These extended calibration points ensured accurate quantification of low-level detections while maintaining analytical reliability. Limit of Detection (LOD) and Limit of Quantification (LOQ) were estimated using the signal-to-noise ratio method, with LOD and LOQ defined as three and ten times the baseline noise, respectively, following the approach described by Ravisankar et al. (2021). For compound identification, retention time, one quantifier ion, and two qualifier ions were used. The most abundant high-resolution mass ions fragments were used for quantification. Retention time, as well as quantifier and qualifier ions are reported in Supplementary Table S2. Further methodological details are provided in Cacciatori et al. (2025). All instrumental parameters are provided in Supplementary Table S3. Linearity, recovery, reproducibility and stability were examined in Cacciatori et al. (2025). In addition to the screening of known pesticides, suspect screening using MassHunter Pesticides Personal Compound Database and Library (PCDL) library (Agilent Technologies, United States).
2.6 Eco-toxicological risk assessment
The toxicological risk assessment was performed on a subset of the detected pesticides, based on the availability of data as per the IUPAC Pesticide Properties Database (PPDB) (Agriculture and Environment Research Unit AERU, 2018). The toxic effects were assessed as acute risks using toxic units (TU), based on predicted no-effect concentration (PNEC). The assessment was conducted for the crustacean Daphnia magna.
Toxic units were calculated by dividing the measured concentrations for each pesticide by the half-maximal effective concentration (EC50), or the median lethal concentration (LC50) of the detected compounds. Toxic units were summed, assuming concentration addition (EFSA Scientific Committee et al., 2019), to provide information on the cumulative eco-toxicological risks at each sample location. Toxic units >0.01 indicate the presence of risks for D. magna (EFSA Panel on Plant Protection Products and their Residues PPR, 2013).
PNEC was calculated by dividing the EC(LC)50 by a safety assessment factor (AF). The assessment factor was determined based on data availability (Finizio and Vighi, 2014). Supplementary Table S4 provides details of the toxicological data applied (EC(LC)50) for D. magna, the calculated PNEC in µg/L (Agriculture and Environment Research Unit (AERU), 2018) and safety assessment factor (AF) (Finizio and Vighi, 2014) for pesticides for which information was available and eco-toxicological risk assessment was undertaken.
3 Results
3.1 Pesticides occurrence
The complete list of detected pesticides (56) and their detection frequencies are presented in Table 1. The detected compounds belonged to various classes, including fungicides (48.2%), insecticides (17.9%), herbicides (12.5%), and other categories, such as breakdown products and metabolites, present in range of 1.8%–5.4%.
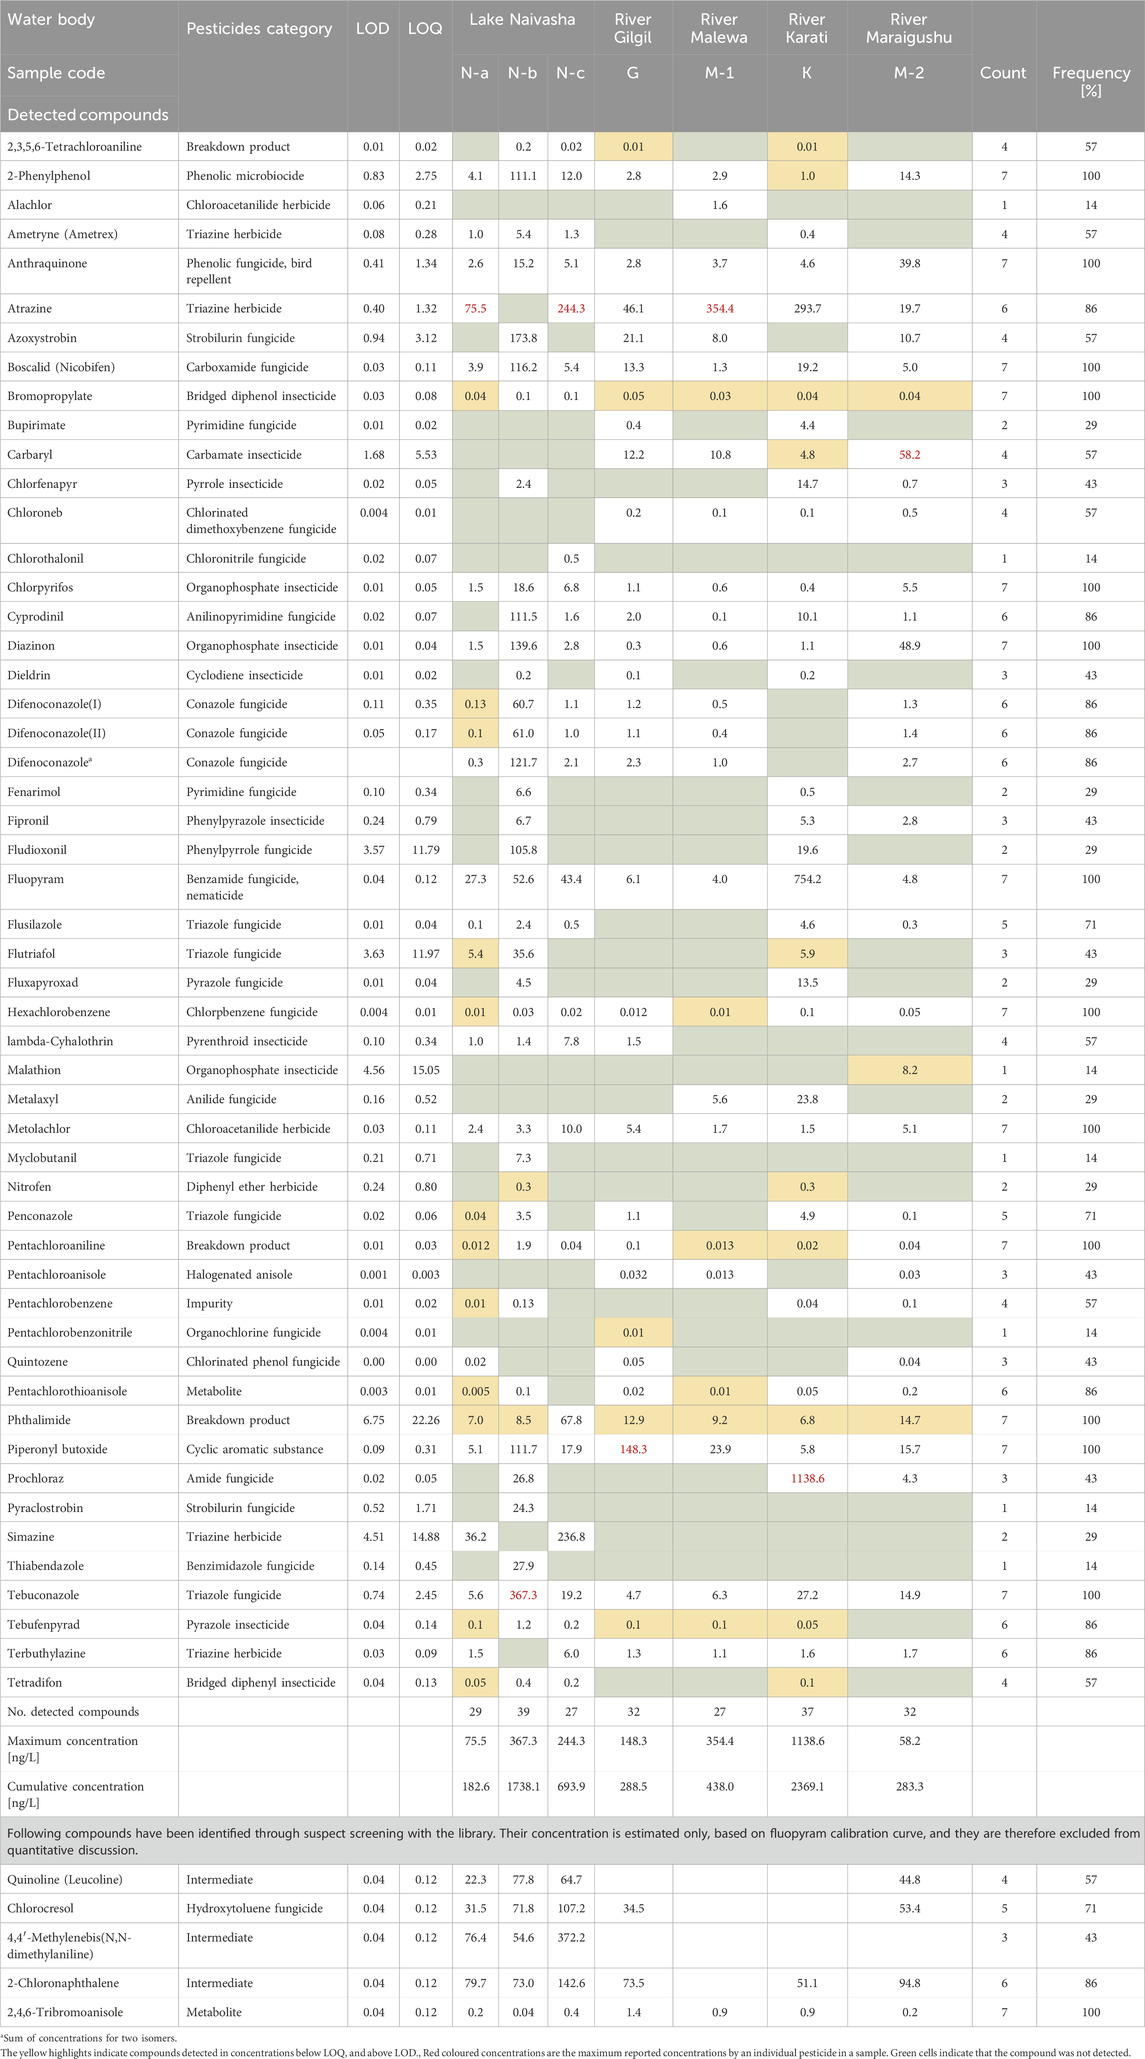
Table 1. Concentration in ng/L, Limit of Detection (LOD), limit of quantification (LOQ) and simple statistics for detected compounds.
Out of the 56 pesticides found, five were detected through suspect screening. Those compounds included 2,4,6-tribromoanisole, 2-chloronaphthalene, 4,4-methylenebis(N,N-dimethylaniline), chlorocresol, and quinoline (leucoline). However, as their presence could not be quantitatively determined, these compounds are only included in presence-absence results presentation, but not in the discussion regarding found concentrations.
Thirteen pesticides were detected in 100% of samples, including the fungicides boscalid, hexachlorobenzene, tebuconazole, herbicides metolachlor, insecticides bromopropylate, chlorpyrifos, and diazinon. Breakdown products pentachloroaniline, phtalimide, microbiocide 2-phenylphenol, bird repellent anthraquinone, and synergist piperonyl butoxide were also detected in all samples (Table 1). Several other pesticides were detected in 86% of the samples, including fungicides cyprodinil, difenoconazole, herbicides atrazine and terbuthylazine, insecticide tebufenpyrad and metabolite pentachlorothioanisole (Table 1).
The maximum concentrations of individual pesticides varied widely across samples, ranging from 58.2 ng/L (carbaryl) to 1138.6 ng/L (prochloraz). Highest detected concentrations for individual pesticide was 1138.6 ng/L, recorded for fungicide prochloraz. Fungicides fluopyram (754.2 ng/L) and tebuconazole (367.3 ng/L) were also found in relatively high concentrations, together with herbicide atrazine (354.4 ng/L). Prochloraz was detected in range between 4.3 and 1138.6 ng/L, fluopyram in range between 4 and 754.2 ng/L, tebuconazole in range between 4.7 and 367.3 ng/L, and atrazine in range between 19.7 and 754.2 ng/L.
Looking at differences in detection and concentrations between sampling locations, the site with the highest number of detected pesticides was located near Lake Naivasha (N-b) at the outlet of a wastewater treatment plant, with 43 out of 56 pesticides detected (Figure 3). At the other two sites in Lake Naivasha, N-a, and N-c there were 33 and 31 detected compounds, respectively. From the river sites, the greatest number of detections was observed in the River Karati, with 39 different pesticides detected, followed by River Maraigushu with 35, the River Gilgil with 34, and the River Malewa, 27 (Figure 3).
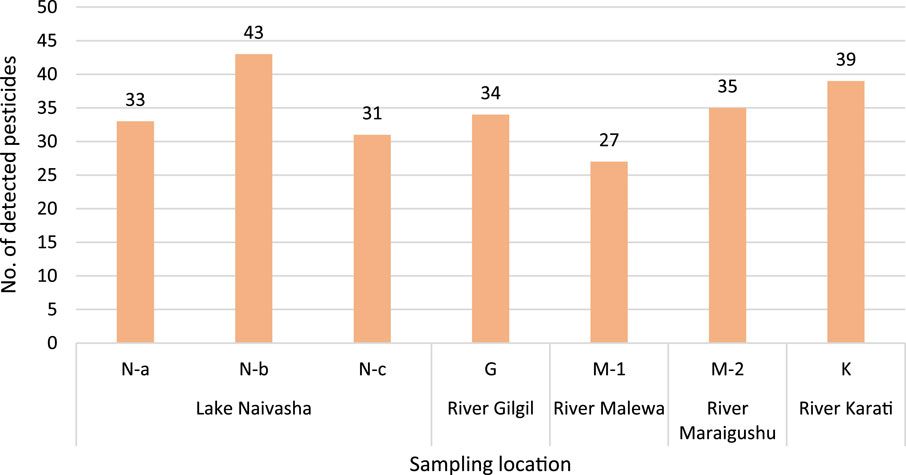
Figure 3. Number of pesticides detected per site in the catchment of Lake Naivasha.
The cumulative concentrations of pesticides detected at each sampling site are shown in Figure 4. Cumulative concentrations of all detected pesticides per site ranged from 182.3 ng/L (at Lake Naivasha, site N-a) to 2369.1 ng/L (at River Karati). The highest concentration of a single pesticide was detected in the River Karati, for the fungicide prochloraz (1138.6 ng/L). The second-highest cumulative concentration was found at Lake Naivasha (N-b), near the outlet of a wastewater treatment plant, with a concentration of 1616.3 ng/L. The other sampling sites can be ordered as follows in terms of cumulative concentrations: Lake Naivasha (N-c) > River Malewa > River Gilgil > River Maraigushu and Lake Naivasha (N-a). Concentrations below LOQ have been reported but may not significantly impact cumulative concentrations found in the samples.
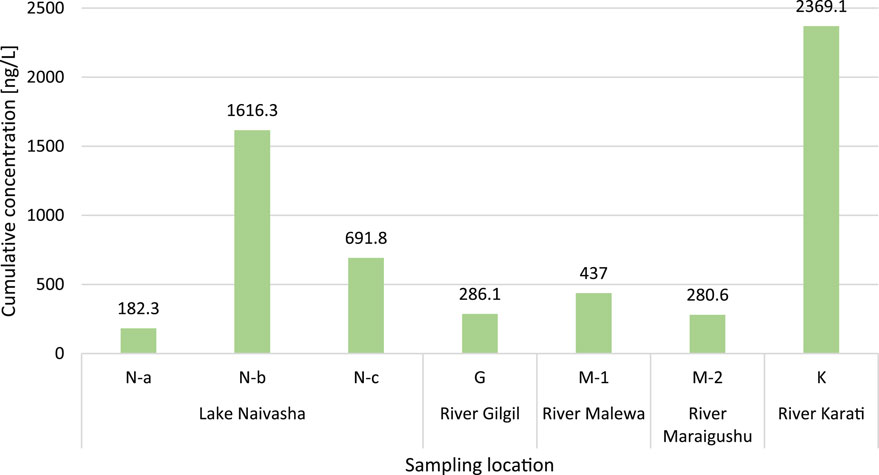
Figure 4. Cumulative concentration [ng/L] of pesticides detected per site in the Lake Naivasha catchment.
3.2 Eco-toxicological risk assessment
The acute toxic unit (TU) threshold for crustaceans, set at 0.01, was exceeded in samples from Gilgil, Malewa, and Karati Rivers and at Lake Naivasha sites N-a and N-c (Figure 5), while samples from Lake Naivasha’s wastewater treatment plant outlet (N-b) and River Manaigushu were an order of magnitude higher than the acute TU threshold (Figure 5). The insecticides chlorpyrifos and diazinon were the primary contributors to these elevated toxic units. Concentration and toxic units are provided for selected detected pesticides in Supplementary Table S5.
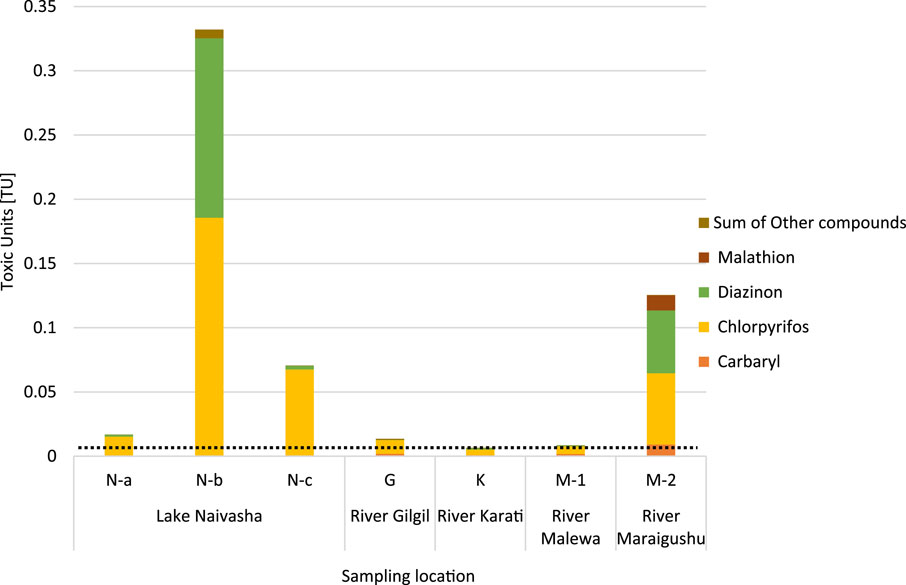
Figure 5. Toxic units for selected detected pesticides, detailed for compounds contributing majorly to cumulative toxic units at the sampling locations. The dotted line indicates TU threshold for crustacean.
Chlorpyrifos was particularly influential, exceeding the 0.01 TU threshold in nearly all samples. The samples with the highest toxic units, M-2 and N-b, also recorded the highest concentrations of chlorpyrifos (5.5 ng/L and 18.6 ng/L, respectively) and diazinon (48.4 ng/L and 139.6 ng/L, respectively). These concentrations exceeded the predicted no-effect concentration (PNEC) for both pesticides, indicating a potential risk to the aquatic environment.
4 Discussion
The results of this monitoring campaign provide new insights into the state of water quality within the catchment of Lake Naivasha. The study significantly expands current understanding through use of wide pesticide screening and the direct engagement of local communities via citizen science. Unlike previous efforts, this research not only detected a broader range of pesticide compounds, but it also involved local citizens in the data collection process, empowering communities and strengthening local ownership of water quality issues. The 56 compounds identified in this study–including both historically used and emerging chemicals–highlights gaps in existing monitoring programs. Among detected pesticides, azoxystrobin, chlorothanlonil, diazinon, difenoconazole, metalaxyl and tebuconazole are conventional locally applied agricultural products (Onyango et al., 2014), but are not necessarily monitored by Kenyan authorities. Many of these compounds, such as fluopyram and tebuconazole, are associated with both environmental and human health risks (Agriculture and Environment Research Unit AERU, 2018; Bollmohr, 2023; Lalah et al., 2022; Nyang’au et al., 2023), yet their widespread presence suggests they may be overlooked in routine assessments. This underscores the need to update and modernise Kenya’s pesticide monitoring framework to better capture the impact of agricultural activities on the country’s water resources.
Significant findings of the study are high detection frequencies and concentrations (>200 ng/L in at least one sample) for herbicide atrazine and fungicides fluopyram and tebuconazole. All three products are registered for use in Kenya. There are currently approximately 36 products available in the Kenyan market that include atrazine as an active ingredient, primarily for controlling grasses and weeds in corn cultivation (Pest Control Product Board PCPB, 2025b). Atrazine is widely applied because it does not harm the target crop, corn in particular (Lalah et al., 2022). Fluopyram is an active ingredient in five products registered in Kenya for use on horticultural crops, namely, on beans, tomatoes and potatoes, and floricultural crops, namely, roses (Pest Control Product Board PCPB, 2025b). Fungicide tebuconazole is a widely applied fungicide in Kenya (Lalah et al., 2022), ranking among the top 15 active ingredients based on sales data (Bollmohr, 2023). In the country, 58 registered products contain tebuconazole, used on a variety of horticultural crops, including barley and roses (Pest Control Product Board PCPB, 2025b).
Additionally, the study detected dieldrin and hexachlorobenzene, banned in Kenya since 2011 and 2004, respectively (Pest Control Product Board PCPB, 2025a) and flagged under the Stockholm convention as highly toxic (carcinogenic) with long term effects (Secretariat of the Stockholm Convention SSC, 2023). Their trace concentrations and sporadic presence suggests legacy contamination rather than on-going use, emphasizing the long-term persistence and bio accumulative potential of these toxic compounds in the food chain and in humans (Chopra et al., 2010). This contrasts with Onyango et al. (2024), who found high concentrations of DDTs in Lake Naivasha, indicating potential ongoing use and accumulation in the lake. Although both studies used methods with similar Limits of Detection (LOD) for organochlorines pesticides for both studies, differences in findings could be linked to temporal, spatial and methodological variations.
Currently, Kenya has no established standard for surface water quality regarding pesticides. Therefore, where possible, Maximum Allowable Concentrations (MAC) from the European Environmental Quality Standard (EQS) Directive (2013/39/EU) were used as references (Table 2). Among the detected compounds, seven pesticides - alachlor, atrazine, chlorpyrifos, dieldrin, hexachlorobenzene, pentachlorobenzene, and simazine - have established MAC values. None of the detected concentrations exceeded the MAC values. While this is a positive finding, the study underscores the importance of continued monitoring and regulation of pesticide use in Kenya to ensure the protection of aquatic ecosystems and human health. The presence of these pesticides in the environment, even at concentrations below the MAC, and their potential toxic effects on crustaceans, highlights the need for continuous monitoring. EQS are only available for a small subset of pesticides, meaning that other detected compounds might represent a hazard for humans and ecosystem health, as discussed in the previous paragraph.
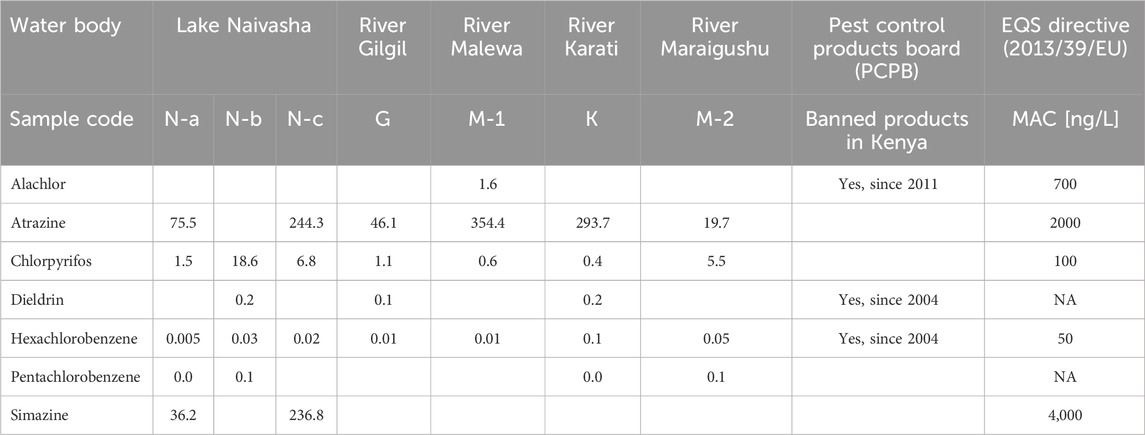
Table 2. Compounds detected for which maximum allowable concentration (MAC) are reported according to the European Environmental Quality Standard (EQS) Directive (2013/39/EU), with indication of whether they are banned in Kenya as per the Pest Control Products Board (PCPB).
According to this study’s toxicological assessment, the insecticide chlorpyrifos posed a concern for crustacean D. magna. Although its concentrations ranged between 0.4 and 18.6 ng/L-remaining below the maximum allowable concentrations set by the European Union’s Environmental Quality Standards (EQS) (Table 2) - its high toxicity still presents a risk to aquatic life. In fact, due to concerns over chlorpyrifos toxicity, the Kenya Agriculture Ministry’s Pest Control Product Board has listed chlorpyrifos in a list of pesticides to withdraw, prohibiting its use for all agricultural purposes as 31 December 2024 (Pest Control Product Board PCPB, 2023).
5 Conclusion
In conclusion, the results of this monitoring campaign conducted in the catchment of Lake Naivasha, Kenya, highlight the widespread presence of pesticides in water bodies, with potential risks to aquatic ecosystems, including of banned pesticides, suggesting legacy contamination. In contrast to prior governmental assessments, which often focus on a narrow set of legacy pesticides, this study provides a comprehensive picture that includes both legacy and emerging compounds. This reveals important blind spots in existing monitoring programs and strongly supports the case for a systematic review and expansion of Kenya’s water quality surveillance framework to ensure its relevance to contemporary agricultural practices and public health protection.
The study furthermore highlights the urgent need for updated regulatory policies, targeted interventions in high-risk areas like River Karati, a seasonal river with several nearby flower plantations. By uncovering new data and engaging local communities, this research not only fills crucial knowledge gaps but also proposes more inclusive, effective, and sustainable water governance in Kenya.
Lastly, one of the most unique aspects of this research lies in its citizen science approach. By involving local stakeholders in the sampling process, the study not only increased spatial and temporal coverage but also enhanced community understanding of environmental risks. This participatory approach serves as a model for future environmental monitoring programs in Kenya, bridging scientific research with local knowledge and fostering sustainable environmental stewardship.
Data availability statement
The dataset presented in this study can be found in online reposititories at following link: https://web.jrc.ec.europa.eu/dashboard/GOW_KE/index.html.
Ethics statement
Written informed consent was obtained from the individual(s) for the publication of any potentially identifiable images or data included in this article.
Author contributions
CC: Writing – review and editing, Formal Analysis, Methodology, Writing – original draft, Data curation, Software, Visualization, Investigation. GM: Formal Analysis, Supervision, Writing – review and editing, Software, Conceptualization, Methodology. SC: Visualization, Writing – review and editing. EK: Writing – review and editing, Investigation. AS: Investigation, Writing – review and editing. JM: Supervision, Writing – review and editing. VP: Writing – review and editing, Supervision. BG: Resources, Validation, Supervision, Writing – review and editing, Conceptualization.
Funding
The author(s) declare that no financial support was received for the research and/or publication of this article.
Acknowledgments
We would like to acknowledge the citizens who have taken part in the sampling campaign guided and trained by the KeNAWRUA. We would also like to acknowledge Tanja Casado for her contribution to the graphical abstract.
Conflict of interest
The authors declare that the research was conducted in the absence of any commercial or financial relationships that could be construed as a potential conflict of interest.
Generative AI statement
The author(s) declare that Generative AI was used in the creation of this manuscript. During the preparation of this work the author(s) used ChatGPT in order to improve the clarity of the text. After using this tool/service, the author(s) reviewed and edited the content as needed and take(s) full responsibility for the content of the publication.
Any alternative text (alt text) provided alongside figures in this article has been generated by Frontiers with the support of artificial intelligence and reasonable efforts have been made to ensure accuracy, including review by the authors wherever possible. If you identify any issues, please contact us.
Publisher’s note
All claims expressed in this article are solely those of the authors and do not necessarily represent those of their affiliated organizations, or those of the publisher, the editors and the reviewers. Any product that may be evaluated in this article, or claim that may be made by its manufacturer, is not guaranteed or endorsed by the publisher.
Supplementary material
The Supplementary Material for this article can be found online at: https://www.frontiersin.org/articles/10.3389/fenvs.2025.1623651/full#supplementary-material
References
Abbasi, Y., and Mannaerts, C. M. (2019). “Monitoring pesticides residues in water resources of the Lake Naivasha catchment using passive sampling,” in Proceedings of the 4th world congress on civil, structural, and environmental engineering. Rome, Italy: CSEE’19. doi:10.11159/iceptp19.109
Agriculture and Environment Research Unit (AERU) (2018). IUPAC pesticide properties DataBase (PPDB). Hertfordshire, UK: University of Hertfordshire. Available online at: http://sitem.herts.ac.uk/aeru/ppdb/en/.
Bollmohr, S. (2023). Toxic business—highly hazardous pesticides in Kenya. Kenya: Route to Food Initiative hosted by Heinrich Böll Foundation. Available online at: https://ke.boell.org/sites/default/files/2023-09/data-and-facts_highly-hazardous-pesticides-in-kenya-1.
Cacciatori, C., Mariani, G., Carollo, A., Tavazzi, S., Elelman, E., Glowacka, N., et al. (2023). The gems of water—how to become a gem of water? KJ-NA-31-486-EN-N. doi:10.2760/334925
Cacciatori, C., Mariani, G., Comero, S., Marin, D., Cabrera, M., Bon-Tavarnese, J., et al. (2024). “The Gems of water”: a co-created scientist-citizen approach for water quality monitoring. Front. Water 6, 1358959. doi:10.3389/frwa.2024.1358959
Cacciatori, C., Mariani, G., Comero, S., Marin, D., Cabrera, M., Bon-Tavarnese, J., et al. (2025). Stir bar sorptive extraction TDU-GC-QToF-HRMS for screening 230 pesticides in waters surrounding banana plantations in Costa Rica through community engagement. Chemosphere 376, 144251. doi:10.1016/j.chemosphere.2025.144251
Cacciatori, C., Mariani, G., Tavazzi, S., Comero, S., and Gawlik, B. M. (2025). A powerful tool for the wide-screening of organic contaminants in citizen science initiatives: development and validation of a SBSE GC-QToF-HRMS method. KJ-01-25-104-EN-N. doi:10.2760/9603874
Cacciatori, C., Myers, J., Mariani, G., Vu, H., Gawlik, B. M., and Pettigrove, V. (2025). Comparison of extraction techniques for wide screening of 230 pesticides in water. Separations 12 (6), 158. doi:10.3390/separations12060158
Campanale, C., Massarelli, C., Losacco, D., Bisaccia, D., Triozzi, M., and Uricchio, V. F. (2021). The monitoring of pesticides in water matrices and the analytical criticalities: a review. TrAC Trends Anal. Chem. 144, 116423. doi:10.1016/j.trac.2021.116423
Chopra, A., Sharma, M., and Chamoli, S. (2010). Bioaccumulation of organochlorine pesticides in aquatic system-an overview. Environ. Monit. Assess. 173, 905–916. doi:10.1007/s10661-010-1433-4
Earthwatch Institute (2024). Technical brief—the role of citizen science in improving ambient water quality. Zenodo. doi:10.5281/zenodo.12634359
EFSA Panel on Plant Protection Products and their Residues (PPR) (2013). Guidance on tiered risk assessment for plant protection products for aquatic organisms in edge-of-field surface waters. EFSA J. 11 (7), 3290. doi:10.2903/j.efsa.2013.3290
EFSA Scientific Committee More, S. J., Bampidis, V., Benford, D., Bennekou, S. H., Bragard, C., et al. (2019). Guidance on harmonised methodologies for human health, animal health and ecological risk assessment of combined exposure to multiple chemicals. EFSA J. 17 (3), e05634. doi:10.2903/j.efsa.2019.5634
Finizio, A., and Vighi, M. (2014). “Predicted no effect concentration (PNEC),” in Encyclopedia of toxicology. Third Edition (Academic Press), 1061–1065. doi:10.1016/B978-0-12-386454-3.00572-8
Kenya National Bureau of Statistics (KNBS) (2022). Economic Survey 2022. KNBS. Available online at: https://www.knbs.or.ke/reports/2022-economic-survey/.
Lalah, J. O., Otieno, P. O., Odira, Z., and Ogunah, J. A. (2022). “Pesticides: chemistry, manufacturing, regulation, usage and impacts on population in Kenya,” in Pesticides. Editors M. L. Larramendy, and S. Soloneski (IntechOpen). doi:10.5772/intechopen.105826
Lerch, O., Zbron, J., Brady, K., and Aybar, J.-L. (2018). Highly sensitive determination of contaminants in surface water in the context of the EU water framework directive using Stir Bar Sorptive Extraction (SBSE) and GC-MS/MS. GERSTEL Appl. Note 196. Available online at: http://staging.laballiance.com.my/wp-content/uploads/2020/06/AppNote-196.pdf.
Nyang’au, M. N., Akutse, K. S., Fathiya, K., Charimbu, M. K., and Haukeland, S. (2023). Biodiversity and efficacy of fungal isolates associated with Kenyan populations of potato cyst nematode (Globodera spp.). Biol. Control 186, 105328. doi:10.1016/j.biocontrol.2023.105328
Okonji, G. O., and Andala, D.Shisia (2023). Determination of selected endocrine disrupting pesticides in water from Mbagathi River, Machakos County, Kenya, using solid phase extraction and liquid chromatography Tandem mass spectrometry. J. Kenya Chem. Soc. 16 (1), 1–12. Available online at: https://kenyachemicalsociety.org/wp-content/uploads/2024/01/Okonji-et-al.-JKCS-16-1-2023-1-12.pdf.
Omondi, R., Ojwang, W., Olilo, C., Mugo, J., Agembe, S., and Ojuok, J. E. (2018). “Lakes Baringo and naivasha: endorheic freshwater Lakes of the Rift Valley (Kenya),” in The wetland book: II: distribution, description, and conservation. Editors C. M. Finlayson, G. R. Milton, R. C. Prentice, and N. C. Davidson (Springer Netherlands), 1349–1360. doi:10.1007/978-94-007-4001-3_133
Onyango, J., Kreuzinger, N., Yillia, P. T., and Kitaka, N. (2014). Potential risks of pesticide application in Kenya: case of Lake Naivasha catchment.
Onyango, J., Kitaka, N., van Bruggen, J. J. A., Irvine, K., and Simaika, J. (2024). Agricultural intensification in Lake Naivasha catchment in Kenya and associated nutrients and pesticides pollution. Sci. Rep. 14 (1), 18539. doi:10.1038/s41598-024-67460-5
Otiang’a-Owiti, G. E., and Oswe, I. A. (2007). Human impact on lake ecosystems: the case of Lake Naivasha, Kenya. Afr. J. Aquatic Sci. 32 (1), 79–88. doi:10.2989/AJAS.2007.32.1.11.148
Otieno, P. O., Schramm, K.-W., Pfister, G., Lalah, J. O., Ojwach, S. O., and Virani, M. (2012). Spatial distribution and temporal trend in concentration of carbofuran, diazinon and chlorpyrifos ethyl residues in sediment and water in Lake Naivasha, Kenya. Bull. Environ. Contam. Toxicol. 88 (4), 526–532. doi:10.1007/s00128-012-0529-7
Pest Control Product Board (PCPB) (2023). Regulatory review decision on use of Chlorothalonil; Diuron; Thiacloprid; Pymetrozine; Propineb; Chlorpyrifos, and Chlorpyrifos-methyl; and 2,4-Dichlorophenyl acetic acid and 2,4-Dimethyl amine Salt based products. Available online at: https://www.pcpb.go.ke/wp-content/uploads/2023/08/Circular-on-several-AIs.pdf.
Pest Control Product Board (PCPB) (2025a). Banned products in Kenya. Available online at: https://www.pcpb.go.ke/banned-products-in-kenya/.
Pest Control Product Board (PCPB) (2025b). Conventional Pest control products for use on crops. Available online at: https://www.pcpb.go.ke/crops/.
Ramsar Sites Information Service (2024). Lake Naivasha. Available online at: https://rsis.ramsar.org/ris/724.
Ravisankar, P., Pentyala, A., Sai, C., Hemasri, P., Babu, P., and Sankar, R. (2021). Validation characteristics and statistics in analytical method development. High. Technol. Lett. 27, 76–88. Available online at: https://www.researchgate.net/publication/353221502_VALIDATION_CHARACTERISTICS_AND_STATISTICS_IN_ANALYTICAL_METHOD_DEVELOPMENT.
Richards, N., and Syallow, D. (2018). Water resources users associations in the Mara Basin, Kenya: pitfalls and opportunities for community based natural resources management. Front. Environ. Sci. 6, 138. doi:10.3389/fenvs.2018.00138
Secretariat of the Stockholm Convention (SSC) (2023). Stockholm convention on persistent organic pollutants (POPS).
Tilman, D., Balzer, C., Hill, J., and Befort, B. L. (2011). Global food demand and the sustainable intensification of agriculture. Proc. Natl. Acad. Sci. 108 (50), 20260–20264. doi:10.1073/pnas.1116437108
Keywords: citizen science, pesticides, SBSE, GC-QToF-HRMS, Lake Naivasha, Kenya
Citation: Cacciatori C, Mariani G, Comero S, Kiminta E, Salyani A, Myers J, Pettigrove V and Gawlik BM (2025) Citizen-engaged screening of 230 pesticides in the Lake Naivasha catchment, Kenya, using stir bar sorptive extraction and GC-QToF-HRMS. Front. Environ. Sci. 13:1623651. doi: 10.3389/fenvs.2025.1623651
Received: 06 May 2025; Accepted: 04 August 2025;
Published: 20 August 2025.
Edited by:
Jiehong Guo, University of Minnesota Twin Cities, United StatesReviewed by:
Indira Devi Puthussery, Kerala Agricultural University, IndiaIsaac Cheruiyot Tanui, Helmholtz Association of German Research Centres (HZ), Germany
Copyright © 2025 Cacciatori, Mariani, Comero, Kiminta, Salyani, Myers, Pettigrove and Gawlik. This is an open-access article distributed under the terms of the Creative Commons Attribution License (CC BY). The use, distribution or reproduction in other forums is permitted, provided the original author(s) and the copyright owner(s) are credited and that the original publication in this journal is cited, in accordance with accepted academic practice. No use, distribution or reproduction is permitted which does not comply with these terms.
*Correspondence: Caterina Cacciatori, Y2F0ZXJpbmEuY2FjY2lhdG9yaUBlYy5ldXJvcGEuZXU=