 Ying Mao
- Faculty of Art and Design, Sichuan Tourism University, Chengdu, China
As a spatial manifestation of regional development, urban expansion embodies not only the dynamic evolution of land use but also engages in complex spatiotemporal feedback with population mobility. This interplay offers a novel analytical lens for investigating urban system dynamics and deepens mechanistic understanding of urbanization processes. Utilizing long-term time-series data from the Multi-order Adjacency Index (MAI), this study characterizes the spatiotemporal patterns of urban expansion in Chengdu’s central area. Subsequently, a time-lagged cross-correlation model was employed to quantify dynamic interactions between urban growth and population mobility, revealing bidirectional urban-population feedback mechanisms and their spatial heterogeneity—providing a novel analytical perspective for regional planning research. The results reveals distinct spatiotemporal signatures: Spatially, micro-scale expansion has transitioned from inefficient sprawl to intensified peripheral densification. Temporally, the process evolved through three progressive phases—disordered growth, accelerated differentiation, and stratified restructuring—reflecting synergistic development between a compact urban core and a concentric suburban periphery. The urban expansion-population mobility nexus demonstrates a bidirectional driver–response mechanism: Large-scale peripheral construction in outer areas drives subsequent inward migration via lagged effects. Rising population density in the urban core triggers infill development and renewal processes. This study establishes an innovative space–population co-evolution framework, providing theoretical foundations for optimizing urban growth governance and reconciling human–land system relationships.
1 Introduction
With nearly half of the global population living in urban areas, urbanization has emerged as one of the most profound social transformations driven by human activity (Gu, 2019). As socioeconomic development accelerates and populations rise, the level of urbanization serves as a key indicator of national and regional economic progress (Jones and Rotherham, 2012; Kassouri, 2021). Urbanization is inherently accompanied by the spatial expansion of cities, making it essential to characterize and understand the resulting transformations in landscape patterns. At its core, urbanization constitutes a comprehensive process of regional population growth and socioeconomic advancement (Franco et al., 2017), with the expansion of urban land cover as its most visible manifestation. However, rapid urbanization often leads to drastic changes in the underlying surface (Ouyang et al., 2008), causing numerous issues such as habitat fragmentation, environmental pollution, and ecological degradation, which negatively impact societies resilience and inflates sensitivity on numerous levels (Das et al., 2023). These challenges are intrinsically linked to the spatial configuration and temporal evolution of urban landscapes, positioning their ecological and environmental impacts as pressing concerns in urban studies and sustainability discourse (Chen et al., 2013). Amid global efforts toward sustainable development, which emphasize scientifically grounded and rational urban models, China’s 14th Five-Year Plan marks a strategic transition from high-speed to high-quality economic and social development (Liu and Chen, 2002). Urban development must also pursue a rational trajectory centered on high-quality growth. Accordingly, investigating the forms and spatiotemporal dynamics of urban landscape expansion is of critical importance (Liu and Chen, 2002).
Urban expansion constitutes an evolutionary reconfiguration of land-use and landscape patterns, driven by intense anthropogenic disturbances (Deng et al., 2009). With the advancement of 3S technologies, methods for detecting urban expansion have become increasingly refined and data-intensive. Early approaches typically relied on visual interpretation of multi-temporal remote sensing imagery, providing intuitive yet often rudimentary insights (de Oliveira et al., 2020; Getu and Bhat, 2024; Seto et al., 2011). For instance, Hawash utilized remote sensing data to reveal that the urban extent of Port Sudan along the Red Sea had expanded rapidly, markedly surpassing the urbanization rates of surrounding regions. However, such qualitative identification schemes are limited in their capacity to systematically capture the full complexity of urban expansion processes. In response, recent studies have employed machine learning techniques in conjunction with large-scale remote sensing datasets to generate detailed land-use classifications, facilitating assessments of urban construction land dynamics—including its spatial extent, morphology, and structural evolution (Getu and Bhat, 2024; Li et al., 2018; Wang and Jin, 2023). Although these approaches effectively reflect macro-level expansion indicators (e.g., total area, expansion rate, and intensity), they fail to reveal fine-scale, localized variations in urban development patterns. To address this gap, researchers have increasingly adopted landscape pattern indices at the patch level to characterize the spatial heterogeneity and micro-level dynamics of urban expansion. Such bottom-up analytical frameworks offer deeper insights into the mechanisms governing urban growth, thereby enhancing our understanding of the spatial logic and ecological implications of urban transformation (Corry and Nassauer, 2005; Liu et al., 2020).
Current approaches to measuring urban landscape expansion can be broadly classified into two categories. The first category focuses on the geometric and spatial attributes of urban landscape patches, using metrics such as inter-patch distance, patch density, fractal dimension, and separation index to characterize spatial form (Antrop, 2021). For instance, the radial index compares urban patches to a reference circle to quantify the degree of connectivity between urban cores and peripheral boundaries. Similarly, the aggregation and dispersion index captures the spatial contiguity and dispersion of patches with homogeneous land-use types (Herold et al., 2003). These metrics are typically computed through landscape analysis software packages, offering diverse perspectives on urban morphological features and playing an important role in the quantitative characterization of urban form. However, these landscape pattern indices primarily describe static spatial configurations and lack sensitivity to temporal landscape dynamics. Most existing analyses of urban spatial change rely on direct comparisons of landscape indices across time points, which tend to emphasize geometric descriptions rather than underlying transition processes. For example, while computing spatial indices for newly developed urban patches can illustrate their number and shape at a particular moment, it does not capture their evolutionary trajectories in relation to historical land-use contexts (Li and Wu, 2004; Ocloo et al., 2024).
The micro-level expansion, as a fundamental driver of urban expansion characteristics, provides valuable insight into the fine-grained spatial dynamics of urban growth (Xu et al., 2019). Micro-quantitative characterization methods based on spatial locational relationships capture urban expansion processes by analyzing the spatial interactions between newly developed and pre-existing urban construction land (Jiao et al., 2018; Liu et al., 2010). Among these, the Landscape Expansion Index (LEI) quantifies the degree of new urban construction through the proportion of shared boundaries between new and existing urban patches, enabling temporal comparisons of expansion intensity across multiple time points (Liu et al., 2014). However, the LEI method exhibits limitations in capturing local expansion characteristics. Specifically, the degree of expansion between new and existing construction zones is highly sensitive to the selection of distance thresholds. When this threshold is exceeded, the classification of expansion types tends to converge, thereby diluting their capacity to reflect nuanced spatial differentiation.
The Multi-order Adjacency Index (MAI) offers a refined approach for characterizing urban landscape expansion, particularly at fine spatial scales (Liu et al., 2022). By applying multi-order buffer zones, the MAI captures spatial relationships between newly developed and existing urban construction land. Notably, even in cases where new developments are spatially disconnected from established urban areas, this method effectively depicts micro-level expansion processes, enabling a more nuanced understanding of urban growth dynamics (Liu and Xu, 2021). Compared with conventional approaches, the MAI facilitates urban expansion analysis from both macro and micro perspectives, enhancing the accuracy of spatiotemporal characterization (Liu et al., 2022). As such, the question of how to effectively measure and interpret urban landscape expansion and its evolutionary trajectory remains a central concern in contemporary urbanization research. The MAI, by accounting for both form and temporal variation in urban development, presents a scientific basis for quantifying urban expansion processes.
Urban expansion represents a spatial manifestation of land-use restructuring inherent in the urban development process (Kahn, 2007). A structural analysis of urban expansion, therefore, must be framed within both spatial and temporal dimensions (Rossi-Hansberg and Wright, 2007). Expansion is often accompanied by the spatial redistribution of resources such as industry and infrastructure (Li and Gong, 2016). Most studies have emphasized the outcomes of urban expansion, while the spatial dynamics and driving forces of the expansion process itself remain underexplored (Wu et al., 2021). As a spatial response to mounting social pressures, urban expansion frequently coincides with large-scale in-migration. These new residents not only share limited urban space and basic services but also actively contribute to the city-building process. In essence, population mobility can be seen as a reactive outcome of urban expansion (Triantakonstantis and Mountrakis, 2012). However, the substantial variation in spatial distribution and temporal progression of expansion raises a critical question: how does this growth concretely shape and relate to the spatiotemporal patterns of population movement? Does urban expansion guide population inflows, or do demographic shifts precipitate spatial growth—or do the two act as mutual drivers at different stages? Resolving this causal puzzle is key to unpacking the “black box” of regional development and provides crucial insights into the evolutionary logic of urban systems.
This study pioneers a spatiotemporal analysis of urban expansion patterns in Chengdu’s central urban area, deconstructing expansion phenomena across multiple temporal and spatial scales. Furthermore, by integrating data on “urban expansion” and “population influx” within a unified spatiotemporal framework, we innovatively reveal distinct interaction types and quantify the intensity between spatial dynamics and demographic shifts. This approach provides enhanced clarity on the interactive response mechanisms linking urban expansion and population migration, offering valuable insights for formulating more scientifically grounded and efficient regional planning strategies. The main tasks undertaken in this research are outlined below. First, based on remote sensing imagery of the study area, urban construction land was extracted from land use data to identify expansion area across different time periods. Second, the Multi-order Adjacency Index (MAI) was employed to characterize urban expansion from a bottom-up, localized perspective, analyzing spatial and temporal patterns of development within the study area. Finally, a time-lagged cross-correlation analysis was conducted to investigate the dynamic interaction between urban expansion and population mobility, coupling spatial and temporal dimensions to uncover latent interaction patterns between space and population.
2 Materials and methods
2.1 Study area
Chengdu is situated in the central part of Sichuan Province, in the western region of the Sichuan Basin, at the eastern edge of the Qinghai–Tibet Plateau (102°54′E−104°53′E, 30°05′N–31°26′N). Strategically located in the hinterland of Southwest China, the city lies at the core of the Chengdu Plain. Since the onset of China’s reform and opening-up policies, Chengdu has experienced progressive administrative expansion. The study area of this paper is the central city of Chengdu, including the inner city and the outer city, overs approximately 3,677.8 km2 (Figure 1). The inner city comprises five core urban districts: Jinjiang, Wuhou, Qingyang, Jinniu, and Chenghua. The outer city encompasses six suburban districts: Xindu, Pidu, Wenjiang, Shuangliu, Longquanyi, and Qingbaijiang. The inner city of Chengdu is characterized by a concentration of high-end service industries, high population density, and intensive urban construction (Xia et al., 2022). In contrast, the outer city emphasizes advanced manufacturing and emerging industries, with relatively lower population density and rapid spatial expansion (Peng et al., 2015), exhibiting a trend toward polycentric development.
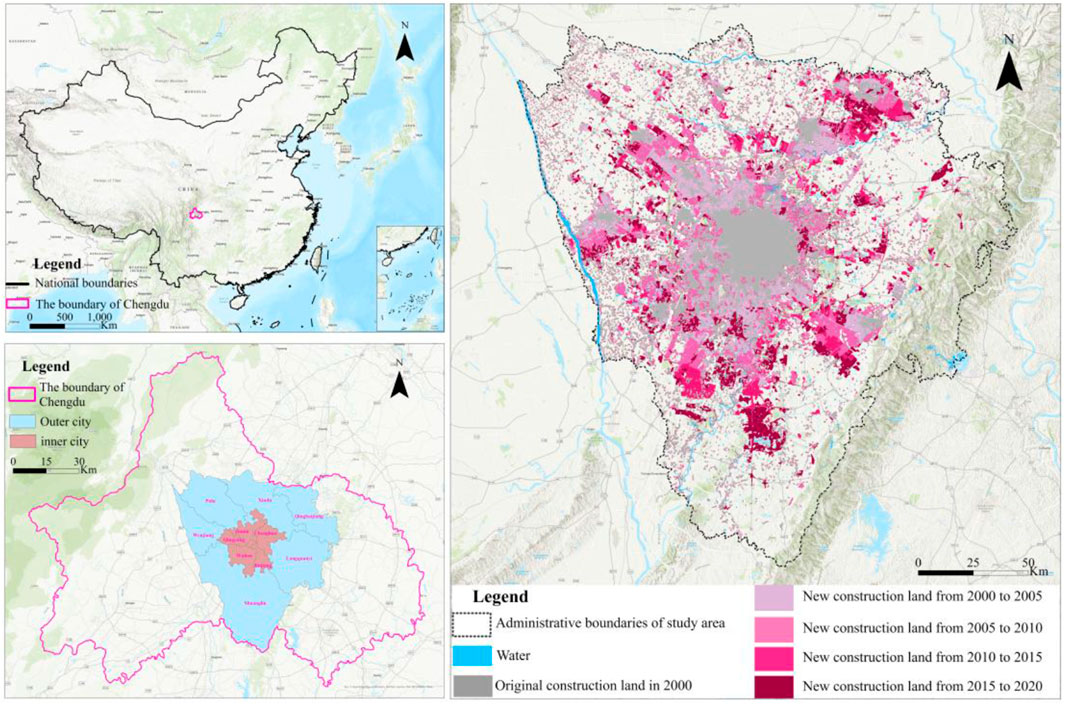
Figure 1. Location of the study area.
2.2 Data sources and processing
The datasets employed in this study are detailed in Table 1. It is important to note that although Landsat-7 imagery spans the entire study period, a malfunction in its Scan Line Corrector (SLC) on 31 May 2003, resulted in systematic data striping, leading to approximately 22% data loss in subsequent images. To ensure data quality and continuity, imagery was sourced from both Landsat-7 and Landsat-8 satellites based on their respective suitability. Specifically, Landsat-7 data were used for the period from 2000 to 2014, while Landsat-8 imagery was adopted from 2014 to 2020. All selected remote sensing images have cloud cover of less than 3% and exhibit high overall quality. Radiometric and atmospheric corrections were performed in the ENVI 5.3 software environment. The corrected imagery was then clipped using vector boundaries corresponding to the administrative divisions of the study area. Supervised classification was conducted using the Maximum Likelihood Method to extract built-up land. To ensure classification accuracy, land use and land cover types were categorized into five major classes: built-up land, vegetated green space, bare or vacant land, water bodies, and others. The data of population inflow from 2000 to 2020 are from the Chengdu Statistical Yearbook.
Table 1. The data used in this study.
2.3 Research framework
This paper analyzed the spatiotemporal patterns and evolutionary trends of urban expansion in Chengdu based on the Multi-order Adjacency Index (MAI), examining the foundational characteristics of urban expansion across multiple spatial scales within the study area. First, land use types were identified from remote sensing imagery through machine-assisted interpretation, and built-up areas as well as zones of urban landscape expansion were extracted using cartographic techniques in geographic information systems. Second, based on the theoretical framework of the MAI, a Python-based program was developed to construct a model capable of dynamically detecting urban expansion processes. Third, the model was applied to identify the characteristics of urban landscape expansion across four temporal stages. At the district scale, further analyses were conducted on the internal structural evolution of urban expansion and the spatial distribution of expansion types during each period. In addition, the annual urban expansion area for each district from 2000 to 2020 was calculated to assess the magnitude and spatial differentiation of expansion. These data were then used to perform a time-lagged cross-correlation analysis with the net in-migration rate, aiming to explore the dynamic interaction between urban growth and population mobility. The overall workflow was illustrated in Figure 2.
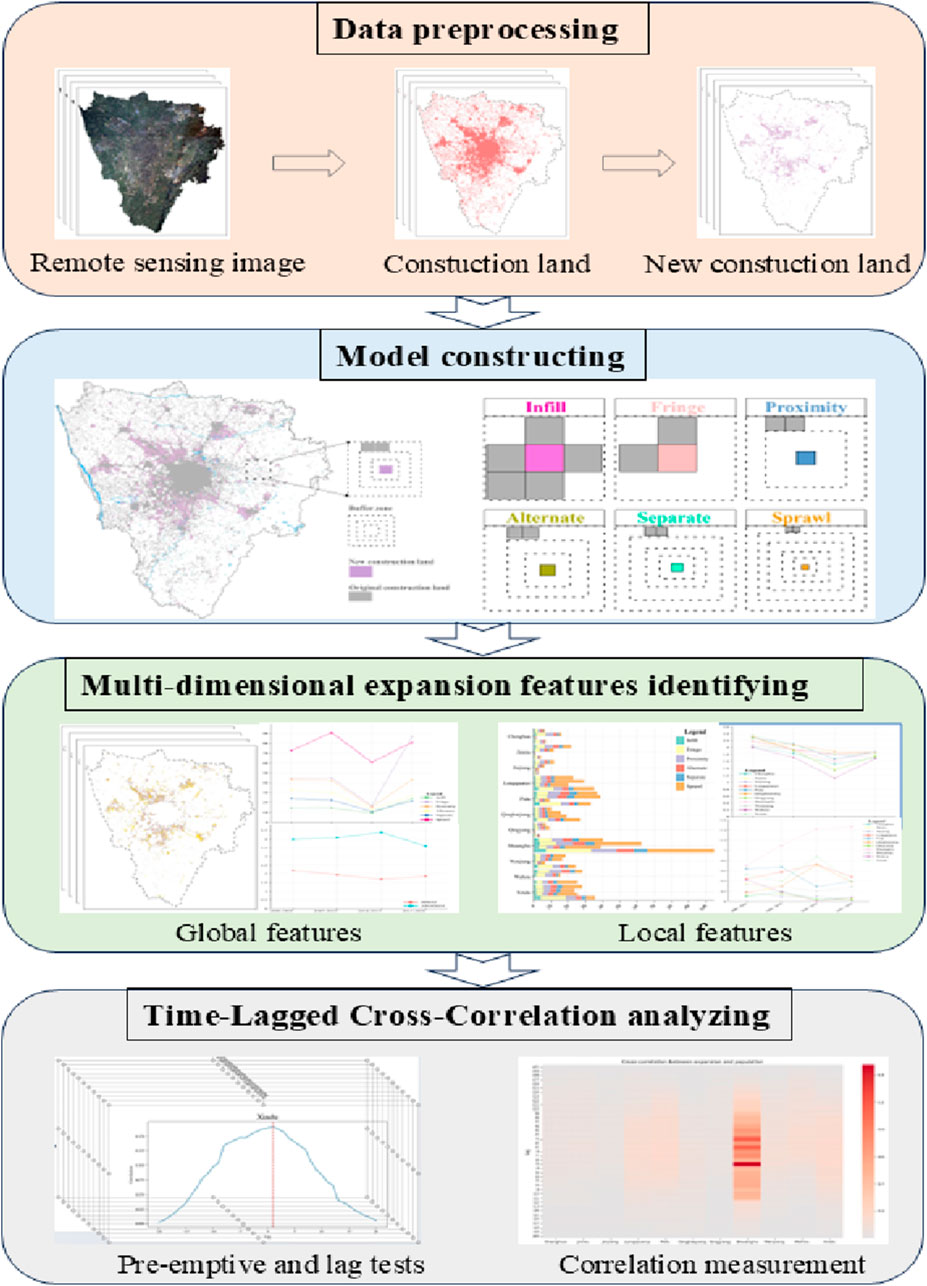
Figure 2. The workflow of the study.
2.4 Methods
2.4.1 Geo-information Tupu
Geo-information Tupu, developed based on advanced technologies such as 3S (Remote Sensing, GIS, and GPS) and information networks, has emerged as a key area of interest among scholars both in China and internationally (Cunjian, 2020; Qi, 2021), This cartographic framework facilitates in-depth exploration of spatiotemporal distributions and the evolutionary trajectories of geographic phenomena through the integration of “maps” and “spectra,” providing a critical theoretical foundation for spatial research (Chen et al., 2018; Xu, 2011). Based on the principles established by the geographic information cartography method (Wang et al., 2022), map algebra overlay operations are performed on land use cartographic units from two consecutive periods, with the calculation formula being: W = 10B + Q. In this formula: (W) represents the grid map of cartographic units showing land use change; (B) is the grid attribute value of the land use cartographic unit at the previous time point; (Q) is the grid attribute value of the land use cartographic unit at the subsequent time point.
2.4.2 Multi-order adjacency index
This article employed the Multi-order Adjacency Index (MAI) to measure the urban landscape expansion of the study area, as illustrated in Figure 3. The MAI is based on the spatial relationship between new and old patches, exploring their degree of adjacency. The adjacency is measured by establishing multi-ring, equidistant buffer zones until the buffer intersects with the existing patch. The calculation formula is as follows:
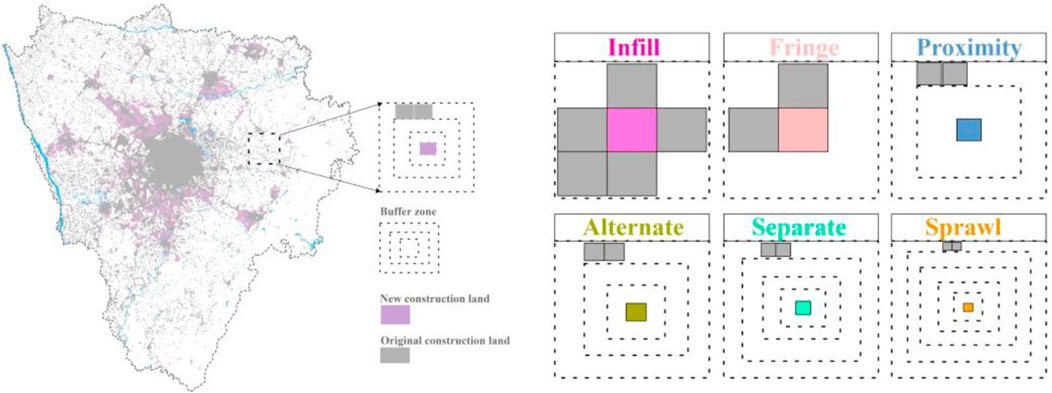
Figure 3. Graphic representation of MAI.
In Formula 1, (N) represents the number of buffer zones for the new patch; (
According to the definition of MAI, it is a micro-reflection of landscape expansion with a value range of ((0, N]). It can be seen that the larger the MAI value, the sparser the patches, indicating a greater degree of urban landscape expansion; the smaller the MAI value, the denser the patches, indicating a lesser degree of expansion. Different ranges of MAI values represent different types of landscape expansion, as shown in Table 2.
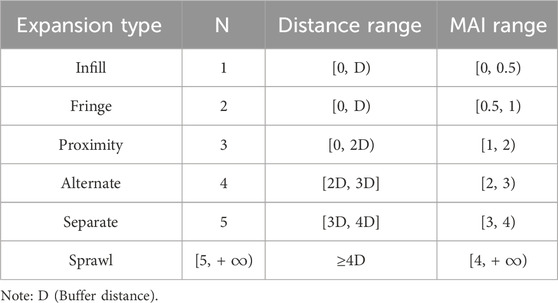
Table 2. Types of MAI expansion.
The MAI calculation result is a micro-reflection of the expansion degree of individual new patches, while the evolution of the landscape pattern is the result of the combined effect of all new patches. Therefore, in this study, algorithms based on MAI, such as MMAI (mean multi-order adjacency index) and AWMMAI (area-weighted mean multi-order adjacency index), are used to reflect the macro expansion process of the entire urban area from the bottom up.
The MMAI, which is the average multi-order adjacency index, refers to the average value of the MAI values of all new patches. The formula is as shown in Equation 2:
The AWMMAI, which stands for area-weighted mean multi-order adjacency index, is calculated using the following Equation 3:
Where
2.4.3 Time-lagged cross-correlation
Time-Lagged Cross-Correlation (TLCC), This method helps to understand the dynamics between two signals, such as identifying which signal is the leading signal and which is the following signal. Time lag inter-correlation analysis (TLCC) is widely used in various fields, including economics, physics and biology (Arreola Hernandez et al., 2015; Patrício et al., 2022; Wang et al., 2017). Given the precise relationship between net population migration and regional urban expansion, this study employs TLCC to identify the time-lagged correlations between urban expansion area and population over time. This approach allows us to explore the lead-follow relationship between the two variables, thereby reflecting the role of urban expansion indirectly. This study lag the urban expansion area and population net migration rate of each district yearly, standardizing the extreme deviations, and then perform the time lag correlation analysis. The formula is as Equation 4 shows:
Where
3 Results
3.1 Spatial and temporal characteristics of overall urban expansion
3.1.1 The spatio-temporal dynamics of urban expansion
The Geo-information Tupu was used to identify the expansion of urban landscapes. Subsequently, Python scripts are written with the support of PyCharm software to calculate the Multi-order Adjacency Index (MAI) values for new patches in four time periods: 2000–2005, 2005–2010, 2010–2015, and 2015–2020. Given that the spatial resolution of the remote sensing data source is 30 m, the distance of the multi-ring buffers used in the calculations is a multiple of 30 m. The model’s computational results are shown in Figure 4. In terms of expansion area, the urban landscape of the study area generally shows a trend of increasing first and then decreasing. During the 2000–2005 and 2005–2010 periods, the area of construction land continued to increase, the expansion area significantly decreased during the 2010–2015 period, and then the expansion area increased again during the 2015–2020 period, showing a spatial pattern of expansion from the first circle to the second circle. Regarding the type of expansion, different expansion types are classified based on the calculated MAI. Throughout the multiple periods of expansion, the overall trend was dominated by sprawling expansion, followed by edge expansion, with edge expansion surpassing sprawling expansion during the 2015–2020 period.

Figure 4. Visualization of MAI value distribution of newly added plaques in 4 periods.
3.1.2 Analysis of urban landscape expansion
To understand the phenomenon of urban expansion from a multi-level perspective of expansion types, this paper calculated the percentage of the area of each expansion type in relation to the total new area added in each of the four time periods, as recorded in Table 3. The observations are as follows:
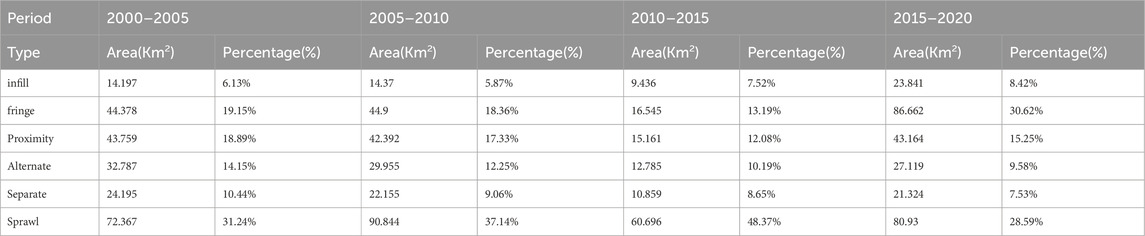
Table 3. The total area and proportion of various expansion patterns in different time periods.
From the perspective of patch type proportions, sprawling expansion is notably dominant, with its area percentage in the first three periods being 31.24%, 37.14%, and 48.37%, respectively, showing a clear overall upward trend. Edge and adjacent types of patches follow, but they exhibit a continuous decline in the first three periods; until the fourth period, 2015–2020, where the edge expansion area percentage reached 30.62%, surpassing the sprawling patch area of 28.59%. This phenomenon is due to Chengdu’s initial phase of urban expansion from 2000 to 2015, during which the government vigorously introduced industrial and commercial businesses, focusing on infrastructure and public facility construction, leading to large-scale and rapid urban expansion. In contrast, after 2015, to further rationalize urban spatial planning and prevent habitat fragmentation caused by disordered urban expansion, the pace of urban expansion slowed down. The proportions of renewal basic interstitial and separated patches have continuously declined across all four periods, dropping from 14.15% to 10.44% in 2000–2005 to 9.58% and 7.53% in 2015–2020, respectively. Infill expansion experienced a slight decrease in 2005–2010, followed by a slow increase in the subsequent periods, mainly due to the continuous improvement in urban space utilization efficiency, with more unused spaces being converted to construction land. Therefore, during periods with abundant and extensive developable land, the urban expansion and urbanization development of Chengdu’s main urban area and suburban areas in the first three periods, compared to the last period, had more newly developed built-up areas, showing that sprawling urban expansion types were more common.
Overall, the urban expansion degree and dispersion in the study area exhibit opposing trends, as illustrated in Figure 5. Firstly, the Mean Multi-order Adjacency Index (MMAI) showed a steady decline from 2.2 to 1.7 during the periods of 2000–2005, 2005–2010, and 2010–2020, indicating a decrease in the degree of urban expansion. However, it rose to 1.86 in the 2015–2020 period, suggesting an increase in urban expansion after an initial decline. Meanwhile, the Area-Weighted Mean Multi-order Adjacency Index (AWMMAI) increased from 4 to 4.4 and then decreased to 3.6 in the 2015–2020 period, indicating a shift from dispersed to more compact expansion in the study area. The emergence of these expansion trends is primarily due to the influence of policies and available development space. The increase in compactness in the later stages is also a result of urban development focusing on “improvement” under the constraints of development space.
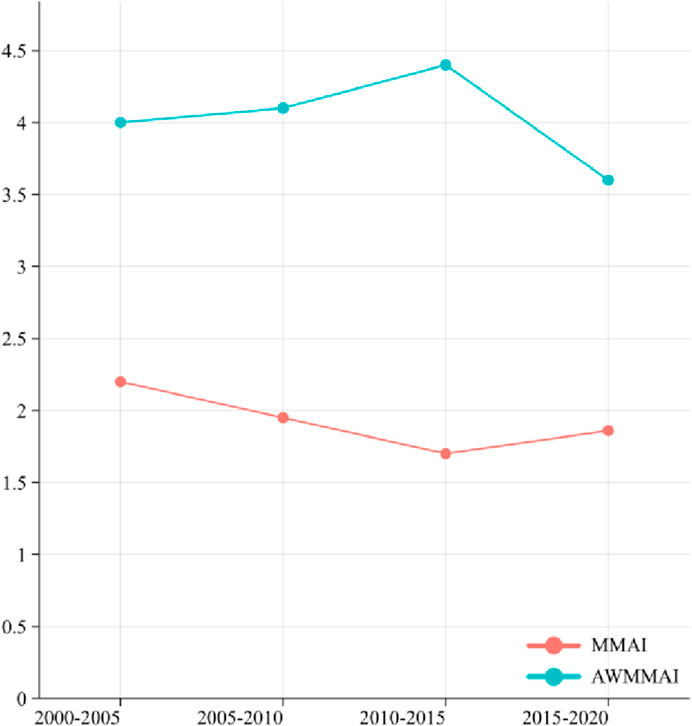
Figure 5. The statistics of MMAI and AWMMAI in different time periods.
3.2 Characteristics of district’s urban expansion
3.2.1 Spatio-temporal pattern of district’s urban expansion
To further examine the spatiotemporal dynamics of urban expansion, a district-level statistical analysis of six expansion types was conducted (Figure 6). The inner city—Chenghua, Jinniu, Jinjiang, Qingyang, and Wuhou—exhibited relatively limited overall expansion, predominantly characterized by edge-type growth, with multiple expansion types coexisting and shifting over time.
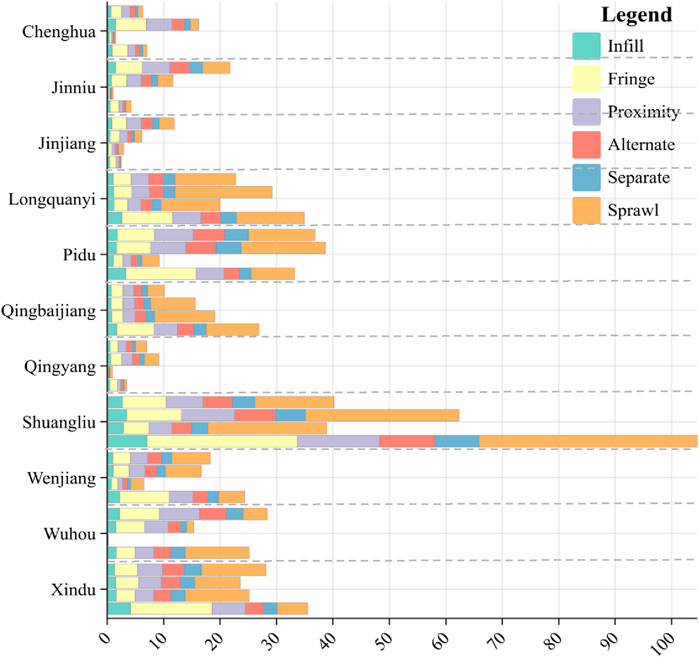
Figure 6. The area of various expansion patterns in different districts during different time periods.
Overall, urban expansion in Chengdu’s inner city exhibited a trajectory of initial increase, subsequent decline, and eventual rebound. Within this pattern, expansion types became increasingly spatially concentrated, with edge and adjacent patterns prevailing due to the dual pressures of severe land scarcity and suburban development demands. Specifically, Chenghua District consistently relied on edge and adjacent expansions throughout the study period, maintaining stable proportions despite fluctuations in total expansion area; this stability was primarily driven by its severely limited pool of developable land within the densely built inner city. Similarly, Jinniu and Jinjiang Districts experienced declining expansion areas over time but maintained a balanced mix of expansion types, reflecting their ongoing evolution in land use priorities and economic restructuring processes. Qingyang District underwent a notable transition: initially characterized by a combination of edge, adjacent, and sprawling expansions (2000–2010), its growth became predominantly edge-type in later years, constrained by increasingly binding spatial limitations within its boundaries. Wuhou District showed decreasing expansion during the first two phases, dominated by edge and adjacent types, but shifted significantly toward sprawling expansion in the fourth phase; this shift was directly driven by strong spillover effects emanating from the large-scale industrial and urban development occurring in the adjacent Shuangliu District.
In the outer city, expansion similarly followed a pattern of growth, decline, and rebound. The evolution of dominant expansion types across multiple suburbs displayed a common trajectory: sprawling expansion prevailed initially, followed by a shift toward edge and adjacent forms. After a contraction phase, the final phase saw a resurgence of edge-type expansion, with sprawling as a secondary mode and a notable increase in fringe development. This pattern was particularly pronounced in districts like Pidu, Wenjiang, and Xindu. Their evolution was significantly shaped by relatively limited land availability combined with proximity to critical ecological and water conservation zones in the northwest; consequently, expansion remained relatively restrained under the dual constraints of stringent ecological civilization initiatives and sustainable development policies. In stark contrast, districts characterized by ample development space and robust industrial bases–notably Longquanyi, Qingbaijiang, and Shuangliu–experienced sustained sprawling expansion. The continuous influx of enterprises into these areas substantially heightened demand for supporting infrastructure, driving persistent outward growth. This outward expansion was simultaneously coupled with efforts to optimize spatial layout through a strategic mix of edge, adjacent, and other expansion types, significantly enhancing overall land-use efficiency in these industrially dynamic districts.
3.2.2 Urban landscape expansion trend
Chengdu’s urban expansion over the past two decades can be delineated into three distinct phases (Figure 7a). The first phase (2000–2006) was marked by disordered and fluctuating growth across both central and peripheral districts, with Shuangliu and Pidu experiencing the most substantial expansion. The second phase (2006–2011) witnessed a general decline in expansion intensity across the study area. In the third phase (2011–2020), the overall expansion rate gradually declined, accompanied by spatial divergence after 2013. While the core urban districts stabilized at an annual expansion rate of approximately 1 km2, districts such as Qingbaijiang, Longquanyi, Pidu, and Xindu expanded at a rate of 2–4 km2 per year. Notably, Shuangliu District—benefiting from its integration into the Tianfu New Area development strategy—maintained a high expansion rate of 9 km2 per year, positioning it as a potential emerging hub of regional growth.

Figure 7. Urban landscape expansion trend in districts: (a) Expansion trend of districts; (b) MMAI trend of districts; (c) AWMMAI trend of districts.
Using the Mean Multi-order Adjacency Index (MMAI) and the Area-Weighted Mean Multi-order Adjacency Index (AWMMAI), this study quantified the degree and compactness of urban expansion across districts (Figures 7b,c). In terms of expansion degree, all districts exhibited a decline followed by a rebound in the fourth phase, largely influenced by spatial development constraints and rational planning policies. In contrast, AWMMAI revealed pronounced spatial variation in expansion compactness. Suburban districts such as Shuangliu, Longquanyi, and Qingbaijiang experienced increasing dispersion, with Shuangliu rising from 0.7 in the first phase to 1.42 in the third, then stabilizing at 1.46—indicating the highest level of spatial dispersion and a phase of steady outward growth. Despite this, all three districts showed a shift toward compact development in the third phase, likely due to reduced demand for large-scale expansion as infrastructure matured. In the core urban districts, expansion remained consistently compact, with only minor fluctuations, maintaining high AWMMAI values indicative of dense, efficient spatial growth.
3.2.3 Time-lagged cross-correlation
The time-lagged cross-correlation analysis reveals that in Chengdu’s inner urban districts—specifically Chenghua, Jinjiang, Qingyang, and Wuhou—population inflows largely preceded urban expansion (Figure 8). Among them, the population influx into Chenghua District can be traced back to as early as 3 years prior to the onset of spatial growth, reflecting a persistent and elevated demand for urban land. As the inner district with the most abundant available space, Chenghua has absorbed a substantial number of migrants in recent years. In contrast, Jinjiang and Wuhou—characterized by their concentration of commercial activities and limited residential development—have seen relatively modest population inflows and correspondingly smaller-scale urban expansion driven by migration.
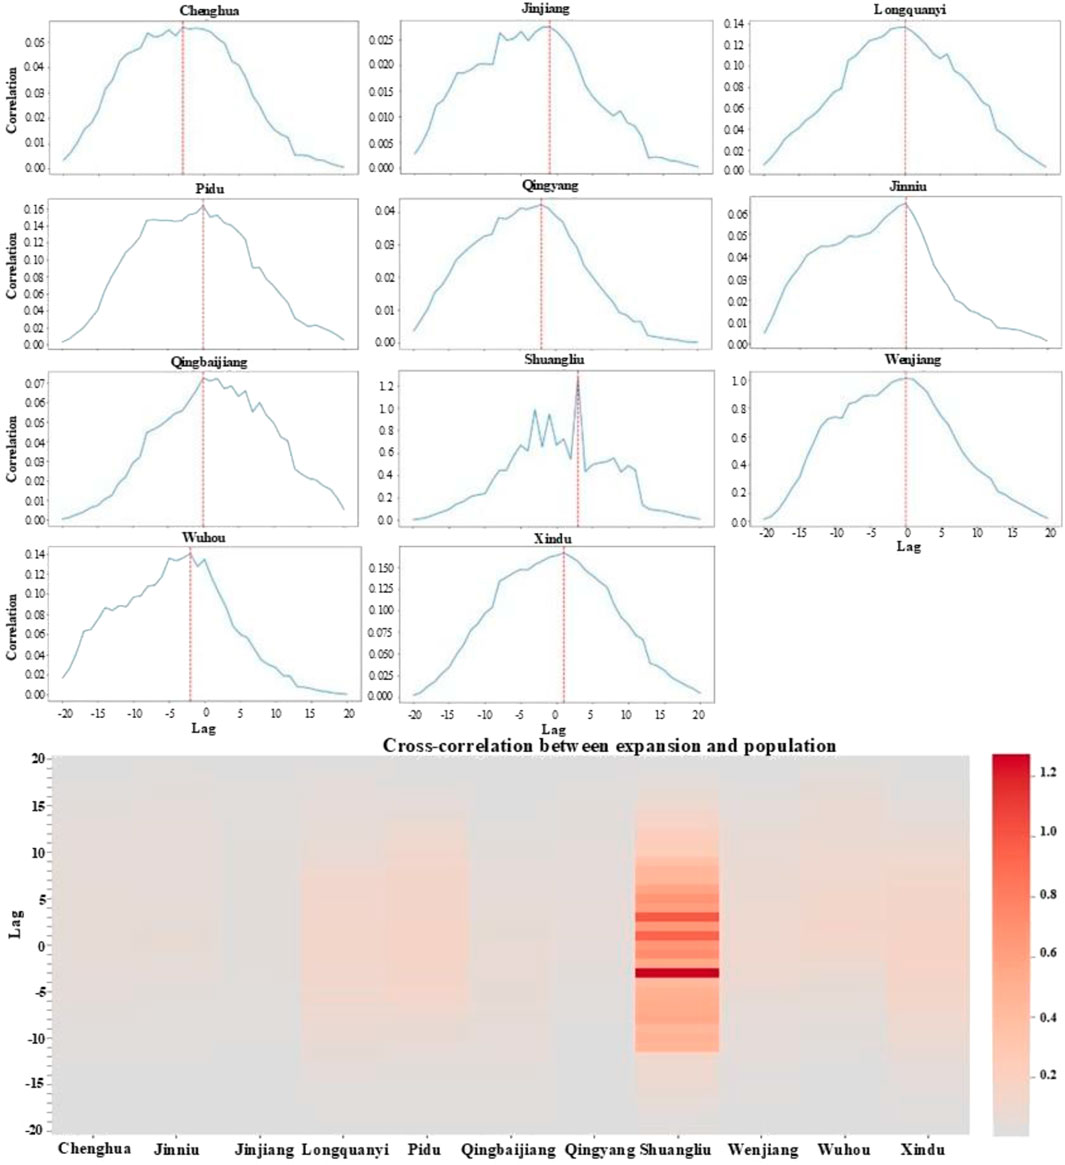
Figure 8. Time-Lagged Cross-Correlation between urban landscape expansion and net migration rate.
Compared to the inner city, the outer districts generally exhibited synchronous trends between population inflows and urban expansion. In most of these areas, expansion activities have responded promptly to demographic changes, primarily due to policy efforts in recent years that prioritized the residential development functions of outer districts. Aggressive real estate development initiatives have helped redirect population pressure away from the city center. Notably, Shuangliu and Xindu districts demonstrated clear evidence of urban expansion driving subsequent population inflow. Shuangliu, as the site of the Tianfu New Area, has attracted a significant concentration of high-end manufacturing and emerging industries over the past decade. Its expansive industrial base and integrated supply chains have drawn large numbers of highly skilled professionals, positioning it as a strong candidate to become the city’s leading satellite district. In contrast, while Xindu District’s economic growth has been fueled by its aviation and rail transit sectors, its overall appeal remains constrained due to underdeveloped supporting industries. It is also worth noting that Shuangliu’s protracted urban construction timeline has led to a relatively delayed capacity to absorb population inflows.
4 Discussion
4.1 The evolution of expansion types, a continuous spatial mapping of expansion forces
The Multi-order Adjacency Index (MAI) defines urban expansion types based on the spatial positioning of new patches within buffer zones generated around existing construction land (Liu et al., 2022). Accordingly, the MAI serves as a metric of landscape expansion distance, capturing a static expression of expansion force through the Euclidean proximity between new and pre-existing patches. From a dynamic perspective, the sequential evolution of expansion types may reflect the spatial imprint of shifting expansion forces over time.
Traditionally, urban expansion force has been assessed using indicators such as expansion speed and intensity (Lee and Lee, 2023; Moroz et al., 2024), which primarily rely on spatial distance to reflect the intensity and orientation of development. According to traditional urban expansion analysis, the growth patterns or development models of cities can typically be categorised into three quantitative types: infill, edge expansion, and leapfrog expansion (Dytham, 1996). For example, a study on urban expansion in Hyderabad, Pakistan, found that the city’s general urban growth pattern primarily consists of infill and expansion (Ul Din and Mak, 2021). This study classifies expansion types based on the expansion distance of expansion patches, primarily including six types, treating these morphological categories as spatial manifestations of expansion dynamics. The spatio-temporal changes of these six expansion types in the study area are analysed, providing a more comprehensive interpretation of Chengdu’s urban expansion. In this study, a spatiotemporal analysis of changes in expansion types—such as sprawling and edge expansion—offers a more nuanced interpretation, treating these morphological categories as spatial representations of expansion dynamics. Theoretically, sprawling expansion can be conceptualized as the outcome of a city overcoming spatial resistance through the combined influence of endogenous growth momentum and exogenous driving factors (Zhao, 2010). Under this framework, all expansion outcomes are shaped by varying configurations of resistance, internal force, and external stimulus. Their interaction manifests spatially as differentiated patch locations within multi-order buffer zones, with the spatial distribution of expansion types serving as a proxy for underlying expansion forces.
Over time, shifts in the proportions of expansion types across spatial scales may reflect the attenuation or reinforcement of such forces (Poelmans and Van Rompaey, 2010). Previous studies on Chengdu’s urban expansion have identified policy-driven disparities between inner and outer districts, with significantly slower expansion rates in the inner city constrained by limited developable land—findings that align with the outcomes of this research (He et al., 2019). Additionaly, another research documents significantly accelerated pace and intensity of urban expansion in Chengdu between 1990 and 2020, exhibiting pronounced spatiotemporal heterogeneity. Concurrently, the dominant spatial growth pattern shifted from infill development to edge-expansion, with the southern sector emerging as the primary direction of growth—observations converging with this study’s findings (Wang et al., 2023). Here, Shuangliu District functioned as a southern growth pole, alleviating pressure on the urban core while extending Chengdu’s socioeconomic influence across southern regions. Notably, this study reveals that in Xindu—an outer district of Chengdu—large-scale expansion predominated during the initial three phases despite its comparatively limited overall spatial growth, signaling robust initial development impetus. By the fourth phase, however, edge-type expansion became predominant, even as the total expansion area increased—indicating a weakened expansion stance (Zhou et al., 2020), possibly constrained by policy or spatial limitations. This suggests a transition toward more regulated and compact development. Thus, analyzing the temporal evolution of expansion types enables deeper insights into the intensity and transformation of urban expansion forces. It should be noted that while quantitative analytical frameworks can visualise the expansion of spatiotemporal dimensions, our understanding of urban expansion remains limited. This is because our analysis of expansion causes is constrained by the scarcity of analytical data types and dimensions. Future research may need to further utilise remote sensing data, which holds broad application prospects in urban and management-related work (Du et al., 2024; Yinghui and Qingming, 2009). In summary, this research framework provides a theoretical foundation for understanding the mechanisms of urban growth and offers a basis for promoting high-quality, spatially efficient urban development strategies.
4.2 Urban growth: a process of redistribution of resources and functions
Urban expansion presents both challenges and opportunities for regional development, shaped in large part by strategic governmental coordination of spatial resources (Georgescu, 2015; Güneralp et al., 2017). As a spatial response to urban congestion and traffic pressure, urban sprawl has emerged as an efficient form of land utilization. However, the functional implications of expansion—whether anticipatory or lagged—can vary significantly in terms of spatial role differentiation and pressure mitigation.
In the study area, urban expansion has generally followed a pattern of outward growth from the central city to the suburbs, consistent with trends observed in many metropolitan regions (Cao et al., 2022; Rao et al., 2023). One research on Chengdu’s urban expansion and population mobility further indicates that residential market adjustments exacerbate the spatiotemporal decoupling between metropolitan growth and migrant populations (Wang et al., 2024). This divergence is particularly pronounced between inner and outer districts, with outer areas exhibiting significantly stronger correlations with population influx—reinforcing the core-periphery dynamics observed in Chengdu. These convergent findings are empirically validated in our study, particularly regarding the divergent growth-migration coupling patterns between inner and outer city. Shuangliu District stands out with the largest expansion area and most distinct characteristics, consistently exhibiting sprawling-type growth. This is largely attributable to its abundant land resources, which have enabled large-scale development. Moreover, as a key hub for science, education, and high-tech industries in Chengdu, Shuangliu’s endogenous growth momentum aligns closely with regional development policies, jointly steering the expansion process (Xie et al., 2023).
In this context, policy serves as a critical external driver, often defining the functional attributes of different regions. In recent years, Shuangliu has emerged as a new growth pole for Chengdu, absorbing diverse urban functions from the core city. Leveraging its land price advantages and policy incentives, it has attracted a range of emerging industries, becoming a major development node within the study area (Chen et al., 2024; Li et al., 2023). In contrast, expansion in the inner city has been largely reactive, driven by population pressure.
Similar patterns have been observed in other Chinese cities such as Shenzhen (Yu et al., 2019), Xi’an (Yuan et al., 2024), and Shanghai (Yue et al., 2014), where urban expansion is shaped by the interplay between endogenous forces and external drivers. However, not all population–space interactions effectively fulfill regional functions. Excessively lagged expansion may lead to population outflow (Brueckner, 2000), while overly anticipatory expansion requires comprehensive, multi-scalar planning to achieve balanced outcomes (Gu et al., 2023).
Therefore, future efforts to alleviate population pressure in large cities and promote sustainable urban planning should focus on rational spatial function allocation across scales, while avoiding excessive interregional competition. Aligning expansion models with current development realities and long-term visions—through updated spatial planning concepts and targeted policy implementation—holds significant promise for advancing urban expansion research and practice.
4.3 Limitions of this study
This study employed the novel Multi-order Adjacency Index (MAI) to investigate the spatiotemporal evolution of urban expansion characteristics across multiple scales, aiming to deepen the understanding of the dynamic interplay between urban growth and population mobility. However, several limitations remain to be addressed in future research. First, due to the study area’s location within a basin frequently covered by cloud, the availability of high-quality remote sensing imagery is limited. Although the land use data derived from machine interpretation have undergone visual correction, the overall classification accuracy still requires improvement. Second, the current classification of urban landscape expansion types could be further refined by integrating additional landscape attributes such as patch morphology and area, which may enhance the granularity of expansion pattern analysis. Third, the study was based on 11 administrative districts, which might limit the statistical robustness of the findings at a larger scale. Expanding the spatial scope and increasing the number of analytical units in future research would help improve the reliability and generalizability of the results through more comprehensive quantitative analysis.
5 Conclusion
By integrating long-term data on urban expansion and population mobility, this study revealed the bidirectional spatiotemporal interaction between spatial development and population dynamics in Chengdu’s inner and outer districts. The main findings are as follows:
(1) Urban expansion in study area exhibited a “growth–decline–rebound” trend, with a spatial shift from inner to outer areas. Temporally, the urban landscape has evolved through three distinct phases—disordered expansion, accelerated differentiation, and stratified restructuring. The rise and fall of the AWMAI suggest that constrained land availability and planning policies curbed excessive expansion.
(2) At the district level, there are marked differences in the evolution of urban expansion types between inner and outer areas. The inner districts were primarily characterized by edge-type and infill (adjacent-type) expansion, with sprawl-type expansion being secondary. In contrast, outer districts such as Shuangliu, Qingbaijiang, and Longquanyi exhibited predominantly sprawl-type expansion during the first three stages, transitioning to edge-dominated patterns in the fourth stage.
(3) Time-lagged cross-correlation analysis indicates that population inflows in the inner districts generally preceded urban expansion, with Chenghua District showing an anticipatory demographic influence on spatial growth of nearly 3 years. In contrast, outer districts exhibited a more synchronized relationship between population inflow and expansion. Only Shuangliu and Xindu districts displayed clear patterns where urban expansion served as a driver for subsequent population inflow.
Data availability statement
The raw data supporting the conclusions of this article will be made available by the authors, without undue reservation.
Author contributions
YM: Writing – original draft, Writing – review and editing.
Funding
The author(s) declare that financial support was received for the research and/or publication of this article. This work was supported by the Sichuan Provincial Social Science Key Research Base (Sichuan Landscape and Recreation Research Center), “Research on the Development of Regional Characteristic Leisure Agriculture Landscapes in the Context of Industrial Integration: A Case Study of Chengdu City”, grant number JGYQ2024015.
Conflict of interest
The author declares that the research was conducted in the absence of any commercial or financial relationships that could be construed as a potential conflict of interest.
Generative AI statement
The author(s) declare that no Generative AI was used in the creation of this manuscript.
Publisher’s note
All claims expressed in this article are solely those of the authors and do not necessarily represent those of their affiliated organizations, or those of the publisher, the editors and the reviewers. Any product that may be evaluated in this article, or claim that may be made by its manufacturer, is not guaranteed or endorsed by the publisher.
References
Antrop, M. (2021). “Landscape mosaics and the patch-corridor-matrix model,” in The routledge handbook of landscape ecology. Routledge, 25–48.
Arreola Hernandez, J., Al Janabi, M. A., Hammoudeh, S., and Khuong Nguyen, D. J. J. o.A. M. (2015). Time lag dependence, cross-correlation and risk analysis of US energy and non-energy stock portfolios. J. Asset Manag. 16 (7), 467–483. doi:10.1057/jam.2015.33
Brueckner, J. K. (2000). Urban sprawl: diagnosis and remedies. Int. regional Sci. Rev. 23, 160–171. doi:10.1177/016001700761012710
Cao, H., Chen, J., Chen, C., and Li, P. J. E. I. (2022). Identification of multi-temporal urban growth patterns with a modified urban growth index: case study of three fast growing cities in the greater mekong subregion (GMS). Ecol. Indic. 142, 109206. doi:10.1016/j.ecolind.2022.109206
Chen, L., Sun, R., and Liu, H. (2013). Eco-environmental effects of urban landscape pattern changes: progresses,problems,and perspectives. Acta Ecol. Sin. 33, 1042–1050. doi:10.5846/stxb201205070659
Chen, Z., Niu, A., Xu, S., and Ma, J. J. S. S. S. (2018). Analysis of wetland landscape changes in the Shenzhen Bay based on geo-information TUPU, 54, 168–176.
Chen, S., Qiu, J., Yang, M., and Li, J. J. B. (2024). A synergetic perspective on the planning of the “city in a park”: a case study of the Sichuan Tianfu new area, China. Buildings 14 (6), 1542. doi:10.3390/buildings14061542
Corry, R. C., and Nassauer, J. I. (2005). Limitations of using landscape pattern indices to evaluate the ecological consequences of alternative plans and designs. Landsc. Urban Plan. 72, 265–280. doi:10.1016/j.landurbplan.2004.04.003
Cunjian, Y. J. J. o.G.-I. S. (2020). The idea of Geo-information tupu and its practices. J. Geo-Information Sci. 22 (4), 04000697. doi:10.12082/dqxxkx.2020.200173
Das, B., Khan, F., and Mohammad, P. (2023). Impact of urban sprawl on change of environment and consequences. Environ. Sci. and Pollut. Res. 30, 106894–106897.
de Oliveira, M. L., Rufino, I. A. A., Cunha, J., Vasconcelos, R. S., and de Brito, H. C. (2020). Urban growth dynamics based on surface Albedo changes in Petrolina, Brazil. Acta Scientiarum-Technology 42, e46270. doi:10.4025/actascitechnol.v42i1.46270
Deng, J. S., Wang, K., Hong, Y., and Qi, J. G. (2009). Spatio-temporal dynamics and evolution of land use change and landscape pattern in response to rapid urbanization. Landsc. urban Plan. 92, 187–198. doi:10.1016/j.landurbplan.2009.05.001
Du, S., Zhang, X., Lei, Y., Huang, X., Tu, W., Liu, B., et al. (2024). Mapping urban functional zones with remote sensing and geospatial big data: a systematic review. GIScience and Remote Sens. 61, 2404900. doi:10.1080/15481603.2024.2404900
Dytham, C., and Forman, R. T. T. (1996). Land mosaics: the ecology of landscapes and regions. J. Ecol. 84, 787–788. doi:10.2307/2261341
Franco, S., Mandla, V.R., and Ram Mohan Rao, K. (2017). Trajectory of urban growth and its socioeconomic impact on a rapidly emerging megacity. J. Urban Plan. Dev. 143, 04017002.
Georgescu, M. (2015). Challenges associated with adaptation to future urban expansion. J. Clim. 28, 2544–2563. doi:10.1175/jcli-d-14-00290.1
Getu, K., and Bhat, H. G. (2024). Application of geospatial techniques and binary logistic regression model for analyzing driving factors of urban growth in Bahir Dar city, Ethiopia. Heliyon 10, e25137. doi:10.1016/j.heliyon.2024.e25137
Gu, R., Xie, Z., Takatori, C., Herold, H., and Xie, X. (2023). To what extent can satellite cities and new towns serve as a steering instrument for polycentric urban expansion during massive population growth? A comparative analysis of Tokyo and Shanghai. ISPRS Int. J. Geo-Information 12, 234. doi:10.3390/ijgi12060234
Güneralp, B., Lwasa, S., Masundire, H., Parnell, S., and Seto, K. C. (2017). Urbanization in Africa: challenges and opportunities for conservation. Environ. Res. Lett. 13, 015002. doi:10.1088/1748-9326/aa94fe
He, X., Mai, X., and Shen, G. (2019). Delineation of urban growth boundaries with SD and CLUE-s models under multi-scenarios in chengdu metropolitan area. Sustainability 11 (21), 5919. doi:10.3390/su11215919
Herold, M., Liu, X., Clarke, K. C. J. P. E., and Sensing, R. (2003). Spatial metrics and image texture for mapping urban land use. Photogrammetric Eng. and Remote Sens. 69 (9), 991–1001. doi:10.14358/pers.69.9.991
Jiao, L., Liu, J., Xu, G., Dong, T., Gu, Y., Zhang, B., et al. (2018). Proximity expansion index: an improved approach to characterize evolution process of urban expansion. Comput. Environ. Urban Syst. 70, 102–112. doi:10.1016/j.compenvurbsys.2018.02.005
Jones, M., and Rotherham, I. D. (2012). Managing urban ancient woodlands: a case study of bowden housteads wood, Sheffield. Arboric. J. 34, 215–233. doi:10.1080/03071375.2012.767075
Kassouri, Y. (2021). Monitoring the spatial spillover effects of urbanization on water, built-up land and ecological footprints in sub-Saharan Africa. J. Environ. Manag. 300, 113690. doi:10.1016/j.jenvman.2021.113690
Lee, C., and Lee, S. J. A. G. (2023). Analyzing spatiotemporal land use change using an urban growth model based on multilevel logistic regression and future land demand scenarios. Appl. Geogr. 160, 103099. doi:10.1016/j.apgeog.2023.103099
Li, H. B., and Wu, J. G. (2004). Use and misuse of landscape indices. Landsc. Ecol. 19, 389–399. doi:10.1023/b:land.0000030441.15628.d6
Li, G. D., Sun, S. A., and Fang, C. L. (2018). The varying driving forces of urban expansion in China: insights from a spatial-temporal analysis. Landsc. Urban Plan. 174, 63–77. doi:10.1016/j.landurbplan.2018.03.004
Li, J., Qiu, J., Amani-Beni, M., Wang, Y., Yang, M., and Chen, J. J. L. (2023). A modified equivalent factor method evaluation model based on land use changes in Tianfu new area. Land 12 (7), 1335. doi:10.3390/land12071335
Liu, Y., and Chen, B. (2002). The study framework of land use/cover change based on sustainable development in China. Geogr. Res. 21, 324–330. doi:10.11821/yj2002030007
Liu, J., and Xu, Q. (2021). “Measurement and analysis of urban landscape expansion based on multi-order adjacency index,” in 2021 IEEE 4th advanced information management, communicates, electronic and automation control conference (IMCEC) (IEEE), 967–970.
Liu, X. P., Li, X., Chen, Y. M., Tan, Z. Z., Li, S. Y., and Ai, B. (2010). A new landscape index for quantifying urban expansion using multi-temporal remotely sensed data. Landsc. Ecol. 25, 671–682. doi:10.1007/s10980-010-9454-5
Liu, X., Ma, L., Li, X., Ai, B., Li, S., and He, Z. (2014). Simulating urban growth by integrating landscape expansion index (LEI) and cellular automata. Int. J. Geogr. Inf. Sci. 28, 148–163. doi:10.1080/13658816.2013.831097
Liu, L., Liu, J. M., Liu, Z., Xu, X. L., and Wang, B. W. (2020). Analysis on the spatio-temporal characteristics of urban expansion and the complex driving mechanism: taking the Pearl River Delta urban agglomeration as a case. Complexity 2020, 1–12. doi:10.1155/2020/8157143
Liu, J., Xu, Q., Yi, J., and Huang, X. (2022). Analysis of the heterogeneity of urban expansion landscape patterns and driving factors based on a combined multi-order adjacency index and geodetector model. Ecol. Indic. 136, 108655. doi:10.1016/j.ecolind.2022.108655
Moroz, C. B., Sieg, T., Thieken, A. H. J. C., and Systems, U. (2024). Spatial constraints in cellular automata-based urban growth models: a systematic comparison of classifiers and input urban maps. Comput. Environ. Urban Syst. 110, 102118. doi:10.1016/j.compenvurbsys.2024.102118
Ocloo, M. D., Huang, X., Fan, M., and Ou, W. (2024). Study on the spatial changes in land use and landscape patterns and their effects on ecosystem services in Ghana, West Africa. Environ. Dev. 49, 100947. doi:10.1016/j.envdev.2023.100947
Ouyang, T., Fu, S., Zhu, Z., Kuang, Y., Huang, N., and Wu, Z. (2008). A new assessment method for urbanization environmental impact: urban environment entropy model and its application. Environ. Monit. Assess. 146, 433–439. doi:10.1007/s10661-007-0089-1
Patrício, A., Lopes, M. B., Costa, P. R., Costa, R. S., Henriques, R., and Vinga, S. J. T. (2022). Time-lagged correlation analysis of shellfish toxicity reveals predictive links to adjacent areas, species, and environmental conditions. Toxins 14 (10), 679. doi:10.3390/toxins14100679
Peng, W., Wang, G., Zhou, J., Zhao, J., and Yang, C. (2015). Studies on the temporal and spatial variations of urban expansion in Chengdu, Western China, from 1978 to 2010. Sustain. Cities Soc. 17, 141–150. doi:10.1016/j.scs.2015.03.004
Poelmans, L., and Van Rompaey, A. (2010). Complexity and performance of urban expansion models. Comput. Environ. Urban Syst. 34, 17–27. doi:10.1016/j.compenvurbsys.2009.06.001
Qi, Q. (2021). Geo-information tupu. Adv. Cartogr. Geogr. Inf. Eng., 251–277. doi:10.1007/978-981-16-0614-4_7
Rao, Y. X., Wu, C. X., and He, Q. S. (2023). The antagonistic effect of urban growth pattern and shrinking cities on air quality: based on the empirical analysis of 174 cities in China. Sustain. Cities Soc. 97, 104752. doi:10.1016/j.scs.2023.104752
Rossi-Hansberg, E., and Wright, M. L. J. T. R. o.E. S. (2007). Urban structure and growth. Rev. Econ. Stud. 74 (2), 597–624. doi:10.1111/j.1467-937x.2007.00432.x
Seto, K. C., Fragkias, M., Gueneralp, B., and Reilly, M. K. (2011). A meta-analysis of global urban land expansion. Plos One 6, e23777. doi:10.1371/journal.pone.0023777
Triantakonstantis, D., and Mountrakis, G. (2012). Urban growth prediction: a review of computational models and human perceptions. J. Geogr. Inf. Syst. 04, 555–587. doi:10.4236/jgis.2012.46060
Ul Din, S., and Mak, H. W. (2021). Retrieval of land-Use/Land cover change (LUCC) maps and urban expansion dynamics of hyderabad, Pakistan via landsat datasets and support vector machine framework. Remote Sens. 13, 3337. doi:10.3390/rs13163337
Wang, C., and Jin, Y. (2023). Long dawn before take-off: spatio-temporal patterns and mechanisms of China's urban growth, 1900–1978. Cities 141, 104466. doi:10.1016/j.cities.2023.104466
Wang, F., Wang, L., and Chen, Y. J. S. r. (2017). Detecting PM2. 5’s correlations between neighboring cities using a time-lagged cross-correlation coefficient. Sci. Rep. 7 (1), 10109. doi:10.1038/s41598-017-10419-6
Wang, Q., Yang, K., Li, L., Zhu, Y. J. I. J. o.E. R., and Health, P. (2022). Assessing the terrain gradient effect of landscape ecological risk in the Dianchi Lake Basin of China using Geo-information tupu method. Int. J. Environ. Res. Public Health 19 (15), 9634. doi:10.3390/ijerph19159634
Wang, G., Peng, W., Zhang, L., Xiang, J., Shi, J., and Wang, L. (2023). Quantifying urban expansion and its driving forces in chengdu, western China. Egypt. J. Remote Sens. Space Sci. 26, 1057–1070. doi:10.1016/j.ejrs.2023.11.010
Wang, J., Zhang, S., Deng, W., and Zhou, Q. (2024). Metropolitan expansion and migrant population: correlation patterns and influencing factors in Chengdu, China. Land 13 (1), 101. doi:10.3390/land13010101
Wu, R., Li, Z., and Wang, S. (2021). The varying driving forces of urban land expansion in China: insights from a spatial-temporal analysis. Sci. Total Environ. 766, 142591. doi:10.1016/j.scitotenv.2020.142591
Xia, X., Zhang, Y., Shi, X., Chen, J., and Rao, T. (2022). Simulation of dynamic urban growth boundary combining urban vitality and ecological networks: a case study in chengdu metropolitan area. Land 11, 1793. doi:10.3390/land11101793
Xie, X., Gong, X., Pan, S. J. C. J. o.P., and Resources, E. (2023). Research on the construction path of the megacity from the perspective of Nudge Theory: empirical evidence of the “Park City” construction in Chengdu Tianfu New Area. Chin. J. Popul. Resour. Environ. 21 (3), 163–171. doi:10.1016/j.cjpre.2023.09.005
Xu, Q.-x.J. A. A. R. (2011). Dynamic change analysis of urban green land in jinan city based RS and geo-information tupu. Asian Agric. Res. 3 (1), 90–92. doi:10.22004/ag.econ.108419
Xu, G., Jiao, L., Liu, J., Shi, Z., Zeng, C., and Liu, Y. (2019). Understanding urban expansion combining macro patterns and micro dynamics in three Southeast Asian megacities. Sci. Total Environ. 660, 375–383. doi:10.1016/j.scitotenv.2019.01.039
Yinghui, X., and Qingming, Z. (2009). A review of remote sensing applications in urban planning and management in China, 2009 joint urban remote sensing event, 1–5.
Yu, W., Zhang, Y., Zhou, W., Wang, W., and Tang, R. (2019). Urban expansion in Shenzhen since 1970s: a retrospect of change from a village to a megacity from the space. Phys. Chem. Earth, Parts A/B/C 110, 21–30. doi:10.1016/j.pce.2019.02.006
Yuan, L., Yinxia, Z., Yan, C., Dong, L., Lin, L., and Xiaoyuan, Z. (2024). Analysis on the characteristics and driving factors of urban spatial expansion of early-developing regions in Western China: a case study of Shaanxi Province. China City Plan. Rev. 33, 68–78. doi:10.20113/j.ccpr.20240107a
Yue, W., Fan, P., Wei, Y. D., and Qi, J. (2014). Economic development, urban expansion, and sustainable development in Shanghai. Stoch. Environ. Res. risk Assess. 28, 783–799. doi:10.1007/s00477-012-0623-8
Zhao, P. (2010). Sustainable urban expansion and transportation in a growing megacity: consequences of urban sprawl for mobility on the urban fringe of Beijing. Habitat Int. 34, 236–243. doi:10.1016/j.habitatint.2009.09.008
Keywords: urban expansion, multi-order adjacency index (MAI), time-lagged cross-correlation, Chengdu, immigration
Citation: Mao Y (2025) Urban-population dynamics in Chengdu: spatiotemporal feedback mechanisms revealed by multi-order adjacency index and time-lagged cross-correlation. Front. Environ. Sci. 13:1625142. doi: 10.3389/fenvs.2025.1625142
Received: 08 May 2025; Accepted: 24 July 2025;
Published: 25 August 2025.
Edited by:
Hugo Wai Leung Mak, Hong Kong University of Science and Technology, Hong Kong SAR, ChinaCopyright © 2025 Mao. This is an open-access article distributed under the terms of the Creative Commons Attribution License (CC BY). The use, distribution or reproduction in other forums is permitted, provided the original author(s) and the copyright owner(s) are credited and that the original publication in this journal is cited, in accordance with accepted academic practice. No use, distribution or reproduction is permitted which does not comply with these terms.
*Correspondence: Ying Mao, bWFveWluZ3NjdHVAMTYzLmNvbQ==