 Jinyu Wang
 Rongqiang Xu2
- 1School of Economics, Beijing Technology and Business University, Beijing, China
- 2Information Center of Ministry of Natural Resources, Beijing, China
- 3Shaoguan University, Shaoguan, Guangdong, China
With the rapid development of the economy and excessive resource consumption, improving industrial green efficiency is a crucial pathway to achieving sustainable industrial development. Based on the super-efficiency SBM model and using provincial panel data from 2005 to 2022, this study measures China’s industrial green efficiency index. It constructs an indicator system with 36 specific indicators selected from seven dimensions: industrial governance, economic foundation, factor input, technological efficiency, environmental governance, natural factors, and pollutant emissions. The study employs the geographical detector method to conduct an in-depth analysis of the driving effects of industrial green efficiency. The key findings are as follows: (1) Since 2005, China’s industrial green efficiency index has exhibited an initial increase followed by a slight decline, dropping from 0.668 to 0.623. (2) The pace of China’s green transition has been gradually accelerating, yet significant disparities in green efficiency indices remain among provinces, with particularly pronounced gaps between the developed eastern regions and the underdeveloped western regions. (3) The Moran’s Index indicates that 77.4% of China’s provinces show a positive spatial correlation between their industrial green efficiency and that of neighboring provinces, with this proportion on the rise. Strong spatial clustering is observed in Shanghai, Zhejiang, and Fujian, while spatial dispersion is noted in Hebei and Guangdong. (4) Industrial governance has the most significant driving effect on industrial green efficiency, followed by economic foundation (1.153), factor input (0.772), technological efficiency (0.637), environmental governance (0.567), natural factors (0.338), and pollutant emissions (0.239). (5) At present, economic development, industrial upgrading, capital investment, and green finance are the key driving forces behind industrial green efficiency. The negative impact of pollutant emissions has been gradually decreasing, while the role of technological innovation, though important, has shown a marginal diminishing trend in the later stages. Additionally, the digital economy’s contribution to industrial green efficiency has been steadily increasing.
1 Introduction
In recent years, as the global ecological crisis has intensified, green, low-carbon, and sustainable development has become a global consensus. As the world’s second-largest economy, China bears the responsibility of leading the global transition toward green development and has elevated green development to a national strategy (Yang et al., 2025). Against this backdrop, China has incorporated the construction of an “ecological civilization” into its overall development agenda. Since 2018, the Chinese government has issued a series of policy documents—such as the Evaluation Measures for Ecological Civilization Construction Goals and the Opinions on Accelerating the Promotion of Ecological Civilization Construction—explicitly calling for the acceleration of green and low-carbon technological innovation, the optimization of industrial structure, and the advancement of high-quality development. In particular, China’s 14th Five-Year Plan identifies green development as a key pathway for promoting high-quality development and emphasizes the need to achieve a harmonious balance between economic growth and environmental protection. The industrial sector consumes about 70% of China’s total energy (Zhang A. et al., 2022) and emits 62% of its carbon dioxide (Fang et al., 2022). Therefore, promoting the green transformation of industry, improving energy efficiency, and reducing carbon emissions are critical for achieving China’s dual carbon targets of peaking CO2 emissions by 2030 and reaching carbon neutrality by 2060. In February 2024, the Ministry of Industry and Information Technology, together with six other ministries, issued new guidelines on accelerating the greening of the manufacturing sector, highlighting the importance of advancing green industrial development. Industrial green efficiency (INGE)—a key indicator reflecting both ecological and economic performance of the industrial sector—has thus become a central policy target in China’s green transition (Zhang et al., 2025; Sun and Zhou, 2024).
Since the reform and opening-up, China’s economy has grown at an average annual rate of 9.2%. However, rapid industrialization has placed enormous pressure on resources and the environment. In 2022, the industrial sector contributed 40% of China’s GDP but accounted for 60% of CO2 emissions. This growth model is approaching ecological limits. According to the Ministry of Ecology and Environment, in 2022 approximately 19.4% of arable land was polluted, and 80.6% of groundwater was classified as poor or very poor in quality (Xiu et al., 2023). Confronted with these challenges, the 19th National Congress of the Communist Party of China elevated ecological civilization construction to a “millennium plan,” and committed to achieving carbon peaking by 2030 and carbon neutrality by 2060. As the backbone of China’s economy, the green transformation of the industrial sector is pivotal to the success of this national strategy. Yet, China’s INGE faces multiple challenges: regional disparities are significant—for example, in 2022, energy consumption per unit of industrial value added in eastern provinces was only 60% of that in the western region; structurally, heavy industry still accounts for over 60% of total industrial output, but its carbon intensity is four times that of light industry (Liu et al., 2023). Existing studies have not sufficiently revealed the driving mechanisms underlying these issues. Improvements in INGE rely not only on technological innovation and policy support but are also shaped by regional economic foundations, industrial structures, and environmental governance. Therefore, analyzing the spatial distribution, driving forces, and transformation pathways of China’s interprovincial INGE is of great importance for advancing the national green development strategy and promoting balanced regional development.
This study uses panel data from 31 Chinese provinces between 2005 and 2022 to construct a comprehensive indicator system covering seven dimensions: industrial governance, economic foundations, factor inputs, technological efficiency, environmental governance, natural conditions, and pollutant emissions. Employing the super-efficiency SBM model, Moran’s I, and the Geodetector method, the study examines spatial disparities in provincial INGE and explores the mechanisms driving these patterns. The findings are intended to provide policymakers with targeted recommendations, support China’s industrial green transformation, and contribute to the realization of a green, low-carbon, and sustainable economy and society.
Building on existing literature, this paper contributes in several ways. First, it integrates the super-efficiency SBM model with the Geodetector method to quantify INGE across provinces and explain its driving factors. Second, it develops a detailed system of 36 indicators across seven dimensions, enhancing the scientific robustness and explanatory power of the results. Third, it applies Moran’s I to capture spatial correlation, revealing agglomeration effects and regional imbalances in INGE, thereby offering theoretical insights for regional collaborative governance. Fourth, it analyzes the effects of industrial governance, economic foundations, factor inputs, technological efficiency, environmental governance, natural conditions, and pollutant emissions on INGE, broadening the policy perspective on green industrial transformation.
The remainder of this paper is organized as follows. Section 2 reviews the literature and outlines the contributions of this study. Section 3 introduces the models, methodologies, and data sources. Section 4 analyzes the spatiotemporal evolution of INGE in China. Section 5 examines the influencing factors of INGE. Section 6 concludes with key findings and policy implications.
2 Literature review
2.1 International research focus on INGE
The concept of eco-efficiency was first introduced by German scholar Schaltegger, who measured economic development’s environmental performance using the ratio of value increment to environmental impact increment. This concept has since been widely applied across various fields (Wang et al., 2016). Current research on industrial efficiency mainly focuses on the following aspects. (1) Measurement Methods of Industrial Efficiency. The primary methods used for measuring industrial efficiency include Data Envelopment Analysis (DEA) and Stochastic Frontier Analysis (SFA) (Wang and Lin, 2024; Yu, 2023). Scholars have used DEA-based methods to calculate input-output efficiency while considering environmental pollution as an undesirable output (Shuai and Fan, 2020). Additionally, the SBM model and DDF model have been employed to estimate industrial green total factor productivity (TFP) and its growth rate (Zhu et al., 2021; Zhu et al., 2019; Dong et al., 2021). Compared to the traditional SBM model, the super-efficiency SBM model offers greater flexibility and can quantify the impact of different factors on green efficiency, making it suitable for cross-regional and cross-temporal comparative studies (Zhong et al., 2023; Xu et al., 2022; Ding et al., 2022). (2) Regional Differences in Industrial Efficiency. Research on regional industrial efficiency differences can be categorized into macro-level and micro-level studies based on the geographical scope of analysis (Ding et al., 2022; Gu et al., 2021; Bai et al., 2018; Xie et al., 2019). Macro-level studies focus on national, provincial, and municipal scales, primarily analyzing temporal changes in eco-efficiency and spatial correlation patterns. Micro-level studies mainly examine firms, investigating variations in eco-efficiency across different types of enterprises and regions (Uche et al., 2024). (3) Influencing Factors of Industrial Eco-Efficiency. Industrial eco-efficiency is influenced by multiple factors, including economic development, technological innovation, industrial structure, resource endowments, and environmental governance (Miao et al., 2021; Jin et al., 2019; Wang et al., 2024). Many scholars incorporate energy consumption, pollutant emissions, resources, and environmental factors into total factor productivity (TFP) analysis frameworks to estimate industrial green TFP (Yuan et al., 2020; Jiang et al., 2024; Lin and Wang, 2024). With the growing emphasis on green development in both policy and academic research, scholars have increasingly focused on the roles of environmental regulation, institutional innovation, and technological progress (Hameed et al., 2024; Xuan et al., 2024). However, the impact of environmental regulation on eco-efficiency remains controversial. Sun et al. (2024) argues that strict environmental regulations facilitate the adoption of energy-saving and emission-reduction technologies, thereby enhancing green efficiency. Ouyang et al. (2022) suggests that overly stringent environmental regulations may increase compliance costs for enterprises, hinder technological innovation, and ultimately reduce green efficiency.
2.2 Research progress on INGE in China
In recent years, domestic scholars have focused on the impact of regional, policy, and technological factors on INGE (Yao et al., 2018; Wang and Wang, 2021). Li and Zeng (2020) used the super-efficiency SBM model to study the INGE of 31 provinces in China, and the results showed that the green efficiency of coastal areas and developed provinces was significantly higher than that of inland areas. Li G. et al. (2023) and Liu et al. (2024) pointed out that technological innovation and green investment have become key factors in improving China’s INGE. Guo et al. (2020) measured the green development efficiency of 34 cities in Northeast China, and the results showed that industrial agglomeration hindered the improvement of green development efficiency, and there was a U-shaped relationship between industrial agglomeration and green development. Lu et al. (2024) used the Super SBM-ML model to analyze the INGE of the middle and lower reaches of the Yangtze River Economic Belt from 2011 to 2020, finding that the INGE in these areas showed an upward trend, with an average annual growth rate of 1.48%. The regions with high INGE were mainly concentrated in eastern coastal cities, while regions with low INGE were mainly located in central and western China. Gu et al. (2023) constructed fixed effects models, spatial Durbin models (SDM), moderating effect models, and threshold models using panel data from the Beijing-Tianjin-Hebei urban agglomeration from 2011 to 2020. The empirical results showed that industrial digitalization significantly improved urban green development efficiency (GDE), but there were significant spatial differences and imbalances.
2.3 Research methodology for INGE
In the measurement and analysis of INGE, the most commonly applied approaches are Data Envelopment Analysis (DEA) and Stochastic Frontier Analysis (SFA). DEA is a non-parametric method that constructs an efficiency frontier through linear programming and evaluates relative efficiency in a multi-input–multi-output framework. Since DEA does not rely on a specific functional form of the production function, it offers flexibility and transparency in handling nonlinear and multidimensional input–output structures (Coelli, 1998; Nazarko and Šaparauskas, 2014; Krmac and Mansouri Kaleibar, 2023). By contrast, SFA is a parametric approach that requires the assumption of a specific production function, allowing random noise to be separated from inefficiency effects, which makes it particularly suitable for efficiency analyses where stochastic disturbances are significant (Hjalmarsson et al., 1996; Fall et al., 2018). Consequently, DEA has been more widely applied in policy analysis and composite performance evaluations, while SFA is better suited to contexts where random shocks must be explicitly accounted for. Within DEA, several extended models have been developed. The early CCR (Charnes–Cooper–Rhodes) model assumes constant returns to scale (CRS) and is appropriate for evaluating overall efficiency levels (Koziarski and Woźniak, 2017; Lotfi et al., 2010). The BCC (Banker–Charnes–Cooper) model, by allowing variable returns to scale (VRS), separates pure technical efficiency from scale efficiency (Dellnitz et al., 2018). The Slacks-Based Measure (SBM) model further incorporates slack variables in inputs and outputs, enabling direct treatment of resource waste and output shortfalls. This makes the SBM model particularly suitable for INGE studies, especially in multi-input–multi-output settings involving undesirable outputs such as environmental pollution (Li and Shi, 2014; Zhang et al., 2017). In recent years, the super-efficiency SBM model has been widely employed in interprovincial and firm-level studies of green efficiency. This approach can capture marginal differences in relative efficiency, thereby providing robust evidence for policy evaluation (Huang et al., 2021; Zhong et al., 2021).
In summary, DEA and SFA each have distinct advantages and limitations. DEA is more suitable for green efficiency measurement in multidimensional, multi-output contexts, while the SBM model and its super-efficiency extension offer a more nuanced framework that accommodates environmental constraints and resource inefficiency, yielding intuitive and operational results. Building upon this, the present study employs the super-efficiency SBM model in combination with spatiotemporal analysis of interprovincial INGE and the Geodetector method. This integrated framework systematically reveals the driving forces of INGE and their spatial heterogeneity, thereby providing theoretical and methodological support for China’s industrial green transformation policies.
2.4 Innovations of this study
Existing research on INGE still has several limitations. Most studies lack a long-term, dynamic perspective for comparative analysis, and the mechanisms driving INGE remain insufficiently explored. To address these gaps, this study integrates the perspectives of national low-carbon policies, INGE, and its spatiotemporal evolution, employing the super-efficiency SBM model, Moran’s I, and the Geodetector method to analyze the spatiotemporal evolution of interprovincial INGE in China and its driving factors.
The main innovations of this study are as follows: It investigates the spatial clustering and dispersion patterns of China’s INGE, analyzing the evolution of green efficiency over a long-term temporal scale. It systematically examines the effects of industrial governance, economic foundations, factor inputs, technological efficiency, environmental governance, natural conditions, and pollutant emissions on INGE, thereby clarifying the underlying driving mechanisms.
3 Research methodology and data sources
3.1 Ecological efficiency evaluation system
Based on the Cobb-Douglas production function and drawing on the research approaches of Tao et al. (2016), Garrett-Peltier (2017), Li and Zeng (2020), Zhang and Choi (2013), Zhang L. et al. (2022), Wang (2023), and Hou et al. (2018), this study constructs a model for measuring China’s INGE, focusing on input indicators, desired output indicators, and undesired output indicators (as shown in Table 1). The input factors include labor, measured by the number of industrial employees; capital, estimated using the perpetual inventory method to obtain industrial capital stock; energy, represented by total industrial energy consumption; and water resources, measured by industrial water consumption. The output factors consist of desired output, represented by deflated industrial added value, and undesired output, measured using three indicators: total industrial wastewater discharge, industrial solid waste emissions, and sulfur dioxide (SO2) emissions in industrial exhaust gas. This study employs MATLAB software and applies the super-efficiency SBM model to calculate China’s INGE index.

Table 1. INGE evaluation indicator system.
3.2 Research methodology
3.2.1 Super efficiency SBM model
The super-efficiency SBM (Super-SBM) model directly accounts for input redundancy and output shortfalls, making it suitable for efficiency measurement that includes undesired outputs such as pollutants (Li et al., 2013; Zh et al., 2018). It has been widely applied in the fields of green efficiency, environmental governance, and energy efficiency (Jiang et al., 2020; Yu et al., 2019). The formula is as follows:
In the formula,
3.2.2 Spatial autocorrelation analysis
The Moran’s I index is a commonly used spatial autocorrelation analysis method for measuring the degree of clustering or dispersion of a variable in geographic space (Moran et al., 2008). It can reveal whether there is a spatial agglomeration effect in INGE across regions, as well as its scope and intensity. The calculation formula is as follows:
In the formula,
3.2.3 Geodetector
Geodetector is an emerging spatial statistical analysis method that detects the impact of different spatial factors on the spatial heterogeneity of a target variable, thereby revealing its spatial relationships (Zhao et al., 2020; Zhu et al., 2020). The formula is as follows:
3.3 Study area and data sources
This study focuses on 31 Chinese provinces (excluding Hong Kong and Macau) as the research area, as illustrated in Figure 1, and involves a total of 43 indicators. Economic and social data, including per capita GDP, urbanization rate, and total resident population, were obtained from the China Statistical Yearbook and the respective provincial statistical yearbooks. Environmental indicators, such as the proportion of nature reserves, forest coverage, industrial wastewater discharge, generation of general industrial solid waste, and sulfur dioxide emissions from industrial exhaust, were sourced from the China Environmental Statistical Yearbook. Industrial indicators, including the number of industrial employees and total assets of industrial enterprises, were derived from the China Industrial Statistical Yearbook, while data on wastewater treatment capacity were obtained from the China Urban Statistical Yearbook. Additional data were supplemented from official Chinese sources and other reliable authoritative institutions.

Figure 1. Overview of the study area.
4 Temporal and spatial changes in China’s INGE
4.1 Temporal changes in China’s INGE
Based on panel data from 31 provinces in China from 2005 to 2022, the INGE index of China was calculated using the Super-SBM model (Equations 1, 2). The results are shown in Figure 2.

Figure 2. Trend of changes in China’s INGE index from 2005 to 2022.
The national INGE index exhibited a general upward trend followed by a slight decline. Specifically, from 2005 to 2009, the INGE index increased from 0.668 to 0.736, showing a steady growth of approximately 10.16%. From 2010 to 2015, the index declined from 0.767 to 0.623, a decrease of 18.75%. This decline may have been influenced by factors such as industrial overcapacity, high resource consumption, and the failure to fully implement environmental protection requirements. From 2016 to 2022, the INGE index slightly declined from 0.644 to 0.634, showing minor fluctuations. In 2022, China’s INGE index was 0.634, a 4.2% decrease compared to 2005. Throughout the period from 2005 to 2022, the INGE index in China exhibited certain volatility. Although there were periods of growth, the overall increase was limited, especially after 2015, when a downward trend emerged. During the period from 2005 to 2015, China’s economic growth was relatively fast, and there was a positive correlation with the growth of the INGE index. However, after 2016, with the slowdown of economic growth, the improvement in green efficiency did not keep pace, reflecting the lagging effect of industrial structural transformation.
Table 2 shows the INGE indices of China’s 31 provinces for selected years.

Table 2. Interprovincial INGE indices in key years of China.
Overall, there are still significant disparities in the green efficiency indices among provinces in China, with a particularly prominent gap between the developed eastern regions and the underdeveloped western regions. In 2022, only 12 provinces had an INGE index greater than 1.000, and 61.3% of the provinces had an INGE index still below 1.000. Eastern and coastal provinces such as Beijing, Shanghai, Guangdong, and Fujian have consistently maintained a leading position in green efficiency, with most showing a stable upward trend. The green efficiency index in Beijing increased steadily from 1.204 in 2005 to 1.270 in 2022. Shanghai and Guangdong’s indices have remained high, consistently exceeding 1.000 since 2005, indicating that these regions have achieved a more mature green transformation driven by green industries, technological innovation, and environmental policies.
Meanwhile, some resource-dependent, heavy industrial provinces such as Hebei, Shanxi, and Heilongjiang generally have green efficiency indices lower than 1.000, and some even show a long-term declining trend. For example, the green efficiency index in Hebei decreased from 0.533 in 2005 to 0.422 in 2022, demonstrating a continuous downward trend. The province’s heavy reliance on traditional industries has increased pressure on its green transformation. Heilongjiang’s green efficiency index dropped sharply from 1.060 in 2005 to 0.252 in 2022, posing significant challenges in promoting green industrial transformation.
Although central and western provinces such as Hubei, Sichuan, and Shaanxi started later, they showed significant improvements in certain years. For instance, Hubei’s green efficiency index reached 0.510 in 2020 and 1.003 in 2022, reflecting the province’s initial achievements in green transformation driven by policy initiatives and the application of green technologies. Provinces like Shaanxi and Sichuan also showed some recovery from 2020 to 2022, primarily due to the gradual introduction of green industries and economic restructuring.
Western provinces such as Qinghai, Tibet, and Xinjiang have maintained relatively low green efficiency indices with considerable fluctuations. For example, Tibet’s green efficiency index declined from 1.086 in 2005 to 0.183 in 2022, almost reaching its lowest point. Xinjiang’s INGE index in 2022 was 0.330, which remains relatively low compared to other provinces.
To examine the robustness of the green efficiency index calculated using the super-efficiency SBM model, this study employs the Malmquist productivity index for comparative analysis. The results show a Pearson correlation coefficient of 0.323 (p < 0.001), indicating a significant positive correlation between the annual national average green efficiency index and the Malmquist total factor index, with consistent overall trends. Further examination reveals that efficiency change (EC) remains relatively stable, with annual national averages ranging from 0.94 to 1.06, whereas technological change (TC) exhibits larger fluctuations, with averages ranging from 0.93 to 1.19, making it the primary driver of variations in the Malmquist total index. These findings suggest that the green efficiency index calculated in this study reliably captures the spatiotemporal evolution of interprovincial INGE and demonstrates robust performance.
Furthermore, we calculated the SFA index, and the results show that Super-SBM and the SFA index are significantly positively correlated, with a Pearson correlation of 0.437 and a Spearman correlation of 0.449 (p < 0.001). Regression analysis also indicates that SFA has a significant positive explanatory effect on Super-SBM (regression coefficient = 1.0419, p < 0.001). These results suggest that the two methods are consistent in measurement direction and overall trend, indicating that the efficiency evaluation results based on the Super-SBM model are robust and reliable.
To further test the robustness of the green industrial efficiency index calculated using the Super-efficiency SBM model, we computed the Super-SBM index using both industrial exhaust emissions and CO2 emissions (Super_SBMco2, where CO2 replaces industrial exhaust). The results show a Pearson correlation of 0.495 (p < 0.001) and a Spearman correlation of 0.696 (p < 0.001) between the two indices, indicating a significant positive correlation in both overall trend and ranking. This demonstrates that substituting CO2 emissions for industrial exhaust does not change the overall conclusions of the efficiency evaluation, further confirming the robustness of the Super-SBM results.
4.2 Spatial changes in INGE in China
As revealed in the previous analysis, there are significant spatial differences in China’s INGE. To more intuitively observe these spatial disparities, we utilized ArcGIS 17.0 for further visualization. Firstly, the INGE index was categorized into five levels using the natural breaks method. The classification criteria are presented in Table 3.

Table 3. Classification of INGE levels.
Overall, the INGE index in China exhibits two peaks, concentrated around the levels of 0.408 and 0.990. Statistical analysis reveals that approximately 35.3% of provinces fall into Level 2, while about 31.0% of provinces are also at Level 2 (Figure 3). Between 2005 and 2014, provinces with relatively low green efficiency (Levels 4 and 5) represented a larger proportion. Starting from 2015, the number of provinces at Level 1 gradually increased, while the number of provinces at Levels 4 and 2 decreased, indicating that some provinces have made progress in improving green efficiency. Notably, between 2020 and 2022, the number of provinces at Level 1 significantly increased to 11, suggesting that China’s green transformation has expanded to more provinces. The number of provinces at Levels 2 and 3 has decreased, indicating that most provinces are progressively improving INGE and advancing toward efficient and sustainable green development.

Figure 3. Statistical distribution of inter-provincial INGE in China.
Figure 4 displays the INGE levels of Chinese provinces from 2005 to 2022, with values ranging from 1 to 5, where higher values represent higher INGE. By comparing the changes in levels across different provinces, the long-term trends of green industrial development and regional disparities can be analyzed. Beijing, Shanghai, and Tibet have consistently maintained the highest level (Level 5), with their INGE leading the country and remaining at a high level for an extended period. Coastal economically developed provinces such as Guangdong, Jiangsu, Zhejiang, and Fujian are generally at Levels 4 or 5, indicating strong industrial green development and widespread application of green technologies. In contrast, western provinces like Qinghai, Ningxia, Gansu, and Xinjiang have consistently remained at Levels 1 or 2, reflecting lower INGE and relatively slow green transformation.

Figure 4. Spatial pattern of INGE index in China.
As noted earlier, the period from 2016 to 2022 witnessed an acceleration in China’s green transformation. Economic provinces like Beijing, Shanghai, Fujian, and Guangdong continued to maintain high levels of INGE. Simultaneously, provinces such as Shaanxi, Yunnan, and Tibet, which had previously been at low-efficiency levels, have gradually moved into the middle-to-high levels, indicating the initial success of industrial transformation. However, resource-dependent and heavy industry-reliant provinces like Heilongjiang, Xinjiang, and Hebei continue to face significant challenges, with little improvement in their green efficiency.
4.3 Spatial correlation analysis of INGE across Chinese provinces
4.3.1 Global spatial autocorrelation analysis
To analyze the spatial clustering of the INGE indices across provinces, a critical spatial matrix was first constructed based on the actual locations of the provinces. Using Equations 2, 3, the Moran’s I index for the period 2005–2022 was calculated for China’s INGE indices, with the results shown in Table 4.

Table 4. Global Moran’s I index of INGE from 2005 to 2022.
From the table, it can be observed that from 2005 to 2011, the Moran’s I index for China’s INGE indices had p-values greater than 0.100, and Z-values were lower than the critical value of 1.65, indicating that the Moran’s I index did not pass the test and the spatial correlation was weak. From 2012 to 2022, the Moran’s I index generally increased, and for most years, the p-values were significant at the 5% level, indicating a significant positive spatial correlation in INGE across provinces. This suggests that neighboring provinces exhibited similar trends in green efficiency. Notably, during 2012–2014, the Moran’s I index peaked (above 0.3), and the p-values were all less than 0.01, suggesting strong spatial autocorrelation and a gradual reduction in regional disparities in green efficiency. In 2020–2022, the Moran’s I index showed slight fluctuations but remained at a high level, and in most years, the p-values were below 0.05, indicating that the spatial autocorrelation of green efficiency remained evident.
Overall, after 2012, the spatial autocorrelation of INGE across China’s provinces gradually increased, demonstrating an enhanced spatial agglomeration. The following factors summarize the reasons for this development, in conjunction with national policy changes. First, policy guidance: since 2010, China has successively implemented three batches of low-carbon city pilot projects. In October 2011, the government officially approved seven provinces and cities, including Beijing, Shanghai, Tianjin, and Shenzhen, to initiate carbon trading pilot projects. Green policies, environmental protection regulations, and related incentive measures have gradually been promoted nationwide, encouraging coordinated development and mutual influence among provinces. Second, technological dissemination: beginning in 2011, the Yangtze River Delta integration facilitated the mutual integration and technology transfer of green industries across provinces. For instance, the experiences of Jiangsu and Zhejiang in green manufacturing and environmental protection industries have been widely adopted by other provinces and cities. The dissemination of green technologies and environmental protection equipment has reduced regional disparities. Third, regional coordination: inter-regional cooperation has strengthened, such as in areas like green energy, environmental protection industries, and the circular economy, promoting collective progress in green development across provinces.
4.3.2 Local spatial autocorrelation analysis
This section utilizes the local Moran’s I index to examine the spatial clustering of INGE between the 31 provinces and their neighboring provinces, and to determine whether spatial clustering or spatial dispersion exists in different periods. The results are shown in Figure 5.
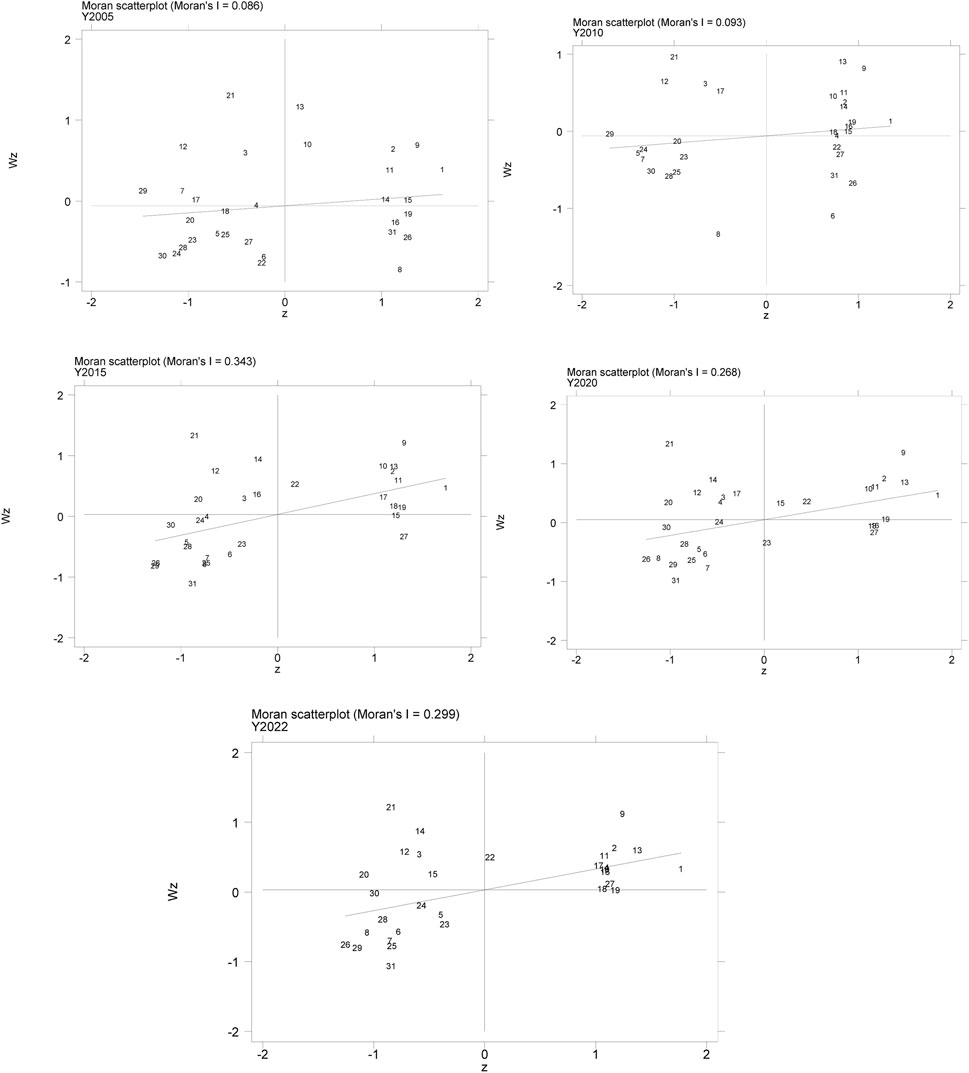
Figure 5. Spatial distribution of provincial INGE local autocorrelation in China. The numbers in this figure represent provinces, and their corresponding codes are shown in Table 2.
Upon observing the Moran’s I index, it is evident that the majority of provinces in China exhibit positive values of the INGE Moran’s I index, indicating a positive correlation with the clustering of neighboring provinces. Specifically, in 2022, 24 provinces (77.4% of all provinces) had a positive Moran’s I index, an increase of 16.1 percentage points compared to 2005. From a spatial distribution perspective, regions such as Shanghai, Zhejiang, and Fujian in the eastern coastal area exhibit significantly positive Moran’s I indices, indicating strong spatial clustering. These regions generally have higher green efficiency, primarily due to advanced green industry policies, technological innovations, and strong market competitiveness. In contrast, provinces in central and western regions, such as Hebei, Guangdong, and Hainan, display stronger spatial dispersion, with notable differences in INGE compared to neighboring provinces. This is mainly due to differences in industrial structures, imbalances in resource allocation, and regional variations in policy implementation.
5 Analysis of the influencing factors of provincial INGE in China
As noted above, interprovincial differences in INGE in China are substantial. Existing literature indicates that the formation of INGE is influenced by multiple factors, drawing on theories from environmental and development economics. First, the Environmental Kuznets Curve (EKC) suggests that early stages of economic development are often accompanied by high pollution levels, whereas environmental efficiency gradually improves with industrial upgrading and the adoption of green technologies (Kaika and Zervas, 2013; Dogan and Inglesi-Lotz, 2020). Second, Porter’s hypothesis posits that appropriate environmental regulation can stimulate technological innovation in firms, thereby enhancing green efficiency (Lanoie et al., 2011; Rubashkina et al., 2015). Third, based on factor endowment and resource-based theories, inputs such as capital, labor, and energy constitute fundamental sources of efficiency differences (Sokoloff and Engerman, 2000; Quang Dao, 2013). In addition, regional innovation system theory emphasizes the critical role of technological efficiency and innovation diffusion in promoting green transformation (Li X. et al., 2023). It can be seen that, according to the theory of green growth, green efficiency is influenced not only by the level of economic development but also constrained by multiple factors such as resource input, technological innovation, industrial structure, and environmental governance. Therefore, this study constructs an analytical framework for INGE (Figure 6), proposing that seven dimensions—industrial governance, economic foundation, factor input, technological efficiency, environmental governance, natural factors, and pollution emissions—comprising 36 specific indicators (Table 5), collectively influence the spatiotemporal evolution of INGE through mechanisms such as institutional constraints, development conditions, resource endowments, and innovation diffusion.

Figure 6. Logical framework of factors influencing INGE.

Table 5. Selection of influencing factors for provincial INGE in China.
To quantitatively identify the impact of these drivers on interprovincial INGE, this study employs the Geodetector method. To reduce the potential bias arising from single-year observations, the period 2005–2022 is divided into six subperiods: 2005–2007, 2008–2010, 2011–2013, 2014–2016, 2017–2019, and 2020–2022. First, each set of indicators is classified using the natural breaks method in ArcGIS. Then, combined with provincial INGE indices, the explanatory power (q-value) of each indicator is calculated based on Equation 5. The results are presented in Figure 5.
Based on the Geodetector analysis (Table 6), the correlation between each dimension and INGE, as well as its temporal evolution, can be quantitatively assessed. Overall, during 2020–2022, industrial governance exhibited the strongest correlation with INGE (q = 1.612), followed by economic foundations (q = 1.153), factor inputs (q = 0.772), technological efficiency (q = 0.637), environmental governance (q = 0.567), natural conditions (q = 0.338), and pollutant emissions (q = 0.239). Since 2005, the correlation of industrial governance has increased by 0.589, representing the largest growth, followed by pollutant emissions (0.125). Industrial governance has consistently ranked first in correlation since 2008, while economic foundations and factor inputs have remained highly correlated, indicating stable associations between these factors and INGE.

Table 6. Driving intensity and ranking of factors influencing interprovincial INGE in China.
Specifically, the correlation of economic foundations has consistently been among the highest across all subperiods, reaching 1.245 in 2017–2019 and ranking second, suggesting a close relationship between the level of economic development and INGE. Factor input correlation was 0.784 in 2005–2007 and gradually increased, peaking at 1.358 during 2014–2016, indicating that labor and capital inputs have increasingly influenced green efficiency. Technological efficiency exhibited relatively stable correlations (medium ranking), suggesting a certain linkage between technological progress and green efficiency, although its strength is lower than that of economic foundations and industrial governance, potentially due to variations in technology maturity and diffusion.
Natural factors showed relatively low and stable correlations (q = 0.184 during 2008–2010, ranked sixth), implying that natural conditions, such as water resources and forest coverage, exert limited short-term influence on INGE. Environmental governance correlations increased markedly from 2008 to 2013, reaching 1.122 during 2011–2013 and ranking second, reflecting the gradual influence of environmental policies and green industrial guidance on INGE. By 2017–2019, environmental governance correlation remained high at 1.110, ranking third, indicating a stable association between governance measures and green efficiency.
Overall, industrial governance, economic foundations, and factor inputs consistently exhibited high correlations across all periods. In 2020–2022, the contribution of industrial governance to INGE correlation reached 30.3%, an increase of 7.3 percentage points compared with 2005. Factors such as industrial agglomeration, industrial upgrading, green finance, and government intervention have become increasingly prominent in their influence on INGE.
Based on the analysis of 36 indicators (Figure 7), the main characteristics and dynamic trends of factors influencing INGE can be summarized.

Figure 7. Impact effects of 36 indicators on interprovincial INGE in China.
First, from a dynamic perspective, the correlation between economic foundation factors and INGE shows a continuously increasing trend. The correlation of per capita GDP (X1) increased from 0.352 to 0.532, indicating that with economic development, the role of digital economy and green technology investment in promoting INGE has gradually become more prominent. The correlation of industrial structure (X2) fluctuates but shows an overall upward trend, reflecting a certain positive association between the increasing share of the service sector and INGE. The correlation of urbanization rate (X3) varies between 0.259 and 0.343, suggesting that infrastructure development and improvements in energy efficiency during urbanization may have a stable link with green efficiency.
Second, the importance of capital and technological inputs has gradually increased. The correlation of capital investment (X6) rose from 0.206 to 0.293, indicating that capital investment in industrial green development is increasingly associated with green technology upgrading and equipment renewal. R&D investment (X10) peaked at 0.296 during 2011–2013 and then declined to 0.130, reflecting a possible lag effect between technological innovation and INGE, with diminishing marginal correlation.
Third, the negative association of pollutant emissions has gradually weakened. Correlations for wastewater (X11), waste gas (X12), and solid waste (X14) emissions are relatively low and show a decreasing trend, indicating that pollution control measures have partially reduced the negative association between pollutant emissions and INGE.
Fourth, the correlations of industrial agglomeration and green finance have become increasingly significant. The correlation of the industrial agglomeration index (X31) remained relatively stable, reaching 0.219 in 2020–2022, suggesting that resource optimization and regional clustering may have a long-term association with INGE. The correlation of the green finance index (X35) increased from 0.050 to 0.261, reflecting the growing role of green finance in supporting energy-saving projects and green technology development.
Regarding indicator categories: Economic development and industrial structure: Per capita GDP (X1), industrial structure (X2), and urbanization rate (X3) show a stable positive correlation with green efficiency over the long term, particularly in later periods. However, economic growth may have a “threshold effect,” whereby the growth in correlation slows after reaching a certain level. Factor inputs and technological innovation: Capital investment (X6) and R&D investment (X10) are significantly correlated with green efficiency, although the marginal correlation of R&D investment decreases, suggesting that the efficiency of technology commercialization still has potential to improve in the green transition. Labor input (X5) shows a relatively low correlation, indicating a limited association between traditional labor-intensive inputs and green efficiency. Resources and environmental governance: Correlations of water resources (X7) and energy inputs (X9) are relatively low, implying that improving resource use efficiency may have a stronger association with green efficiency than merely increasing resource inputs. The negative correlation of pollutant emissions (X11–X14) is weakening, reflecting the increasingly significant role of environmental governance policies in promoting green efficiency. Institutional and policy factors: The correlations of industrial agglomeration (X32) and green finance (X35) have steadily increased, indicating that financial and institutional policies are gradually becoming more influential in industrial green development. Moreover, indicators related to the digital economy show gradually strengthened positive correlations with INGE, suggesting that digital transformation may be one of the key drivers of industrial green development.
To further verify the driving effects of various factors on interprovincial INGE identified by the Geodetector analysis, this study employs the Spatial Durbin Model (SDM) for empirical testing using panel data. The regression results show that the coefficients of most key factors in the SDM align with the directions indicated by the Geodetector analysis, confirming the robustness of their explanatory power. For example, economic foundation indicators (X1: per capita GDP; X2: tertiary industry share), R&D investment (X10), and industrial governance-related indicators (X31: industrial agglomeration; X35: green finance) all exhibit significant positive effects, indicating a stable promoting influence on INGE. Some spatial lag variables are also significant, suggesting the presence of notable spatial spillover effects in INGE. This implies that economic development, industrial upgrading, and green finance investment in surrounding regions can impact local green efficiency through regional linkages. In contrast, coefficients for pollutant emissions (X11–X14) and natural factors (X19–X23) are relatively small or insignificant, consistent with the lower q-values observed in the Geodetector analysis. Overall, the main driving factors identified by the Geodetector are confirmed to be robust in the SDM verification.
6 Main conclusions and outlook
This study is based on panel data from 31 provinces in China from 2005 to 2022. The provincial INGE index is calculated using the super-efficiency SBM model. This section, with the aid of Moran’s index, determines the spatial agglomeration or spatial dispersion phenomenon of provinces during different periods. A total of 36 specific indicators are selected from seven aspects: economic foundation, factor input, pollution emissions, technical efficiency, natural factors, environmental governance, and industrial governance. The geographic detector is used to quantitatively identify the impact effects of each driving factor on the interprovincial INGE in China.
6.1 Main findings
1. Since 2005, China’s interprovincial INGE has generally exhibited a trend of initial increase followed by a slight decline. The efficiency index rose from 0.668 in 2005–2009 to 0.736, then decreased to 0.623 during 2010–2015, and slightly increased to 0.634 in 2016–2022. The improvement in efficiency did not fully align with economic growth, reflecting a lag effect in industrial structural transformation.
2. Significant regional disparities in green efficiency were observed. Eastern coastal provinces (e.g., Beijing, Shanghai, Guangdong, Fujian) consistently ranked at the forefront, whereas resource-dependent and heavy-industrial provinces (e.g., Hebei, Shanxi, Heilongjiang) showed limited improvement. Moran’s I analysis indicates that approximately 77.4% of provinces exhibited positive spatial correlation with neighboring provinces, suggesting gradually increasing spatial clustering. The eastern coastal regions show pronounced spatial agglomeration, whereas some central and western provinces remain spatially dispersed.
3. Industrial governance has the greatest impact on INGE, followed by economic foundation (q = 1.153), factor inputs (q = 0.772), technological efficiency (q = 0.637), environmental governance (q = 0.567), natural factors (q = 0.338), and pollutant emissions (q = 0.239). The effect of economic foundation on green efficiency has continuously strengthened, while the importance of capital and technological investment has notably increased. The negative effects of pollutant emissions have relatively weakened, whereas the positive impacts of industrial agglomeration and green finance have become increasingly significant.
6.2 Policy recommendations
1. Optimize industrial structure and promote green upgrading. Implement green transformation and industrial upgrading in high-pollution sectors based on regional characteristics to narrow the East-Central-West gap and promote coordinated regional development.
2. Strengthen capital and technological investment. Enhance the conversion of scientific research achievements and technological innovation capabilities to increase the endogenous driving force of INGE.
3. Enhance pollution control and environmental regulation. Continue reducing industrial pollutant emissions, improve environmental governance, and further alleviate constraints on green efficiency.
4. Promote industrial agglomeration and green finance. Leverage the effects of industrial clustering and financial instruments to support green technology innovation, achieving coordinated development of regional industrial chains.
6.3 Limitations and future research
This study employed the Geodetector method to examine the spatial heterogeneity and driving factors of China’s interprovincial INGE, revealing the significant roles of industrial governance, economic foundation, and other factors. However, several limitations should be noted:
First, this study adopts the Super-efficiency SBM model, but its inherent limitations are not fully resolved. The super-efficiency SBM may produce efficiency scores that are excessively high and lack comparability; some decision-making units (DMUs) may encounter infeasible solutions in small samples, and the results are sensitive to extreme values. Future studies could cross-validate the results using traditional DEA or SFA methods.
In addition, the geographic detector method itself has certain limitations. On one hand, the results are sensitive to the discretization of variables, and different grouping schemes may lead to variations in explanatory power; on the other hand, multicollinearity among factors may cause overestimation or underestimation of some variables’ explanatory effects. Future research is recommended to employ panel threshold models or machine learning approaches to explore complex nonlinear relationships and interaction effects among factors.
Moreover, although this study has tested the robustness of efficiency evaluation results using CO2 emissions, limitations remain in terms of data availability and coverage, and the selection of input-output indicators still has certain constraints. In the context of carbon neutrality, future research could further incorporate more comprehensive carbon emission data, environmental constraint indicators, and other relevant variables to enhance the scientific rigor and policy relevance of the analysis.
Future research can further expand on this study by analyzing the differentiated effects of various environmental policies on INGE, exploring the mechanisms and nonlinear effects of technological innovation, R&D investment, and green finance on green efficiency, and combining case studies or survey data to conduct more detailed analyses of regional industrial governance and policy implementation effectiveness.
Data availability statement
The original contributions presented in the study are included in the article/supplementary material, further inquiries can be directed to the corresponding author.
Author contributions
JW: Formal Analysis, Data curation, Writing – original draft, Writing – review and editing, Supervision, Project administration. RX: Formal Analysis, Data curation, Writing – original draft, Writing – review and editing. SY: Supervision, Project administration, Writing – review and editing.
Funding
The author(s) declare that no financial support was received for the research and/or publication of this article.
Conflict of interest
The authors declare that the research was conducted in the absence of any commercial or financial relationships that could be construed as a potential conflict of interest.
Generative AI statement
The author(s) declare that no Generative AI was used in the creation of this manuscript.
Any alternative text (alt text) provided alongside figures in this article has been generated by Frontiers with the support of artificial intelligence and reasonable efforts have been made to ensure accuracy, including review by the authors wherever possible. If you identify any issues, please contact us.
Publisher’s note
All claims expressed in this article are solely those of the authors and do not necessarily represent those of their affiliated organizations, or those of the publisher, the editors and the reviewers. Any product that may be evaluated in this article, or claim that may be made by its manufacturer, is not guaranteed or endorsed by the publisher.
References
Bai, Y., Hua, C., Jiao, J., Yang, M., and Li, F. (2018). Green efficiency and environmental subsidy: evidence from thermal power firms in China. J. Clean. Prod. 188, 49–61. doi:10.1016/j.jclepro.2018.03.312
Coelli, T. (1998). A multi-stage methodology for the solution of orientated DEA models. Operations Res. Lett. 23 (3-5), 143–149. doi:10.1016/s0167-6377(98)00036-4
Dellnitz, A., Kleine, A., and Rödder, W. (2018). CCR or BCC: what if we are in the wrong model? J. Bus. Econ. 88 (7), 831–850. doi:10.1007/s11573-018-0906-8
Ding, J., Liu, B., and Shao, X. (2022). Spatial effects of industrial synergistic agglomeration and regional green development efficiency: evidence from China. Energy Econ. 112, 106156. doi:10.1016/j.eneco.2022.106156
Dogan, E., and Inglesi-Lotz, R. (2020). The impact of economic structure to the environmental Kuznets curve (EKC) hypothesis: evidence from European countries. Environ. Sci. Pollut. Res. 27 (11), 12717–12724. doi:10.1007/s11356-020-07878-2
Dong, F., Li, Y., Qin, C., and Sun, J. (2021). How industrial convergence affects regional green development efficiency: a spatial conditional process analysis. J. Environ. Manag. 300, 113738. doi:10.1016/j.jenvman.2021.113738
Fall, F., Akim, A. M., and Wassongma, H. (2018). DEA and SFA research on the efficiency of microfinance institutions: a meta-analysis. World Dev. 107, 176–188. doi:10.1016/j.worlddev.2018.02.032
Fang, K., Li, C., Tang, Y., He, J., and Song, J. (2022). China’s pathways to peak carbon emissions: new insights from various industrial sectors. Appl. Energy 306, 118039. doi:10.1016/j.apenergy.2021.118039
Garrett-Peltier, H. (2017). Green versus brown: comparing the employment impacts of energy efficiency, renewable energy, and fossil fuels using an input-output model. Econ. Model. 61, 439–447. doi:10.1016/j.econmod.2016.11.012
Gu, B., Chen, F., and Zhang, K. (2021). The policy effect of green finance in promoting industrial transformation and upgrading efficiency in China: analysis from the perspective of government regulation and public environmental demands. Environ. Sci. Pollut. Res. 28 (34), 47474–47491. doi:10.1007/s11356-021-13944-0
Gu, R., Li, C., Yang, Y., and Zhang, J. (2023). The impact of industrial digital transformation on green development efficiency considering the threshold effect of regional collaborative innovation: evidence from the Beijing-Tianjin-Hebei urban agglomeration in China. J. Clean. Prod. 420, 138345. doi:10.1016/j.jclepro.2023.138345
Guo, Y., Tong, L., and Mei, L. (2020). The effect of industrial agglomeration on green development efficiency in Northeast China since the revitalization. J. Clean. Prod. 258, 120584. doi:10.1016/j.jclepro.2020.120584
Hameed, J., Huo, C., Albasher, G., and Naeem, M. A. (2024). Revisiting the nexus between financialization and natural resource efficiency through the lens of financial development and green industrial optimization. J. Clean. Prod. 468, 143066. doi:10.1016/j.jclepro.2024.143066
Hjalmarsson, L., Kumbhakar, S. C., and Heshmati, A. (1996). DEA, DFA and SFA: a comparison. J. Prod. Analysis 7 (2), 303–327. doi:10.1007/bf00157046
Hou, J., Teo, T. S., Zhou, F., Lim, M. K., and Chen, H. (2018). Does industrial green transformation successfully facilitate a decrease in carbon intensity in China? An environmental regulation perspective. J. Clean. Prod. 184, 1060–1071. doi:10.1016/j.jclepro.2018.02.311
Huang, Y., Huang, X., Xie, M., Cheng, W., and Shu, Q. (2021). A study on the effects of regional differences on agricultural water resource utilization efficiency using super-efficiency SBM model. Sci. Rep. 11 (1), 9953. doi:10.1038/s41598-021-89293-2
Jiang, X., Ma, J., Zhu, H., Guo, X., and Huang, Z. (2020). Evaluating the carbon emissions efficiency of the logistics industry based on a Super-SBM model and the Malmquist Index from a strong transportation strategy perspective in China. Int. J. Environ. Res. Public Health 17 (22), 8459. doi:10.3390/ijerph17228459
Jiang, J. X., Wang, J. J., and Cheng, Y. (2024). The impact of industrial transformation on green economic efficiency: new evidence based on energy use. Petroleum Sci. 21, 3644–3655. doi:10.1016/j.petsci.2024.03.004
Jin, W., Zhang, H. Q., Liu, S. S., and Zhang, H. B. (2019). Technological innovation, environmental regulation, and green total factor efficiency of industrial water resources. J. Clean. Prod. 211, 61–69. doi:10.1016/j.jclepro.2018.11.172
Kaika, D., and Zervas, E. (2013). The Environmental Kuznets Curve (EKC) theory—Part A: concept, causes and the CO2 emissions case. Energy Policy 62, 1392–1402. doi:10.1016/j.enpol.2013.07.131
Koziarski, M., and Woźniak, M. (2017). CCR: a combined cleaning and resampling algorithm for imbalanced data classification. Int. J. Appl. Math. Comput. Sci. 27 (4), 727–736. doi:10.1515/amcs-2017-0050
Krmac, E., and Mansouri Kaleibar, M. (2023). A comprehensive review of data envelopment analysis (DEA) methodology in port efficiency evaluation. Marit. Econ. and Logist. 25 (4), 817–881. doi:10.1057/s41278-022-00239-5
Lanoie, P., Laurent-Lucchetti, J., Johnstone, N., and Ambec, S. (2011). Environmental policy, innovation and performance: new insights on the Porter hypothesis. J. Econ. and Manag. Strategy 20 (3), 803–842. doi:10.1111/j.1530-9134.2011.00301.x
Li, H., and Shi, J. F. (2014). Energy efficiency analysis on Chinese industrial sectors: an improved Super-SBM model with undesirable outputs. J. Clean. Prod. 65, 97–107. doi:10.1016/j.jclepro.2013.09.035
Li, D., and Zeng, T. (2020). Are China’s intensive pollution industries greening? An analysis based on green innovation efficiency. J. Clean. Prod. 259, 120901. doi:10.1016/j.jclepro.2020.120901
Li, H., Fang, K., Yang, W., Wang, D., and Hong, X. (2013). Regional environmental efficiency evaluation in China: analysis based on the Super-SBM model with undesirable outputs. Math. Comput. Model. 58 (5-6), 1018–1031. doi:10.1016/j.mcm.2012.09.007
Li, G., Li, X., and Huo, L. (2023a). Digital economy, spatial spillover and industrial green innovation efficiency: empirical evidence from China. Heliyon 9 (1), e12875. doi:10.1016/j.heliyon.2023.e12875
Li, X., Wang, R., Shen, Z. Y., and Song, M. (2023b). Green credit and corporate energy efficiency: enterprise pollution transfer or green transformation. Energy 285, 129345. doi:10.1016/j.energy.2023.129345
Lin, B., and Wang, C. (2024). Does industrial relocation affect green total factor energy efficiency? Evidence from China's high energy-consuming industries. Energy 289, 130002. doi:10.1016/j.energy.2023.130002
Liu, X., Wang, C. A., Wu, H., Yang, C., and Albitar, K. (2023). The impact of the new energy demonstration city construction on energy consumption intensity: exploring the sustainable potential of China's firms. Energy 283, 128716. doi:10.1016/j.energy.2023.128716
Liu, B., Wang, Y., Jiang, N., and Zhang, X. (2024). The impact of digital industrialization and industrial digitalization on regional green innovation efficiency in China-From the perspective of the innovation value chain. J. Clean. Prod. 478, 144015. doi:10.1016/j.jclepro.2024.144015
Lotfi, F. H., Jahanshahloo, G. R., Ebrahimnejad, A., Soltanifar, M., and Mansourzadeh, S. M. (2010). Target setting in the general combined-oriented CCR model using an interactive MOLP method. J. Comput. Appl. Math. 234 (1), 1–9. doi:10.1016/j.cam.2009.11.045
Lu, P., Li, Z., and Wu, H. (2024). Investigating the effects of industrial transformation and agglomeration on industrial eco-efficiency for green development: evidence from enterprises in the Yangtze River Economic Belt. J. Clean. Prod. 479, 143949. doi:10.1016/j.jclepro.2024.143949
Miao, C. L., Duan, M. M., Zuo, Y., and Wu, X. Y. (2021). Spatial heterogeneity and evolution trend of regional green innovation efficiency--an empirical study based on panel data of industrial enterprises in China's provinces. Energy Policy 156, 112370. doi:10.1016/j.enpol.2021.112370
Moran, N. A., McCutcheon, J. P., and Nakabachi, A. (2008). Genomics and evolution of heritable bacterial symbionts. Annu. Rev. Genet. 42 (1), 165–190. doi:10.1146/annurev.genet.41.110306.130119
Nazarko, J., and Šaparauskas, J. (2014). Application of DEA method in efficiency evaluation of public higher education institutions. Technol. Econ. Dev. Econ. 20 (1), 25–44. doi:10.3846/20294913.2014.837116
Ouyang, Y., Ye, F., and Tan, K. (2022). The effect of strategic synergy between local and neighborhood environmental regulations on green innovation efficiency: the perspective of industrial transfer. J. Clean. Prod. 380, 134933. doi:10.1016/j.jclepro.2022.134933
Quang Dao, M. (2013). Factor endowment, human capital, and inequality in developing countries. J. Econ. Stud. 40 (1), 98–106. doi:10.1108/01443581311283538
Rubashkina, Y., Galeotti, M., and Verdolini, E. (2015). Environmental regulation and competitiveness: empirical evidence on the Porter Hypothesis from European manufacturing sectors. Energy policy 83, 288–300. doi:10.1016/j.enpol.2015.02.014
Shuai, S., and Fan, Z. (2020). Modeling the role of environmental regulations in regional green economy efficiency of China: empirical evidence from super efficiency DEA-Tobit model. J. Environ. Manag. 261, 110227. doi:10.1016/j.jenvman.2020.110227
Sokoloff, K. L., and Engerman, S. L. (2000). History lessons: institutions, factor endowments, and paths of development in the new world. J. Econ. Perspect. 14 (3), 217–232. doi:10.1257/jep.14.3.217
Sun, Y., and Zhou, C. (2024). Which works better? Comparing the multiple effects of heterogeneous environmental regulations on urban green economic transformation in China. J. Environ. Manag. 368, 122124. doi:10.1016/j.jenvman.2024.122124
Sun, F., Guo, J., Huang, X., Shang, Z., and Jin, B. (2024). Spatio-temporal characteristics and coupling coordination relationship between industrial green water efficiency and science and technology innovation: a case study in China. Ecol. Indic. 159, 111651. doi:10.1016/j.ecolind.2024.111651
Tao, X., Wang, P., and Zhu, B. (2016). Provincial green economic efficiency of China: a non-separable input–output SBM approach. Appl. Energy 171, 58–66. doi:10.1016/j.apenergy.2016.02.133
Uche, E., Das, N., and Ngepah, N. (2024). Green environments reimagined through the lens of green finance, green innovations, green taxation, and green energies. Wavelet quantile correlation and rolling window-based quantile causality perspective. Renew. Energy 228, 120650. doi:10.1016/j.renene.2024.120650
Wang, M. L. (2023). Effects of the green finance policy on the green innovation efficiency of the manufacturing industry: a difference-in-difference model. Technol. Forecast. Soc. Change 189, 122333. doi:10.1016/j.techfore.2023.122333
Wang, C., and Lin, B. (2024). Does industrial relocation impact green economic efficiency? Evidence from China’s energy-intensive industries. Res. Int. Bus. Finance 70, 102362. doi:10.1016/j.ribaf.2024.102362
Wang, X., and Wang, Q. (2021). Research on the impact of green finance on the upgrading of China's regional industrial structure from the perspective of sustainable development. Resour. Policy 74, 102436. doi:10.1016/j.resourpol.2021.102436
Wang, K., Wang, Y., Sun, Y., Guo, S., and Wu, J. (2016). Green industrial internet of things architecture: an energy-efficient perspective. IEEE Commun. Mag. 54 (12), 48–54. doi:10.1109/mcom.2016.1600399cm
Wang, H. J., Zheng, M. Q., Yin, H. T., and Chang, C. P. (2024). Green innovation, industrial structure and urban eco-efficiency in Chinese cities. Econ. Analysis Policy 82, 1011–1024. doi:10.1016/j.eap.2024.04.028
Xie, H., Chen, Q., Lu, F., Wang, W., Yao, G., and Yu, J. (2019). Spatial-temporal disparities and influencing factors of total-factor green use efficiency of industrial land in China. J. Clean. Prod. 207, 1047–1058. doi:10.1016/j.jclepro.2018.10.087
Xiu, J., Zang, X., Piao, Z., Li, L., and Kim, K. (2023). China’s low-carbon economic growth: an empirical analysis based on the combination of parametric and nonparametric methods. Environ. Sci. Pollut. Res. 30 (13), 37219–37232. doi:10.1007/s11356-022-24775-y
Xu, J. J., Wang, H. J., and Tang, K. (2022). The sustainability of industrial structure on green eco-efficiency in the Yellow River Basin. Econ. Analysis Policy 74, 775–788. doi:10.1016/j.eap.2022.04.002
Xuan, S., Ge, W., Yang, P., and Zhang, Y. (2024). Exploring digital finance, financial regulations and carbon emission nexus: new insight from resources efficiency, industrial structure and green innovation in China. Resour. Policy 88, 104452. doi:10.1016/j.resourpol.2023.104452
Yang, M., Ma, L., Gu, Y., and Wu, W. (2025). The impacts of green bonds on the green innovation: evidence from the corporate green transformation in China. Emerg. Mark. Rev. 65, 101252. doi:10.1016/j.ememar.2025.101252
Yao, X., Feng, W., Zhang, X., Wang, W., Zhang, C., and You, S. (2018). Measurement and decomposition of industrial green total factor water efficiency in China. J. Clean. Prod. 198, 1144–1156. doi:10.1016/j.jclepro.2018.07.138
Yu, X. (2023). An assessment of the green development efficiency of industrial parks in China: based on non-desired output and non-radial DEA model. Struct. Change Econ. Dyn. 66, 81–88. doi:10.1016/j.strueco.2023.04.010
Yu, J., Zhou, K., and Yang, S. (2019). Regional heterogeneity of China's energy efficiency in “new normal”: a meta-frontier Super-SBM analysis. Energy Policy 134, 110941. doi:10.1016/j.enpol.2019.110941
Yuan, H., Feng, Y., Lee, C. C., and Cen, Y. (2020). How does manufacturing agglomeration affect green economic efficiency? Energy Econ. 92, 104944. doi:10.1016/j.eneco.2020.104944
Zhou, C., Shi, C., Wang, S., and Zhang, G. (2018). Estimation of eco-efficiency and its influencing factors in Guangdong province based on Super-SBM and panel regression models. Ecol. Indic. 86, 67–80. doi:10.1016/j.ecolind.2017.12.011
Zhang, N., and Choi, Y. (2013). Environmental energy efficiency of China's regional economies: a non-oriented slacks-based measure analysis. Soc. Sci. J. 50 (2), 225–234. doi:10.1016/j.soscij.2013.01.003
Zhang, J., Zeng, W., Wang, J., Yang, F., and Jiang, H. (2017). Regional low-carbon economy efficiency in China: analysis based on the Super-SBM model with CO2 emissions. J. Clean. Prod. 163, 202–211. doi:10.1016/j.jclepro.2015.06.111
Zhang, A., Deng, R., and Wu, Y. (2022a). Does the green credit policy reduce the carbon emission intensity of heavily polluting industries? Evidence from China's industrial sectors. J. Environ. Manag. 311, 114815. doi:10.1016/j.jenvman.2022.114815
Zhang, L., Ma, X., Ock, Y. S., and Qing, L. (2022b). Research on regional differences and influencing factors of Chinese industrial green technology innovation efficiency based on dagum gini coefficient decomposition. Land 11 (1), 122. doi:10.3390/land11010122
Zhang, J., Yu, C. H., Zhao, J., and Lee, C. C. (2025). How does corporate digital transformation affect green innovation? Evidence from China's enterprise data. Energy Econ. 142, 108217. doi:10.1016/j.eneco.2025.108217
Zhao, R., Zhan, L., Yao, M., and Yang, L. (2020). A geographically weighted regression model augmented by Geodetector analysis and principal component analysis for the spatial distribution of PM2. 5. Sustain. Cities Soc. 56, 102106. doi:10.1016/j.scs.2020.102106
Zhong, K., Wang, Y., Pei, J., Tang, S., and Han, Z. (2021). Super efficiency SBM-DEA and neural network for performance evaluation. Inf. Process. and Manag. 58 (6), 102728. doi:10.1016/j.ipm.2021.102728
Zhong, S., Peng, L., Li, J., Li, G., and Ma, C. (2023). Digital finance and the two-dimensional logic of industrial green transformation: evidence from green transformation of efficiency and structure. J. Clean. Prod. 406, 137078. doi:10.1016/j.jclepro.2023.137078
Zhu, B., Zhang, M., Zhou, Y., Wang, P., Sheng, J., He, K., et al. (2019). Exploring the effect of industrial structure adjustment on interprovincial green development efficiency in China: a novel integrated approach. Energy Policy 134, 110946. doi:10.1016/j.enpol.2019.110946
Zhu, L., Meng, J., and Zhu, L. (2020). Applying Geodetector to disentangle the contributions of natural and anthropogenic factors to NDVI variations in the middle reaches of the Heihe River Basin. Ecol. Indic. 117, 106545. doi:10.1016/j.ecolind.2020.106545
Zhu, L., Luo, J., Dong, Q., Zhao, Y., Wang, Y., and Wang, Y. (2021). Green technology innovation efficiency of energy-intensive industries in China from the perspective of shared resources: dynamic change and improvement path. Technol. Forecast. Soc. Change 170, 120890. doi:10.1016/j.techfore.2021.120890
Keywords: super-efficiency SBM model, industrial green efficiency, digital economy, spatial pattern, industrial governance, sustainable development
Citation: Wang J, Xu R and Ye S (2025) Spatiotemporal evolution characteristics and influencing factors of China’s interprovincial industrial green efficiency based on the super-efficiency SBM model. Front. Environ. Sci. 13:1625233. doi: 10.3389/fenvs.2025.1625233
Received: 08 May 2025; Accepted: 29 September 2025;
Published: 21 October 2025.
Edited by:
Cunyi Yang, Sun Yat-sen University, ChinaReviewed by:
Liang Li, Nanjing University of Information Science and Technology, ChinaJinpei Li, Beijing University of Chemical Technology, China
Mohammad Fazle Rabbi, University of Debrecen, Hungary
Sonia Sattar, Punjab Group of Colleges, Pakistan
Lei Zhuang, Nanjing Tech University, China
Copyright © 2025 Wang, Xu and Ye. This is an open-access article distributed under the terms of the Creative Commons Attribution License (CC BY). The use, distribution or reproduction in other forums is permitted, provided the original author(s) and the copyright owner(s) are credited and that the original publication in this journal is cited, in accordance with accepted academic practice. No use, distribution or reproduction is permitted which does not comply with these terms.
*Correspondence: Shanshan Ye, bXRoaWNoYXU1MEBnbWFpbC5jb20=