 Julio César da Silva
 Jefferson Rodrigues Maciel
- 1Universidade Federal Rural de Pernambuco, Recife, Pernambuco, Brazil
- 2Jardim Botânico do Recife, Prefeitura da Cidade do Recife, Recife, Pernambuco, Brazil
Plants respond to climate change through shifts in traits such as height, leaf width, and flowering time. However, little is known about how grass species in semiarid ecosystems are responding. In this study, we tested three hypotheses: (1) grass species are experiencing shifts in their vegetative and reproductive organs through time, (2) precipitation is the primary driver of these morphological shifts, and (3) the reproductive period of annual grasses changes through years in the Brazilian semiarid region. We analyzed morphological and phenological data from 590 herbarium specimens of four annual grass species collected between 1859 and 2022, along with climate data from 1960 onwards. Using simple and multiple linear regressions, we assessed relationships between morphological, phenological, climatic, and temporal variables. We tested changes in phenological synchronicity related to two periods of land use alterations. Our results revealed morphological changes throughout 1859-2022: three species showed reductions in plant height, two species exhibited shorter leaves and inflorescences, and one species presented smaller spikelets. Phenological times were delayed with increasing temperatures, although no consistent directional change in reproductive phenology was observed over the last 163 years. We also found a reduction in phenological synchronicity correlated with increasing land use shift. These findings contribute to understanding morphological and phenological shifts of grasses from semiarid ecosystems in parallel to climate and land use changes.
1 Introduction
Ocean and earth surface temperatures have been continuously increasing since 1850 as a result of global warming caused by climate change (Masson-Delmotte et al., 2022). Consequently, climate change modifies the environments and the way that organisms respond to explore the resources (Nicotra et al., 2010). Common morphological responses of plants to climate change include shifts in height and leaf traits (Guerin et al., 2012; Leger, 2013). Experimental studies have demonstrated an association among shifts in height and leaf traits with changes in temperature and precipitation, as predicted by climate change (Everingham et al., 2024; Quan et al., 2024; Henn et al., 2018; Hovenden et al., 2008; Liancourt et al., 2015; Nicotra et al., 2008). Likewise, phenological changes are associated with temperature, precipitation, and climate change (Cleland et al., 2007; Parmesan and Yohe, 2003; Primack et al., 2009; Primack et al., 2004; Plos et al., 2024; Karthikeyan et al., 2025).
A new research agenda has explored the potential of herbarium data to demonstrate the relationships of climate change with morphological and phenological variation (Miller-Rushing et al., 2004; Hufft et al., 2018; Jones and Daehler, 2018; Meineke et al., 2018; Lang et al., 2019; Lima et al., 2021; Davis, 2023; Swain and Chakraborty, 2024; Karthikeyan et al., 2025). For example, h erbaria samples of Dodonaea viscosa (L.) Jacq. presented a 2 mm narrowing of leaves between 1880 and 2000, which was consistent with a temperature increase of 1.2 °C in Australia (Guerin et al., 2012). In another case, Leger (2013) reported that several annual plants have experienced height reductions in the last 100 years in the United States, while at the same time, temperatures have increased. Primack et al. (2004) were the first authors to relate meteorological data with flowering times using herbarium samples over a period of 100 years and to find changes in the flowering times associated with increased temperatures in spring. Based on herbarium samples, Munson and Long (2017) explored the phenology of grasses from the western United States and reported that functional groups present divergent responses to increases in temperature. Herbarium samples also detected changes in phenological synchronicity in tropical species of shrubs and trees (Karthikeyan et al., 2025).
Despite the recent accumulation of evidence indicating shifts in plant organs and phenological dynamics in response to climate change, the debate on whether every region or every plant group is affected in the same way is still a matter of interest. A gap in this knowledge is related to the morphological and phenological responses of grass species from semiarid ecosystems. The Brazilian semiarid region stands out as one of the places that has been most affected by climate change worldwide, with reduced precipitation that has provoked severe droughts, leading to a significant reduction in hydric resources in the region (Bernstein et al., 2008). Temperatures could reach 1.5 °C–5 °C until the end of the 21st century in the Brazilian semiarid region according to climate change projections (Marengo et al., 2017; Torres et al., 2017).
Irregular interannual rainfall in the Brazilian semiarid favors plants that are adapted to rapid reproductive cycles (Corrêa et al., 2019). Thus, because of their capacity for flowering and fruiting during the short and irregular rainy season, annual species predominate in herbaceous strata of the typical vegetation of the region—a seasonal dry tropical forest called caatinga (Amorim et al., 2009; Oliveira et al., 2013; Moro et al., 2014; 2016). Annual species are more sensitive to the effects of climate change because they easily react to exogenous factors of floral induction, such as the photoperiod, precipitation, and temperature, because of their short life cycle (Calinger et al., 2013; Munson and Long, 2017). The rich herbaceous strata of the caatinga offer protection and shade to the soil, which is essential to help tree seeds germinate (Reis et al., 2006; Vieira and Scariot, 2006), but land-use change jeopardizes the ecosystem service provided by the herbaceous strata of the Brazilian semiarid.
Monitoring of vegetation cover in the Brazilian semiarid began in 1985, when 70% of the region’s natural vegetation remained (Beuchle et al., 2015; Franca Rocha et al., 2024). Since then, annual monitoring has shown a significant reduction of caatinga vegetation, with the most recent data indicating that only 59% of the original vegetation cover remains in the region (MapBiomas, 2025). Most of this drastic reduction in recent decades occurred because agricultural lands replaced a significant portion of the caatinga (Beuchle et al., 2015; Silva et al., 2017; Silva and Barbosa, 2017; Franca Rocha et al., 2024). Land use shifts can reduce the size of morphological traits and promote phenological asynchrony or delays (Bertin, 2008; Guerin et al., 2012; Leger, 2013; Tavares et al., 2019; Fahnestock and Detling, 2009; Parker, 2021; Plos et al., 2024).
Among the herbaceous vegetation of the semiarid region of Brazil, Poaceae is one of the richest plant families, especially in open and anthropized areas (Oliveira et al., 2013; Moro et al., 2014; 2016). In the Brazilian semiarid, annual species of Poaceae have a reproductive period restricted to 30–90 days (Andrade et al., 2007; Ferreira et al., 2009; Maciel et al., 2009; Oliveira et al., 2013). Poaceae species demonstrate sensitivity to fluctuations in temperature and precipitation (Munson and Long, 2017). This sensitivity is partly due to the superficial radicular systems and short annual life cycles that improve the ability of species of this family to react to climatic variations (Knapp and Smith, 2001). Therefore, Poaceae species can match their growth and reproductive patterns with adaptations to environmental and climatic changes, hence becoming one of the groups that is most likely to resist climate change (Munson and Long, 2017). However, whether Poaceae species have undergone morphological shifts over century-long climate change time scales remains controversial.
Here, we examined the morphological and phenological variation of four grass species from the Brazilian semiarid. Our objective was to assess whether morphological and phenological variations track climate change using herbarium data to compare shifts in plant organs and reproductive peaks throughout 1859 to 2022. In addition, interactions of climate, geographical, and land-use with morphological and phenological changes were investigated. To explore the gaps presented here, we test the following hypotheses in this study: (1) grass species are experiencing shifts in their vegetative and reproductive organs through time, (2) precipitation is the main driver of morphological shifts, and (3) the reproductive period of annual grasses changes through years in the Brazilian semiarid region.
2 Materials and methods
2.1 Study area
The semiarid region of Brazil (Figure 1) has a tropical climate that is characterized by high temperatures (mean annual temperature of 27 °C) and annual precipitation amounts less than 800 mm, which is irregularly distributed over long periods of drought (Silva et al., 2017). In almost all regions, the rainy season occurs in the summer, between December and April, except in the west, where rains can start in November (Silva et al., 2017; Queiroz et al., 2017). In the Brazilian semiarid region, the caatinga is the main type of vegetation, where more than 4900 species have been recorded (Filardi et al., 2022; Moro et al., 2014; 2016; Queiroz et al., 2017). Fabaceae, Poaceae, Euphorbiaceae, Bromeliaceae, and Cactaceae dominate in terms of the number of species and landscape formation (Moro et al., 2014; 2016). This vegetation is characterized by a spiny seasonal forest surrounded by an herbaceous stratum that can vary in density according to climate and soil conservation (Loiola et al., 2012).
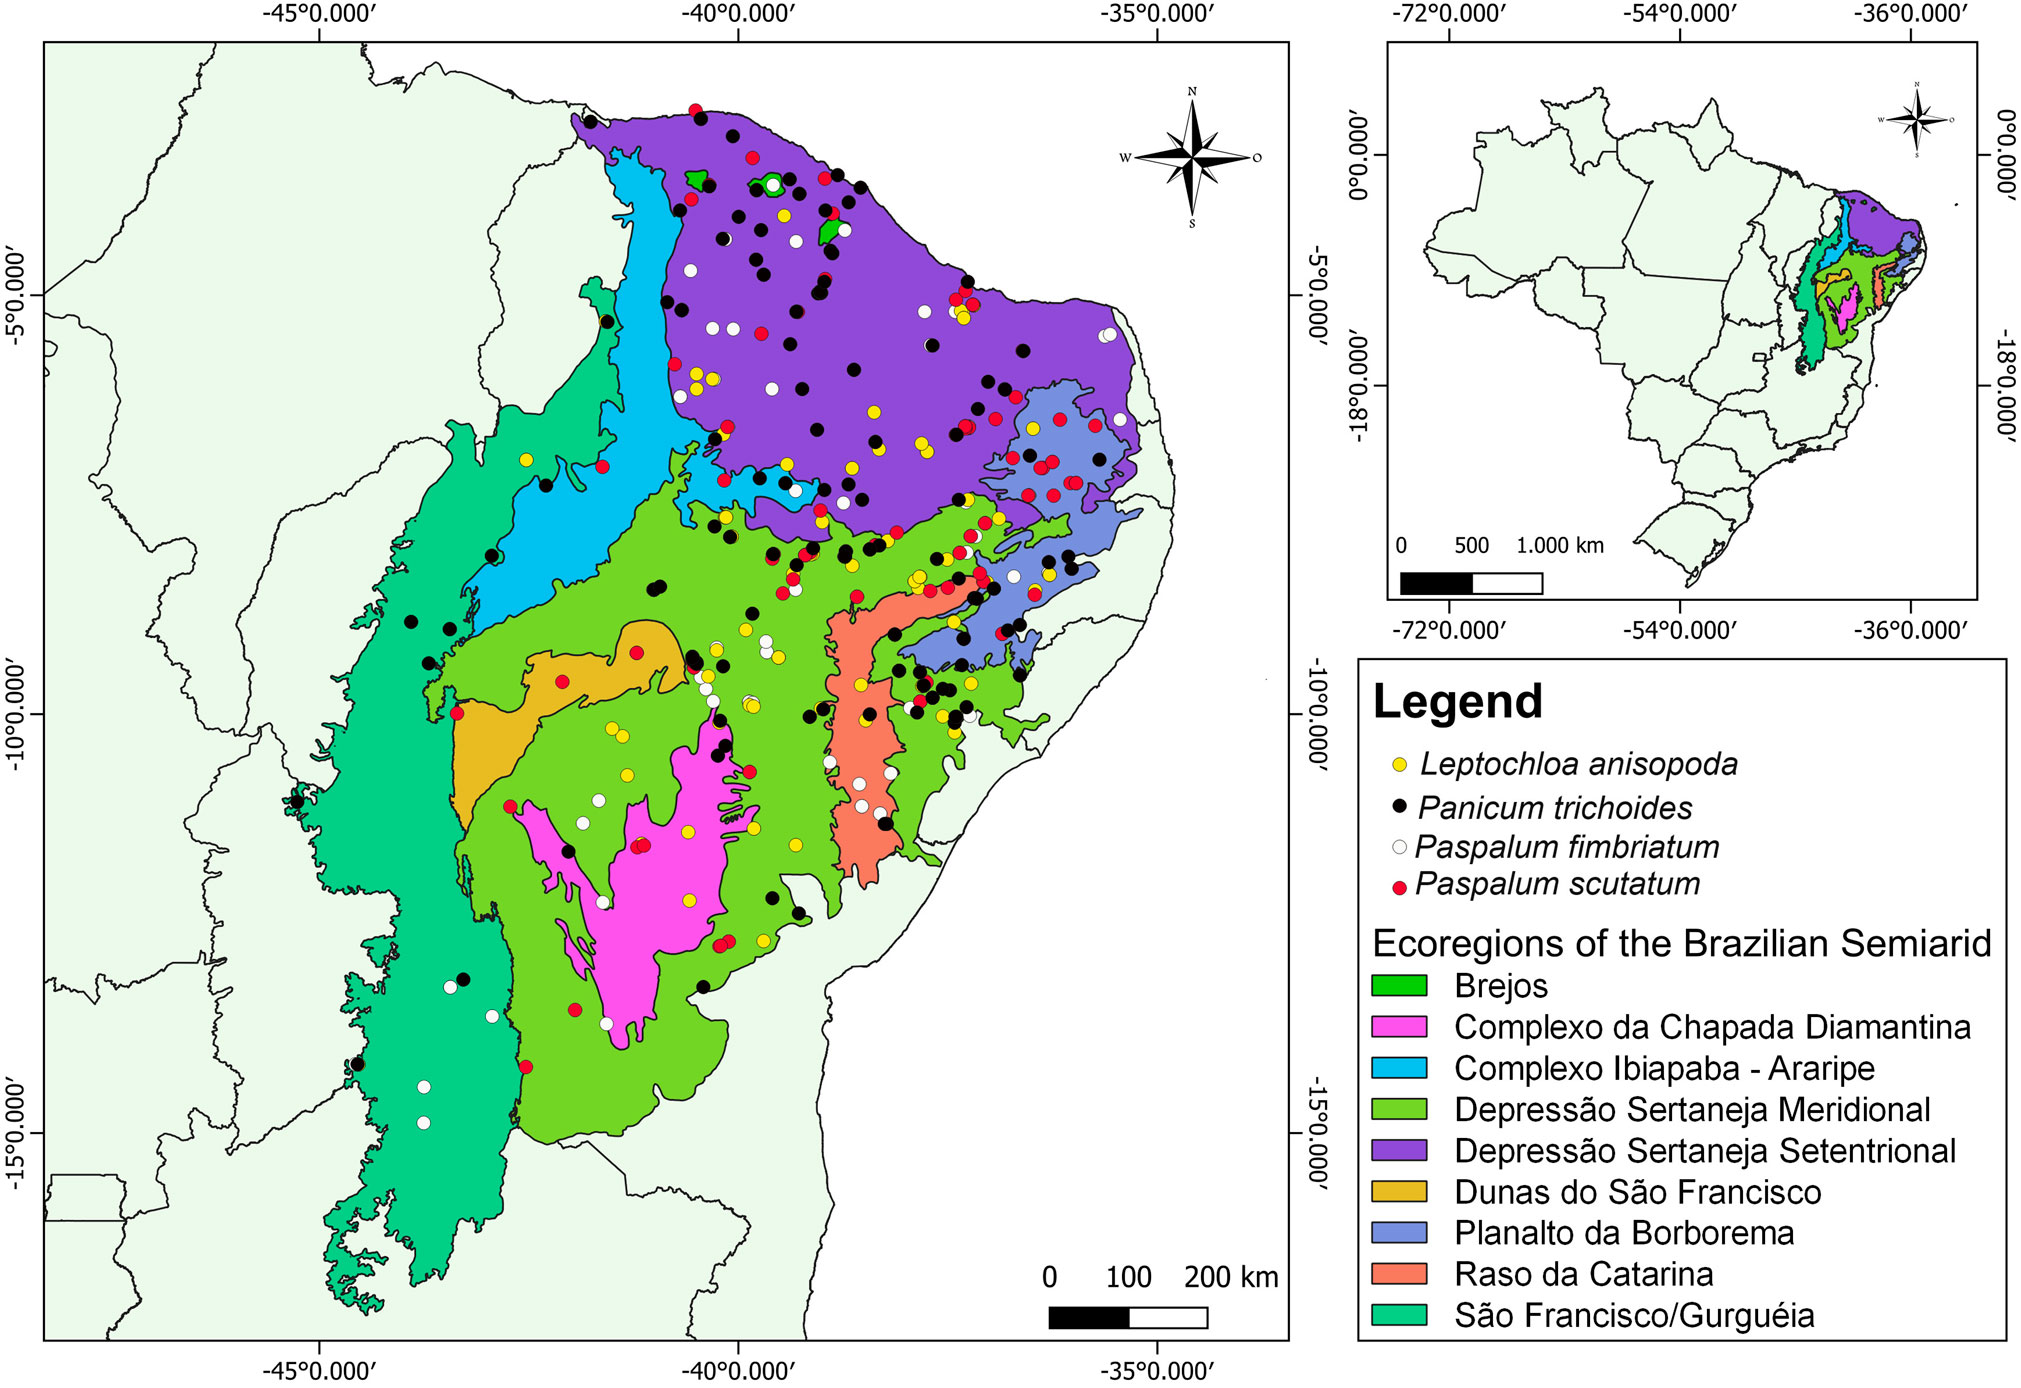
Figure 1. Map of geographical distribution of Leptochloa anisopoda, Panicum trichoides, Paspalum fimbriatum and Paspalum scutatum in the Brazilian semiarid. Occurrence data based on the geographical information provided in the sheets of herbarium samples. Climatic data for each sample were collected from the closest meteorological station of each occurrence dot.
2.2 Morphological and phenological data
To test the hypotheses, we selected four annual grass species as biological models: Leptochloa anisopoda (B.L. Rob.) P.M.Peterson, Panicum trichoides Swart, Paspalum fimbriatum Kunth, and Paspalum scutatum Nees ex Trin. (Figure 2). These species were selected because 1) they are annual species; 2) they are widespread in the Brazilian semiarid (Figure 2); 3) their collections have a significant amount of samples; and 4) their collections start in the 19th century and fit the objective of testing variation through time. Leptochloa anisopoda and P fimbriatum are present in other semiarid regions of South America, but records show that their occurrence is predominant in the Brazilian semiarid (Maciel et al., 2009; Maciel and Valls, 2020). P. trichoides is widely distributed in North, Central, and South America (Andrade et al., 2007). P. scutatum is an endemic species from the Brazilian semiarid (Maciel et al., 2009).
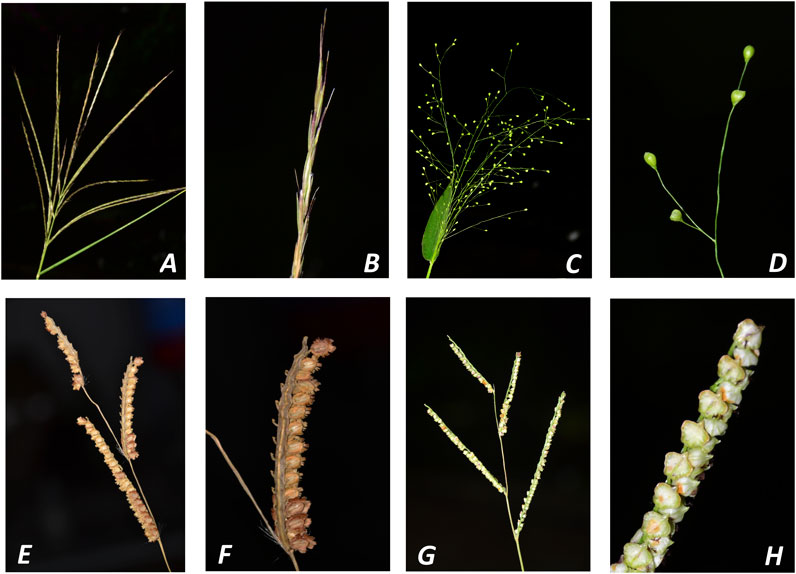
Figure 2. S pecies selected for the research. (A,B). Leptochloa anisopoda A: Inflorescence, B: spikelets (C,D). Panicum trichoides C: Inflorescence; D spikelets (E,F). Paspalum fimbriatum. E: Inflorescence; F: spikelets (G,H): Paspalum scutatum G: Inflorescence ; H: spikelets.
We collected the data from 590 samples (L. anisopoda = 142, P. trichoides = 163, P. fimbriatum = 136, and P. scutatum = 149) in the Brazilian herbaria (e.g., IPA, PEUFR, and UFP) and from the digital collections of Specieslink, Reflora, and the Smithsonian National Museum of Natural History. The samples included the timeframe between 1859 and 2022. We recorded the geographic coordinates of each sample when available and for specimens without geographic coordinates, we used the collection site description to assign the geographic coordinate of the municipality centroid. Samples with very imprecise location descriptions were removed from the database for morphological and phenological analyses.
For morphological measurements, we selected specimens with complete representation of the root systems, leaves, and inflorescence. Exsiccatae with signs of grazing, trampling, and leaf herbivory were not measured, even when morphologically complete. We then measured plant heights (measured from the base of the culm to the tip of the inflorescence); leaf lengths (as only the measure of the leaf blade); inflorescence lengths (measured from the first raceme to the tip of the last raceme); and spikelet lengths (from the base of the spikelet at the apex). All measurements were recorded manually for herbarium samples and with ImageJ software (v1.53e; National Institutes of Health, USA; https://imagej.nih.gov/ij/), as described by Schneider et al. (2012), for digital exsiccatae.
We also obtained the date of collection of exsiccatae to calculate the day of the year for each sample (Day 1 = January 1 in the year of collection). Samples with incomplete information on the date of collection were removed from the analyses. Grasses are often collected during flowering and fruiting periods, especially annual grasses that have their lifecycle restricted to the short rainy season in the Brazilian semiarid region, which lasts between 30 and 90 days (Andrade et al., 2007; Ferreira et al., 2009; Maciel et al., 2009; Oliveira et al., 2013). Therefore, we considered only one phenophase for analyses, which is named the reproductive period and represents the flowering and fruiting window of the four species.
2.3 Climatic data
We collected data on the monthly mean precipitation; mean, maximum, and minimum monthly temperatures, starting in 1960, from 94 conventional and automatic meteorological stations in the Brazilian semiarid region from the database of the Instituto Nacional de Meteorologia (BDMEP-INMET). We used the collection date and location of the exsiccatae as parameters to select the meteorological stations to extract climate data. We also used the altitudes of each sample to select the meteorological stations to reduce the altitudinal effects of climate variations in the data. Importantly, the limitation of meteorological data in the Brazilian semiarid region (available only from 1960 onward) does not interfere with the climate-specimen correlation analysis, as this analysis covers a significant period of 62 years (1960–2022). Accordingly, the inclusion of exsiccate data from as early as 1859 was essential to evaluate the plant morphological responses over the observed years, using the variable “year” as an explanatory factor in the linear regression model.
In order to verify whether the main effects of climate change are occurring alongside 1960-2020 in the Brazilian semiarid, we applied Mann-Kendall and Tau tests to search for signals of significant temporal trend of mean annual temperature and mean annual precipitation during the 62 years. Tau tests were also utilized to find the correlation between the two climatic variables and geographic variables.
2.4 Data analysis
Continuously increasing global temperatures since 1850 are the main evidence of climate change (Masson-Delmotte et al., 2022). Therefore, a temporal analysis of morphological and phenological variation has the potential to reveal a correlation between climate change and the structural and reproductive behavior of plants. We used the entire period of sample collection (1859–2020) for performing linear models of the year of collection to explore the potential morphological (plant heights, leaf lengths, leaf widths, inflorescence lengths, and spikelet lengths) and phenological (day of year) shifts in Brazilian semiarid grasses through time. For each model, we calculated the effect size of the year of collection and estimated the confidence interval of the regression coefficient after fitting the model with 5,000 bootstraps.
In order to evaluate whether spatial or climate variables explain the morphological and phenological variation better than the year of collection, we built multiple regression models for each morphological variable and for the day of the year. For these multiple regression analyses, we used the 1960-2020 time frame because of the availability of climate data. However, we tested several spatial and temporal assumptions of the dataset before running the multiple regression models.
To identify potential collinearity among the predictor variables, we performed a Pearson correlation analysis and used a correlation index >0.5 as threshold to select the most independent variables. Next, we applied Moran’s I spatial autocorrelation with 10-class distance to inspect the spatial distribution of each predictor variable. We also evaluated the interannual correlation of longitude, latitude, monthly precipitation, and temperature (monthly mean, minimum and maximum) applying partial autocorrelation analysis with a maximum number of lags limited to ten. The stationarity of the time series for monthly mean precipitation, mean, maximum, and minimum monthly temperatures was verified with the Augmented Dickey-Fuller test. All these preparatory tests were performed independently for each species.
We included, latitude, monthly precipitation, monthly temperature and collection year as predictor variables to build the full models of morphological analyses and longitude, latitude, mean annual precipitation, and temperature for phenological analyses. We performed a stepwise backward-forward model selection to remove non-informative variables from the final model. Next, we assessed the possibility of multicollinearity between the variables of the final model by variance-inflation factors. Then, we calculated the effect size of each variable in the final model. To estimate the confidence interval of the regression coefficient, we fitted the selected model with 5,000 bootstraps. In order to assess the impact of spatial autocorrelation on the model, we calculated Moran’s I of the model residuals with 100 distance classes.
Expansion of agricultural lands replaced a significant part of the natural cover of Brazilian semiarid since 1985. This change in land use may mask the historical effect of climate change on the morphology and phenology of species. Therefore, we divided the morphological and phenological data of the species into two groups to represent the period when the caatinga still preserved more than 70% of its original vegetation (pre-1985) versus the period when the caatinga was reduced to less than 59% (post-1985). To assess statistically significant changes in the morphological data, we performed Kruskal–Wallis tests for each of the morphological variables. For changes in phenology, we assessed the synchronicity of phenology between the two periods. Since our data only include the day of the year on which each fertile sample was collected, we used this date as the reproductive peak for three different period length scenarios: 1) 30-day scenario; 2) 60-day scenario; 3) 90-day scenario. We then calculated the Augspurger phenological synchronicity index for each scenario. Significant differences in synchronicity between pre and post-1985 were assessed with Kruskal–Wallis tests.
All analyses were performed in the Statistical Environment R using the packages letsR (Vilela and Villalobos, 2015), aTSA (Qiu, 2024), boot (Canty and Ripley, 2025), MASS (Venables and Ripley, 2002), car (Fox and Weisberg, 2019), effectsize (Ben-Shachar et al., 2020) and AugspurgerIndex (Benkendorf, 2023). Datasets and R-codes used to produce our results are available in the Supplementary Material.
3 Results
3.1 Climatic changes and preliminary analyses
Temperatures increased significantly in the semiarid region of Brazil between 1960 and 2021 (Figure 3). The mean temperature increased by 1.89 °C (tau = 0.57, z = 6.56, P < 0.001), the minimum temperature was 1.54 °C higher (tau = 0.60, z = 6.86, P < 0.001), and the maximum temperature increased by 2.05 °C (tau = 0.56, z = 6.36, P < 0.001). Mean annual precipitation presented a trend to reduction, but without significance (tau = −0.11, z = −1.22, P = 0.2244042).
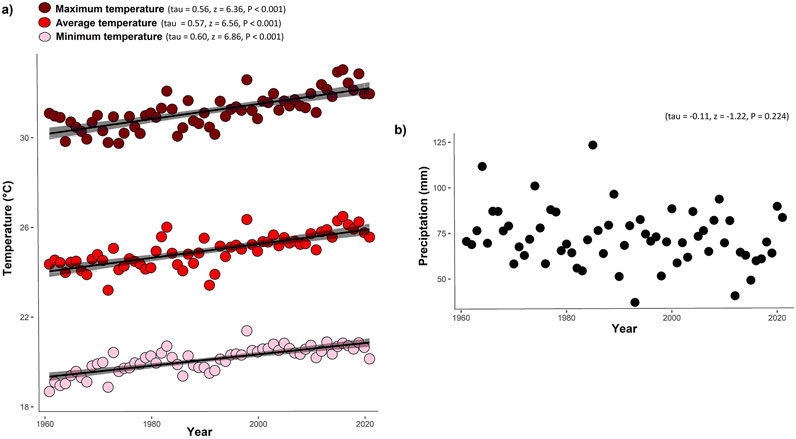
Figure 3. Variations in the mean temperature, maximum temperature, minimum temperature, annual mean precipitation. (a) Trends of maximum, mean and minimum temperatures over 61 years of observations in the semiarid region of Brazil; (b) trend of precipitation over 61 years of observations in the semiarid region of Brazil. Significance level: ***P < 0.0001. Data from the meteorological stations closest to the occurrence sites Leptochloa anisopoda, Panicum trichoides, Paspalum fimbriatum and Paspalum scutatum in the Brazilian semiarid region.
Moran’s I never crossed the threshold of 0.4 revealing low levels of spatial autocorrelation in all variables of all species (Supplementary Figures S1, S2). We also found that precipitation and temperature data were stationary in all species. Partial autocorrelation function reported no significant values beyond the lag one for precipitation and temperature in all species (Supplementary Figures S3, S4). To reduce collinearity among the independent variables, we removed maximum and minimum temperature from the multiple linear regressions analyses of morphological variation for all species (Supplementary Tables S1, S4). We retain those variables considered effectively independent: year, latitude, longitude, mean monthly precipitation, and mean monthly temperature. We compiled all preliminary results in the Supplementary Material.
3.2 Morphological changes
Our results indicate negative responses of the morphological variables throughout 1859 and 2020 (Figure 4). P. scutatum presented reductions in plant heights (9.2 cm, CI = 17.4–1.0 cm, P < 0.05, R2 = 0.03), leaf lengths (2.77 cm, CI: 4.7–0.9 cm, P < 0.005, R2 = 0.05) and spikelet lengths (0.015 cm, 0.030–0.001 cm, P < 0.05, R2 = 0.02). We recorded reductions in the heights (33.5 cm, CI: 52.0–15.1 cm, P < 0.0005, R2 = 0.09), leaf lengths (4.2 cm, CI: 8.2–0.07 cm, P < 0.05, R2 = 0.02) and inflorescence lengths (3.1 cm, CI: 5.95–0.26, P < 0.05, R2 = 0.03) of P. fimbriatum. In P. trichoides, we also observed reductions in plant sizes (15.3 cm, CI: 26.8–3.8 cm, P < 0.001, R2 = 0.04) and inflorescence sizes (4.1 cm, CI: 6.7–1.5 cm, P < 0.005, R2 = 0.05). L. anisopoda was the only species for which no responses were observed.
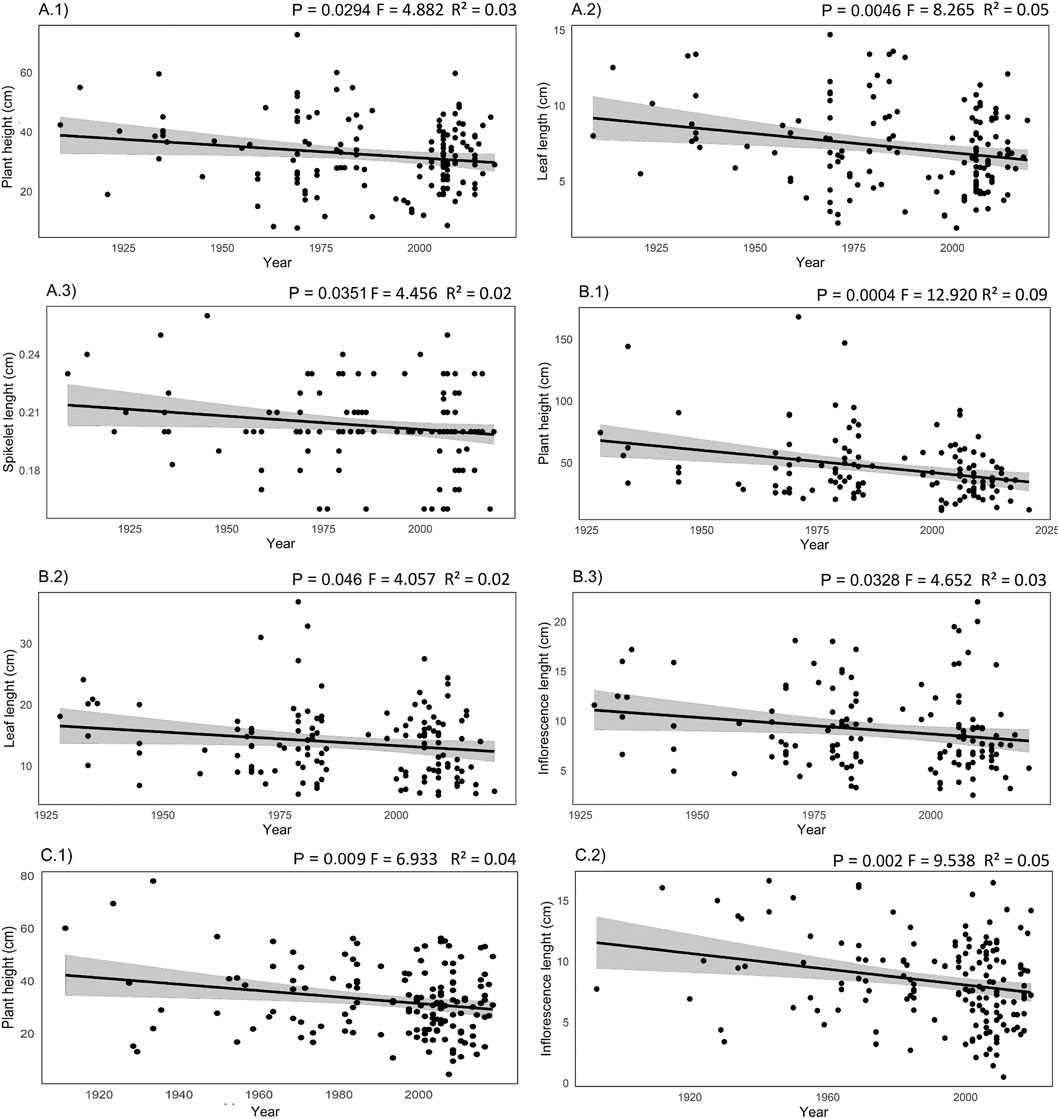
Figure 4. Linear regressions of morphological features versus year of collection (data from herbarium samples). (A) Paspalum scutatum: 1. Plant height, 2. leaf length, 3. spikelet length; (B) Paspalum fimbriatum: 1. plant height, 2. leaf length, 3. spikelet length; (C) Panicum trichoides: 1. plant height, 2. Inflorescence size.
Seven models explaining the morphological variation of all species were identified. The variable year consistently emerged in six models and was the most significant factor in four models, highlighting that temporal changes play a central role in the morphological variations (Table 1). We found a correlation among geographic and climatic drivers and variations in the morphological traits of the analyzed species. L atitude correlated positively with inflorescence length in P. trichoides and P. fimbriatum and with spikelet length in L. anisopoda, while longitude associated with increases in leaf length in P. scutatum (Table 1). Among the climatic variables, temperature had a positive effect on leaf length in P. fimbriatum and P. scutatum and on spikelet length in L. anisopoda (Table 1). Mean precipitation positively influenced leaf length in P. fimbriatum, but negatively affected leaf length in P. scutatum and inflorescence length in P. trichoides (Table 1). Plant height was the only trait explained solely by year in the multiple regressions, indicating changes over time (Table 1).
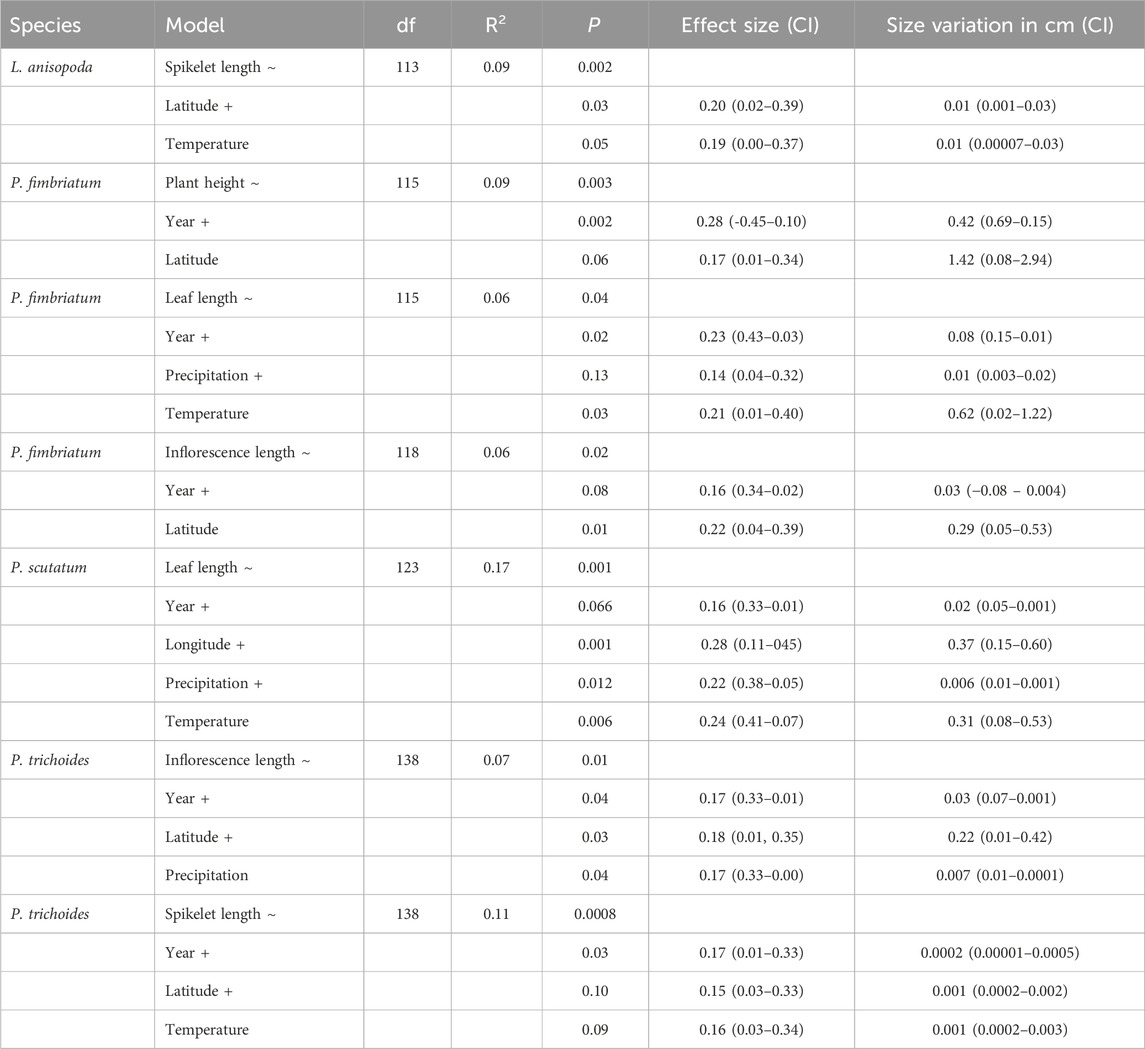
Table 1. Results of best generalized linear models of morphological variation of Leptochloa anisopoda, Panicum trichoides, Paspalum fimbriatum and Paspalum scutatum throughout 1960-2020, effect size of each variable and size variation based on regression coefficients. The model column indicates variables used identified for the models. Bold highlights indicate variables that yielded statistical significant relationships with the morphological variables. CI = 95% confidence interval.
We found no significant changes for all morphological traits of evaluated species between pre-1985 and post-1985 periods (Supplementary Table S2). Thus, our data are not able to track any morphological changes related with land-use changes in Brazilian semiarid.
3.3 Phenological changes
None of the species analyzed showed a significant change in the day of the year of flowering and fruiting throughout 1859-2020 (Supplementary Table S3). When applying multiple regression to the period of 1960–2020, we observed that reproductive time was influenced differently in each species, revealing more complex patterns of phenological responses to environmental changes (Table 2).
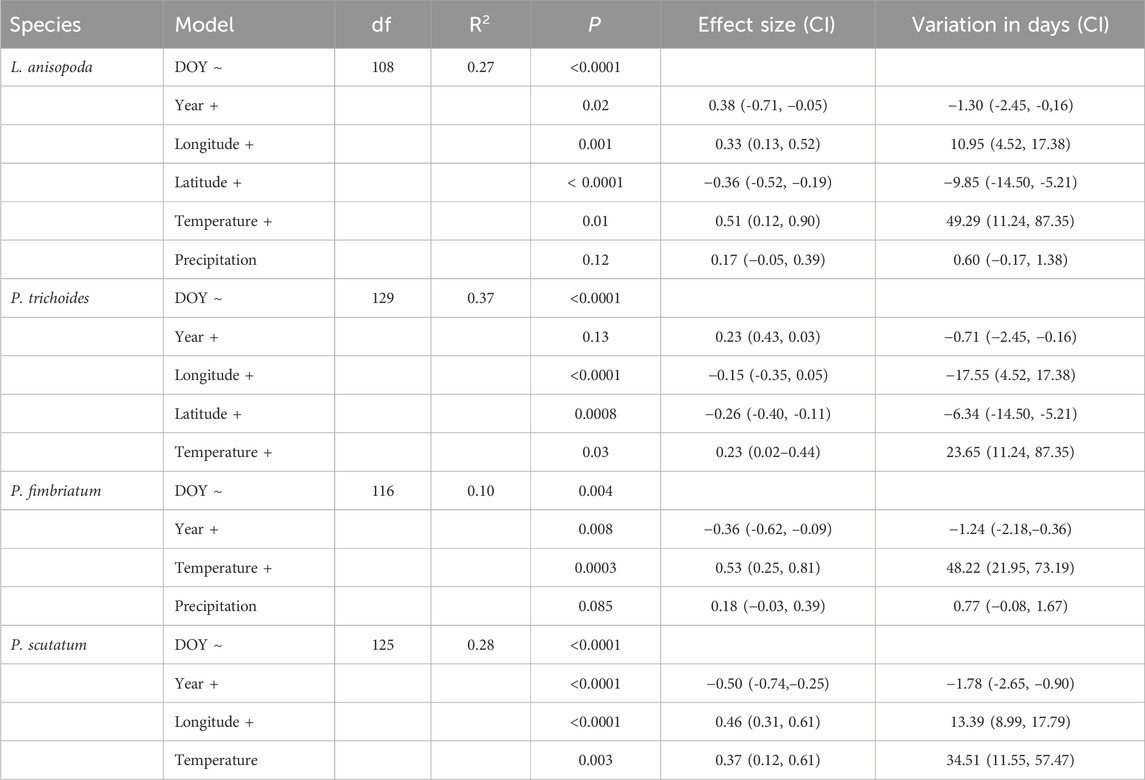
Table 2. Results of best generalized linear models of phenological variation of Leptochloa anisopoda, Panicum trichoides, Paspalum fimbriatum and Paspalum scutatum throughout 1960-2020, effect size of each variable and reproductive time variation in days based on regression coefficients. The model column indicates variables identified for the models. Bold highlights indicate variables that yielded statistical significant relationships with the phenological variable. DOY = day of year of flowering/fruiting plants collection. CI = 95% confidence interval.
Unlike simple linear regression, in the multiple regressions the variable year exhibited a significant trend of accelerated reproductive period in L. anisopoda (1.30 days per year), P. fimbriatum (1.24 days per year), and P. scutatum (1.78 days per year). All multiple regressions retrieved the mean annual temperature as an informative variable, showing positive and significant relationship with phenological changes and indicating that higher temperatures tend to delay the reproductive time of grasses (Table 2). Latitude exhibited a negative relationship with reproductive time, suggesting that specimens located further north tend to flower and fructify earlier, as observed in L. anisopoda and P. trichoides (Table 2). Longitude showed a positive relationship with DOY in L. anisopoda and P. scutatum (specimens further east tend to flower later) and a negative relationship in P. trichoides (Table 2). Finally, mean annual precipitation did not show a significant relationship with the reproductive time of the analyzed species (Table 2).
Despite the four species showing a trend to reducing phenological synchronicity between pre-1985 and post-1985 (Figure 5), significant reductions in all reproductive scenarios were found for L. anisopoda, P. fimbriatum and P. scutatum. In L. anisopoda 30-day scenarios presented higher reduction in Augspurger Index (0.67–0.26, χ2 = 72.889, df = 46, P = 0.007), followed by 60-day (0.77–0.41, χ2 = 82.747, df = 58, P = 0.018) and 90-day (0.85–0.51, χ2 = 92.596, df = 65, P = 0.014) scenarios. For P. scutatum, the same pattern was found (30-day: 0.51–0.27, χ2 = 91.602, df = 52, P = 0.006; 60-day: 0.62–0.43, χ2 = 92.993, df = 63, P = 0.008; 90-day: 0.69–0.56, χ2 = 106.44, df = 71, P = 0.004). For P. fimbriatum 60-day scenario had a higher change (0.77–0.41, χ2 = 82.747, df = 58, P = 0.018) than 90-day (0.85–0.51, χ2 = 92.596, df = 65, P = 0.014) and 30-day (0.53–0.37, χ2 = 89.853, df = 45, P < 0.001). Panicum trichoides show reduction in phenological synchronicity only for 90-day scenarios (0.77–0.43, χ2 = 103.55, df = 78, P = 0.028).
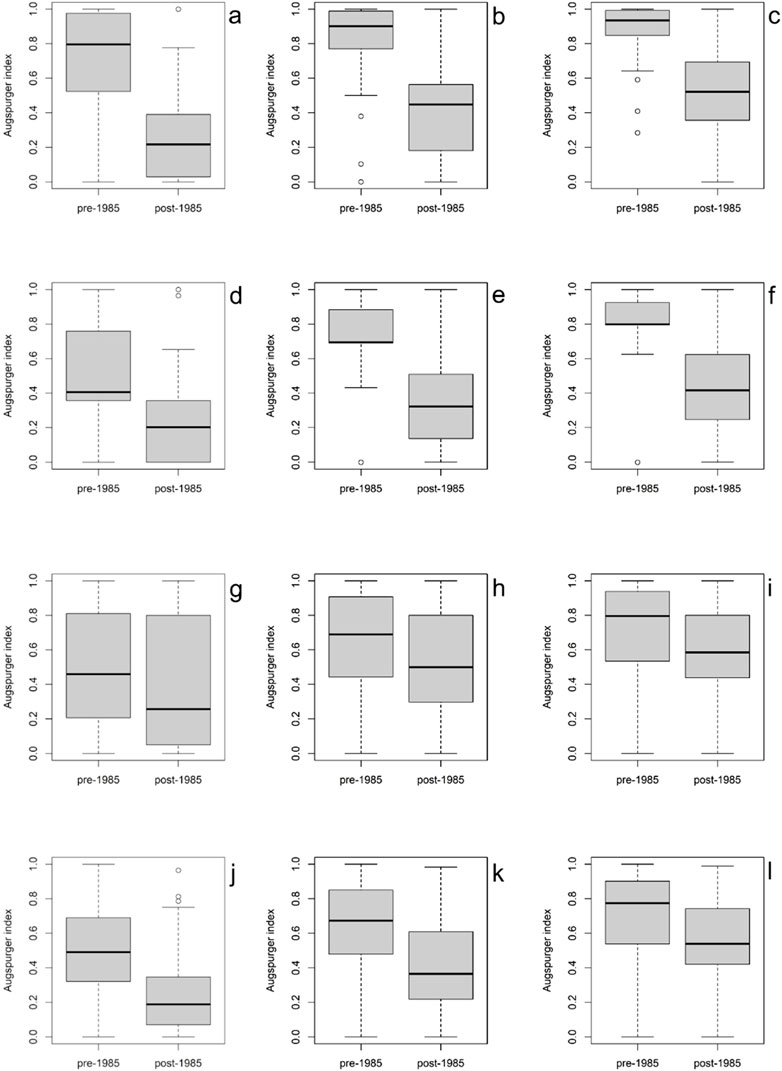
Figure 5. Variation of Augspurger Index of phenological synchronicity of four species from Brazilian semiarid in different estimated scenarios of reproductive period. (A–C) Leptochloa anisopoda. A: 30-days scenario (P = 0.007); B: 60-day scenario (P = 0.018); C: 90-day scenario (P = 0.014). (D–F) Panicum trichoides D: 30-day scenario (P = 0.056); E: 60-day scenario (P = 0.068); F: 90-day scenario (P = 0.028). (G–I) Paspalum fimbriatum. G: 30-day scenario (P < 0.001); H: 60-day scenario (P = 0.018); I: 90-day scenario (P = 0.014). (J–L) Paspalum scutatum. J: 30-day scenario (P = 0.006); K: 60-day scenario (P = 0.008); L: 90-day scenario (P = 0.004).
4 Discussion
4.1 Morphological traits of Brazilian semiarid grasses reduced since 19th century
In this study, we demonstrated that grass species of the Brazilian semiarid region have been undergoing reductions in the sizes of their vegetative and reproductive organs since the 19th century and, especially in the last 62 years, when the annual mean temperature has increased by 1.89 °C in the region. Thus, we detected morphological shifts in semiarid grasses at the same time climate change is impacting the ecosystems. Only L. anisopoda exhibited no significant morphological shifts over time in our study. However, we also detected regional variations in the morphological attributes of the species from the Brazilian semiarid region, in which local variations in precipitation and temperature explained the shifts in leaf, inflorescence and spikelet sizes. These regional variations confirm the ability of grasses to invest in strategies to improve inflorescence sizes and spikelet sizes in places with low precipitation and high temperatures.
In addition to the variable year, we found that temperature was the second climatic variable that better explained the morphological shifts in the analyzed grass species. Reducing size of plant organs can be connected to physiological responses to temperature increases caused by climate change (Gardner et al., 2011). Consequently, we rejected the role of precipitation as expected in our second hypothesis. This finding highlights the importance of temperature reported in other studies (Guerin et al., 2012; Leger, 2013). There is evidence that plants and animals are decreasing in size as a consequence of climate change over time, and this negative relationship can be explained by increased temperatures (Barber et al., 2000; Sheridan and Bickford, 2011). In an experimental study with the grass, Austrodanthonia caespitosa (Gaudich.) H.P. Linder, a reduction in seedlings in response to an increase in CO2 and temperature was observed (Hovenden et al., 2008). However, the possible influences of temperature increases caused by climate change on the morphological shifts of plant organs in grasses had never been explored before our study.
In our study, time, as a proxy for climate change, explained the reductions in the plant heights of three annual species (e.g., P. scutatum, P. fimbriatum and P. trichoides); the leaf lengths of two other species (e.g., P. scutatum and P. fimbriatum); the inflorescence sizes of two other species (e.g., P. fimbriatum and P. trichoides); and the spikelet size of one species (e.g., P. scutatum). Leger (2013) observed divergent responses over time in the morphological changes of annual plants; While some species decreased in size (Collinsia parviflora Lindl., Cryptantha pterocarya (Torr.) Greene, Eriastrum signatum D. Gowen, Gilia inconspicua (Sm.) Sweet and Microsteris gracilis (Hook.). Greene), other (Mentzelia albicaulis (Hook.) Torr. and A. Gray) increased in height (Leger, 2013).
Since 1985, a drastic replacement of natural cover by agricultural lands in Brazilian semiarid has been documented (Beuchle et al., 2015; Silva et al., 2017; Silva and Barbosa, 2017; Franca Rocha et al., 2024). Our assessment of the effect of agricultural land expansion over the morphology of species has not found any significant differences between the pre-1985 and post-1985 periods. This contradicts the general assumption that size reductions can also be an outcome of other effects of climate change, such as soil degradation and grazing (Guerin et al., 2012; Leger, 2013; Tavares et al., 2019). For example, Fahnestock and Detling (2009) analyzed the effects of long-term grazing (>100 years) and reported that grasses presented shorter vegetative shoot heights and smaller leaf areas in grazed areas than in ungrazed areas. Therefore, climate change provides a more plausible explanation for the observed morphological trends in semiarid Brazil, given its extensive impact throughout the entire region.
Several authors have discussed the causality of these morphological shifts over time as plasticity responses to environmental changes or genetic transformations (Schlichting, 1986; Leger, 2013). Short-term studies have shown that, compared with taller plants, small plants can adapt better to drought conditions due to their low transpiration levels (Hendrix and Trapp, 1992; Casper, 1996; Angadi and Entz, 2002). Authors agree with the persistent difficulties in determining the main mechanism of these morphological alterations because of the lack of knowledge of specific genes that affect the size of organisms combined with the idea that plasticity cannot be sustained for a long period (Tilman et al., 1998; Gardner et al., 2011). However, new concepts related to the contribution of phenotypic plasticity to macroevolution are increasingly common in the literature, such as the role of genetic accommodation in determining the plasticity of the development of a population resulting in greater frequencies of genes that encode adaptive features for the next generations (West-Eberhard, 2003; West-Eberhard, 2005; Simon, 2018).
Our results provide new evidence of geographical patterns of morphological variation in the semiarid region of Brazil on the basis of significant relationships between geographical and climatic variables and morphological shifts in the analyzed species. This pattern was also reported by Guerin et al. (2012). Environmental stress factors that occur in isolated or short-term events promote plastic responses that differ from those resulting from continuous long-term changes (Ehrenreich and Pfennig, 2016). These changes may be related to the concept of phenotypic plasticity, which can be immediate, temporary and reversible (Simon, 2018). This strategy is also associated with the C4 photosynthetic pathway of the selected plants, which allows them to adapt to dry and hot habitats (Braga et al., 2021). This evidence provides clues concerning evolution and diversification drivers in the semiarid region of Brazil once they likely act as environmental filters of plasticity or adaptive responses.
4.2 Spatial variation of temperature and land use influences the phenology of Brazilian semiarid grasses
Our results demonstrate that the phenological variations of grasses in the Brazilian semiarid region are more associated with spatial and thermal gradients than with temporal changes. No evidence of advancing or delaying reproductive period of grasses in the Brazilian semiarid region throughout 163 years was found. Only in combination with other variables, year of collection yielded significant effect for some species, but in the opposite direction to what would be expected if climate change were the main driver of phenological shifts. In our results, acceleration of reproductive period is associated with time whereas the realized increase in temperature caused by climate change is often associated with delayed phenology in other plant groups (Nicotra et al., 2010; Munson and Long, 2017).
On the other hand, we discovered that temperature explained better the variations in the phenology of Brazilian semiarid grasses, following a similar pattern reported in several other studies in which the flowering time changed with increasing temperature (Cayan et al., 2001; Cleland et al., 2007; Zhang et al., 2007; Park and Schwartz, 2015; Anderson et al., 2012; Munson and Long, 2017; Geissler et al., 2023). In addition, we found a shift in phenological synchronicity post-1985 for most of the species analyzed, when changes in land-use of Brazilian semiarid rose significantly. This dissociation between temporal and other underlying cues suggests that the temporal component does not reflect global warming, but rather local adjustments and species-specific ecological responses to geographical changes in temperature and shifts in land-use.
We identified spatial variations in phenology for some species, which reflects the spatial‒temporal complexities of the climate in the semiarid region of Brazil. These phenological responses to geographic variables may be related to the interactions of several abiotic factors that influence reproductive times, such as rainfall seasonality, temperature, humidity and soil type (Cleland et al., 2007; Parmesan and Yohe, 2003; Primack et al., 2009; Primack et al., 2004; Silva et al., 2021; Plos et al., 2024; Karthikeyan et al., 2025). The reproductive period of L. anisopoda, P. trichoides and P. scutatum occurs late eastward, accompanied by lower soil humidity, despite the milder average temperature observed most of the year (Silva et al., 2017). In contrast, the reproductive period of L. anisopoda and P. trichoides accelerated in a northern direction, which can be explained by the spatial mosaic of climatic seasonality in the Brazilian semiarid region. In the northern region (north), the concentration of rain occurs in the summer and is influenced by the Intertropical Convergence Zone (ZCIT), with a maximum temperature in November and a minimum in June, whereas in the eastern region (east), the rain concentration occurs in autumn and is influenced by the Atlantic Tropical Mass (MTA) and ZCIT, with a maximum temperature in March and a minimum in July (Silva et al., 2017).
Spatial patterns of phenological variation of the four species from Brazilian semiarid reinforce the capacity of grass to yield rapid responses for local variation of climate. In terms of the phenology‒climate relationship, the flowering period of a population is expected to be in balance with the climate in the long term, as reproductive production can be considerably lower if flowering peaks occur during unfavorable periods, such as those with extreme heat and water scarcity (Nicotra et al., 2010). Annual grasses have the ability to follow rapid rates of climate change throughout a territory and respond to the interactions of other factors that influence the phenology‒climate relationship and may present a delay in flowering in a given place and an acceleration in another, even if both localities have the same temperature (Crimmins et al., 2011; Munson and Long, 2017). We confirmed this pattern in our study of Brazilian semiarid grasses.
Functional traits explain phenological variation and changes of herbaceous plants communities in several cases (König et al., 2018; Plos et al., 2024). Species with different life cycles and photosynthetic pathways present divergent phenological responses to changes in climate, but our results reveal a slightly different pattern of that found by Munson and Long (2017). We found that increases in temperature are related to delay in the flowering/fruiting in our study for all four species, among which L. anisopoda, P. fimbriatum and P. scutatum have C4 photosynthetic pathway and P. trichoides is a C3 species (Osborne et al., 2014). Munson and Long (2017) discovered that C4 grass species delayed while C3 species advanced the flowering time in parallel to the increases in temperature.
Synchronicity of phenology of three species from Brazilian semiarid reduced at the same time agricultural lands and anthropization expanded 39% throughout last 38 years (Beuchle et al., 2015; Silva et al., 2017; Silva and Barbosa, 2017; Franca Rocha et al., 2024; MapBiomas, 2025). Changes in phenological synchronicity of L. anisopoda, P. fimbriatum and P. scutatum post-1985 endorse the possibility that spatial patterns of temperature and land use influenced more the phenology of grasses than climate change in the Brazilian semiarid. Asynchrony or alterations in phenology is often attributed to increasing annual temperatures caused by climate change (Cleland et al., 2007; Parmesan and Yohe, 2003; Primack et al., 2009; Primack et al., 2004; Karthikeyan et al., 2025). However, in some situations other spatial and temporal clues—i.e., land use shifts—offer higher explanatory potential rather than climate change (Bertin, 2008; Parker, 2021; Plos et al., 2024).
5 Conclusion
Our results provide new empirical clues for the evolution and adaptation drivers of climate change and environmental alterations in semiarid ecosystems. However, we have also contributed to furthering the understanding of the general impact of climate change and to new perspectives in the research field. Reductions in grass sizes and delays in flowering times can create a cascade effect in all trophic chains, since grasses play a central role as forage, in soil protection and in helping the seed banks of semiarid ecosystems. Thus, future studies exploring the impact of climate change and environmental alterations on ecosystems are needed to answer open questions in this field.
Data availability statement
The datasets presented in this study can be found in online repositories. The names of the repository/repositories and accession number(s) can be found in the article/Supplementary Material.
Author contributions
JC: Conceptualization, Data curation, Formal Analysis, Funding acquisition, Investigation, Methodology, Project administration, Resources, Software, Visualization, Writing – original draft, Writing – review and editing. JM: Conceptualization, Formal Analysis, Funding acquisition, Methodology, Project administration, Resources, Software, Writing – review and editing, Supervision, Validation.
Funding
The authors declare that no financial support was received for the research and/or publication of this article.
Acknowledgements
We are grateful to the Coordenaição de Aperfeiçoamento de Pessoal de Nível Superior (CAPES), Brazil, for providing a master’s scholarship, to the Programa de Pós-Graduação em Biodiversidade (PPGBIO) of the Universidade Federal Rural de Pernambuco (UFRPE), Recife, Pernambuco, Brazil, and to the Laboratório de Sistemática Integrativa (LASI) of UFRPE.
Conflict of interest
The authors declare that the research was conducted in the absence of any commercial or financial relationships that could be construed as a potential conflict of interest.
Generative AI statement
The authors declare that no Generative AI was used in the creation of this manuscript.
Any alternative text (alt text) provided alongside figures in this article has been generated by Frontiers with the support of artificial intelligence and reasonable efforts have been made to ensure accuracy, including review by the authors wherever possible. If you identify any issues, please contact us.
Publisher’s note
All claims expressed in this article are solely those of the authors and do not necessarily represent those of their affiliated organizations, or those of the publisher, the editors and the reviewers. Any product that may be evaluated in this article, or claim that may be made by its manufacturer, is not guaranteed or endorsed by the publisher.
Supplementary material
The Supplementary Material for this article can be found online at: https://www.frontiersin.org/articles/10.3389/fenvs.2025.1625441/full#supplementary-material
References
Amorim, I. L., Sampaio, E. V. S. B., and Araujo, E. L. (2009). Fenologia de espécies lenhosas da caatinga do Seridó, RN. Rev. Árvore 33, 491–499. doi:10.1590/s0100-67622009000300011
Anderson, J. T., Inouye, D. W., McKinney, A. M., Colautti, R. I., and Mitchell-Olds, T. (2012). Phenotypic plasticity and adaptive evolution contribute to advanced flowering phenology in response to climate change. Proc. R. Soc. Lond. B Biol. Sci. 283, 3843–3852. doi:10.1098/rspb.2012.1051
Andrade, J. R., Santos, J. M. F. F., Lima, E. N., Lopes, C. G. R., Silva, K. A., and Araújo, E. L. (2007). Estudo populacional de Panicum trichoides Swart. (Poaceae) em uma área de caatinga em Caruaru, Pernambuco. Rev. Bras. Biociências 5, 858–860.
Angadi, S., and Entz, M. (2002). Water relations of standard height and dwarf sunflower cultivars. Crop Sci. 42, 152–159. doi:10.2135/cropsci2002.1520
Barber, V. A., Juday, G. P., and Finney, B. P. (2000). Reduced growth of Alaskan white spruce in the twentieth century from temperature-induced drought stress. Nature 405, 668–673. doi:10.1038/35015049
Ben-Shachar, M., Lüdecke, D., and Makowski, D. (2020). Effectsize: estimation of effect size indices and standardized parameters. J. Open Source Softw. 5, 2815. doi:10.21105/joss.02815
Benkendorf, R. C. (2023). AugspurgerIndex. Available online at: https://github.com/sagesteppe/AugspurgerIndex.
Bernstein, L., Bosch, P., Canziani, O., Chen, Z., Christ, R., and Riahi, K. (2008). Climate change 2007: synthesis report. Geneva: IPCC. Available online at: http://www.ipcc.ch/publications_and_data/ar4/syr/en/contents.html.
Bertin, R. I. (2008). Plant phenology and distribution in relation to recent climate change. J. Torrey Botanical Soc. 135, 126–146. doi:10.3159/07-RP-035R.1
Beuchle, R., Grecchi, R. C., Shimabukuro, Y. E., Seliger, R., Eva, H. D., Sano, E., et al. (2015). Land cover changes in the Brazilian Cerrado and caatinga biomes from 1990 to 2010 based on a systematic remote sensing sampling approach. Appl. Geogr. 58, 116–127. doi:10.1016/j.apgeog.2015.01.017
Braga, F. M., Ferreira, E. A., Cabral, C. M., Freitas, I. C., Maciel, J. C., Freitas, M. S. S., et al. (2021). Revisão: crescimento de plantas C3 e C4 em resposta a diferentes concentrações de CO2. Soc. Dev. 10, e33810716701. doi:10.33448/rsd-v10i7.16701
Calinger, K. M., Queenborough, S., and Curtis, P. S. (2013). Herbarium specimens reveal the footprint of climate change on flowering trends across north-central North America. Ecol. Lett. 16 (8), 1037–1044. doi:10.1111/ele.12135
Canty, A., and Ripley, B. (2025). Boot: bootstrap functions. R. package version 1, 3–32. Available online at: https://CRAN.R-project.org/package=boot. doi:10.32614/CRAN.package.boot
Casper, B. B. (1996). Demographic consequences of drought in the herbaceous perennial cryptantha flava: effects of density, associations with shrubs, and plant size. Oecologia 106, 144–152. doi:10.1007/BF00328593
Cayan, D. R., Kammerdiener, S. A., Dettinger, M. D., Caprio, J. M., and Peterson, D. H. (2001). Changes in the onset of spring in the western United States. Bull. Am. Meteorol. Soc. 82 (3), 399–416. doi:10.1175/1520-0477(2001)0820399:CITOOS2.3.CO;2
Cleland, E. E., Chuine, I., Menzel, A., Mooney, H. A., and Schwartz, M. D. (2007). Shifting plant phenology in response to global change. Trends Ecol. and Evol. 22, 357–365. doi:10.1016/j.tree.2007.04.003
Corrêa, A. C. B., Azevêdo, C. T. B., Lira, D. R., Mutzenberg, D. S., and Cavalcanti, L. C. S. (2019). “The semi-arid domain of the northeast of Brazil,”. Cham: Springer, 119–150. doi:10.1007/978-3-030-04333-9_7
Crimmins, T., Crimmins, M. A., and Bertelsen, C. D. (2011). Onset of summer floweringin a “Sky Island” is driven by monsoon moisture. New Phytol. 191, 468–479. doi:10.1111/j.1469-8137.2011.03705.x
Davis, C. C. (2023). The herbarium of the future. Trends Ecol. and Evol. 38, 412–423. doi:10.1016/j.tree.2022.11.015
Ehrenreich, I. M., and Pfennig, D. W. (2016). Genetic assimilation: a review of its potential proximate causes and evolutionary consequences. Ann. Bot. 117, 769–779. doi:10.1093/aob/mcv130
Everingham, S. E., Offord, C. A., Sabot, M. E. B., and Moles, A. T. (2024). Leaf morphological traits show greater responses to changes in climate than leaf physiological traits and gas exchange variables. Ecol. Evol. 14, e10941. doi:10.1002/ece3.10941
Fahnestock, J. T., and Detling, J. K. (2009). Morphological and physiological responses of perennial grasses to long-term grazing in the pryor Mountains, Montana. Am. Midl. Nat. 143, 312–320. doi:10.1674/0003-0031(2000)143[0312:MAPROP]2.0.CO;2
Ferreira, C. G. T., Oliveira, R. C. D., Valls, J. F. M., and Loiola, M. I. B. D. (2009). Poaceae da Estação Ecológica do Seridó, Rio Grande do Norte, Brasil. Hoehnea 36, 679–707. doi:10.1590/S2236-89062009000400008
Filardi, F. L., Barbosa, M. R. V., Baumgratz, J. F. A., Bicudo, C. E., Cavalcanti, T. B., et al. (2022). Brazilian flora 2020: leveraging the power of a collaborative scientific network. Taxon 71, 178–198. doi:10.1002/tax.12640
Fox, J., and Weisberg, S. (2019). An {R} Companion to Applied Regression. Third Edition. Thousand Oaks CA: Sage. Available online at: https://socialsciences.mcmaster.ca/jfox/Books/Companion/.
Franca Rocha, W. J. S., Vasconcelos, R. N., Costa, D. P., Duverger, S. G., Lobão, J. S. B., Souza, D. T. M., et al. (2024). Towards uncovering three decades of LULC in the Brazilian drylands: caatinga biome dynamics (1985–2019). Land 13, 1250. doi:10.3390/land13081250
Gardner, J. L., Peters, A., Kearney, M. R., Joseph, L., and Heinsohn, R. (2011). Declining body size: a third universal response to warming? Trends Ecol. and Evol. 26, 285–291. doi:10.1016/j.tree.2011.03.005
Geissler, C., Davidson, A., and Niesenbaum, R. A. (2023). The influence of climate warming on flowering phenology in relation to historical annual and seasonal temperatures and plant functional traits. PeerJ 11, 15188. doi:10.7717/peerj.15188
Guerin, G. R., Wen, H., and Lowe, A. J. (2012). Leaf morphology shift linked to climate change. Biol. Lett. 8, 882–886. doi:10.1098/rsbl.2012.0458
Hendrix, S. D., and Trapp, E. J. (1992). Population demography of Pastinaca sativa (Apiaceae): effects of seed mass on emergence, survival, and recruitment. Am. J. Bot. 79, 365–375. doi:10.1002/j.1537-2197.1992.tb14563.x
Henn, J. J., Buzzard, V., Enquist, B. J., Halbritter, A. H., Klanderud, K., Maitner, B. S., et al. (2018). Intraspecific trait variation and phenotypic plasticity mediate alpine plant species response to climate change. Front. Plant Sci. 9, 1548. doi:10.3389/fpls.2018.01548
Hovenden, M. J., Wills, K. E., Chaplin, R. E., Vander-Schoor, J. K., Williams, A. L., Osanai, Y. U. I., et al. (2008). Warming and elevated CO2 affect the relationship between seed mass, germinability and seedling growth in Austrodanthonia caespitosa, a dominant Australian grass. Glob. Change Biol. 14, 1633–1641. doi:10.1111/j.1365-2486.2008.01597.x
Hufft, R. A., DePrenger-Levin, M. E., Levy, R. A., and Islam, M. B. (2018). Using herbarium specimens to select indicator species for climate change monitoring. Biodivers. Conservation 27, 1487–1501. doi:10.1007/s10531-018-1505-2
Jones, C. A., and Daehler, C. C. (2018). Herbarium specimens can reveal impacts of climate change on plant phenology; a review of methods and applications. PeerJ 6, e4576. doi:10.7717/peerj.4576
Karthikeyan, A., Karthik, V., and Chandrasekaran, S. (2025). Flowering out of sync: climate change alters the reproductive phenology of Terminalia paniculata in the Western Ghats of India. Plants, People, Planet, ppp3.70022. doi:10.1002/ppp3.70022
Knapp, A. K., and Smith, M. D. (2001). Variation among biomes in temporal dynamics of above ground primary production. Science 291, 481–484. doi:10.1126/science.291.5503.481
König, P., Tautenhahn, S., Cornelissen, J. H. C., Kattge, J., Bönisch, G., and Römermann, C. (2018). Advances in flowering phenology across the Northern Hemisphere are explained by functional traits. Glob. Ecol. Biogeogr. 27, 310–321. doi:10.1111/geb.12696
Lang, P. L., Willems, F. M., Scheepens, J. F., Burbano, H. A., and Bossdorf, O. (2019). Using herbaria to study global environmental change. New phytol. 221 (1), 110–122. doi:10.1111/nph.15401
Leger, E. A. (2013). Annual plants change in size over a century of observations. Glob. Change Biol. 19, 2229–2239. doi:10.1111/gcb.12208
Liancourt, P., Boldgiv, B., Song, D. S., Spence, L. A., Helliker, B. R., Petraitis, P. S., et al. (2015). Leaf-trait plasticity and species vulnerability to climate change in a Mongolian steppe. Glob. Change Biol. 21, 3489–3498. doi:10.1111/gcb.12934
Lima, D. F., Mello, J. H., Lopes, I. T., Forzza, R. C., Goldenberg, R., and Freitas, L. (2021). Phenological responses to climate change based on a hundred years of herbarium collections of tropical Melastomataceae. PLoS One 16, e0251360. doi:10.1371/journal.pone.0251360
Loiola, M., Roque, A., and Oliveira, A. D. (2012). Caatinga: vegetação do semiárido brasileiro. Rev. Online Soc. Port. Ecol. 4, 14–19.
Maciel, J. R., and Valls, J. F. M. (2020). Enteropogon in Flora do Brasil 2020. Rio de Janeiro, Brazil: Jardim Botânico do Rio de Janeiro. Available online at: http://floradobrasil.jbrj.gov.br/reflora/floradobrasil/FB20374.ab.
Maciel, J. R., Oliveira, R. C. D., and Alves, M. (2009). Paspalum L.(Poaceae: panicoideae: paniceae) no estado de Pernambuco, Brasil. Acta Bot. Bras. 23, 1145–1161. doi:10.1590/S0102-33062009000400024
MapBiomas (2025). Coverage and transitions statistics by biomes and states - MapBiomas Brasil Collection 10. doi:10.58053/MapBiomas/SL8TCR
Marengo, J. A., Nunes, L. H., Souza, C. R. G., Harari, J., Muller-Karger, F., Greco, R., et al. (2017). A globally deployable strategy for co-development of adaptation preferences to sea-level rise: the public participation case of Santos, Brazil. Nat. Hazards 88, 39–53. doi:10.1007/s11069-017-2855-x
Masson-Delmotte, V., Zhai, P., Pörtner, H. O., Roberts, D., Skea, J., and Shukla, P. R. (2022). “Global warming of 1.5C: IPCC special report on impacts of global warming of 1.5C above pre-industrial levels in context of strengthening response to climate change,”. Cambridge University Press. doi:10.1017/9781009157940
Meineke, E. K., Davis, C. C., and Davies, T. J. (2018). The unrealized potential of herbaria for global change biology. Ecol. Monogr. 88, 505–525. doi:10.1002/ecm.1307
Miller-Rushing, A. J., Primack, D., Primack, R. B., Imbres, C., and Del Tredici, P. (2004). Herbarium specimens as a novel tool for climate change research. Arnoldia 63, 26–32. doi:10.5962/p.251594
Moro, M. F., Nic Lughadha, E., Filer, D. L., Araújo, F. S., and Martins, F. R. (2014). A catalogue of the vascular plants of the Caatinga Phytogeographical Domain: a synthesis of floristic and phytosociological surveys<p class=headingrunin align=center>. Phytotaxa 160, 1–118. doi:10.11646/phytotaxa.160.1.1
Moro, M. F., Nic Lughadha, E., de Araújo, F. S., and Martins, F. R. (2016). A phytogeographical metaanalysis of the semiarid Caatinga domain in Brazil. Botanical Rev. 82, 91–148. doi:10.1007/s12229-016-9164-z
Munson, S. M., and Long, A. L. (2017). Climate drives shifts in grass reproductive phenology across the western USA. New Phytol. 213 (4), 1945–1955. doi:10.1111/nph.14327
Nicotra, A. B., Cosgrove, M. J., Cowling, A., Schlichting, C. D., and Jones, C. S. (2008). Leaf shape linked to photosynthetic rates and temperature optima in South African pelargonium species. Oecologia 154, 625–635. doi:10.1007/s00442-007-0865-1
Nicotra, A. B., Atkin, O. K., Bonser, S. P., Davidson, A. M., Finnegan, E. J., Mathesius, U., et al. (2010). Plant phenotypic plasticity in a changing climate. Trends Plant Sci. 15, 684–692. doi:10.1016/j.tplants.2010.09.008
Oliveira, D. G., Prata, A. P., and Ferreira, R. A. (2013). Herbáceas da Caatinga: composição florística, fitossociologia e estratégias de sobrevivência em uma comunidade vegetal. Rev. Bras. Ciências Agrárias 8, 623–633. doi:10.5039/agraria.v8i4a2682
Osborne, C. P., Salomaa, A., Kluyver, T. A., Visser, V., Kellogg, E. A., Morrone, O., et al. (2014). A global database of C4 photosynthesis in grasses. New Phytol. 204 (3), 441–446. doi:10.1111/nph.12942
Park, I. W., and Schwartz, M. D. (2015). Long-term herbarium records reveal temperature-dependent changes in flowering phenology in the southeastern USA. Int. J. Biometeorology 59, 347–355. doi:10.1007/s00484-014-0846-0
Parker, V. T. (2021). Absence of flowering shifts in Arctostaphylos and Ceanothus over the past century of climate warming. Madroño 68, 461–472. doi:10.3120/0024-9637-68.4.461
Parmesan, C., and Yohe, G. (2003). A globally coherent fingerprint of climate change impacts across natural systems. Nature 421, 37–42. doi:10.1038/nature01286
Plos, C., Hensen, I., Korell, L., Auge, H., and Römermann, C. (2024). Plant species phenology differs between climate and land-use scenarios and relates to plant functional traits. Ecol. Evol. 14, e11441. doi:10.1002/ece3.11441
Primack, D., Imbres, C., Primack, R. B., Miller-Rushing, A. J., and Del-Tredici, P. (2004). Herbarium specimens demonstrate earlier flowering times in response to warming in Boston. Am. J. Bot. 91, 1260–1264. doi:10.3732/ajb.91.8.1260
Primack, R. B., Higuchi, H., and Miller-Rushing, A. J. (2009). The impact of climate change on cherry trees and other species in Japan. Biol. Conserv. 142, 1943–1949. doi:10.1016/j.biocon.2009.03.016
Qiu, D. (2024). aTSA: alternative time series analysis. R. package version. Available online at: https://CRAN.R-project.org/package=aTSA. doi:10.32614/CRAN.package.aTSA
Quan, Q., He, N., Zhang, R., Wang, J. L. Y., Ma, F., Pan, J., et al. (2024). Plant height as an indicator for alpine carbon sequestration and ecosystem response to warming. Nat. Plants 10, 890–900. doi:10.1038/s41477-024-01705-z
Queiroz, L. P., Cardoso, D., Fernandes, M. F., and Moro, M. F. (2017). “Diversity and evolution of flowering plants of the caatinga domain,” in Caatinga: the largest dry Forest Region in South America. Editors J. M. C Silva, I. R. Leal, and M. Tabarelli (Cham, Switzerland: Springer), 23–64.
Reis, A. M. S., Araújo, E. L., Ferraz, E. M. N., and Moura, A. N. (2006). Variações interanuais na composição florística e estrutura das populações de uma comunidade herbácea da caatinga, Pernambuco, Brasil. Braz. J. Bot. 29, 497–508. doi:10.1590/S0100-84042006000300017
Schlichting, C. D. (1986). The evolution of phenotypic plasticity in plants. Annu. Rev. Ecol. Syst. 17, 667–693. doi:10.1146/annurev.es.17.110186.003315
Schneider, C. A., Rasband, W. S., and Eliceiri, K. W. (2012). NIH Image to ImageJ: 25 years of image analysis. Nat. Methods 9, 671–675. doi:10.1038/nmeth.2089
Sheridan, J. A., and Bickford, D. (2011). Shrinking body size as an ecological response to climate change. Nat. Clim. Change 1, 401–406. doi:10.1038/nclimate1259
Silva, J. M. C., and Barbosa, L. C. F. (2017). “The caatinga: understanding the challenges,” in Caatinga: the largest dry forest Region in South America. Editors J. M. C Silva, I. R. Leal, and M. Tabarelli (Cham, Switzerland: Springer), 359–368.
Silva, J. M. C., Barbosa, L. C. F., Leal, R. I., and Tabarelli, M. (2017). “The Caatinga: understanding the challenges,” in Caatinga: the largest dry forest region in South America. Editors J. M. C Silva, I. R. Leal, and M. Tabarelli (Cham, Switzerland: Springer), 3–22.
Silva, T. R. G., Costa, M. L. A., Farias, L. R. A., Santos, M. A., Lima-Rocha, J. J., and Silva, J. V. (2021). “Fatores abióticos no crescimento e florescimento das plantas,”, 10. Research. doi:10.33448/rsd-v10i4.13817
Simon, M. N. (2018). Acomodação fenotípica e acomodação genética: evidências e questões não resolvidas em macroevolução. Rev. Biol. 6, 1–5. doi:10.7594/revbio.06a.01
Swain, H., and Chakraborty, K. (2024). Science behind herbarium and its importance in recent years. Nordic J. Bot. 2024, e04499. doi:10.1111/njb.04499
Tavares, V. C., Arruda, I. R. P., and Silva, D. G. (2019). Desertificação, mudanças climáticas e secas no semiárido brasileiro: uma revisão bibliográfica. Geosul 34, 385–405. doi:10.5007/2177-5230.2019v34n70p385
Tilman, D., Lehman, C. L., and Bristow, C. E. (1998). Diversity-Stability relationships: statistical inevitability or ecological consequence? Am. Nat. 151, 277–282. Available online at: https://www.journals.uchicago.edu/doi/abs/10.1086/286118. doi:10.1086/286118
Torres, R. R., Lapola, D. M., and Gamarra, N. L. R. (2017). ““Future Climate Change in the Caatinga” in Caatinga: the largest dry Forest Region in South America,”. Cham, Switzerland: Springer, 383–412.
Venables, W. N., and Ripley, B. D. (2002). Modern applied statistics with S. Fourth Edition. New York: Springer.
Vieira, D. L., and Scariot, A. (2006). Principles of natural regeneration of tropical dry forests for restoration. Restor. Ecol. 14, 11–20. doi:10.1111/j.1526-100x.2006.00100.x
Vilela, B., and Villalobos, F. (2015). letsR: a new R package for data handling and analysis in macroecology. Methods Ecol. Evol. 6, 1229–1234. doi:10.1111/2041-210X.12401
West-Eberhard, M. J. (2005). Phenotypic accommodation: adaptive innovation due to developmental plasticity. J. Exp. Biol. 304B, 610–618. doi:10.1002/jez.b.21071
Keywords: climate change, global warming, herbaria, Leptochloa anisopoda, morphology, Panicum trichoides, Paspalum fimbriatum, Paspalum scutatum
Citation: César da Silva J and Maciel JR (2025) Morphological and phenological shifts in semiarid grasses paralleled climate and land use changes. Front. Environ. Sci. 13:1625441. doi: 10.3389/fenvs.2025.1625441
Received: 09 May 2025; Accepted: 04 November 2025;
Published: 25 November 2025.
Edited by:
Z. Y. Yuan, Chinese Academy of Sciences (CAS), ChinaReviewed by:
Zhenxing Zhou, Anyang Institute of Technology, ChinaTianwu Zhang, Lanzhou University, China
Copyright © 2025 César da Silva and Maciel. This is an open-access article distributed under the terms of the Creative Commons Attribution License (CC BY). The use, distribution or reproduction in other forums is permitted, provided the original author(s) and the copyright owner(s) are credited and that the original publication in this journal is cited, in accordance with accepted academic practice. No use, distribution or reproduction is permitted which does not comply with these terms.
*Correspondence: Julio César da Silva, anVsaW8uY3NpbHZhM0B1ZnJwZS5icg==; Jefferson Rodrigues Maciel, amVmZmVyc29ubWFjaWVsQHJlY2lmZS5wZS5nb3YuYnI=