 Yaokun Hu
 Qiaoxia Liang1,2
 Wei Zhang
- 1State Key Laboratory of Cryospheric Science and Frozen Soil Engineering, Northwest Institute of Eco-Environment and Resources, Chinese Academy of Sciences (CAS), Lanzhou, China
- 2University of Chinese Academy of Sciences, Beijing, China
Introduction: The Tibetan Plateau, regarded as China's “national ecological security barrier,” faces challenges in balancing resilient economic growth and environmental protection under climate change.
Methods: This study applies an input-output (IO) model combined with a four-quadrant resilience framework to analyze the linkages and ripple effects of 21 sectors in the Xizang Autonomous Region during 2012-2017.
Results: The results show that the overall intermediate input coefficient rose from 2012 to 2017, reflecting industrialization but with evident sectoral disparities. Specifically, the primary industry remains underdeveloped, whereas the secondary industry and traditional services are resource-intensive and technologically weak, failing to transition into modern industries characterized by low resource use and high value added. Recent policy adjustments have reduced the influence of high-energy-consuming sectors; however, weak integration with local resources has limited the economic spillover effects of distinctive local assets. Structurally, most sectors exhibit path dependence shaped by existing structures and comparative advantages. Notably, only three sectors (materials; accommodation and catering; wholesale and retail) shifted categories over the past decade, reflecting growing economic reliance on raw materials and tourism and signaling rising environmental pressures.
Discussion: The findings indicate that environmental protection will become increasingly vital for enhancing economic resilience in Xizang. Accordingly, the study calls for sector-specific pathways of industrial upgrading, technological innovation, and supportive policy interventions to foster resilient economic growth while maintaining ecological security.
1 Introduction
As a core vehicle for economic systems to address climate challenges, industrial structure directly determines the efficiency of national economic growth while profoundly influencing ecological security and societal wellbeing. The spatiotemporal complexity of regional industrial structure interconnections constitutes a “gray box” of indirect economic-technological linkages. As economic pressures intensify (United Nations, Department of Economic and Social Affairs, 2024) and global uncertainties mount (Lesk et al., 2016; Cui and Yang, 2022; Yuan and Hu, 2023), there is growing academic and policy interest in understanding regional industrial interdependencies and fostering resilience to promote high-quality socioeconomic development.
Existing studies on industrial structural change have developed several classical theories, which can be classified into three categories over time. The first category, the theory of structural evolution trends, identifies patterns based on external manifestations of industrial structural changes. Key examples include the “Petty-Clark Law” (Clark, 1967), the “Kuznets Curve” (Kuznets, 1949), “Hoffmann’s Theorem” (Hoffmann, 1970), and Input-Output Theory (Leontief, 1986). The second category, the theory of industrial structural adjustment, examines the relationship between industrial structural changes and economic development. Prominent theories include Lewis’s Dual Economy Theory (Lewis, 1954), Hirschman’s Unbalanced Growth Theory (Hirschman, 1958), and Rostow’s Stages of Economic Growth (Rostow, 1959). The third category, the theory of structural evolution models, explores how factors like foreign trade (Davis, 1997), finance (Ross et al., 2000), and technological progress influence industrial structure (Zhang and Hu, 2010). However, these theories are predominantly rooted in an economic efficiency-oriented view of industrialization. They pay insufficient attention to resilience mechanisms that enable the industrial system to function under external shocks and ecological constraints, which limits their applicability amid intensifying climate change and resource stress.
Resilience research has extended from natural sciences to interdisciplinary fields such as environmental economics, attracting increasing attention in regional green transition and sustainability studies. The concept of resilience was first introduced by ecologist Holling (Holling, 1973), originally referring to the capacity of ecosystems to maintain structural and functional stability under external disturbances. Given its relevance to regional economic recovery in ecological studies (Farber, 1995), the concept was later adopted in fields such as regional development and industrial policy. This extension gave rise to the notion of economic resilience (Martin, 2012; Martin et al., 2016; Klimek et al., 2019).
In recent years, traditional economic development models have faced growing pressure to balance economic growth with environmental protection. Correspondingly, research on economic resilience has gained increasing attention, primarily focusing on three aspects. First, the conceptualization and theoretical evolution of regional economic resilience has shifted from viewing resilience as a static state to a dynamic process (Rose, 2007). This shift has led to frameworks that incorporate resistance, recovery, adaptability, and transformability (Martin and Sunley, 2015; Grafton et al., 2019). The IPCC’s resilience framework—emphasizing resistance, recovery, and transformation—has also become a key reference for assessing regional adaptability (Denton et al., 2014; Singh and Chudasama, 2021). Second, spatial identification and trend analysis using tools such as the geographical detector have revealed significant spatial disparities. However, existing studies predominantly focus on national scales (Balland et al., 2015; Martin and Gardiner, 2019; Tan et al., 2020), economically developed urban agglomerations (Brakman et al., 2015; Liu et al., 2020; Zhang et al., 2022), or key industrial sectors (Jones et al., 2022; Parete et al., 2024; Zheng et al., 2024). As a result, insufficient attention has been paid to the resilience of industrial structures in ecologically vulnerable regions. Third, resilience is commonly assessed using methods such as indicator systems, core variable analysis, input–output models, and network structures (Xiao et al., 2024). While these approaches emphasize macro-level system responses to shocks, they often lack systematic characterization of internal structural dynamics and interaction strength at the micro level.
This study defines economic resilience as the capacity of an economy to withstand external disturbances and adjust its development trajectory accordingly. It offers a viable pathway to cope with shocks while sustaining economic growth and ensuring environmental protection. Industrial structure plays a central role in shaping regional economic resilience, and advancing economic resilience requires a fundamental transformation toward greater structural resilience. The aforementioned research offers valuable insights into the evolution of industrial structure and the development of economic resilience. However, three critical aspects relevant to current sustainability transitions remain insufficiently addressed. First, existing studies are predominantly concentrated in economically developed regions, with limited focus on the ecologically fragile regions such as Xizang and the transformation of their industrial sectors. Second, the majority of research relies on cross-sectional data, which constrains the ability to capture the long-term evolution of industrial linkages under the carbon neutrality target. Third, current methodologies tend to emphasize either national-level or single-sector evaluations, overlooking the dynamic inter-sectoral feedback effects within the input-output structures.
Ecologically fragile regions face compounded challenges—ecosystem vulnerability, dependence on resource-intensive industries, and underdeveloped economies—making them key constraints to regional sustainability (Tian et al., 2020; Fan et al., 2022; Erdogan, 2024). Taking plateau and mountainous regions as examples, areas such as Qinghai and Xizang in China (Immerzeel et al., 2020; Yao et al., 2022), as well as Nepal’s Hindu Kush Himalayan region (Tuladhar et al., 2021; Yang et al., 2022; Kapruwan et al., 2025), exhibit weak industrial foundations and limited resilience to external shocks. Similar challenges are widespread in arid ecologically fragile zones, including the Hexi Corridor in China (Pan et al., 2022; Shao et al., 2023), Kazakhstan in Central Asia (Ding et al., 2024; Wei et al., 2025), and the Ethiopian Highlands in Africa (Moat et al., 2017; Teku and Eshetu, 2024), which suffer from water scarcity and poor ecological recovery capacity.
Xizang Autonomous Region (hereafter ‘Xizang’) is located in the core area of the Qinghai-Tibet Plateau, subject to unique requirements in both economic development and environmental conservation (Hua et al., 2012; Zhou et al., 2020; Liu et al., 2023). It covers areas with fragile ecosystems sensitive to climate change and is also characterized by lower socioeconomic development (Moat et al., 2017). Meanwhile, China’s 14th Five-Year Plan (FYP) explicitly designates Xizang as a key region for plateau ecosystem protection and climate resilience strategies, with policy priorities including enhanced adaptive capacity and industrial restructuring (Xie et al., 2003; Zhang et al., 2024). Thus, Xizang exemplifies the resource–environment constraints and structural vulnerabilities typical of ecologically fragile regions, while also benefiting from a unique opportunity for green transition supported by national strategies. This study’s analysis of Xizang helps identify its industrial restructuring path and provides a reference for sustainable transitions in similar regions.
In summary, existing research lacks in-depth exploration of the dynamic interconnections of industrial structures and their policy adaptability in ecologically fragile regions. After clarifying the concept of economic resilience, this study, based on the 2012 and 2017 IOTs of the Xizang Autonomous Region, constructs a dynamic input-output model to analyze the temporal evolution and ripple effects of industrial linkages. It also builds on the influence coefficient (FC) and sensitivity coefficient (EC), integrating the IPCC's three resilience dimensions (resistance, recovery, and transformation) into a four-quadrant resilience model. The model helps identify key sector types and supports the design of tailored policy strategies, providing theoretical and decision-making references for promoting ecological security and high-quality transformation in Xizang.
2 Method and data
2.1 Assessment approach and models
The input-output model (IO Model) is a widely applied tool for analyzing industrial linkages and structural changes in industrial systems (Leontief, 1986). This model is rooted in general equilibrium theory and employs balance sheets to illustrate the sources of inputs and destinations of outputs for various sectors within an economy (Zhifu et al., 2016). We use statistical indicators such as the Intermediate Input Coefficient (IICj), Influence Coefficient (FCj), and Sensitivity Coefficient (ECi) to assess inter-industry economic resilience linkages (He and Yu, 2022). Sectors with high intermediate input coefficients tend to face greater environmental burdens and transformation pressures.
(1) The intermediate input coefficient (IICj) represents the ratio of intermediate inputs to total inputs in the jth industry of the economy. It is calculated as follows (Equation 1):
where
(2) Industrial ripple effect
The industrial ripple effect refers to the phenomenon where changes in one sector trigger a chain reaction of changes in others (Chen et al., 2023). This effect is captured through two key indicators: the influence coefficient and the sensitivity coefficient. The influence coefficient (FC) measures the total increase in output across all sectors resulting from a one-unit increase in the final demand of a given sector. A higher FC indicates a stronger capacity to drive economic activity, identifying the sector as a core economic driver (Kong et al., 2023). The sensitivity coefficient quantifies (EC) the output required from a specific sector in response to an increase in final demand across all other sectors. A higher EC suggests that the sector plays a more foundational or constraining role in the economy, often regarded as a basic or bottleneck sector (Kong et al., 2024). The corresponding relationships are presented in Equations 2 and 3.
where
2.2 Four-quadrant resilience model
To assess the resilience potential of different sectors in Xizang, this study develops an extended four-quadrant model that integrates the resilience dimensions proposed IPCC (resistance, recovery, and transformation) (Denton et al., 2014; Pörtner et al., 2023). The traditional four-quadrant model, which captures the coupling relationships between two indicators, has been widely applied in diverse fields such as economics and environmental studies (Juan et al., 2008; Yongxiu et al., 2020; Jiang et al., 2025).
In this study, the four-quadrant model employs the influence coefficient (FC) and sensitivity coefficient (EC) as the horizontal and vertical axes, respectively, to assess the structural position and economic significance of each sector within the regional economic system (Figure 1). Specifically, FC captures a sector’s influence ability (pull effect), while EC reflects its responsiveness to systemic shocks (push effect). By incorporating the IPCC’s resilience framework (resistance, recovery, and transformation), the model identifies sectors from both structural and functional resilience perspectives. Based on the combination of FC and EC values, four quadrant types are identified: Quadrant I (high FC-high EC), Quadrant II (low FC-high EC), Quadrant III (low FC-low EC), and Quadrant IV (high FC-low EC). The sectoral classification and associated resilience traits are detailed in Section 3.3.
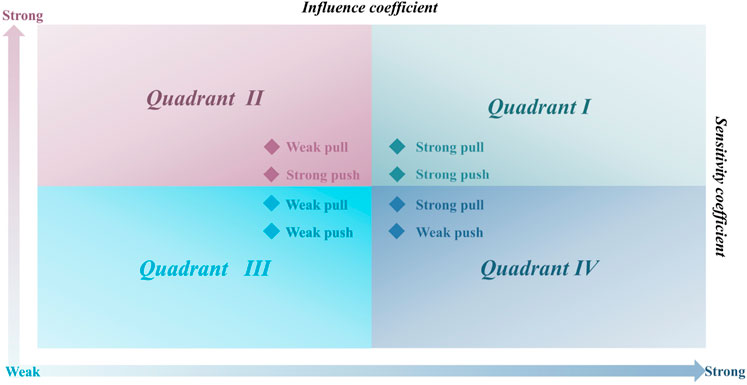
Figure 1. Four-quadrant diagram based on influence and sensitivity coefficients.
2.3 Data source and processing
This study employs monetary input-output tables (IOTs) and socio-economic statistics. The IOTs offer a structured representation of intersectoral economic relationships and are compiled by the National Bureau of Statistics of China every 5 years (NBSC, https://www.stats.gov.cn/english/, accessed August 15, 2025). However, regional IOTs for Xizang are available only for 2012 and 2017 (Liu et al., 2015). Socio-economic data for 1990–2020 were obtained from the China Statistical Yearbook and Xizang Statistical Yearbook (1990–2021). In addition, to align the sectors in the IOTs with those in the statistical yearbook, 42 sectors were aggregated into 21 representative sectors based on the Classification and Code Standard of National Economy Industry (GB/T 4754-2017) (NBSC, 2017) (Supplementary Table S1).
3 Results
3.1 Temporal evolution of industrial structure linkages in Xizang
3.1.1 Industrial structure shifts and associated challenges
Since the 12th Five-Year Plan, Xizang’s industrial structure has shifts toward a ‘3-2-1’ pattern, with the tertiary industry becoming dominant (Table 1). A modern industrial system has gradually emerged, characterized by an agricultural base, specialized plateau industries, and rapid expansion of services (Yu et al., 2011).
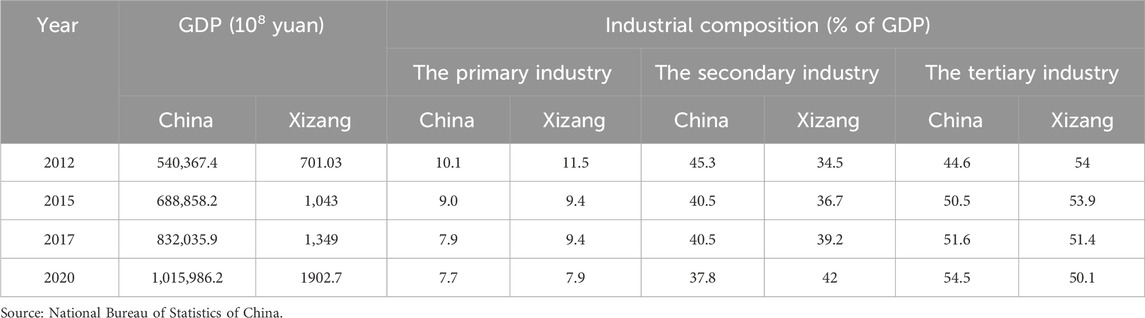
Table 1. Comparison of GDP and economic structure between national and Xizang, 2012–2020.
During 1990–1996, Xizang followed a “1-3-2” industrial pattern. Driven by the region’s unique geography and distinct historical-cultural traditions. Xizang’s industrial structure during this period was highly undiversified, dominated by crop farming and animal husbandry. The economy remained primarily pastoral, supplemented by limited subsistence-based mixed farming. Simultaneously, with growing national and regional support, modern industrial activities began to emerge. The service sectors, particularly transportation and telecommunications, expanded rapidly, resulting in a ‘1-3-2’ industrial structure in which the tertiary industry outpaced the secondary in both scale and growth (Figure 2).
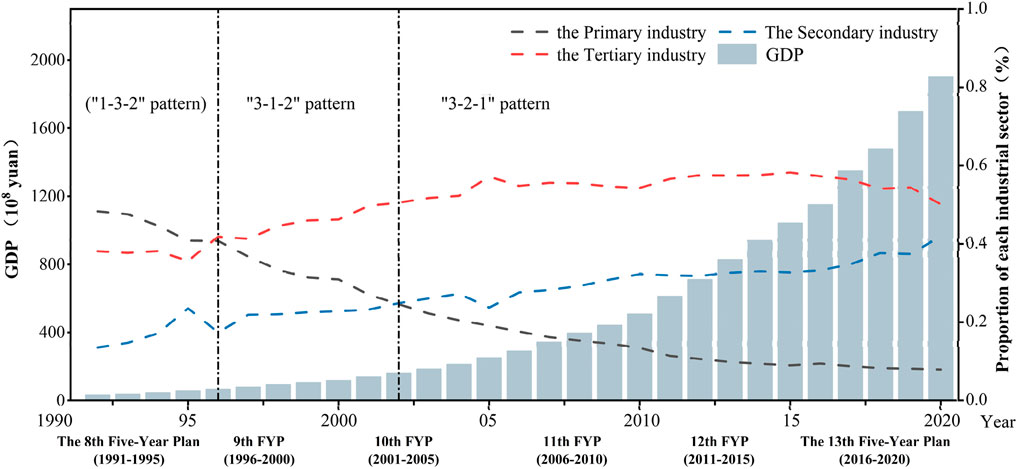
Figure 2. Time series of GDP and the proportion of the three industries in Xizang Autonomous Region from 1990 to 2020.
The period from 1997 to 2002, Xizang marked a transition toward a “1-3-2” industrial pattern. Following the Third National Conference on Xizang, the region’s tertiary industry underwent a near-leapfrogging surge in output, surpassing the primary industry in GDP contribution by 1997. It became the leading driver of regional economy activity, far exceeding the national average at the time (Zheng and Zhao, 2023). Meanwhile, supported by targeted industrial policies, the secondary industry experienced rapid growth. A plateau-oriented industrial system gradually took shape, with emerging sectors such as “wool textiles” and “pharmaceuticals” sectors playing increasingly prominent roles.
The early 2000s witnessed the consolidation of a “3-2-1” industrial structure in Xizang. Capitalizing on abundant natural and unique cultural resources, the tourism sector emerged as a core driver of economic growth, marking the rise of the tertiary industry’s emergence as a strategic pillar. Simultaneously, infrastructure-related activities, particularly in the construction sector underwent rapid expansion, largely propelled by the Qinghai-Xizang Railway project. By 2003, the output of the secondary industry has surpassed that of the primary industry. This transition solidified the “3-2-1” pattern, which remained stable thereafter.
However, the “3-2-1” pattern does not mean that the structural problems in Xizang’s economy have been resolved. Since 1997, the tertiary industry has expanded rapidly, reaching the “3-2-1” pattern by 2005, with its share stabilizing at 50%–60% of GDP—outpacing most Chinese provinces (Liu and Li, 2021). However, structural quality remains suboptimal. The agricultural sector, constrained by environmental conditions and a prevailing subsistence mindset among herders (Xu et al., 2024), continues its slow transition from traditional pastoralism to modern agriculture, with low productivity and limited commercialization. The secondary industry lags behind due to misaligned priorities, with the “construction” sector overshadowing manufacturing and contributing far below the national average (Figure 3). The tertiary industry, predominantly composed of low-tech, low-margin services, has further inflated the region’s economic scale without corresponding gains in efficiency or resilience.
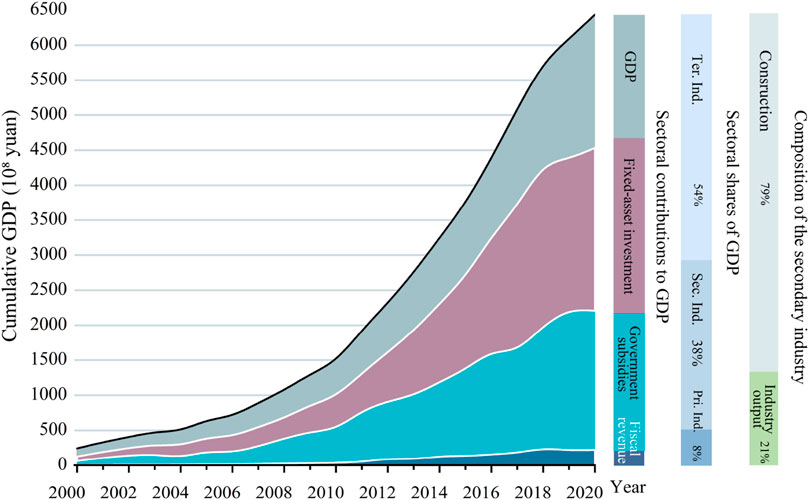
Figure 3. Cumulative GDP in the Xizang Autonomous Region from 2000 to 2020. Note: The right bar chart shows the composition of GDP growth by industry, including overall shares and the internal structure of the secondary industry.
In conclusion, while Xizang’s economy has exhibited rapid growth momentum in recent years, its overall scale remains limited, and the industrial structure remains suboptimal. Accelerating the transition toward a modern and sustainable industrial system is therefore imperative. Leveraging its late-mover advantage in industrial upgrading holds significant potential for advancing economic development, promoting ecological civilization, and protecting critical water source areas.
3.1.2 Changes in intermediate input coefficient in Xizang’s industrial structure
The intermediate input coefficient (IIC) of Xizang’s three major industries exhibited an overall upward trend, albeit with persistent structural disparities (Table 2). Amid tightening environmental regulations, the IIC of the primary industry declined slightly (−4.37%), while those of the secondary and tertiary industries increased by 23.90% and 11.58%, respectively. The secondary industry recorded the highest IIC at 62.10%, reflecting its strong economic linkages, yet it remains in a resource-intensive and low value-added development stage. Within the tertiary industry, traditional services exhibited higher IIC than modern services. This indicates that despite the latter's rapid growth and higher value-added potential, traditional services still dominate in economic inter-connectivity. Overall, the increasing IIC, mainly driven by the secondary industry, mirrors global industrialization patterns and reinforces earlier observations regarding its increasing contribution to value-added share.
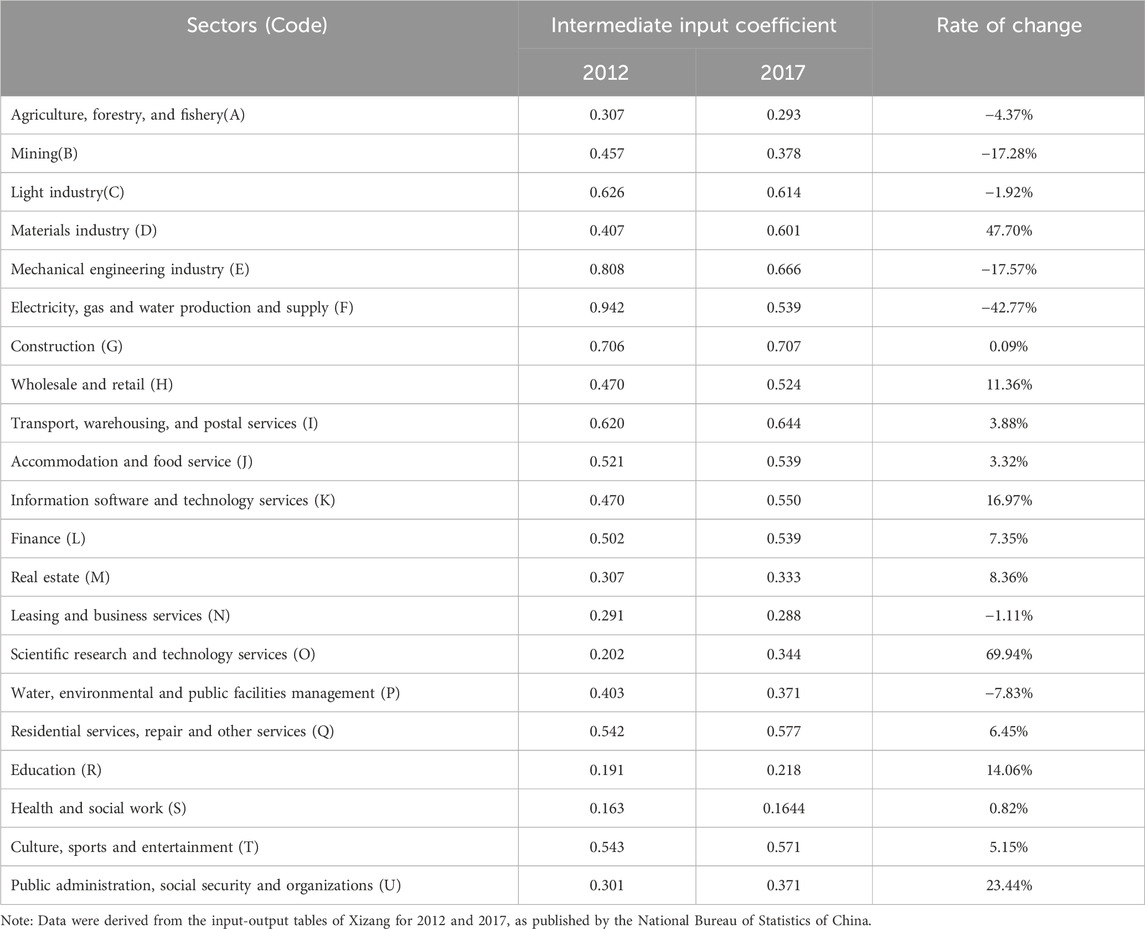
Table 2. Intermediate input coefficient of 21 sectors in Xizang from 2012 to 2017.
From 2012 to 2017, Xizang’s key driving industries, defined by IIC ≥ 0.5 (Equation 1), remained concentrated in “light industry” and “construction” sectors. These sectors exhibited strong economic linkages, with an average IIC of 66.32%, but were marked by low value-added and high resource consumption. In contrast, modern services, particularly high-value-added sectors such as “finance,” exhibited rapid growth but exerted weaker upstream driving effects. Notably, tourism-related public services recorded an IIC of 55.69% and a growth rate of 5.15%, underscoring the effectiveness of Xizang’s regional tourism promotion and global positioning strategies. Moving forward, industrial optimization should focus on leveraging local resource endowments, prioritizing high–intermediate–input sectors, and advancing eco-friendly and sustainable development pathways.
3.2 Spillover effects in Xizang’s industrial structure
From 2012 to 2017, Xizang’s industrial structure exhibited pronounced spillover effects, with notable variations in sectoral influence and sensitivity. These shifts reflect the impact of industrial policy adjustments and a gradual move toward greener development.
3.2.1 Changes in sectoral influence coefficient (FC)
Between 2012 and 2017, Xizang’s industrial structure and its sectoral influence coefficient (FC) underwent notable changes. The agricultural sector remained weak in systemic influence, with FC values consistently below 1 (0.772–0.796) (Table 3; Figure 4). The secondary industry continued to drive economic growth, shifting from resource-intensive sectors toward more environmentally friendly ones. Four of the five most influential sectors (FC > 1) belonged to the secondary industry, highlighting its key role in regional development. This shift aligns with national policies promoting industrial restructuring and the adoption of green technologies. While resource-intensive sectors exhibited marginal growth (0.01%) or substantial contraction (−51.65%), high-tech industries such as mechanical engineering expanded rapidly (FC = 1.331), indicating a transition towards green manufacturing. This structural evolution contributes to greater economic resilience and reduced environmental degradation. The tertiary industry remained dominated by traditional services, with an average FC equal to 1.12 times the social average. However, sectors such as “education” and recreational services showed notable growth. These trends highlight the need to better integrate modern services with primary and secondary industries to enhance system-level resilience and mitigate ecological pressures.
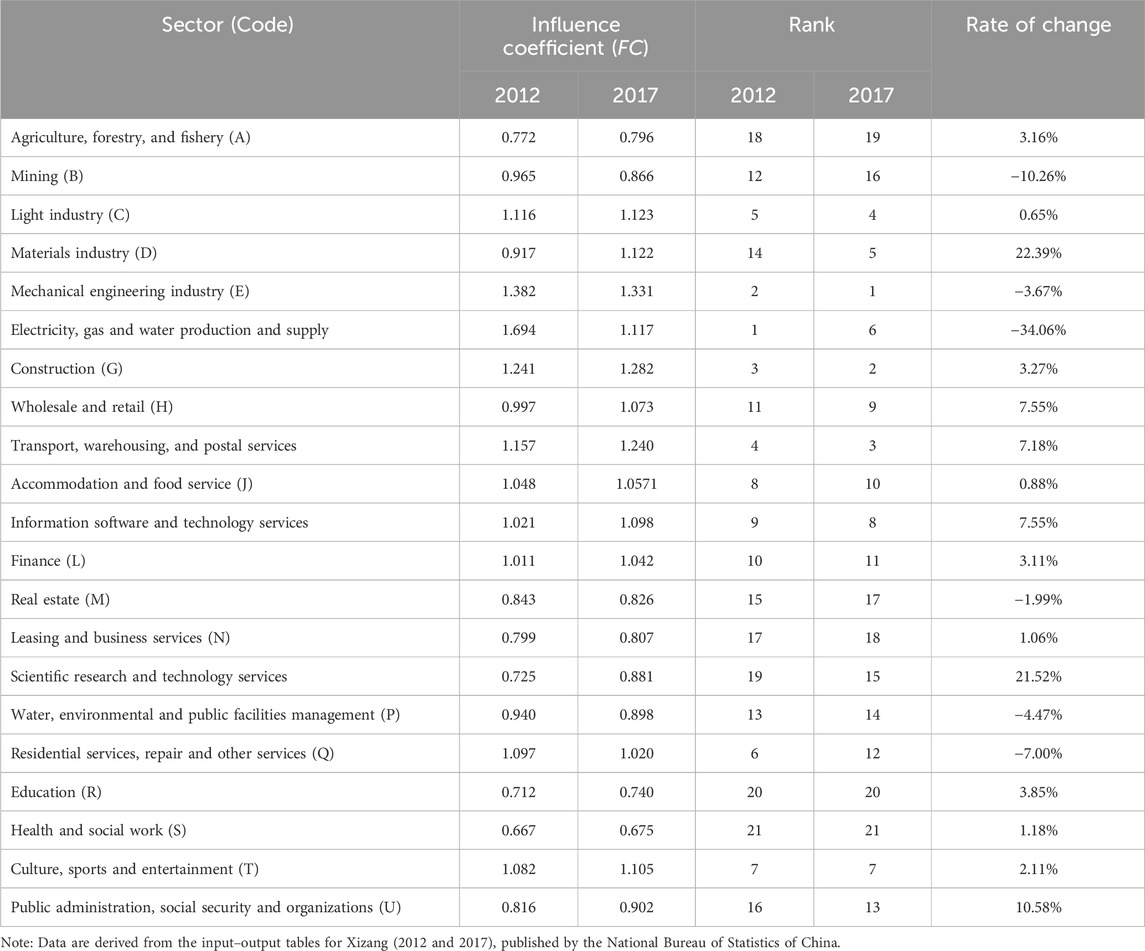
Table 3. Industrial influence coefficient and ranking of 21 sectors in Xizang.
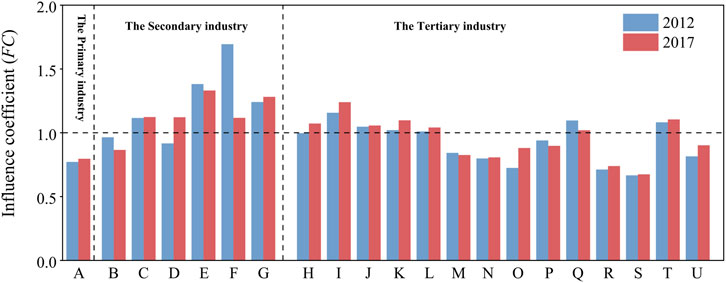
Figure 4. Comparison of influence coefficient (FC) across 21 sectors in 2012 and 2017. Sectors are labeled A-U as follows: A (Agriculture, Forestry, and Fishery), B (Mining), C (Light Industry), D (Materials Industry), E (Mechanical Engineering), F (Electricity, Gas, and Water), G (Construction), H (Wholesale and Retail), I (Transport, Warehousing, and Postal Services), J (Accommodation and Food Services), K (Information Software and Technology), L (Finance), M (Real Estate), N (Leasing and Business Services), O (Scientific Research and Technology), P (Water, Environmental, and Public Facilities), Q (Residential Services, Repair and Other Services), R (Education), S (Health and Social Work), T (Culture, Sports, and Entertainment), and U (Public Administration, Social Security, and Organizations).
3.2.2 Changes in sectoral sensitivity coefficient (EC)
From 2012 to 2017, the sensitivity coefficient (EC) of Xizang’s industrial structure showed a modest upward trend, with notable sectoral disparities, particularly in the secondary industry (Figure 5). This rise in sensitivity highlights an increasing responsiveness of industrial sectors to external shocks, including policy shifts and environmental constraints. The EC of the primary industry declined from 1.413 to 1.114, yet remained at 1.1 times the social average, suggesting continued systemic dependence on its inputs (Table 4). By contrast, the EC of the secondary industry rose to 1.73 times the average, indicating strong demand and heightened exposure to external market and environmental conditions. As the industrial structure evolved, heavy industries increasingly constrained economic growth, with their structural limitations becoming more evident. Despite efforts to promote new-type industrialization and improve quality, these sectors remain challenged by ecological policies and regional development constraints. In particular, sectors such as construction and energy, which depend heavily on natural resources and are sensitive to climate and policy changes, are under growing pressure to accelerate their transition toward green technologies to mitigate ecological and market risks.
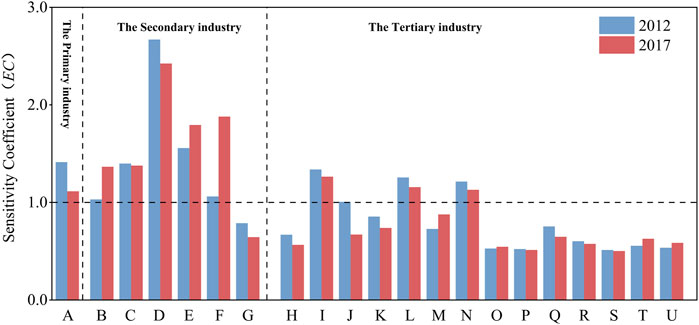
Figure 5. Comparison of sensitivity coefficient (EC) across 21 sectors in 2012 and 2017. Sectors are labeled A-U as follows: A (Agriculture, Forestry, and Fishery), B (Mining), C (Light Industry), D (Materials Industry), E (Mechanical Engineering), F (Electricity, Gas, and Water), G (Construction), H (Wholesale and Retail), I (Transport, Warehousing, and Postal Services), J (Accommodation and Food Services), K (Information Software and Technology), L (Finance), M (Real Estate), N (Leasing and Business Services), O (Scientific Research and Technology), P (Water, Environmental, and Public Facilities), Q (Residential Services, Repair and Other Services), R (Education), S (Health and Social Work), T (Culture, Sports, and Entertainment), and U (Public Administration, Social Security, and Organizations).
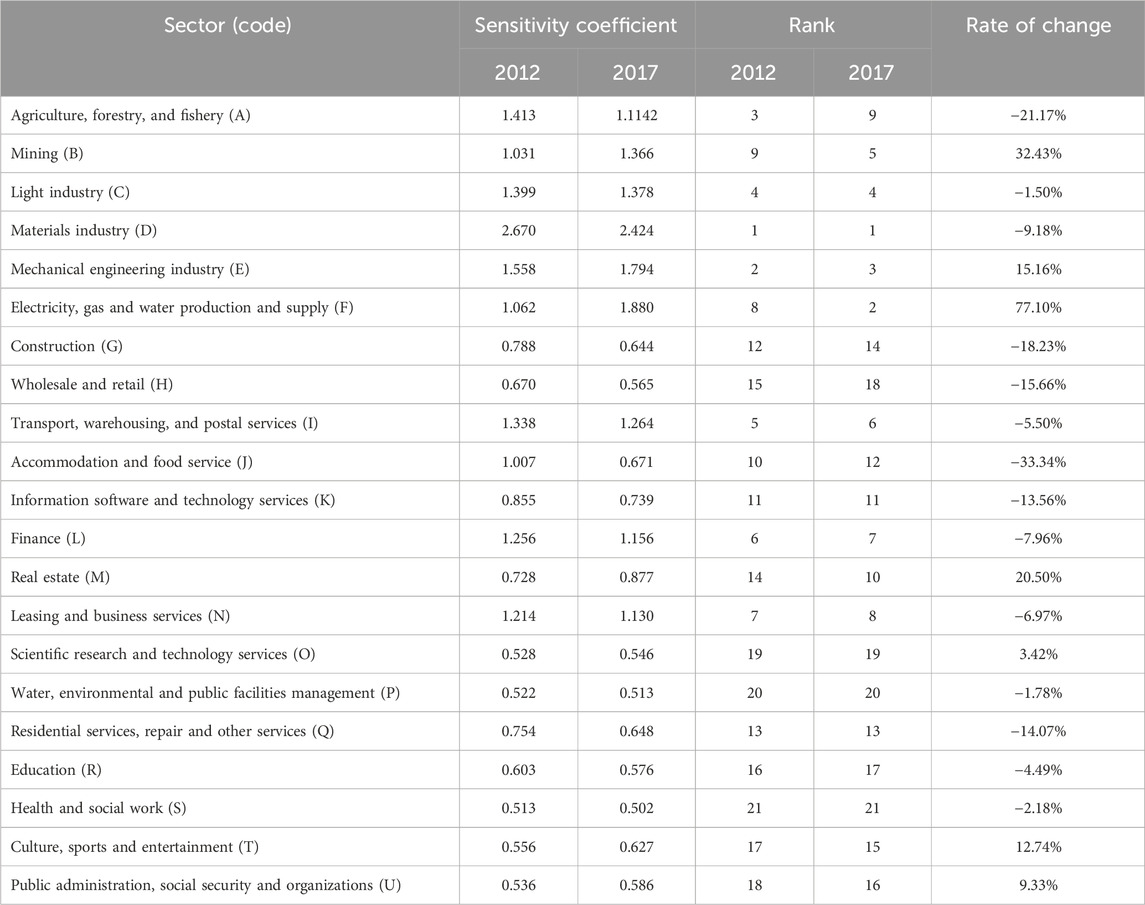
Table 4. Sensitivity coefficient and ranking results of 21 sectors in Xizang.
In addition, the sensitivity of the tertiary industry showed a gradual decline, especially in productive service sectors such as “transportation, warehousing, and postal services (I)”. These shifts highlight the urgency of integrating resilience considerations into industrial optimization strategies, especially in ecologically fragile and high-altitude regions.
3.3 Evolution of sectoral linkage and resilience characteristics in Xizang
The analysis of spillover effects in Xizang’s industrial structure provides a critical lens for evaluating economic resilience. Intersectoral linkages reflect the relative position and systemic roles of different sectors, laying a foundation for sectoral classification and policy design. Based on the results from FC and EC, a four-quadrant resilience model was developed to classify sectoral resilience types (Figure 6). The resilience characteristics of each quadrant are then analyzed using the IPCC’s dimensional resilience framework (Table 5), which details the correspondence between sectoral linkages and resilience characteristics for each quadrant.
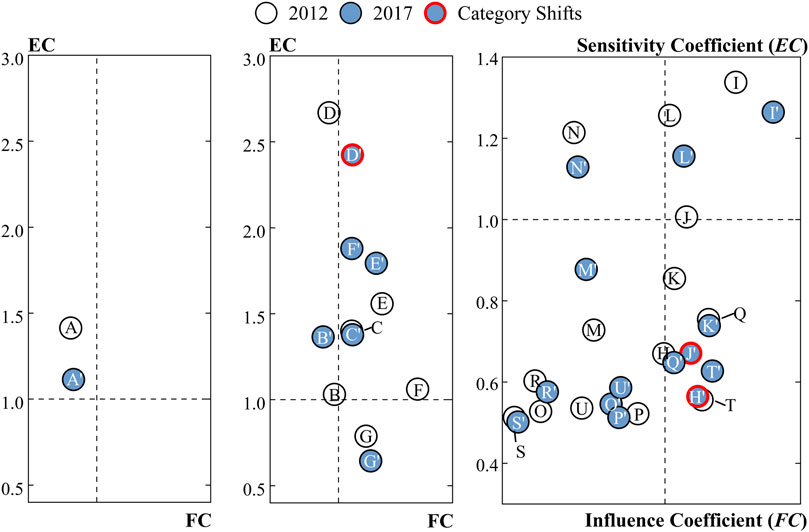
Figure 6. Trends in Xizang’s industrial structure across different periods. Sectors are coded as A-U, with prime symbols (e.g., A′) representing values from the later period. Specifically: A/A′ = Agriculture, forestry, and fishery; B/B′ = Mining; C/C′ = Light industry; D/D′ = Materials industry; E/E′ = Mechanical engineering industry; F/F′ = Electricity, gas and water production and supply; G/G′ = Construction; Wholesale and retail (H); I/I′ = Transport, warehousing, and postal services; J/J′ = Accommodation and food service; K/K′ = Information software and technology services; L/L′ = Finance; M/M′ = Real estate; N/N′ = Leasing and business services; O/O′ = Scientific research and technology services; P/P′ = Water, environmental and public facilities management; Q/Q′ = Residential services, repair and other services; R/R′ = Education; S/S′ = Health and social work; T/T′ = Culture, sports and entertainment; and U/U′ = Public administration, social security and organizations.
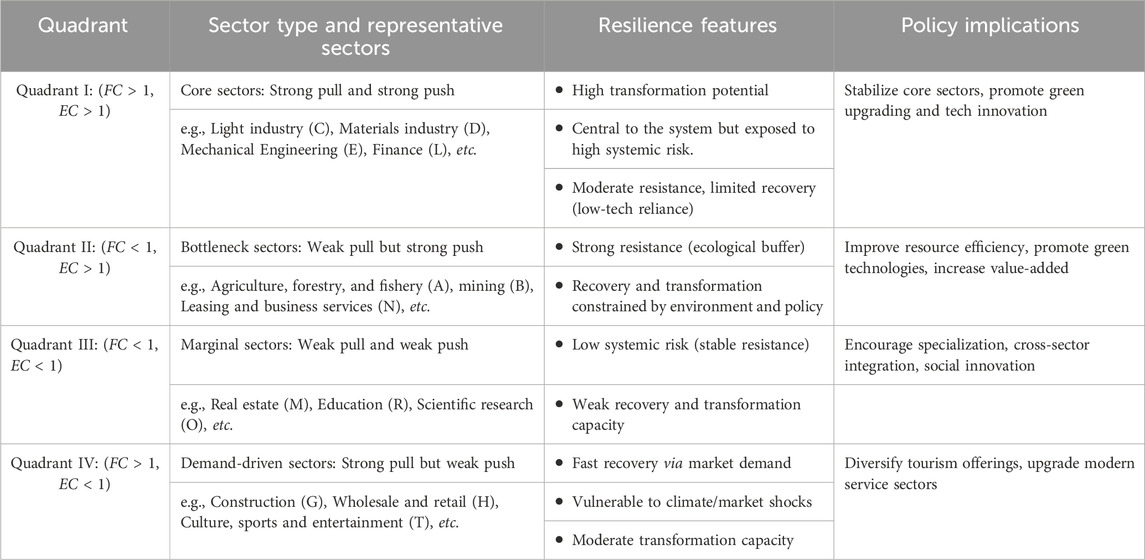
Table 5. Sectoral linkage types and resilience characteristics in Xizang.
In 2017, Quadrant I (FC > 1, EC > 1) encompassed six key sectors, including “light industry (C),” “materials industry (D),” “mechanical engineering (E),” “electricity and utilities (F),” “transport (I),” and “finance (L).” These sectors exhibited strong dual-directional linkages, exerting significant influence on both upstream and downstream activities, underscoring their central role in intermediate input supply and market demand stimulation. Over time, their FC and EC values increased, especially within secondary industries, indicating that mature yet low-tech sectors such as “light industry (C)” continued to drive economic activity in Xizang (Figure 6). From a resilience perspective, these resource-oriented manufacturing sectors demonstrated strong resistance, supported by solid infrastructure and economic relevance. However, their recovery capacity was hindered by resource dependency and low technological advancement. Nonetheless, their transformation potential remains high, particularly with policy support and R&D investment in green energy and sustainable finance, positioning them as strategic targets for industrial upgrading.
In 2017, Quadrant II (FC < 1, EC > 1) included three sectors: “agriculture, forestry, and fishery (A)”, “mining (B)”, and “leasing and business services (N)”. These sectors exhibited weak direct influence on other industries but played a fundamental role in supporting the regional economy. During the study period, the primary industry shifted downward-rightward, reflecting increased FC due to the development of characteristic agriculture, yet a decline in EC suggested limitations in meeting local industrial demands. “Mining (B)” sector experienced a sharp EC surge, largely constrained by ecological regulations. From a resilience perspective, Agriculture, forestry, and fishery (A) and Mining (B) serve as foundational sectors for resource security and social stability in Xizang. In particular, livestock husbandry underpins rural livelihoods and welfare. These sectors demonstrate strong resistance due to their long-standing integration into local systems. However, high resource dependency and ecological sensitivity weaken their recovery and transformation capacities. Improving resource use efficiency through smart agriculture and green mining, alongside cross-sector collaboration to upgrade agricultural value chains, can help strengthen both adaptability and resilience.
In 2017, Quadrant III (FC < 1, EC < 1) included six tertiary sectors: “real estate (M),” “scientific research (O),” “water and environmental management (P),” “education (R),” “health and social services (S),” and “public administration (U).” Characterized by weak pull and push effects, these sectors were typically underdeveloped or marginally integrated into the economic system. Their intersectoral influence remained low during the study period, with only modest FC increases in public service sectors under policy support. From a resilience perspective, these service-oriented sectors showed stable resistance, but their limited economic linkages constrained both recovery and transformation potential. Targeted policy support encouraging specialized development and social innovation—particularly in education and research—could enhance their systemic connectivity and long-term resilience.
In 2017, Quadrant IV (FC > 1, EC < 1) primarily included tourism-related sectors such as “construction (G),” “wholesale and retail (H),” “accommodation and food service (J),” “information software and technology services (K),” “residential services, repair and other services (Q).” These sectors exhibited strong pull but weak push effects, with rising FC values reflecting dominance of a low-value, seasonally driven tourism pattern. From a resilience perspective, their market orientation supports high recovery capacity. However, overdependence on seasonal tourism undermines resistance and heightens vulnerability. Despite abundant tourism resources, the tertiary sector has yet to fully convert these advantages into sustained economic benefits. Enhancing resilience in these sectors calls for a shift toward year-round tourism, service diversification, and industrial upgrading.
4 Conclusion and discussions
Achieving sustainability is key to balancing socioeconomic improvement and environmental conservation in cities and regions. By analyzing Xizang’s industrial structure and its evolution over the past decade, we quantified the relationships and changing trends among industries. These were assessed in terms of output variation, sectoral relevance, and ripple effects. Furthermore, by employing a resilience-based four-quadrant model, it identified sector-specific differences in resistance, recovery, and transformation potential, offering theoretical guidance for formulating more targeted policies to support high-quality and sustainable development.
Xizang has experienced notable economic growth in recent years; however, its industrial linkages remain weak, and the overall quality of development is suboptimal. Although the tertiary industry’s share increased significantly from 2012 to 2017, modern service sectors have not been effectively integrated with agriculture and manufacturing, contributing to rising environmental pressures. Meanwhile, the intermediate input coefficient in the secondary industry rose by 23.9%, reaching an average of 62.1%, with sectors like construction exceeding 70% yet delivering limited profitability. These trends indicate inefficiencies in resource utilization and structural imbalances across sectors. To address these challenges, stronger sectoral synergies should be fostered through technological innovation and targeted policy interventions.
To enhance the resilience of Xizang’s industrial system, policies should be tailored. Priority should be given to sectors in Quadrant I to accelerate green transformation. These sectors serve as the backbone of the industrial system with high systemic embeddedness and strong spillover effects. Disruptions in these sectors may cause cascading impacts across value chains. Although they exhibit strong resistance, their recovery and transformation capacities are limited due to resource dependence and weak technological foundations. Accelerated green upgrading, supported by strategic investment in clean energy and green finance, is critical to reducing systemic risk and enhancing long-term sustainability. Recent efforts to extend traditional value chains—such as Tibetan medicine and natural mineral water—and to attract digital economy leaders like Huawei and Alibaba highlight Xizang’s growing momentum in industrial upgrading. Major initiatives launched in Lhasa (the capital of Xizang) further demonstrate this momentum.
Secondly, policy efforts should enhance the ecological adaptability and value generation of Quadrant II sectors, notably agriculture and mining. While these sectors are vital for resource security and livelihood stability, their recovery and transformation are constrained by resource dependence and weak innovation. Targeted promotion of smart agriculture and green mining technologies can improve resource efficiency and resilience. In regions such as Shigatse and Shannan, two cities in Xizang, agricultural data platforms and smart livestock systems have improved resource use and disaster response, illustrating a viable pathway for transitioning highland agriculture toward eco-efficient and high-value development.
Third, policy should be given to enhancing the functionality and innovation capacity of public services and infrastructure in Quadrant III. Although sectors such as education and healthcare exhibit low economic connectivity and limited driving capacity, they are vital for long-term societal stability due to their strong resistance and institutional support. These sectors should be supported through targeted fiscal investment and policy incentives to improve service quality and foster innovation. For instance, recent efforts in Xizang have significantly expanded transportation, water infrastructure, and cultural service networks, improving service accessibility in remote areas and strengthening systemic connectivity and resilience.
Finally, strengthening the resilience of tourism-related sectors in Quadrant IV is essential. As a leading driver of Xizang’s economic transformation, the tourism industry offers strong spillover and employment benefits but remains vulnerable due to its reliance on seasonal demand. Policy efforts should focus on advancing all-season development and full-chain integration, fostering deeper linkages with agriculture, wellness, and education. Recent initiatives such as “Winter Tour in Xizang” have facilitated a shift from traditional sightseeing to diversified tourism. This shift has laid the groundwork for cross-industry synergies, thereby reinforcing the integrated resilience of Xizang’s economy.
In general, balancing industrial growth with environment protection is crucial for Xizang’s future resilient development. A differentiated and prioritized approach to resilience building is essential. Sectors in Quadrant I should be prioritized due to their central role and systemic risk. Quadrant IV, particularly tourism, follows as an emerging growth engine despite seasonal vulnerability. Quadrant II requires steady support for ecological and livelihood stability. Quadrant III can be addressed over the longer term, focusing on social innovation and infrastructure. A coordinated policy framework across quadrants can support both economic efficiency and environmental sustainability in Xizang’s development trajectory.
Data availability statement
The original contributions presented in the study are included in the article/Supplementary Material, further inquiries can be directed to the corresponding author.
Author contributions
YH: Writing – review and editing, Software, Methodology, Writing – original draft, Visualization, Data curation, Conceptualization. QL: Data curation, Writing – review and editing. WZ: Supervision, Writing – review and editing, Funding acquisition, Formal Analysis.
Funding
The author(s) declare that financial support was received for the research and/or publication of this article. This research was supported by the Second Tibetan Plateau Scientific Expedition and Research Program (STEP) (Grant No. 2019QZKK020805), and the Natural Science Foundation of Gansu Province (Grant No. 23JRRA583).
Conflict of interest
The authors declare that the research was conducted in the absence of any commercial or financial relationships that could be construed as a potential conflict of interest.
Generative AI statement
The author(s) declare that no Generative AI was used in the creation of this manuscript.
Any alternative text (alt text) provided alongside figures in this article has been generated by Frontiers with the support of artificial intelligence and reasonable efforts have been made to ensure accuracy, including review by the authors wherever possible. If you identify any issues, please contact us.
Publisher’s note
All claims expressed in this article are solely those of the authors and do not necessarily represent those of their affiliated organizations, or those of the publisher, the editors and the reviewers. Any product that may be evaluated in this article, or claim that may be made by its manufacturer, is not guaranteed or endorsed by the publisher.
Supplementary material
The Supplementary Material for this article can be found online at: https://www.frontiersin.org/articles/10.3389/fenvs.2025.1625519/full#supplementary-material
References
Balland, P.-A., Rigby, D., and Boschma, R. (2015). The technological resilience of US cities. Camb. J. Regions, Econ. Soc. 8, 167–184. doi:10.1093/cjres/rsv007
Brakman, S., Garretsen, H., and Van Marrewijk, C. S. (2015). Regional resilience across Europe: on urbanisation and the initial impact of the great recession. Camb. J. Regions, Econ. 8, 225–240. doi:10.1093/cjres/rsv005
Chen, J., Shi, Y., and Yan, X. (2023). WEF industry correlation and ripple effect in yangtze River Economic Belt. South-to-North Water Transf. Water Sci. Technol. 4, 597–607. doi:10.13476/j.cnki.nsbdqk.2023.0060
Cui, S., and Yang, Y. (2022). The geopolitical origins and geostrategic logics of Russia-Ukraine conflict, 41, Geogr. Res. 2065–2075. doi:10.11821/dlyj020220238
Davis, D. R. (1997). The home market, trade, and industrial structure. Cambridge, MA: National Bureau of Economic Research.
Denton, F., Wilbanks, T., Abeysinghe, A. C., Burton, I., Gao, Q., Lemos, M. C., et al. (2014). “Climate change 2014: impacts, adaptation, and vulnerability,” in Part A: Global and Sectoral Aspects. Contribution of Working Group II to the Fifth Assessment Report of the Intergovernmental Panel on Climate Change. Editors C. B. Field, V. R. Barros, and D. J. Dokken (Cambridge, United Kingdom: Cambridge University Press), 1101–1131.
Ding, Q., Wang, L., and Fu, M. (2024). Spatial characteristics and trade-offs of ecosystem services in arid central Asia. Ecol. Indic. 161, 111935. doi:10.1016/j.ecolind.2024.111935
Erdogan, S. (2024). On the impact of natural resources on environmental sustainability in African countries: a comparative approach based on the EKC and LCC hypotheses. Resour. Policy 88, 104492. doi:10.1016/j.resourpol.2023.104492
Fan, M., Li, M., Liu, J., and Shao, S. (2022). Is high natural resource dependence doomed to low carbon emission efficiency? Evidence from 283 cities in China. Energy Econ. 115, 106328. doi:10.1016/j.eneco.2022.106328
Farber, S. J. E. E. (1995). Economic resilience and economic policy, Ecol. Econ. 15, 105–107. doi:10.1016/0921-8009(95)00061-5
Grafton, R. Q., Doyen, L., Béné, C., Borgomeo, E., Brooks, K., Chu, L., et al. (2019). Realizing resilience for decision-making. Nat. Sustain. 2, 907–913. doi:10.1038/s41893-019-0376-1
He, C., and Yu, C. (2022). Multi-dimensional proximity, trade barriers and the dynamic evolution of industrial linkages between China and the world market. Acta Geogr. Sin. 77, 275–294. doi:10.11821/dlxb202202002
Holling, C. S. (1973). Resilience and stability of ecological systems. Annu. Rev. Ecol. Syst. 4, 1–23. doi:10.1146/annurev.es.04.110173.000245
Hua, H., Pan, Y., Yang, X., Wang, S., and Shi, Y. (2012). Dynamic relations between energy carbon footprint and economic growth in ethnic minority autonomous regions, China. Energy Procedia 17, 273–278. doi:10.1016/j.egypro.2012.02.094
Immerzeel, W. W., Lutz, A. F., Andrade, M., Bahl, A., Biemans, H., Bolch, T., et al. (2020). Importance and vulnerability of the world’s water towers. Nature 577, 364–369. doi:10.1038/s41586-019-1822-y
Jiang, F., Chen, B., and Duan, C. (2025). Mitigating China's prefecture-level economic risk of water scarcity: the role of water conservation and carbon neutrality policies. Resour. Conserv. Recycl. 215, 108140–140. doi:10.1016/j.resconrec.2025.108140
Jones, N. A., Bellamy, J., Bellotti, W., Ross, H., Van Bommel, S., and Liu, Y. (2022). A shock to the system: what the COVID-19 pandemic reveals about Australia's food systems and their resilience. Front. Sustain. Food Syst. 5, 790694. doi:10.3389/fsufs.2021.790694
Juan, Z., Xingmin, M., Fei, W., Peng, G., and Juanshe, Z. (2008). Using four-quadrant model to discuss water resource value theory. Res. Soil and Water Conservation 15, 134–136.
Kapruwan, R., Saksham, A. K., Ford, J. D., Petzold, J., Mcdowell, G., Rufat, S., et al. (2025). Climate change adaptation in global mountain regions requires a multi-sectoral approach. Commun. Earth and Environ. 6, 454. doi:10.1038/s43247-025-02444-5
Klimek, P., Poledna, S., and Thurner, S. (2019). Quantifying economic resilience from input–output susceptibility to improve predictions of economic growth and recovery. Nat. Commun. 10, 1677. doi:10.1038/s41467-019-09357-w
Kong, S., Li, H., and Zhang, C. (2023). An linkage analysis of xizang's agriculture and animal husbandry industry and its development strategy. J. Tibet. Univ. Soc. Sci. 38, 163–172. doi:10.16249/j.cnki.1005-5738.2023.04.019
Kong, S., Li, H., and Yu, Z. (2024). Characteristic measurement and comparative analysis of the culture and tourism integration in Tibet based on input-output theory and symbiosis theory. J. Tibet. Univ. Soc. Sci. 39, 187–198. doi:10.16249/j.cnki.1005-5738.2024.03.021
Kuznets, S. (1949). National income and industrial structure. Econometrica 17, 205–241. doi:10.2307/1907310
Lesk, C., Rowhani, P., and Ramankutty, N. J. N. (2016). Influence of extreme weather disasters on global crop production, Nature 529, 84–87. doi:10.1038/nature16467
Lewis, W. A. (1954). Economic development with unlimited supplies of labour. Manch. Sch. 22, 139–191. doi:10.1111/j.1467-9957.1954.tb00021.x
Liu, L., and Li, Y. (2021). Research on the evolution path of China's Xizang policy since reform and opening up: based on the seven symposiums on work in Xizang. J. Xizang Minzu Univ. Philos. Soc. Sci. 42, 42–49+155.
Liu, Z., Guan, D., Wei, W., Davis, S. J., Ciais, P., Bai, J., et al. (2015). Reduced carbon emission estimates from fossil fuel combustion and cement production in China. Nature 524, 335–338. doi:10.1038/nature14677
Liu, Y., Ji, J., Zhang, Y., and Yang, Y. (2020). Economic resilience and spatial divergence in the Guangdong-Hong Kong-Macao Greater Bay Area in China. Geogr. Res. 39, 2029–2043. doi:10.11821/dlyj020200418
Liu, H., Cheng, Y., Liu, Z., Li, Q., Zhang, H., and Wei, W. (2023). Conflict or coordination? The spatiotemporal relationship between humans and Nature on the Qinghai-Tibet Plateau. Earth's Future 11, e2022EF003452–52. doi:10.1029/2022ef003452
Martin, R. (2012). Regional economic resilience, hysteresis and recessionary shocks. J. Econ. Geogr. 12, 1–32. doi:10.1093/jeg/lbr019
Martin, R., and Gardiner, B. (2019). The resilience of cities to economic shocks: a tale of four recessions (and the challenge of Brexit). Pap. Regional Sci. 98, 1801–1833. doi:10.1111/pirs.12430
Martin, R., and Sunley, P. (2015). On the notion of regional economic resilience: conceptualization and explanation. J. Econ. Geogr. 15, 1–42. doi:10.1093/jeg/lbu015
Martin, R., Sunley, P., Gardiner, B., and Tyler, P. (2016). How regions react to recessions: resilience and the role of economic structure. Reg. Stud. 50, 561–585. doi:10.1080/00343404.2015.1136410
Moat, J., Williams, J., Baena, S., Wilkinson, T., Gole, T. W., Challa, Z. K., et al. (2017). Resilience potential of the Ethiopian coffee sector under climate change. Nat. Plants 3, 17081–14. doi:10.1038/nplants.2017.81
Nbsc, N. B. O. S. O. C. (2017). The classification and code standard of national economy industry (GB/T 4754-2017). Standardization administration. Available online at: https://www.stats.gov.cn/xxgk/tjbz/gjtjbz/201710/t20171017_1758922.html. (Accessed August 15, 2025).
Pan, N., Du, Q., Guan, Q., Tan, Z., Sun, Y., and Wang, Q. (2022). Ecological security assessment and pattern construction in arid and semi-arid areas: a case study of the Hexi Region, NW China. Ecol. Indic. 138, 108797. doi:10.1016/j.ecolind.2022.108797
Parete, G., Bruno, M. F., Calabrese, P., Carlucci, R., Chiarulli, M., D'onghia, G., et al. (2024). Climate impacts and adaptation strategies for coastal erosion, aquaculture, and tourism along the Adriatic side of Apulia region. Front. Clim. 6, 1378253. doi:10.3389/fclim.2024.1378253
Pörtner, H.-O., Roberts, D. C., Tignor, M. M. B., and Poloczanska, E. (2023). “Climate Change 2022: impacts, adaptation and vulnerability,” in Climate change 2022 – impacts, adaptation and Vulnerability: Working Group II contribution to the sixth assessment report of the intergovernmental Panel on climate change. Editor I. P. O. C. Change (Cambridge: Cambridge University Press), 121–196.
Rose, A. (2007). Economic resilience to natural and man-made disasters: multidisciplinary origins and contextual dimensions. Environ. Hazards 7, 383–398. doi:10.1016/j.envhaz.2007.10.001
Ross, L., Norman, L., and Thorsten, B. (2000). Financial intermediation and growth: causality and causes. J. Mone. Econ. 46, 31–77. doi:10.1016/s0304-3932(00)00017-9
Rostow, W. W. (1959). The stages of economic growth. Econ. Hist. Rev. 12, 1–16. doi:10.1111/j.1468-0289.1959.tb01829.x
Shao, W., Wang, Q., Guan, Q., Zhang, J., Yang, X., and Liu, Z. (2023). Environmental sensitivity assessment of land desertification in the Hexi Corridor, China. Catena 220, 106728. doi:10.1016/j.catena.2022.106728
Singh, P. K., and Chudasama, H. (2021). Pathways for climate resilient development: human well-being within a safe and just space in the 21st century. Glob. Environ. Change 68, 102277. doi:10.1016/j.gloenvcha.2021.102277
Tan, J., Zhao, H., Liu, W., Zhang, P., and Qiu, F. (2020). Regional economic resilience and influential mechanism during economic crises in China. Sci. Geogr. Sin. 40, 173–181. doi:10.13249/j.cnki.sgs.2020.02.002
Teku, D., and Eshetu, S. (2024). Impact of climatic variabilities and extreme incidences on the physical environment, public health, and people’s livelihoods in Ethiopia. Front. Clim. 6, 1435138. doi:10.3389/fclim.2024.1435138
Tian, X., Sarkis, J., Geng, Y., Bleischwitz, R., Qian, Y., Xu, L., et al. (2020). Examining the role of BRICS countries at the global economic and environmental resources nexus. J. Environ. Manag. 262, 110330. doi:10.1016/j.jenvman.2020.110330
Tuladhar, S., Pasakhala, B., Maharjan, A., and Mishra, A. (2021). Unravelling the linkages of cryosphere and mountain livelihood systems: a case study of Langtang, Nepal. Adv. Clim. Change Res. 12, 119–131. doi:10.1016/j.accre.2020.12.004
United Nations, Department of Economic and Social Affairs (2024). World Social Report 2024: Social Development in Times of Converging Crises: A Call for Global Action. New York, NY: United Nations.
Wei, Y., Tao, H., Kundzewicz, Z. W., Mondal, S. K., Wang, A., Li, Y., et al. (2025). Natural and anthropogenic contributions to desertification in Central Asia. Catena 257, 109154. doi:10.1016/j.catena.2025.109154
Xiao, X., Wang, Z., and Li, S. (2024). Research progress on measurement methods of industrial chain resilience. Econ. Perspect. 4, 144–160.
Xie, G.-D., Lu, C. X., Leng, Y.-F., Zheng, D., and Li, S. (2003). Ecological assets valuation of the Tibetan Plateau. J. Nat. Resour. 18, 189–196.
Xu, X., Liu, X., Guan, J., Yang, J., Wang, M., and Bao, L. (2024). Spatiotemporal evolution and driving factors of high-quality development of cultural and tourism integration in border ethnic areas in western China. Arid Land Geogr. 47, 1596–1605.
Yang, C., Liu, H., Li, Q., Wang, X., Ma, W., Liu, C., et al. (2022). Human expansion into Asian highlands in the 21st century and its effects. Nat. Commun. 13, 4955. doi:10.1038/s41467-022-32648-8
Yao, T., Thompson, L., Chen, D., and Piao, S. E. (2022). Reflections and future strategies for Third Pole Environment. Nat. Rev. Earth 3, 608–610. doi:10.1038/s43017-022-00342-4
Yongxiu, S., Shiliang, L., Fangning, S., Yi, A., Mingqi, L., and Yixuan, L. (2020). Spatio-temporal variations and coupling of human activity intensity and ecosystem services based on the four-quadrant model on the Qinghai-Tibet Plateau. Sci. Total Environ. 743, 140721. doi:10.1016/j.scitotenv.2020.140721
Yu, D., Gan, C., and Zheng, R. (2011). Industrial linkages in China-An empirical research based on structural decomposition technique of input-output model. Chin. Ind. Econ. 11, 5–15. doi:10.19581/j.cnki.ciejournal.2011.11.001
Yuan, Z., and Hu, W. (2023). Urban resilience to socioeconomic disruptions during the COVID-19 pandemic: evidence from China. Int. J. Disaster Risk Reduct. 91, 103670. doi:10.1016/j.ijdrr.2023.103670
Zhang, Z., and Hu, J. (2010). Total-factor energy productivity growth, technical progress, and efficiency change: an empirical study of China. Appl. Energy 87, 3262–3270. doi:10.1016/j.apenergy.2010.04.026
Zhang, Y., Yang, Y., Wei, S., Ma, Z., Tian, M., Sun, M., et al. (2022). Research on spatial structure and resilience of complex urban network: a case study of jing-jin-ji Urban Agglomeration. Front. Environ. Sci. 10, 999124. doi:10.3389/fenvs.2022.999124
Zhang, Y., Zhao, X., Gong, J., Luo, F., and Pan, Y. (2024). Effectiveness and driving mechanism of ecological restoration efforts in China from 2009 to 2019. Sci. Total Environ. 910, 168676–176. doi:10.1016/j.scitotenv.2023.168676
Zheng, Z., and Zhao, Y. (2023). An empirical Study on the contribution of human capital to economic growth in Xizang: based on the perspective of demographic dividend. J. Ethnol. 14, 85–96.
Zheng, H., Zhong, W., and Xi, X. (2024). The resilience and determinants of global mineral resource supply chains: a network percolation perspective. Front. Earth Sci. 12, 1443668. doi:10.3389/feart.2024.1443668
Zhifu, M., Yunkun, Z., Dabo, G., Yuli, S., Zhu, L., Ronggang, C., et al. (2016). Consumption-based emission accounting for Chinese cities. Appl. Energy 184, 1073–1081. doi:10.1016/j.apenergy.2016.06.094
Keywords: sectoral structure, input–output model, sectoral interconnection, resilient development, Xizang, Tibetan Plateau
Citation: Hu Y, Liang Q and Zhang W (2025) Dynamic analysis of sectoral linkages for resilient development in Xizang based on input-output model. Front. Environ. Sci. 13:1625519. doi: 10.3389/fenvs.2025.1625519
Received: 09 May 2025; Accepted: 05 August 2025;
Published: 18 September 2025.
Edited by:
Riccardo Boero, Norwegian Institute for Air Research, NorwayReviewed by:
Xiao Ding, Macau University of Science and Technology, Macao, SAR ChinaShiwei Zhou, Ocean University of China, China
Copyright © 2025 Hu, Liang and Zhang. This is an open-access article distributed under the terms of the Creative Commons Attribution License (CC BY). The use, distribution or reproduction in other forums is permitted, provided the original author(s) and the copyright owner(s) are credited and that the original publication in this journal is cited, in accordance with accepted academic practice. No use, distribution or reproduction is permitted which does not comply with these terms.
*Correspondence: Wei Zhang, emhhbmd3MDZAbHpiLmFjLmNu