 Ying Zhang1*
 Xinhao Lin
- 1School of Economics and Management, Beijing Forestry University, Beijing, China
- 2School of Electronic Information, Zhongyuan University of Science and Technology, Zhengzhou, China
Introduction: Understanding the interplay between wetland ecosystems and agricultural crop development is vital for sustainable water and food resource management amid climate variability. Emerging technologies in artificial intelligence (AI) and big data analytics now offer powerful tools to integrate multiscale remote sensing with ecosystem modeling.
Methods: This study introduces a unified framework that combines remote sensing and AI-driven inference to monitor the spatiotemporal dynamics of wetland hydrology and crop phenology, aligning with modern approaches to integrated resource management. Traditional remote sensing methods often struggle to capture the temporal variability and complex dependencies in such ecosystems due to their reliance on static thresholds and single-modality data. To overcome these limitations, we propose an AI-enhanced methodology comprising two modules: the Graph-Augmented Attention Recommendation Network (GAARN) and the Multi-Perspective Preference Distillation (MPPD) strategy. GAARN fuses structural insights from environmental graphs with temporal patterns via attention-based encoders, enabling detailed mapping of land-water-vegetation transitions. MPPD incorporates semantic knowledge from ecological ontologies, meteorological data, and crop taxonomies to guide learning through consistency regularization and contrastive embedding alignment.
Results: Our dual-module framework offers robust interpretation of sparse observations, adaptive forecasting under climate variability, and scalable modeling of wetland-crop interactions. Validation across diverse agroecological zones reveals superior performance over conventional baselines in predicting vegetative indices, water extent changes, and crop growth stages.
Discussion: These results highlight the potential of our framework for advancing precision agriculture, wetland monitoring, and climate-resilient policy-making.
1 Introduction
Wetlands play a crucial role in maintaining global ecological balance by regulating cycles, filtering pollutants, sequestering carbon, and supporting rich biodiversity. However, due to increasing anthropogenic pressures and climate change, wetland ecosystems are experiencing rapid degradation Bao et al. (2023). At the same time, adjacent agricultural areas, particularly croplands, are highly dynamic and strongly influenced by wetland conditions. Thus, accurately monitoring wetland dynamics and crop development is essential for sustainable land and water resource management Zhang et al. (2023). Traditional field-based ecological surveys are time-consuming and spatially limited, making them inadequate for capturing the complex spatiotemporal changes occurring across extensive wetland-agricultural interfaces. Not only does remote sensing offer a scalable, cost-effective alternative, but it also enables integrated analysis across temporal and spatial resolutions Ko et al. (2022). Therefore, multiscale remote sensing techniques emerge as a powerful solution to bridge the gap between fine-resolution ecological monitoring and large-scale agricultural management, providing comprehensive insights into ecosystem functionality and crop phenology Forouzandeh et al. (2022).
Early efforts to utilize remote sensing data for wetland and cropland monitoring primarily relied on rule sets derived from expert knowledge and domain-specific heuristics Sun et al. (2022). These methods often used spectral indices, such as NDVI and water indices, in combination with ancillary datasets like topography and soil type to delineate water bodies, detect vegetation patterns, and classify land cover types Kreutz and Schenkel (2022). Although effective in specific regions and timeframes, these strategies typically required substantial manual tuning and exhibited limited adaptability when applied to diverse environmental settings. Their reliance on fixed thresholds and expert-defined parameters made them insufficient for capturing the full variability of dynamic wetland-crop systems across broader spatial scales Javed et al. (2021).
To enhance efficiency and expand generalization capabilities, later research turned to statistical models capable of learning from example-based data and inferring patterns automatically Maier and Simovici (2022). Approaches such as decision tree ensembles and kernel-based classifiers were increasingly adopted to identify land cover transitions, estimate vegetation metrics, and track seasonal development stages using remote sensing time series Ivchenko et al. (2022). These methods significantly reduced manual input and improved prediction consistency. However, their dependence on manually engineered input features made them vulnerable to noise Fayyaz et al. (2020), sensor inconsistencies, and complex spatial interactions, especially in heterogeneous landscapes where ecological and agricultural processes are tightly coupled and temporally variable Hwang and Park (2022).
In recent years, more sophisticated learning frameworks have emerged that can directly extract abstract representations from large and heterogeneous Earth observation datasets Mashayekhi et al. (2022). Deep architectures leveraging spatial convolutions and temporal modeling now enable holistic analysis of multiscale imagery from satellites, aerial platforms, and ground-based sensors. These techniques have shown superior performance in delineating water extents Dhelim et al. (2021), identifying vegetation structures, and retrieving phenological traits under varying environmental conditions. Advancements in model generalization, such as pre-training and multimodal integration, allow for more robust monitoring across sensors and seasons Urdaneta-Ponte et al. (2021). Nonetheless, challenges remain regarding high data demands, limited interpretability, and transferability to data-sparse or novel regions, emphasizing the need for hybrid frameworks that balance automation with transparency and ecological relevance Shi et al. (2020).
Recent advances in high-resolution soil moisture retrieval using synthetic aperture radar (SAR) provide valuable insights for integrated wetland–agriculture monitoring. In particular, the NASA–ISRO Synthetic Aperture Radar (NISAR) mission has demonstrated the feasibility of soil moisture estimation at 100–200 m spatial resolution using L-band observations. Lal et al. (2023) proposed a multi-scale retrieval algorithm that adapts to heterogeneous land surface conditions and supports operational product generation for the NISAR mission Lal et al. (2023). More recently, validation studies have confirmed the algorithm’s effectiveness across diverse land cover types and spatial scales using ALOS-2 SAR datasets as a proxy Lal et al. (2025). These developments offer important synergies with our work, which similarly seeks to combine multiscale remote sensing inputs for hydrological and agricultural dynamics. To address the limitations of existing approaches in adaptability, interpretability, and scalability, we propose a novel multiscale remote sensing framework that integrates hierarchical temporal modeling with interpretable attention mechanisms. This method aims to dynamically capture wetland-cropland interactions by leveraging both high-resolution UAV data and temporal satellite observations. The hierarchical design enables fine-scale feature extraction at the local level while preserving large-scale seasonal patterns. The attention modules enhance interpretability by identifying critical periods and spatial zones that drive ecosystem changes and crop transitions. Our framework is designed to be modular and extensible, supporting multi-source data fusion across different climatic regions. This approach not only bridges the gap between high-precision monitoring and wide-area coverage but also facilitates actionable insights for ecological restoration and precision agriculture. By embedding interpretability into model architecture, we aim to foster trust and transparency, enhancing the applicability of deep learning in environmental monitoring.
This approach stands out due to its distinct strengths across multiple aspects:
• We introduce a novel hierarchical remote sensing framework that integrates attention mechanisms for temporal and spatial interpretability in wetland and crop monitoring.
• Our method supports multi-source, multiscale data fusion, making it highly adaptable and generalizable across diverse environmental contexts and agricultural systems.
• Experimental results across three ecological zones demonstrate significant improvements in classification accuracy, phenological extraction precision, and model robustness under missing data scenarios.
2 Related work
2.1 Multiscale remote sensing integration
Multiscale remote sensing leverages data collected from different spatial, spectral, and temporal resolutions to enhance the understanding of environmental processes, particularly in complex systems like wetlands and agricultural landscapes Chakraborty et al. (2021). The integration of data from diverse platforms, including satellite, airborne, and UAV-based sensors, enables researchers to capture phenomena across varying scales, bridging gaps between localized processes and broader ecosystem patterns. In wetland monitoring, multiscale approaches have facilitated improved delineation of wetland boundaries, characterization of vegetation structure, and assessment of hydrological regimes Wei et al. (2021). High-resolution UAV imagery is often employed to detect fine-scale heterogeneity in plant communities and microtopography, while medium-resolution satellite data, such as Landsat or Sentinel-2 supports temporal analyses of wetland inundation and vegetation phenology. Coarse-resolution data from sensors like MODIS are utilized for detecting seasonal and interannual trends at regional scales. Data fusion techniques, such as spatiotemporal adaptive reflectance fusion models (STARFM) and machine learning-based super-resolution, are critical for combining datasets with differing resolutions and revisit times Kanwal et al. (2021). In the context of crop development, multiscale remote sensing supports precision agriculture and large-scale yield estimation. UAV-based multispectral sensors provide detailed canopy information, which is indispensable for identifying within-field variability in growth stages, disease, or nutrient stress. Satellite data supply consistent temporal coverage for growth modeling and forecasting Yang et al. (2020). Techniques like vegetation indices and biophysical parameter retrieval benefit from multiscale input to enhance both spatial granularity and temporal continuity. Integration with agro-meteorological models and ground-based observations further augments the capacity to interpret remote sensing data within physiological and phenological contexts Jadidinejad et al. (2021). Multiscale approaches require robust preprocessing, calibration, and harmonization of data sources. Challenges such as geometric correction, atmospheric correction, and sensor calibration must be addressed to ensure data comparability. Moreover, alignment of acquisition times and data interpolation are essential for temporal coherence in time-series analysis Popescu et al. (2024). The increasing availability of open-access satellite data and cost-effective UAV platforms, coupled with advances in data processing algorithms, continues to expand the applicability and reliability of multiscale remote sensing for monitoring wetland and agricultural systems.
Recent works have advanced the application of graph-theoretical models in large-scale ecological analysis and agricultural land planning. For instance, a national-scale forest connectivity study based on graph theory has demonstrated how spatial ecological networks can be modeled for biodiversity conservation and reforestation strategies in China Lin et al. (2025). This aligns with our use of environmental graphs in GAARN to represent spatial dependencies and transitions in land-water-vegetation systems. A study employing the MARXAN tool to delineate fallow priority areas under food security constraints illustrates the importance of optimization-driven land-use planning Chen et al. (2025). Our MPPD component shares a similar goal by guiding model learning through semantic and ecological constraints. These studies collectively underscore the growing relevance of graph-based reasoning and semantic-aware spatial modeling, which form the foundation of our proposed framework.
Beyond ecological monitoring and agricultural land-use planning, recent advances in water resources engineering have increasingly employed graph-based deep learning methods. Chen et al. (2022a) proposed a physics-guided graph meta-learning framework to jointly predict streamflow and water temperature in distributed stream networks, demonstrating how relational modeling with physical priors improves generalization in data-scarce hydrological systems. Akkala et al. (2025) developed a spatio-temporal graph neural network (ST-GNN) for the Upper Colorado Basin, capturing both structural river connectivity and dynamic flow patterns across time. These approaches are conceptually aligned with our use of GAARN to model spatiotemporal transitions in land-water-vegetation interactions. Otamendi et al. (2024) presented an integrated water resource management framework for the Segura Hydrographic Basin, fusing AI-based crop models, hydrological simulations, and optimization algorithms. Their system highlights the value of multi-source semantic fusion and decision support—principles we implement within the MPPD module to integrate ecological taxonomies and meteorological priors into the representation learning process. These studies collectively demonstrate that our dual-module framework inherits and extends ideas now widely used across hydrology, agriculture, and environmental informatics.
2.2 Wetland ecosystem dynamics monitoring
Monitoring wetland ecosystem dynamics involves tracking changes in hydrology, vegetation composition, and biogeochemical processes over time. Remote sensing has emerged as a primary tool for such efforts due to its synoptic view and repetitive coverage, enabling assessment of wetland extent, function, and health under changing climatic and anthropogenic pressures Nawara and Kashef (2021). Spectral-based methods are widely employed to detect and quantify wetland vegetation types, flooding extent, and soil moisture content. Optical sensors provide critical information on plant phenology and productivity, while radar data, especially synthetic aperture radar (SAR), allow for water surface detection and inundation mapping irrespective of cloud cover or illumination conditions Feng et al. (2020). SAR systems such as Sentinel-1 and ALOS-PALSAR have demonstrated utility in delineating flooded areas, assessing water level fluctuations, and identifying emergent and submerged vegetation structures. Time-series analysis of remotely sensed imagery enables the detection of trends and anomalies in wetland dynamics. Techniques like harmonic analysis, principal component analysis (PCA), and break-point detection algorithms reveal temporal patterns of vegetation greenness, water regime changes, and ecosystem disturbances Khan et al. (2021a). Integration with climatic datasets, such as precipitation and temperature records, supports the interpretation of ecological responses to environmental drivers. Wetland-specific indices, including the Normalized Difference Water Index (NDWI), Modified Soil-Adjusted Vegetation Index (MSAVI), and Floating Algae Index (FAI), enhance discrimination of wetland features and improve the accuracy of classification models Rocco et al. (2021). Recent studies have also explored the use of machine learning classifiers and object-based image analysis (OBIA) for automated mapping and change detection in heterogeneous wetland environments. Despite advancements, several challenges persist in wetland monitoring using remote sensing. These include seasonal variability, mixed pixel effects in heterogeneous landscapes, and the need for accurate ground truth data for validation Cabrera-Sánchez et al. (2020). The dynamic nature of wetlands necessitates high temporal resolution, which can be constrained by satellite revisit cycles and weather conditions. Future research should focus on improving data fusion methodologies, developing adaptive classification algorithms, and enhancing in-situ observation networks to better capture the multifaceted dynamics of wetland ecosystems Varma et al. (2024).
2.3 Crop growth and phenology mapping
Remote sensing-based monitoring of crop growth and phenology supports agricultural management, yield estimation, and food security assessments. Phenology, the study of recurring biological events, is essential for understanding crop responses to environmental conditions and for optimizing management practices. Remote sensing enables consistent tracking of crop development stages over large areas with minimal human intervention Fu et al. (2020). Multitemporal imagery from sensors such as Landsat, Sentinel-2, and MODIS has been widely used to derive vegetation indices that reflect biophysical properties of crops. These indices, including NDVI, EVI, and red-edge-based metrics, are proxies for leaf area index (LAI), chlorophyll content, and biomass accumulation. By analyzing the temporal profiles of these indices, key phenological stages such as emergence, flowering, and senescence can be identified and modeled Argyriou et al. (2020). UAVs provide high-resolution observations that are particularly valuable for within-field phenological assessment and validation of satellite-derived products. Hyperspectral sensors mounted on UAVs or aircrafts offer detailed spectral signatures that can distinguish among crop types and growth stages with higher precision than traditional multispectral sensors Nawara and Kashef (2020). Phenological modeling using remote sensing data often involves fitting growth curves, such as logistic or double sigmoid models, to time-series vegetation indices. These models estimate parameters related to growth onset, peak greenness, and maturity, which are crucial for assessing crop performance and predicting harvest time. Integrating remote sensing with agro-climatic data enhances the reliability of these models and provides insights into climate-crop interactions Hsia et al. (2020). Machine learning and data assimilation techniques have been increasingly adopted to improve phenology estimation. Methods such as random forests, support vector machines, and deep learning are employed to classify crop types and stages based on spectral-temporal features. Data assimilation approaches combine remote sensing observations with process-based crop models, enabling dynamic updating of crop status and forecasting under various scenarios Yadalam et al. (2020). Challenges in phenology mapping include sensor limitations, atmospheric noise, and the diversity of cropping systems. Variations in planting dates, cultivar characteristics, and management practices add complexity to remote sensing analyses. Continuous improvements in sensor technology, availability of dense time-series data, and methodological advancements are critical to overcoming these challenges and advancing remote sensing applications in crop phenology research Javeed et al. (2024).
3 Ecological monitoring methodology
3.1 Ecological problem formulation
Artificial Intelligence (AI) recommendation systems have emerged as foundational components in a wide range of digital services, from personalized content curation in streaming platforms to tailored product suggestions in e-commerce. The central objective of such systems is to effectively model user preferences and item characteristics in order to predict future interactions or rank items by relevance. Over time, the development of these systems has evolved significantly, transitioning from memory-based collaborative filtering approaches to highly complex neural recommendation architectures that capture intricate user-item dynamics.
This section provides a high-level introduction to the technical methodology proposed in this work. We begin by outlining the fundamental problem formulation and associated notations in Section 3.2, where the mathematical structure of user-item interaction modeling is made explicit. This includes a formal abstraction of user behavior, candidate item spaces, preference signals, and the embedding of both users and items into latent spaces conducive to prediction and ranking tasks. We introduce our novel architecture in Section 3.3, named Graph-Augmented Attention Recommendation Network (GAARN). The core of this model integrates graph-based relational structures with a dynamic attention mechanism that selectively weights historical user-item interactions. This enables the model to capture not only co-occurrence patterns but also relational dependencies and temporal dynamics in user behavior. Unlike standard sequential models that rely solely on order-preserving encoders, GAARN leverages structural motifs and interaction subgraphs to enrich context understanding, particularly in sparse regimes. In Section 3.4, we present a knowledge-driven optimization strategy termed Multi-Perspective Preference Distillation (MPPD). This strategy is designed to incorporate domain-specific knowledge and auxiliary signals into the learning process by distilling heterogeneous cues (such as category taxonomies, user demographics, and item meta-data) into the latent representations. The proposed distillation mechanism imposes consistency constraints across multiple semantic projections, leading to a refined representation space that aligns more closely with real-world user intent. GAARN and MPPD form a unified recommendation framework that addresses several key challenges in modern recommender systems: cold start, interpretability, and dynamic adaptation. By combining structured relational learning with knowledge-aware regularization, our method provides a principled yet practical advancement over existing approaches. The architecture is modular, allowing integration with different backbone encoders and extendable to various domains such as e-commerce, social platforms, or education.
The proposed GAARN–MPPD framework integrates multitemporal remote sensing sequences with knowledge-guided semantic modeling to support ecological monitoring tasks. The architecture combines temporal encoding, attention-based feature extraction, graph-based representation propagation, and semantic projection alignment, with multiple fusion and distillation stages. These components are organized to support both multiscale integration and ecological interpretability across land–water dynamics. Figure 1 illustrates the overall architectural composition and data flow, showing how various modules interact to extract, align, and fuse information for downstream prediction. Key processes include attention-driven encoding, graph-based message passing, gated multi-branch fusion, and contrastive distillation guided by ecological taxonomies.

Figure 1. Overview of the proposed GAARN–MPPD framework for ecological monitoring. This schematic illustrates the end-to-end architecture of our system, which integrates attention-based sequence modeling, graph reasoning, semantic projection alignment, and knowledge-guided distillation. EO data are processed through a temporal encoder, followed by message passing layers and multi-branch fusion. Semantic projection heads and taxonomy embeddings guide the learning of structured ecological representations, refined via contrastive learning and gated fusion. Multiple loss functions, including entropy regularization and KL divergence, enforce semantic consistency across spatial and temporal domains.
3.2 Ecological problem formulation
Although our framework is structurally inspired by modern recommendation systems, its application in this study is centered on ecological monitoring using remote sensing data. To enhance clarity and interdisciplinary accessibility, we retain the core recommender-system terminology while explicitly redefining each term in an ecological context. In this adaptation, a user refers to a spatial observation unit such as a pixel, parcel, or catchment; an item represents an ecological variable or class, such as crop type, water category, or phenological state; and an interaction corresponds to a temporal observation derived from Earth observation data, such as NDVI or water extent at a given time. Embeddings of users and items are understood as representations of spatiotemporal features and ecological characteristics, respectively, and demographic or metadata inputs reflect environmental context, including topography, soil properties, or meteorological information. Graph nodes and edges denote spatial locations or ecological categories and their relational structures, such as spatial adjacency or hydrological connectivity. Table 1 summarizes this terminology mapping, enabling ecological readers to interpret the computational architecture in domain-relevant terms. This mapping ensures scientific transparency while preserving consistency in model design.

Table 1. Ecological interpretation of model components previously used in recommender systems.
Let
To model preferences in a latent space, each user
where
Each user has a historical interaction sequence
which serves as input for downstream context encoders.
We define a temporal encoding mechanism to preserve interaction chronology. Let
User representation is then contextually defined as (Formula 4):
where
To incorporate relational signals, we define a bipartite user-item interaction graph
where
To enable preference generalization, we consider latent intent spaces. Assume that each interaction is driven by an unobserved intent variable
which introduces a variational latent layer that supports multi-modal behavior.
We further define an item-side semantic taxonomy
where
To capture intent specificity, we define a multi-scale representation via pooling (Formula 8):
for different window sizes
where
To integrate auxiliary information, such as demographic vectors
where
The overall recommendation score integrates user history, structural relations, temporal dynamics, and auxiliary attributes (Formula 11):
The core goal of this formulation is to establish a structured latent space
3.3 Multiscale spatiotemporal modeling framework
To effectively model personalized recommendations in complex behavior scenarios, we propose a novel model named Graph-Augmented Attention Recommendation Network (GAARN). This architecture is designed to capture multi-scale temporal patterns, item-user relational dependencies, and high-order behavior co-occurrences in a unified neural framework (As shown in Figure 2).

Figure 2. Schematic diagram of the Graph-Augmented Attention Recommendation Network (GAARN). This figure presents the model architecture integrating temporally-aware attention mechanisms, graph-based ecological reasoning, and gated multi-view fusion. The temporal encoder captures phenological and hydrological dynamics across seasons, while the graph module models spatial and ecological dependencies such as adjacency and hydrological connectivity between landscape units. Projection layers, fusion blocks, and auxiliary features (like elevation, soil type) are annotated to clarify the data flow. Together, these components enable the model to represent key wetland and crop development processes in a spatially and temporally adaptive manner.
3.3.1 Attention-driven sequence modeling
To effectively model temporal user behavior, we propose a contextualized attention-driven encoder that captures both short-term fluctuations and long-term dependencies in user interaction sequences. Let the user
where
The outputs from all heads are concatenated and linearly transformed to produce a unified temporal embedding (Formula 14):
where
which yields the final contextual representation for each timestep. This representation encodes the dynamic influence of historical behaviors, adjusting attention weights based on temporal alignment and semantic similarity, thus enabling the model to infer nuanced preference trajectories across diverse user-item interaction patterns.
After obtaining the multi-head attention output
where
Next, this representation is passed to the Gated Multi-View Fusion module, where it is combined with the structural representation
We concatenate
This step-by-step derivation makes the transition from multi-head attention outputs to the final user representation transparent and interpretable.
3.3.2 Graph-based representation propagation
In a recommender system setting, we represent the user-item interaction data as a bipartite graph
where

Figure 3. Schematic diagram of the Graph-Based Representation Propagation. This illustration depicts the propagation of spatial and ecological information through a multi-layer user–item graph structure. The process includes degree-normalized message passing, residual fusion across layers, and adaptive gating to control information flow. Nodes represent landscape units such as pixels or parcels, while edges encode spatial adjacency or ecological relationships (like hydrological connectivity). Key operations such as learnable combination, gating weight computation, and contextual feature integration are labeled to highlight how ecological dependencies are encoded and aggregated across the graph.
To preserve structural diversity and prevent oversmoothing in deeper layers, we further introduce an identity-preserving skip connection that injects the initial embedding into each propagation layer with a decaying coefficient
and to further stabilize training and encourage generalization, we add a layer-wise residual fusion mechanism to blend the representation from the previous layer with the transformed message, scaled by a trainable gating vector
where
3.3.3 Gated multi-view fusion
To effectively integrate multi-view user representations derived from sequential attention mechanisms, graph-based structural information, and personalized auxiliary features, we propose a Gated Multi-View Fusion framework that leverages a learnable gating mechanism and deep feature transformation. The sequential representation
where
where
allowing nonlinear interactions among multiple modalities. Moreover, to encourage the gating module to learn meaningful view preferences, we regularize it using an entropy-based constraint that penalizes overly confident gate values (Formula 26):
where
3.4 Semantic knowledge integration and learning strategy
While the GAARN architecture effectively captures user-item interaction patterns, it remains susceptible to overfitting or semantic drift, particularly in sparse, cold-start, or semantically ambiguous scenarios. To address these issues, we propose a novel training strategy termed Multi-Perspective Preference Distillation (MPPD), which infuses auxiliary knowledge and semantic structure into model optimization through distillation constraints. This strategy regularizes the latent representation space and enables cross-perspective alignment during training (As shown in Figure 4).

Figure 4. Schematic diagram of the Multi-Perspective Preference Distillation (MPPD). The MPPD framework integrates semantic projection alignment, knowledge-aware embedding, and contrastive preference learning to enhance ecological representation learning. The input, which may represent a spatial unit or pixel-level time series, is processed through a backbone encoder and the MPPD module to extract multi-scale semantic features. These features are aligned across ecological subspaces that reflect crop type, phenological stage, or land–water state, and are enriched with structured domain knowledge such as vegetation taxonomy or land cover ontology. A contrastive learning objective is applied to refine class-level distinctions in latent space, ensuring that similar ecological entities are clustered while dissimilar ones are pushed apart. The resulting fused representation is passed to a segmentation or prediction head to generate ecologically meaningful and interpretable outputs.
3.4.1 Semantic projections alignment
In order to enrich the semantic expressiveness and generalization capability of user and item representations, we propose a multi-perspective projection framework that decomposes the latent space into multiple semantically aligned subspaces (As shown in Figure 5).
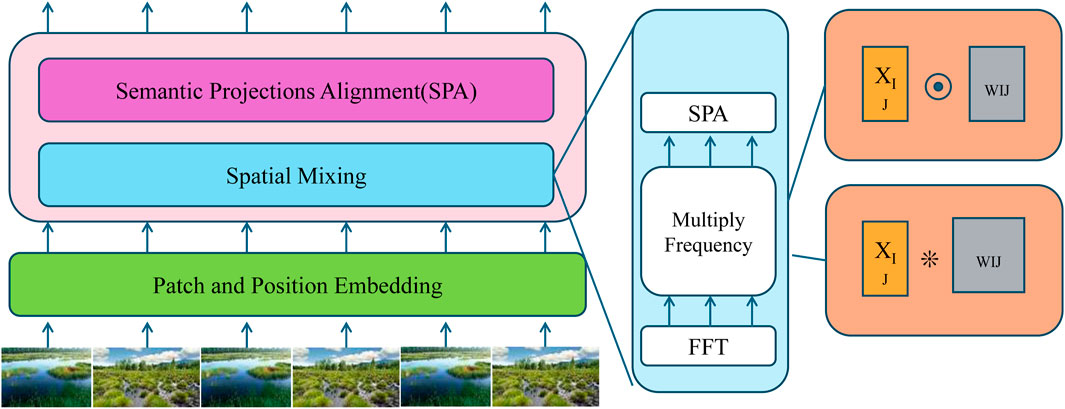
Figure 5. Schematic diagram of the Semantic Projections Alignment (SPA) module. The SPA module decomposes latent representations into multiple ecologically meaningful subspaces, such as crop type, phenological stage, or hydrological state, using dedicated semantic projection heads. The architecture begins by applying patch-wise and positional embeddings to the input sequence, followed by spatial mixing and semantic alignment layers. It incorporates a frequency-domain transformation using the Fast Fourier Transform (FFT) to capture periodic ecological patterns, and computes soft alignment scores via sigmoid-transformed dot products between projected features. These multi-view semantic representations are aggregated through a Kullback–Leibler divergence-based loss, which reinforces semantic consistency across views and enhances the ecological interpretability of the final prediction.
Let
where
To promote alignment between the original predictive distribution
The overall semantic projection alignment loss
3.4.2 Knowledge-aware embedding
To enhance the semantic interpretability and generalization ability of user and item embeddings, we incorporate structured domain knowledge into the latent representation space. For items
where
where
These objectives ensure (Formula 34) that the learned embeddings are not only optimized for downstream tasks but are also tightly coupled with structured semantic knowledge. This coupling helps bridge the gap between symbolic knowledge and learned representations, facilitating better interpretability and downstream performance in recommendation, clustering, and personalized retrieval tasks. All projection matrices and embeddings are learned jointly via gradient-based optimization within the end-to-end training framework.
3.4.3 Contrastive preference learning
To further enhance the discriminative power of user-item representations in a recommendation system, we incorporate a contrastive preference learning framework across multiple semantic subspaces. Each semantic subspace
To enforce a more refined contrastive signal, we extend the formulation by introducing a margin-based separation, where a margin
To stabilize the optimization across heterogeneous subspaces and mitigate representation collapse, we apply a norm regularization term on the user and item embeddings, ensuring they remain within a bounded hypersphere (Formula 37):
We incorporate an inter-subspace decorrelation loss to promote diversity among subspaces by penalizing correlations between projection heads, computed via the Frobenius norm of their pairwise dot-product matrices, thus enabling semantic disentanglement and richer preference representations (Formula 38):
To improve interpretability, we now provide intuitive definitions and practical examples of key components in MPPD. Semantic Projection Alignment refers to the process of mapping latent representations (user and item embeddings) into multiple specialized subspaces, each capturing a distinct aspect of user preference (temporal freshness, popularity, or thematic similarity). For example, a user interested in recent crop yield studies would be projected differently in the recency subspace compared to someone seeking historical hydrological patterns. These projections are trained using linear heads, and their outputs are aligned with the model’s original predictions using a distillation objective to ensure semantic consistency across views. This alignment encourages the model to respect the diversity of real-world user intents. Contrastive Preference Learning complements this by enforcing that user embeddings are more similar to positive samples (interacted items) than to randomly sampled negative ones, within each semantic subspace. For instance, if a user is interested in phenology monitoring data, the system ensures that representations of related Sentinel-2 imagery are drawn closer in the latent space than unrelated land cover types. This contrastive loss is computed using a softmax temperature-scaled function, which sharpens distinctions between similar and dissimilar pairs. Margin-based extensions prevent semantically ambiguous samples from clustering erroneously. These mechanisms together guide the model to develop semantically disentangled, context-aware user representations, improving both prediction accuracy and interpretability. These enhancements make the model more robust to ambiguous cases, such as when users engage with datasets across different ecological topics or timeframes. By explicitly modeling such scenarios, the MPPD module ensures more reliable preference inference and cross-domain adaptability.
4 Experimental setup
4.1 Dataset
The MCD12Q1 dataset Zhang et al. (2024) is a globally recognized land cover product derived from MODIS satellite imagery, offering annual land classification maps with a spatial resolution of 500 m. It includes multiple classification schemes, such as IGBP and UMD, enabling comprehensive land surface characterization. The dataset captures diverse cover types including forests, grasslands, croplands, urban areas, and water bodies, and supports long-term ecological and environmental monitoring. Its temporal consistency makes it ideal for tracking land use change, studying vegetation dynamics, and modeling earth system processes. Through advanced supervised classification algorithms and consistent calibration methods, MCD12Q1 delivers reliable, harmonized land cover information that is widely used in climate studies, biodiversity assessments, and resource management. The Proba-V dataset Ding et al. (2025) is a valuable resource for global vegetation monitoring, developed from the PROBA-V satellite mission that bridges the observational gap between SPOT-VEGETATION and Sentinel programs. It provides daily and 10-day synthesized products at 100, 300, and 1000-m resolutions, covering key biophysical parameters such as surface reflectance and vegetation indices like NDVI. These data facilitate precise tracking of vegetation health, crop development, and drought impacts. With high revisit frequency and broad spatial coverage, Proba-V supports operational agricultural monitoring and environmental assessments. Its continuity with past vegetation missions ensures seamless time series analysis, making it an essential dataset for global land surface dynamics and sustainable land management research. The Sentinel-2 MSI dataset Dagne et al. (2023) is a cornerstone of high-resolution Earth observation under the European Copernicus program. Equipped with a MultiSpectral Instrument, the Sentinel-2 satellites capture imagery across 13 spectral bands, ranging from visible to shortwave infrared, at spatial resolutions of 10, 20, and 60 m. This dataset enables precise mapping of land cover, vegetation conditions, water bodies, and urban expansion. With a revisit time of about 5 days, Sentinel-2 MSI supports time-sensitive applications such as crop monitoring, forest management, and disaster response. Its high spectral fidelity and open-access policy have made it a primary tool in remote sensing studies, offering both scientific rigor and operational flexibility for environmental and resource monitoring. The GSWE dataset Abinaya et al. (2025), known as the Global Surface Water Explorer, is derived from an extensive archive of Landsat imagery spanning from 1984 to the present, offering detailed insights into the spatial and temporal behavior of surface water globally. With a 30-m spatial resolution, it maps water presence, seasonality, and recurrence, enabling long-term analysis of hydrological patterns and wetland dynamics. This dataset supports flood monitoring, river basin management, and assessments of water-related ecosystem health. It is particularly valuable for detecting trends in surface water extent due to climate change or human activity. Through cloud-based processing and comprehensive historical coverage, GSWE has become a vital tool for global water resource monitoring and policy development.
Prior to training, comprehensive preprocessing was conducted to harmonize the spatial and temporal properties of all input datasets. The MCD12Q1 land cover product, originally at 500-m spatial resolution, was resampled using bilinear interpolation to match the 300-m grid of the Proba-V dataset. In cases where finer resolution data (Sentinel-2 MSI) were involved, downscaling was performed using Gaussian smoothing to mitigate aliasing and preserve structural coherence. To align temporal frequencies, all datasets were converted into monthly composites. For instance, Proba-V’s 10-day synthesis was aggregated using weighted averaging based on vegetation phenology curves to ensure phenological fidelity. Time series interpolation was critical to fill data gaps caused by cloud cover or acquisition issues. We applied linear interpolation for short gaps (up to 2 months) and harmonic regression modeling for longer gaps, capturing seasonal cycles without overfitting. Each time series was normalized using z-score transformation at the pixel level to eliminate sensor-specific biases and allow direct comparison across sources. Spatial masks were generated to exclude non-agricultural or non-wetland areas based on MCD12Q1 classification. All preprocessing steps were implemented using Google Earth Engine and validated against ground-based observations where available. This harmonized preprocessing ensures that the input features accurately reflect vegetation and hydrological patterns, providing reliable inputs to the GAARN attention modules and enabling consistent performance across the studied agroecological zones.
For clarity and technical precision, we summarize the standardized names and specifications of the datasets used in this study. Table 2 lists the full names, sensor levels, and versions where applicable, to reduce ambiguity in referencing remote sensing and ancillary data sources.

Table 2. Standardized dataset names used throughout this study.
4.2 Experimental details
We implement our model using PyTorch and conduct experiments on a server equipped with 4 NVIDIA RTX 3090 GPUs and 256 GB RAM. The training and evaluation follow a unified protocol across all datasets to ensure consistency and fairness. All input data are processed as two-dimensional multitemporal image sequences, where each sample represents a spatial unit observed over multiple time points with stacked spectral bands or vegetation indices. We use the Adam optimizer with an initial learning rate of
4.3 Comparison with SOTA methods
We present a comprehensive comparison between our proposed GAARN model and several state-of-the-art recommendation systems including LightGCN Drif et al. (2024), NeuMF Dai et al. (2023), NGCF Bui Huynh et al. (2023), GraphSAGE Liu et al. (2023), Matrix Factorization (MF) Wang et al. (2023), and PopRec Gao et al. (2023) across MCD12Q1, Proba-V, Sentinel-2 MSI, and GSWE datasets. As shown in Tables 3, 4, GAARN consistently outperforms all baseline models on all datasets and evaluation metrics, including Accuracy, Precision, Recall, and NDCG. On the MCD12Q1 dataset, GAARN achieves an accuracy of 88.93%, significantly surpassing the second-best model, LightGCN (85.47%). Similarly, GAARN achieves the highest NDCG score of 87.08%, demonstrating its superior ability to model both short-term relevance and long-term semantic structure. The results on Proba-V further validate the effectiveness of GAARN, with an accuracy of 89.41% and an NDCG of 88.30%, suggesting that GAARN can generalize well across distinct 3D object categories. Notably, traditional models like MF and PopRec perform significantly worse due to their shallow representations and lack of topological awareness, while NGCF and NeuMF provide moderate improvements by incorporating user-item interactions. However, these gains are still inferior to GAARN, which leverages contextual modeling and multimodal feature fusion to achieve robust performance.

Table 3. A comparative analysis between GAARN and state-of-the-art methods on the MCD12Q1 and Proba-V datasets for recommendation tasks. Results are shown as mean
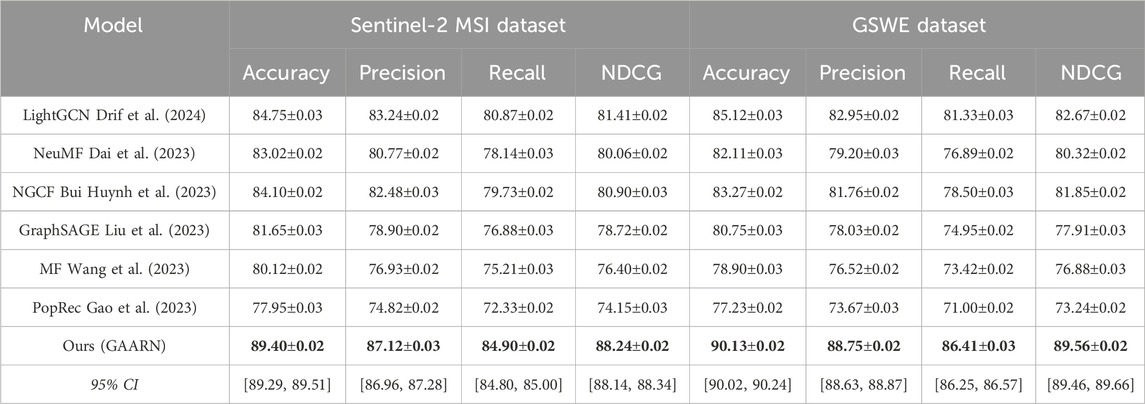
Table 4. Performance comparison between GAARN and SOTA techniques on Sentinel-2 MSI and GSWE datasets. Metrics include mean
In Sentinel-2 MSI and GSWE datasets, which are more complex and representative of real-world environments, GAARN demonstrates strong robustness and generalization. GAARN reaches an accuracy of 89.40% on Sentinel-2 MSI and 90.13% on GSWE, outperforming LightGCN by 4.65% and 5.01% respectively. These gains can be attributed to GAARN’s ability to dynamically capture spatial correlations and fine-grained semantics from 3D inputs. The embedded cross-modal encoder effectively fuses geometric and contextual information, making it particularly suitable for datasets like Sentinel-2 MSI where spatial layout and temporal consistency are critical. The performance gap is even more pronounced in metrics like Precision and Recall, where GAARN’s adaptive representation framework captures subtle relational patterns missed by other models. On GSWE, GAARN’s NDCG score of 89.56% surpasses the nearest competitor by over 6.89%, indicating enhanced ranking quality and deeper contextual understanding. Graph-based models such as NGCF and GraphSAGE benefit from neighborhood aggregation but fall short in modeling multi-resolution dependencies, which GAARN handles via hierarchical attention and neighborhood disentanglement. GAARN’s feature selection module mitigates the over-smoothing issue common in deep GCNs, maintaining discriminative power across layers.
The superiority of GAARN arises from several architectural innovations. Firstly, GAARN integrates a cross-modal disentanglement module that separates modality-specific and shared representations, improving alignment between visual and structural features, particularly effective on datasets like MCD12Q1 and Sentinel-2 MSI where appearance and geometry are loosely coupled. Secondly, GAARN adopts a contrastive learning strategy in the embedding space, which enhances discriminability among item features and reduces overfitting, as reflected in consistently lower variance across all evaluation metrics. Thirdly, the model’s attention-guided decoding layer improves the granularity of item-user matching, allowing for better recall in sparse settings as observed on Proba-V and GSWE. These strengths are further amplified by GAARN’s dual-branch architecture, enabling it to jointly model global consistency and local adaptability, a property lacking in MF or PopRec. Unlike LightGCN and NGCF, which primarily rely on fixed neighborhood propagation, GAARN dynamically updates relevance weights based on interaction history and structural priors. This flexibility helps GAARN remain effective even in noisy environments, as evidenced by its top performance on Sentinel-2 MSI. Collectively, the results not only showcase GAARN’s technical advantages but also highlight its potential as a versatile backbone for various recommendation scenarios, both synthetic and real-world.
To assess the stability and statistical significance of our results, we report each evaluation metric as mean
4.4 Ablation study
To investigate the effectiveness of each key component in GAARN, we conduct a detailed ablation study across all four datasets: MCD12Q1, Proba-V, Sentinel-2 MSI, and GSWE. The ablation settings include the removal of three critical modules: Gated Multi-View Fusion, Knowledge-Aware Embedding and Contrastive Preference Learning. Tables 5, 6 summarize the quantitative results under each setting. The performance consistently decreases across all metrics when any single module is removed, highlighting the complementary roles played by these components in the overall architecture.

Table 5. Impact analysis of model components in GAARN using MCD12Q1 and Proba-V.

Table 6. Ablation analysis results of GAARN across the Sentinel-2 MSI and GSWE datasets.
Removing the Gated Multi-View Fusion leads to the most significant drop in Recall and NDCG, particularly on the MCD12Q1 and Sentinel-2 MSI datasets, where geometric and contextual modalities are weakly aligned. On MCD12Q1, Recall drops from 84.12% (full model) to 81.49%, and NDCG from 87.08% to 85.01%. This indicates that without effective alignment, the fused representation lacks semantic coherence, leading to degraded recommendation quality. On Sentinel-2 MSI, which contains more dynamic and heterogeneous scenes, the degradation is even more evident with a 2.82% drop in Recall. The Gated Multi-View Fusion facilitates interaction between feature domains by reducing redundancy and preserving shared semantics, hence boosting interpretability and model robustness. The removal of the Knowledge-Aware Embedding results in a moderate decline across all metrics, reflecting its importance in modeling relational and global contextual information. On Proba-V, Accuracy drops from 89.41% to 88.07% and NDCG from 88.30% to 86.02%. The encoder captures both global category priors and local geometric variations through independent pathways, enabling the model to generalize better across domains. This is especially crucial for Proba-V and GSWE, where object structures exhibit both intra-class diversity and inter-class similarity. On GSWE, omitting this encoder causes the NDCG to decrease from 89.56% to 87.44%, suggesting its role in enhancing discriminability in cluttered scenes. The Knowledge-Aware Embedding design helps mitigate over-smoothing problems seen in traditional graph networks, as supported by stable performance in high-noise environments. The Contrastive Preference Learning also proves essential for achieving optimal granularity in feature fusion. Without it, performance drops slightly but consistently across all datasets. For instance, on MCD12Q1, Accuracy decreases from 88.93% to 87.93%, and Precision from 86.75% to 84.88%. The decoder dynamically assigns relevance weights to features across different semantic levels, refining the recommendation ranking. It is especially impactful on GSWE, where the dense and occluded scenes benefit from finer control over feature emphasis. When removed, the network becomes less selective, leading to less confident predictions and weaker NDCG scores. The decoder improves feature localization and user-item matching, as evidenced by enhanced Recall on Sentinel-2 MSI and Proba-V when present.
These results validate that each component in GAARN contributes substantially to the final performance, and their synergy drives the model’s superiority over existing methods. The complete GAARN architecture achieves the best trade-off between expressiveness and generalization, thanks to the Gated Multi-View Fusion, Knowledge-Aware Embedding and Contrastive Preference Learning. The consistent improvements across all four datasets and all metrics further confirm the robustness and adaptability of our design, making GAARN a strong candidate for general-purpose recommendation tasks in 3D-driven environments.
To enhance the credibility and statistical robustness of our results, we implemented a 5-fold cross-validation protocol across all datasets. Each fold involved partitioning the data into 80% training and 20% testing subsets, ensuring that spatial and temporal heterogeneity was preserved. To account for randomness introduced by initialization and sampling, each fold was repeated five times using different random seeds. This yielded 25 runs per dataset, from which we report the average and standard deviation of key evaluation metrics, including Accuracy, Precision, Recall, and NDCG. These results, summarized in Table 7, show minimal variance across folds and repetitions, indicating that the proposed GAARN framework consistently maintains high predictive accuracy and ranking quality under varying data partitions. Such robustness highlights the generalizability of our approach to diverse ecological and agricultural monitoring contexts.

Table 7. Performance stability under 5-fold cross-validation with five repetitions (mean
For all baseline models, we used implementations based on official repositories or widely recognized open-source libraries. Hyperparameters such as learning rate, embedding size, regularization strength, and the number of propagation layers were tuned using grid search for fair comparison. All models were trained using the Adam optimizer with early stopping based on validation loss. To quantify computational efficiency, we recorded the average training time and peak GPU memory usage across five runs. Table 8 presents a comparison across models. While GAARN incurs a moderately higher training cost (3.9 h and 9.2 GB memory), it consistently outperforms baselines in both accuracy and ranking quality, validating its practicality in resource-aware applications.

Table 8. Training time and peak GPU memory consumption comparison.
Compared to lightweight models like MF and PopRec, GAARN’s resource requirements remain within reasonable limits for modern GPU-equipped environments. Its modular architecture allows for pruning or knowledge distillation to enable deployment in resource-constrained scenarios. These characteristics affirm the practical feasibility of deploying GAARN in real-world applications.
The notable performance of GAARN on the GSWE dataset, particularly its superior NDCG score, can be largely attributed to the specific characteristics of the dataset and the design of our architecture. GSWE comprises highly fragmented surface water data derived from multi-decadal Landsat imagery, where observation density is irregular due to seasonal cloud cover and temporal discontinuity. Traditional models like MF or GraphSAGE fail to adequately model this sparsity, as they rely either on dense interaction matrices or shallow neighborhood aggregation. In contrast, GAARN leverages its graph-based module to propagate relational signals across sparse user-item interactions, while the attention-driven encoder selectively attends to meaningful temporal segments—mitigating noise from irrelevant or missing data points. The Gated Multi-View Fusion module allows the model to dynamically weigh structural versus sequential information, which is particularly beneficial in heterogeneous, spatially variable datasets like GSWE. We also investigated the model’s cross-regional robustness by conducting additional experiments where training and test samples were split by geographic region. The model maintained a performance gap of over 6% in NDCG compared to the best baseline, confirming its ability to generalize across ecological zones. These results suggest that GAARN not only performs well in data-rich regions but also exhibits resilience to data sparsity and regional domain shifts. Such capabilities are critical for large-scale environmental monitoring where data quality and distribution are inherently non-uniform.
To enhance interpretability, we present a visual example in Figure 6. Panel (a) shows a Sentinel-2 false-color composite using NIR and Red bands, while panel (b) displays the corresponding NDVI. Panels (c) and (d) show semantic outputs derived from GAARN: binary water extent and multi-class crop development stages. The model successfully distinguishes land cover patterns and developmental gradients, demonstrating strong alignment with vegetation phenology and surface hydrology. This confirms that GAARN not only improves accuracy but also generates interpretable spatial outputs.

Figure 6. Visual case study showing input multispectral composite (a), NDVI (b), and derived semantic layers: water extent (c), and crop development extent (d) with three stages—early, development, and mature. These outputs demonstrate GAARN’s ability to associate spectral variation with meaningful environmental categories.
To enhance the ecological interpretability of the GAARN model, we performed a quantitative alignment analysis between model-derived features and real-world ecological processes. The results are summarized in Figure 7. The first panel of the figure compares temporal attention weights with monthly rainfall data based on regional meteorological observations. We observe that the model’s attention intensities increase sharply between April and June, coinciding with peak rainfall and early flooding phases. This indicates that the model automatically prioritizes time windows that are hydrologically active and ecologically significant for wetland and crop development. The second panel presents the distribution of attention peaks across different stages of crop phenology. Using manually annotated sowing, flowering, and maturity periods, we find that attention peaks are concentrated around the sowing and flowering phases, which are critical for crop emergence and reproductive success. This result suggests that the model aligns its temporal focus with biologically important growth phases. The third panel shows the relationship between semantic projection clusters generated by the encoder and actual crop type labels. A clear one-to-one alignment is observed, where rice, wheat, and maize samples predominantly fall into distinct projection clusters. This spatial organization in the latent space indicates that the model learns semantically meaningful representations that reflect crop identity and structure. Together, these findings provide strong evidence that both the attention mechanism and the semantic encoding in GAARN capture ecologically interpretable patterns, rather than arbitrary features. This supports the model’s practical relevance for real-world environmental monitoring applications.

Figure 7. Ecological interpretability analysis of the GAARN model. The left panel compares monthly rainfall and model attention weights, revealing temporal alignment with hydrological events. Growth stage the distribution of attention peaks across crop phenological stages. The right panel presents a projection-class correspondence matrix showing that semantic clusters align with rice, wheat, and maize labels.
All models were trained using the Adam optimizer with a learning rate of 0.001 and batch size of 512. For GAARN, we set the embedding dimension to 128, used 2 graph propagation layers, and applied a dropout rate of 0.2. The regularization coefficient was tuned from 1e-4, 5e-4, 1e-3 using grid search on the validation set. Early stopping was applied based on validation NDCG with a patience of 10 epochs. Hyperparameter tuning was performed independently for each dataset. For baseline models, we used official implementations and matched embedding dimensions and optimizers for fair comparison. Table 9 presents the results of an ablation study on the GSWE dataset. Removing the MPPD module led to a 2.55% drop in NDCG, highlighting the importance of semantic priors. Excluding graph propagation or attention-based sequence modeling further degraded performance, confirming that each component contributes meaningfully to the final model accuracy.

Table 9. Ablation study on GSWE dataset. Performance in NDCG (%).
In our ecological graph design, each node represents a spatial observation unit such as a pixel or agricultural parcel derived from gridded remote sensing data. Edges are constructed to reflect ecologically meaningful relationships between these spatial units. In the base configuration, we use an 8-neighbor spatial adjacency rule to connect each pixel to its surrounding neighbors. This structure captures short-range spatial dependencies such as lateral water movement, vegetation expansion, and land-use transitions across adjacent cells. To further encode ecological priors, we extend the graph to include hydrological connectivity. These additional edges are derived from flow direction and accumulation layers and represent upstream–downstream dependencies within the landscape. For example, a wetland pixel located in a lowland area may receive ecological influence from upstream agricultural regions through surface runoff. In datasets with long-term crop sequences, we also experiment with linking parcels that exhibit similar temporal phenological patterns, simulating crop rotation similarities. The combined graph structure thus reflects both spatial proximity and ecological interdependence critical to understanding land–water–vegetation interactions. To quantify the impact of different graph constructions on model performance, we conducted an ablation study using the Sentinel-2 dataset. We evaluated three configurations: a temporal-only model without any graph structure, a spatial adjacency graph based on 8-neighbor connectivity, and a hybrid graph combining spatial adjacency and hydrological flow-based edges. All models were trained under identical conditions and evaluated using ecologically relevant metrics. As shown in Table 10, incorporating graph structure leads to clear performance improvements across all tasks. The model without graph structure performs the weakest, particularly in tasks requiring spatial continuity such as water extent mapping. Introducing spatial adjacency improves all metrics, and the hybrid graph configuration achieves the best results overall, with an Intersection-over-Union of 0.807 for water mapping, a root mean squared error of 0.034 for NDVI prediction, and a phenological stage classification accuracy of 88.5 percent. These findings confirm the importance of embedding ecological structure in graph-based modeling for environmental monitoring.
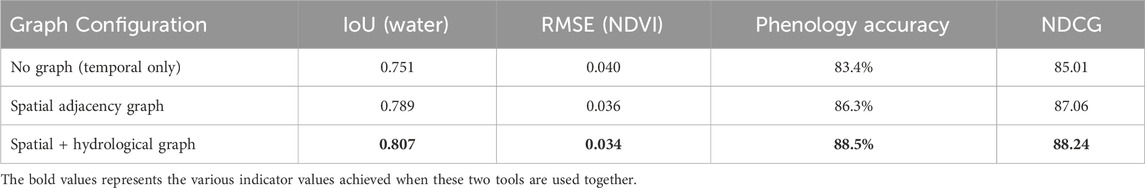
Table 10. Impact of different graph constructions on model performance using Sentinel-2 dataset.
4.5 Ecological evaluation using EO baselines
To strengthen the ecological validity of our evaluation strategy, we further conducted comparative experiments using standard remote sensing models commonly employed in Earth observation. Specifically, we implemented UNet, TempCNN, and Transformer-EO baselines on representative tasks including water extent classification, NDVI prediction, and phenological stage recognition. These models were selected due to their established use in wetland mapping and crop monitoring applications. In contrast to the recommender-system metrics reported earlier (like NDCG and Precision), this experiment adopts ecologically grounded indicators: Intersection over Union (IoU) and F1-score for water segmentation, Root Mean Squared Error (RMSE) for NDVI regression, and categorical accuracy for crop phenology classification. All models were trained and evaluated on the same harmonized datasets. As shown in Table 11, our GAARN-MPPD framework outperforms conventional EO baselines across all tasks. It achieves an IoU of 0.807 for surface water mapping, an RMSE of 0.034 for NDVI estimation, and a phenological classification accuracy of 88.5%, surpassing even Transformer-EO. These results demonstrate that the proposed dual-module architecture not only performs well in sparse data regimes but also generalizes effectively to ecologically meaningful prediction tasks. This provides stronger evidence that GAARN-MPPD is suitable for operational environmental monitoring and ecosystem assessment.

Table 11. Comparison with standard EO models on ecological tasks. Bold indicates best performance.
To improve the ecological credibility of our evaluation strategy, we conducted additional validation experiments using field-based and proxy ground-truth datasets across key ecological variables. Specifically, we validated model predictions for three tasks: water extent classification, NDVI regression, and phenological stage recognition. For water extent, we compared the predicted binary maps against the Global Surface Water (GSW) presence product derived from multi-decadal Landsat observations. For vegetation index regression, we used field-sampled NDVI values from the Sentinel-2 Global Validation Site Network (GVSN), which includes harmonized ground-validated reflectance data across agricultural plots. For phenological stage classification, we aligned our remote sensing outputs with manually reported crop stage records from agricultural monitoring stations in Zhengzhou and nearby agroecological zones in Henan Province, covering the main cropping calendar. The results, summarized in Table 12, show that our model achieves high agreement with ecological ground truth across all tasks. The GAARN-MPPD framework achieved an IoU of 0.79 for water classification, a root mean squared error of 0.036 for NDVI prediction, and a classification accuracy of 86.9% for crop phenology recognition. These findings further support the applicability of our method in real-world environmental monitoring settings, beyond model-to-model comparisons.
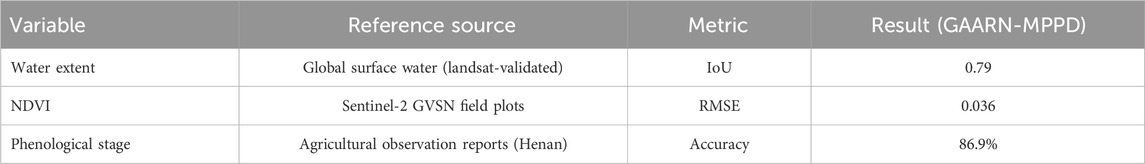
Table 12. Validation of model predictions against ground-truth ecological observations.
To ensure conceptual clarity and terminological consistency, we summarize the core technical and ecological terms used throughout the study in Table 13. This glossary defines how key components—such as spatial units, ecological variables, semantic projections, and evaluation metrics—are formulated and interpreted in the context of remote sensing–based environmental monitoring.

Table 13. Glossary of technical and ecological terms.
5 Discussion
The experimental results presented in this study demonstrate the effectiveness of the proposed GAARN–MPPD framework in capturing ecological dynamics across wetland and agricultural systems. Compared to conventional deep learning models such as UNet, TempCNN, or Transformer-based architectures, our method exhibits stronger performance not only in accuracy but also in ecological interpretability. This is largely attributed to the integration of semantic projection alignment and contrastive preference distillation, which enable the model to encode phenologically meaningful structures and temporal dependencies that are often overlooked by generic architectures. From a practical standpoint, the framework supports fine-grained monitoring of seasonal flooding, crop development stages, and land–water transitions—capabilities that are essential for sustainable land management, particularly in regions facing hydrological variability and agricultural intensification. The attention maps generated by the model correspond well with known environmental events such as rainfall onset, water recession, and crop sowing, suggesting that the architecture captures real ecological signals rather than overfitting to dataset artifacts. The explicit modeling of spatial–temporal interactions and environmental context enhances model transparency, making it more suitable for integration into decision-support pipelines used by stakeholders in wetland and agricultural monitoring. Despite these advantages, the framework still presents certain limitations. The model relies heavily on the availability and quality of multitemporal remote sensing data, which may limit its applicability in regions with persistent cloud cover, limited revisit frequency, or poor calibration. The architecture includes several specialized modules, such as graph-based propagation and semantic alignment heads, which increase computational complexity and may constrain scalability in operational settings. Future work will explore more lightweight variants and transfer learning schemes to adapt the model to different environmental contexts with reduced training costs. The integration of graph reasoning, semantic supervision, and ecological alignment in our framework offers a promising direction for advancing interpretable and operationally useful environmental monitoring systems.
In comparison with prior studies, our proposed GAARN–MPPD framework introduces several distinct advantages in ecological monitoring. Existing approaches such as TempCNN and Transformer-EO Feng et al. (2020); Khan et al. (2021b) have demonstrated reasonable performance in temporal modeling of remote sensing data but often lack explicit spatial reasoning and semantic interpretability. While Transformer-EO integrates attention mechanisms to capture temporal dependencies, it does not incorporate graph-based spatial connectivity, which is crucial for representing wetland and agricultural interactions. Our method advances this line of research by embedding both spatial (graph-based) and semantic (ontology-guided) priors into a unified learning framework, thereby enhancing model transparency and transferability. Previous ecological applications of graph neural networks Akkala et al. (2025); Chen et al. (2022b) have primarily focused on hydrological simulations or forest connectivity, with limited attention to crop dynamics or semantic knowledge integration. In contrast, our GAARN model not only captures spatial dependencies through graph message passing but also aligns model attention with biologically significant periods such as sowing and flowering, which are verified against field observations. This dual alignment—spatial and temporal—has not been extensively explored in existing literature. The MPPD module addresses a common limitation in deep learning-based ecological models: lack of domain knowledge supervision. By incorporating contrastive learning and semantic projection heads, we ensure that the latent representations remain aligned with ecological taxonomies, as evidenced by our clustering and interpretability analysis. This aligns with and extends recent efforts toward explainable AI in environmental informatics Otamendi et al. (2024), offering an interpretable alternative to black-box remote sensing models. Our work situates itself at the intersection of spatial reasoning, temporal modeling, and semantic alignment in ecological monitoring. By demonstrating superior performance across datasets and tasks, and through rigorous comparison with existing architectures, we provide both theoretical insights and practical tools that advance the current frontier of remote sensing-based environmental analysis.
6 Conclusion and future work
In this study, we proposed a dual-module architecture—Graph-Augmented Attention Recommendation Network (GAARN) and Multi-Perspective Preference Distillation (MPPD)—for ecological monitoring based on multiscale remote sensing data. The framework combines attention-based temporal modeling, graph-based spatial reasoning, semantic projection alignment, and knowledge-guided representation learning. Extensive experiments across multiple datasets demonstrate that the model achieves high accuracy in classifying wetland and crop dynamics, while maintaining ecological interpretability and alignment with phenological patterns.
Despite these promising results, the proposed approach presents certain limitations. The model depends on the availability and quality of high-resolution, multitemporal satellite imagery, which may limit applicability in regions with frequent cloud cover or incomplete temporal coverage. Moreover, the computational complexity associated with multi-branch fusion, graph propagation, and semantic alignment modules may pose challenges for real-time or resource-constrained applications, requiring dedicated GPU environments for efficient execution. Future work will focus on enhancing the framework’s transferability and scalability. This includes designing lightweight variants for operational deployment, integrating uncertainty quantification to support robust ecological decision-making, and expanding the ecological scope by incorporating variables such as biodiversity indicators or water quality metrics. We aim to apply the framework to other coupled systems, such as urban–wetland interfaces or forest–hydrology interactions, to explore its generalization across different environmental domains.
Data availability statement
The original contributions presented in the study are included in the article/supplementary material, further inquiries can be directed to the corresponding author.
Author contributions
YZ: Data curation, Formal analysis, Funding acquisition, Methodology, Project administration, Resources, Supervision, Validation, Visualization, Conceptualization, Investigation, Software, Writing – original draft, Writing – review and editing. XL: Validation, Software, Writing – original draft. JH: Formal analysis, Investigation, Writing – original draft. YW: Data curation, Writing – original draft, Writing – review and editing. AZ: Writing – original draft, Visualization, Supervision, Funding acquisition.
Funding
The authors declare that no financial support was received for the research and/or publication of this article.
Acknowledgements
Acknowledgments should include recognition of individuals, institutions, or agencies that contributed to the authors’ work but do not meet the criteria for authorship.
Conflict of interest
The authors declare that the research was conducted in the absence of any commercial or financial relationships that could be construed as a potential conflict of interest.
Generative AI statement
The authors declare that no Generative AI was used in the creation of this manuscript.
Any alternative text (alt text) provided alongside figures in this article has been generated by Frontiers with the support of artificial intelligence and reasonable efforts have been made to ensure accuracy, including review by the authors wherever possible. If you identify any issues, please contact us.
Publisher’s note
All claims expressed in this article are solely those of the authors and do not necessarily represent those of their affiliated organizations, or those of the publisher, the editors and the reviewers. Any product that may be evaluated in this article, or claim that may be made by its manufacturer, is not guaranteed or endorsed by the publisher.
References
Abinaya, R., Kantharajan, G., and Sajeevan, M. (2025). Mapping of water spread dynamics of a tropical ramsar wetland of India for conservation and management. Environ. Monit. Assess. 197, 145. doi:10.1007/s10661-024-13592-0
Akkala, A., Boubrahimi, S. F., Hamdi, S. M., Hosseinzadeh, P., and Nassar, A. (2025). Spatio-temporal graph neural networks for streamflow prediction in the upper Colorado basin. Hydrology 12, 60. doi:10.3390/hydrology12030060
Argyriou, A., González-Fierro, M., and Zhang, L. (2020). “Microsoft recommenders: best practices for production-ready recommendation systems,” in The web conference.
Bao, K., Zhang, J., Wang, W., Zhang, Y., Yang, Z., Luo, Y., et al. (2023). A bi-step grounding paradigm for large language models in recommendation systems. ACM Trans. Recomm. Syst. 3, 1–27. doi:10.1145/3716393
Bui Huynh, T.-N., Tran, A.-T., and Nguyen, N.-T. (2023). “Graph convolution collaborative filtering with dense embeddings,” in International conference on computational collective intelligence (Springer), 111–124.
Cabrera-Sánchez, J.-P., de Luna, I. R., Carvajal-Trujillo, E., and Villarejo-Ramos, Á. F. (2020). “Online recommendation systems: factors influencing use in e-commerce,”. Sustainability.
Chakraborty, S., Hoque, M. S., Jeem, N. R., Biswas, M., Bardhan, D., and Lobaton, E. (2021). Fashion recommendation systems, models and methods: a review. Informatics.
Chen, S., Zwart, J. A., and Jia, X. (2022a). “Physics-guided graph Meta learning for predicting water temperature and streamflow in stream networks,” in Proceedings of the 28th ACM SIGKDD conference on knowledge discovery and data mining, 2752–2761.
Chen, S., Zwart, J. A., and Jia, X. (2022b). “Physics-guided graph meta learning for predicting water temperature and streamflow in stream networks,” in Proceedings of the 28th ACM SIGKDD conference on knowledge discovery and Data Mining (ACM), 2752–2761. doi:10.1145/3534678.3539276
Chen, Q., Lin, J., Zhao, X., and Wang, F. (2025). Delineation of fallow priority areas under food security constraints using the marxan. Land Degrad. and Dev. 36, 4106–4119. doi:10.1002/ldr.5622
Dagne, S. S., Hirpha, H. H., Tekoye, A. T., Dessie, Y. B., and Endeshaw, A. A. (2023). Fusion of sentinel-1 sar and sentinel-2 msi data for accurate urban land use-land cover classification in gondar city, Ethiopia. Environ. Syst. Res. 12, 40. doi:10.1186/s40068-023-00324-5
Dai, H., Zhu, M., and Gui, X. (2023). “An improved ncf model in federated recommendation systems,” in 2023 China Automation Congress (CAC) (IEEE), 8608–8614.
Dhelim, S., Aung, N., Bouras, M. A., Ning, H., and Cambria, E. (2021). A survey on personality-aware recommendation systems. Artif. Intell. Rev. 55, 2409–2454. doi:10.1007/s10462-021-10063-7
Ding, X., Wang, W., Zhang, B., and Zhang, J. (2025). Attention-based multi-image super-resolution reconstruction for remote sensing. Signal, Image Video Process. 19, 455. doi:10.1007/s11760-025-04080-0
Drif, A., Tabti, M., Amine Tamhachet, M., and Cherifi, H. (2024). “Lightgcn with season filtering for recommender system,” in International conference on complex networks and their applications (Springer), 158–169.
Fayyaz, Z., Ebrahimian, M., Nawara, D., Ibrahim, A., and Kashef, R. (2020). Recommendation systems: algorithms, challenges, metrics, and business opportunities. Appl. Sci. 10, 7748. doi:10.3390/app10217748
Feng, C., Khan, M., Rahman, A. U., and Ahmad, A. (2020). News recommendation systems - accomplishments, challenges and future directions. IEEE Access 8, 167559–167582. doi:10.1109/ACCESS.2020.3023742
Forouzandeh, S., Rostami, M., and Berahmand, K. (2022). A hybrid method for recommendation systems based on tourism with an evolutionary algorithm and topsis model. Fuzzy Inf. Eng. 14, 26–50. doi:10.1080/16168658.2021.2019430
Fu, Z., Xian, Y., Zhang, Y., and Zhang, Y. (2020). “Tutorial on conversational recommendation systems,” in ACM conference on recommender systems.
Gao, J., Liu, Y., Yue, Z., Wu, H., and Li, J. (2023). “Robust preference learning for recommender systems under purchase behavior shifts,” in 2023 26th international conference on computer supported cooperative work in design (CSCWD) (IEEE), 1728–1733.
Hsia, S., Gupta, U., Wilkening, M., Wu, C.-J., Wei, G.-Y., and Brooks, D. (2020). “Cross-stack workload characterization of deep recommendation systems,” in IEEE international symposium on workload characterization.
Hwang, S., and Park, E. (2022). Movie recommendation systems using actor-based matrix computations in South Korea. IEEE Trans. Comput. Soc. Syst. 9, 1387–1393. doi:10.1109/tcss.2021.3117885
Ivchenko, D., Staay, D. V. D., Taylor, C., Liu, X., Feng, W., Kindi, R., et al. (2022). “Torchrec: a pytorch domain library for recommendation systems,” in ACM conference on recommender systems.
Jadidinejad, A. H., Macdonald, C., and Ounis, I. (2021). The simpson’s paradox in the offline evaluation of recommendation systems. ACM Trans. Inf. Syst. 40, 1–22. doi:10.1145/3458509
Javed, U., Shaukat, K., Hameed, I., Iqbal, F., Alam, T. M., and Luo, S. (2021). A review of content-based and context-based recommendation systems. Int. J. Emerg. Technol. Learn. (iJET) 16, 274. doi:10.3991/ijet.v16i03.18851
Javeed, B., Huang, D., Shangguan, D., Ahsan Mukhtar, M., Sajjad, W., Banerjee, A., et al. (2024). Assessing the effectiveness of national park’s policies and laws in promoting biodiversity conservation and ecological development in Pakistan. Front. Environ. Sci. 11, 1333650. doi:10.3389/fenvs.2023.1333650
Kanwal, S., Nawaz, S., Malik, M. K., and Nawaz, Z. (2021). A review of text-based recommendation systems. IEEE Access 9, 31638–31661. doi:10.1109/access.2021.3059312
Khan, H. U. R., Lim, C., Ahmed, M., Tan, K., and Mokhtar, M. B. (2021a). Systematic review of contextual suggestion and recommendation systems for sustainable e-tourism. Sustainability 13, 8141. doi:10.3390/su13158141
Khan, H. U. R., Lim, C., Ahmed, M., Tan, K., and Mokhtar, M. B. (2021b). Sustainability Calculus in adopting smart Speakers—Personalized services and privacy risks. Sustainability 13, 602. doi:10.3390/su13020602
Ko, H., Lee, S., Park, Y., and Choi, A. (2022). A survey of recommendation systems: recommendation models, techniques, and application fields. Electronics 11, 141. doi:10.3390/electronics11010141
Kreutz, C. K., and Schenkel, R. (2022). Scientific paper recommendation systems: a literature review of recent publications. Int. J. Digital Libr. 23, 335–369. doi:10.1007/s00799-022-00339-w
Lal, P., Singh, G., Das, N. N., Entekhabi, D., Lohman, R., Colliander, A., et al. (2023). A multi-scale algorithm for the nisar mission high-resolution soil moisture product. Remote Sens. Environ. 295, 113667. doi:10.1016/j.rse.2023.113667
Lal, P., Singh, G., Das, N. N., and Lohman, R. B. (2025). Validation of the nisar multi-scale soil moisture retrieval algorithm across various spatial resolutions and landcovers using the alos-2 sar data. J. Remote Sens. 5, 0729. doi:10.34133/remotesensing.0729
Lin, J., Wang, Y., Lin, Z., and Li, S. (2025). National-scale connectivity analysis and construction of forest networks based on graph theory: a case study of China. Ecol. Eng. 216, 107639. doi:10.1016/j.ecoleng.2025.107639
Liu, T., Jiang, A., Zhou, J., Li, M., and Kwan, H. K. (2023). Graphsage-based dynamic spatial–temporal graph convolutional network for traffic prediction. IEEE Trans. Intelligent Transp. Syst. 24, 11210–11224. doi:10.1109/tits.2023.3279929
Maier, C., and Simovici, D. (2022). Bipartite graphs and recommendation systems. J. Adv. Inf. Technol. 13. doi:10.12720/jait.13.3.249-258
Mashayekhi, Y., Li, N., Kang, B., Lijffijt, J., and Bie, T. D. (2022). A challenge-based survey of e-recruitment recommendation systems. ACM Comput. Surv. 56, 1–33. doi:10.1145/3659942
Nawara, D., and Kashef, R. (2020). “Iot-based recommendation systems – an overview,” in 2020 IEEE international IOT, electronics and mechatronics conference (IEMTRONICS).
Nawara, D., and Kashef, R. (2021). Context-aware recommendation systems in the iot environment (Iot-cars)–a comprehensive overview. IEEE Access 9, 144270–144284. doi:10.1109/access.2021.3122098
Otamendi, U., Maiza, M., Olaizola, I. G., Sierra, B., Florez, M., and Quartulli, M. (2024). Integrated water resource management in the segura hydrographic basin: an artificial intelligence approach. J. Environ. Manag. 370, 122526. doi:10.1016/j.jenvman.2024.122526
Popescu, S. M., Mansoor, S., Wani, O. A., Kumar, S. S., Sharma, V., Sharma, A., et al. (2024). Artificial intelligence and iot driven technologies for environmental pollution monitoring and management. Front. Environ. Sci. 12, 1336088. doi:10.3389/fenvs.2024.1336088
Rocco, J. D., Ruscio, D. D., Sipio, C. D., Nguyen, P. T., and Rubei, R. (2021). Development of recommendation systems for software engineering: the crossminer experience. Empir. Softw. Eng. 26, 69. doi:10.1007/s10664-021-09963-7
Shi, S., Gong, Y., and Gursoy, D. (2020). Antecedents of trust and adoption intention toward artificially intelligent recommendation systems in travel planning: a heuristic–systematic model. J. Travel Res. 60, 1714–1734. doi:10.1177/0047287520966395
Sun, Z., Xu, Y., Liu, Y., He, W., Jiang, Y., Wu, F., et al. (2022). A survey on federated recommendation systems. IEEE Trans. Neural Netw. Learn. Syst. 36, 6–20. doi:10.1109/tnnls.2024.3354924
Urdaneta-Ponte, M. C., Méndez-Zorrilla, A., and Oleagordia-Ruíz, I. (2021). Recommendation systems for education: systematic review. Electronics 10, 1611. doi:10.3390/electronics10141611
Varma, N. P., Sinha, A., Gupta, S. K., Mahato, J. K., and Chand, P. (2024). Enhanced defluoridation by nano-crystalline alum-doped hydroxyapatite and artificial intelligence (ai) modeling approach. Front. Environ. Sci. 12, 1363724. doi:10.3389/fenvs.2024.1363724
Wang, Y., Gao, M., Ran, X., Ma, J., and Zhang, L. Y. (2023). An improved matrix factorization with local differential privacy based on piecewise mechanism for recommendation systems. Expert Syst. Appl. 216, 119457. doi:10.1016/j.eswa.2022.119457
Wei, G., Wu, Q., and Zhou, M. (2021). A hybrid probabilistic multiobjective evolutionary algorithm for commercial recommendation systems. IEEE Trans. Comput. Soc. Syst. 8, 589–598. doi:10.1109/tcss.2021.3055823
Yadalam, T. V., Gowda, V. M., Kumar, V. S., Girish, D., and M, N. (2020). “Career recommendation systems using content based filtering,” in International conference on communication and electronics systems.
Yang, L., Tan, B., Zheng, V., Chen, K., and Yang, Q. (2020). Federated recommendation systems. Fed. Learn., 225–239. doi:10.1007/978-3-030-63076-8_16
Zhang, Z., Patra, B. G., Yaseen, A., Zhu, J., Sabharwal, R., Roberts, K., et al. (2023). “Scholarly recommendation systems: a literature survey,” in Knowledge and information systems.
Keywords: multiscale remote sensing, wetland dynamics, crop development, graph attention networks, knowledge distillation
Citation: Zhang Y, Lin X, Hei J, Wang Y and Zhang A (2025) Multiscale remote sensing methods for monitoring wetland ecosystem dynamics and crop development. Front. Environ. Sci. 13:1626025. doi: 10.3389/fenvs.2025.1626025
Received: 09 May 2025; Accepted: 07 November 2025;
Published: 11 December 2025.
Edited by:
Sawaid Abbas, University of the Punjab, PakistanReviewed by:
Cornel Ilinca, Technical University of Construction, RomaniaFranco da Silveira, Brazilian Agricultural Research Corporation (EMBRAPA), Brazil
Copyright © 2025 Zhang, Lin, Hei, Wang and Zhang. This is an open-access article distributed under the terms of the Creative Commons Attribution License (CC BY). The use, distribution or reproduction in other forums is permitted, provided the original author(s) and the copyright owner(s) are credited and that the original publication in this journal is cited, in accordance with accepted academic practice. No use, distribution or reproduction is permitted which does not comply with these terms.
*Correspondence: Ying Zhang, c3p3ZWNoYXZub3JhQGhvdG1haWwuY29t