 Chongbo Wu1
 Huanyao Liu
 Xiaoma Li
- 1College of Environment & Ecology, Hunan Agricultural University, Changsha, China
- 2CAS Key Laboratory for Agro-ecological Processes in Subtropical Regions, Institute of Subtropical Agriculture, Changsha, China
- 3College of Landscape Architecture and Art Design, Hunan Agricultural University, Changsha, China
Urban Green Hearts (GHs) represent a unique ecological protection measure or policy. Evaluating the spatiotemporal dynamics of the ecological environmental quality (EEQ) of urban GHs and revealing their conservation effectiveness is crucial for promoting the coordination between regional development and environmental preservation. This study examines the Changsha-Zhuzhou-Xiangtan urban agglomeration Green Heart (CZT-GH) and its 3 km buffer zone, evaluating the effectiveness of ecological environment protection following GH policy implementation, and analyzing the spatiotemporal dynamics of EEQ. The Remote Sensing Ecological Index (RSEI) was calculated using the Google Earth Engine (GEE) platform, and conservation effectiveness was evaluated through Propensity Score Matching (PSM) and Wilcoxon tests. The findings reveal that: (1) The RSEI demonstrated an average annual growth rate of 0.0038 years-1 over 31 years, with significant increases during 1990–2013 (0.0045 years-1) and 2013–2020 (0.0089 years-1). (2) Comparing pre- and post-GH policy implementation periods (1990–2013 vs. 2013–2020), areas showing EEQ improvement increased from 77.15% to 89.69%, while areas with stable and decreased EEQ declined from 22.36% to 10.17%. (3) GH policy demonstrates substantial positive conservation effects, with both GH and the 3 km buffer zone exhibiting EEQ improvements. This research provides valuable insights for GH management strategies and enhancing the balance between regional development and environmental preservation.
1 Introduction
Urban ecological green hearts (GHs) are defined as the green spaces at the geometric centers of multiple regions or cities within urban agglomerations (Ghahramani et al., 2021; Kühn, 2003), serving a vital ecological and landscape function by delivering essential ecosystem services, maintaining regional ecological security, preserving biodiversity, and increasing landscape heterogeneity. These functions contribute to urban structure optimization, human health enhancement, and the establishment of equilibrium between regional economic development and nature (Giannico et al., 2021; Xu and Zhao, 2023). Consequently, the Chinese government has actively promoted ecological civilization and encouraged GH development in urban agglomerations (Xue et al., 2023; Zhang L. et al., 2023). The Changsha-Zhuzhou-Xiangtan urban agglomeration Green Heart (CZT-GH, 528.32 km2) has emerged as the world’s largest GH. Since the implementation of the CZT-GH policy in 2013 (Tang et al., 2023), local governments have focused on developing GH into a high-quality urban green space to maximize its ecological hub and ecosystem service functions, including urban microclimate regulation and air quality improvement (Islam et al., 2024; Sharifi et al., 2021; Xu W. et al., 2024). However, rapid economic development and urbanization continuously subject GHs to ecological pressure. Construction land expansion diminishes landscape integrity and connectivity in GHs, affecting ecosystem stability and ecological services (Tang et al., 2023). Therefore, understanding the spatiotemporal distribution and patterns of ecological environmental quality (EEQ) in GHs before and after policy implementation is essential for providing scientific support for future management, restoration, and sustainable development of these areas.
Previous studies have primarily employed metrics such as the Normalized Difference Vegetation Index (NDVI) (Zhang et al., 2024b), vegetation cover types (Li X. et al., 2024), and plant communities (Chen et al., 2020) to examine EEQ spatiotemporal changes. However, NDVI is influenced by factors including climate, seasonality, and soil moisture, limiting its ability to capture the GH ecological environment complexity (Dronova, 2017). Additionally, studies on vegetation cover types and plant communities often neglect the spatial heterogeneity and dynamic evolution of EEQ (Chen S. et al., 2023). In recent years, some weighting methods used for quantitatively assessing EEQ have limitations due to their underlying principles, leading to varying application scopes. For example, the Entropy Weighting Method (EWM) tends to overlook the intrinsic importance of indicators, causing the weights to deviate from expectations, and it cannot perform dimensionality reduction on the indicators (Wu et al., 2022). The Analytic Hierarchy Process (AHP) is highly influenced by subjective human factors in determining indicator weights (Liu et al., 2024a). The Remote Sensing Ecological Index (RSEI), incorporating four remote-sensing-derived indicators (greenness, dryness, humidity, and heat), applies Principal Component Analysis (PCA) based on covariance to assign weights to these indicators. This approach helps RSEI avoid errors and biases that could arise from subjective influence in defining the weights of the indicators (Chen N. et al., 2023; Liu et al., 2024b; Liu et al., 2023; Zheng et al., 2022) and objectively reflects the impact of ecological elements, such as vegetation coverage and climate variations on EEQ (Lv et al., 2025). The objectivity and integration of RSEI enhance its suitability for analyzing EEQ spatiotemporal dynamics (Li Y. et al., 2023; Yuan et al., 2021). For example, RSEI has been utilized to assess EEQ in the Yellow River delta (Cai et al., 2023) and to evaluate EEQ in the Greater Khingan Range (Chen et al., 2022). Furthermore, Yang et al. (2023) employed RSEI and the CA-Markov model to assess EEQ in three Chinese megacities: Guangzhou, Nanjing, and Kunming. However, RSEI faces challenges in managing large-scale data, complex spatial heterogeneity, and temporal data comparability (Shi et al., 2024; Yang et al., 2022). The GEE platform addresses these challenges by providing direct database access and efficient processing of long-term geospatial data (Campos et al., 2023; Liu et al., 2023). These capabilities enable GEE to enhance the efficiency and accuracy of the RSEI application in complex ecological environments. RSEI has made notable progress in improving the accuracy and efficiency of EEQ assessments in large-scale urban complex environments in recent years. For example, the Difference Index (DI) captures PM2.5 variations and can be integrated into the RSEI system to enhance EEQ monitoring accuracy in the Yangtze River Delta Urban Agglomeration environments (Lu et al., 2025). Combining the EWM with RSEI enhances the reflection of urban environmental conditions and simplifies the process in Jining (Chen N. et al., 2023).
The Propensity Score Matching (PSM) method effectively reduces differences in covariates between treatment and control groups, enhancing evaluation accuracy (Randolph et al., 2014). It has been extensively applied to assess the effectiveness of the EEQ of protected areas (PAs) and policy implementation. For example, combining PSM with paired t-tests has revealed positive spillover effects of PAs on forest coverage and buffer zone benefits (Chen et al., 2017). Furthermore, PSM was employed to evaluate how 680 protected reserves in China mitigated human activity pressure by selecting similar sample data from buffer zones and protected areas (Zhang et al., 2021). Regarding policy evaluation, the PSM-DID (Difference-in-Differences) method distinguishes policy implementation effects from natural temporal changes based on data differences between protected areas and buffer zones (Ye et al., 2024). However, existing PSM studies often emphasize short-term policy effects and single indicators (e.g., forest coverage or wetland area), overlooking long-term trends and ecosystem multidimensional characteristics (Jin et al., 2024; Li K. et al., 2024; Wang C. et al., 2023). Studies on GH policies have established important foundations for evaluating policy implementation efficacy (He et al., 2024; Tang et al., 2023). Given increasing ecological challenges, a comprehensive and structured assessment of GH policy efficacy is essential. Therefore, utilizing the PSM method to evaluate GH policy effectiveness based on long-term RSEI trends within GH and its buffer zones presents a feasible and reliable approach.
As the world’s largest urban agglomeration GH, the CZT-GH serves a vital role in ecological protection and urban planning (Tang et al., 2023). Based on remote sensing imagery from 1990 to 2020, this study constructs the RSEI and applies the PSM method to (1) examine the spatial-temporal dynamics of EEQ (RSEI) in the CZT-GH; (2) evaluate the long-term trend of RSEI in the study region from 1990 to 2020; (3) compare the conservation effectiveness of EEQ in GH subareas and the 3 km buffer zone pre- and post-GH policy implementation.
2 Materials and methodology
2.1 Study area
The CZT-GH (112.89°E–113.30°E, 27.72°N–28.09°N) is situated at the geographic intersection of Changsha, Xiangtan, and Zhuzhou, functioning as a vital connection between these three cities (Figure 1a). The region experiences a subtropical monsoon climate, with annual temperatures ranging from 3.2 °C to 31.7 °C and average yearly precipitation of 1,450 mm. The topography comprises low hills, mountains, and plains. The dominant land use categories consist of farmland, forest, and construction areas. The non-crop vegetation includes evergreen broadleaf, evergreen needleleaf, and deciduous broadleaf forests, alongside wetlands. The CZT-GH contains abundant natural resources, establishing it as a significant biodiversity conservation area and wildlife habitat. As of 2018, the CZT-GH had a population of 3.32 million, distributed as 42.3% rural and 57.7% urban. The GDP attained 35.11 billion RMB, with the tertiary sector comprising the largest portion at 53%. The government in Hunan Province revised the GH policy in 2013, which legally safeguards the GH with a focus on establishing ecological barriers, maximizing ecosystem services, promoting high-end primary and tertiary industries, and optimizing land use structures for sustainable regional development (Cao et al., 2023).
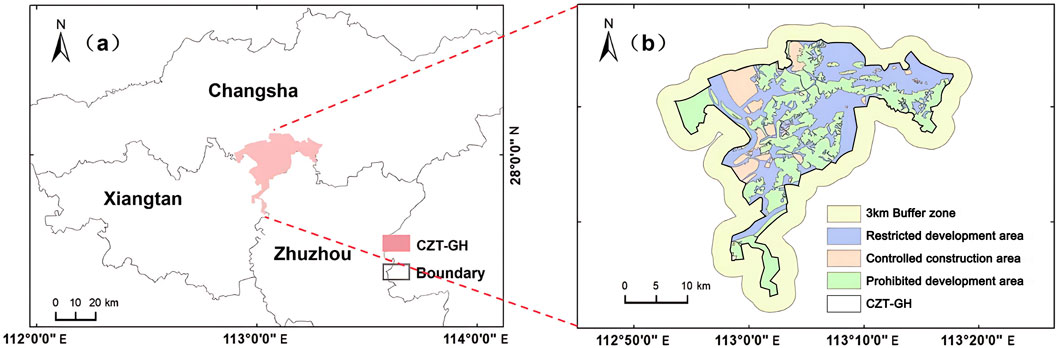
Figure 1. The location of the CZT-GH (a) and its buffer zone (b).
2.2 Satellite data and preprocessing
In this research, we utilized Landsat Collection two imagery from GEE, a cloud-based platform providing access to global surface reflectance and LST products with enhanced geolocation accuracy (Table 1). Remote sensing data, including annual Landsat 5 TM images from 1990 to 2011, Landsat 7 ETM+ image in 2012, and annual Landsat 8 OLI/TIRS images from 2013 to 2020, were selected during the vegetation growth period between April and September in the study area (Zhang Y. et al., 2022). These images were mosaicked to minimize cloud cover and atmospheric interference and processed with GEE at a 30-m spatial resolution. The preprocessing steps comprised data filtering, radiometric calibration, cloud and water masking, atmospheric adjustment to surface reflectance, and geometric alignment of the images. These steps ensure spatial consistency and high-quality data for accurate analysis of EEQ trends throughout the study period (Fu et al., 2024). A median synthesis was applied to cloud-masked scenes to merge them into a final image, reducing residual cloud shadows and noise while preserving natural surface reflectance and avoiding extreme value bias. Additionally, the water body mask was derived from the JRC/GSW1_3/Yearly History, which provides surface water location and time data from 1990 to 2020. This dataset effectively minimizes water body impact on the RSEI calculation. We applied image fusion and normalization methods to eliminate biases caused by temporal differences in sensor data from Landsat 5 TM, Landsat 7 ETM+, and Landsat 8 OLI, mapping the data from different sensors to a unified scale, ensuring temporal consistency and accuracy across the data (Mancino et al., 2020; Wachmann et al., 2024). Due to the failure of the Landsat seven sensor’s Scan Line Corrector, the images exhibit striping gaps. Missing pixels were filled using the focal statistics function, with focalMean and blend functions applied (Yan et al., 2024). The parameters of the focalMean function are detailed in Supplementary Table S1. This function calculates the average of input pixels within a defined neighborhood and assigns it to fill the missing pixels, effectively completing the imagery gaps (Huang et al., 2025). Due to the 16-day revisit period and limited coverage, annual composite imagery was used.
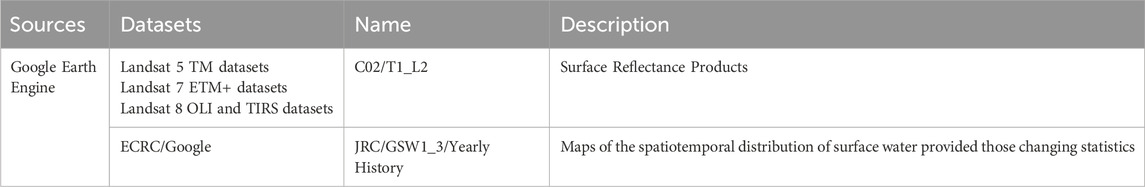
Table 1. Remote data sources.
2.3 Data sources and determination of zones and buffer width for GH
The DEM data were obtained from the Geospatial Data Cloud (https://www.gscloud.cn) utilizing the GDEMV2 dataset with a 30 m spatial resolution. Slope and slope aspect data were derived from the DEM data. Vegetation data were acquired from the Resource and Environment Science and Data Center (https://www.resdc.cn), providing spatial distribution data of China’s vegetation types. Land use data were obtained from the Geographical Information Monitoring Cloud Platform (1990–2020), including classifications such as cropland, water areas, forest, grassland, urban zones, and unutilized land. Both road and village boundary datasets were extracted from Open Street Map (https://www.openstreetmap.org), incorporating national road networks and administrative boundaries at the village level in the Hunan Province. The details of data types and sources for GH are detailed in Table 2.
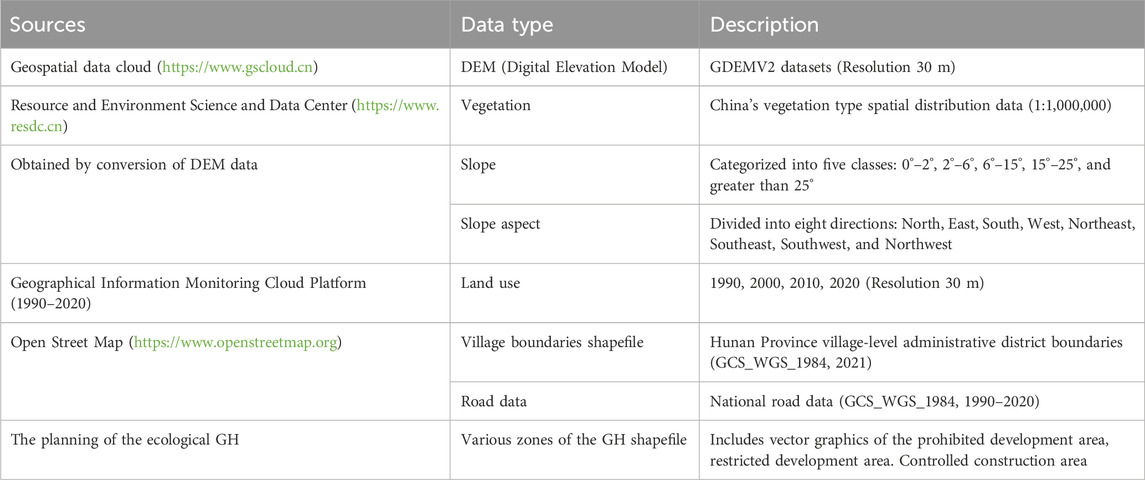
Table 2. GH data sources.
According to the spatial planning schematic from the “Comprehensive Strategy for the GH Zone in the Changsha-Zhuzhou-Xiangtan Metropolitan Region”, GH is divided into three regions: prohibited development area, restricted development area, and controlled construction area (Figure 1b). The prohibited development area, encompassing 275.89 km2 (52.22% of the total area), comprises areas of extreme and high ecological sensitivity, ecological reserves, mountains with slopes exceeding 25°, and contiguous farmlands and wetlands. The restricted development area encompasses 191.30 km2 (36.21%), including regions of moderate and low ecological sensitivity, areas surrounding the Xiangjiang River and its main tributaries, and elevated terrains with slopes ranging from 15° to 25°. The controlled construction area spans 61.13 km2 (11.57%), incorporating contiguous development areas, non-sensitive ecological zones, and regions with high development potential. Based on the environmental variable similarities between the 3 km buffer zone and the GH, and considering spillover effects at PA edges from previous research (Chiu et al., 2016; Shen Y. et al., 2022), a 3 km buffer zone of GH was established using the Analyst Toolbox in ArcGIS 10.8 (Figure 1b).
2.4 Construction of RSEI
RSEI is a comprehensive ecological index that analyzes EEQ spatiotemporal dynamics with remote sensing images (Xu et al., 2019). The construction of the RSEI requires four indicators: greenness, wetness, dryness, and heat (Supplementary Table S2). The formula is presented in Equation 1. This comprehensive approach enables an objective and impartial evaluation of EEQ.
Where greenness, wetness, dryness, and heat represent the four remote sensing metrics-the Normalized Difference Vegetation Index (NDVI), Wetness (WET), Normalized Difference Bare Soil Index (NDBSI), and Land Surface Temperature (LST), respectively (Yang and Li, 2023). Furthermore, to prevent water’s influence on principal component loadings and account for variance in indicator scales, the modified normalized difference water index (MNDWI) is applied for each indicator to mask the water body before PCA analysis (Du et al., 2016). The formulas for normalization and water mask are presented in Equations 2,3.
Where M is the initial index, NI stands for the Normalized Index, and Mmin and Mmax denote the lowest and largest values of the indicator, respectively.
Where Green and SWIR1 denote the reflectance of Band two and Band five in Landsat 8, and Band 3 and Band 4 in Landsat 5/7, respectively.
Then, to calculate the initial Remote Sensing Ecological Index (RSEI0), we first normalize the four indicators mentioned above to the range [0, 1] to ensure comparability and avoid unbalanced weighting due to differing dimensions. These normalized indicators are then processed using PCA to extract the first principal component (PC1), which captures the main variance in the data. To align the higher RSEI values with better ecological quality, we subtract PC1 from 1, as shown in Equation 4:
Where the RSEI value lies within the range of [0, 1], with higher values reflecting superior ecological health (Pariha et al., 2021; Yuan et al., 2021), and PC1 denotes the first principal component of indicators, and f represents the normalized form of each indicator. To demonstrate the protective effectiveness of GH policies, the timeline was divided into two phases: 1990–2013 and 2013–2020, using the implementation year of GH policy as the dividing line. By comparing data from these two periods, a more comprehensive assessment of the area’s ecological shifts can be obtained.
2.5 Analysis methods
The study’s methodology is depicted Figure 2. Initially, four remote sensing metrics-NDVI, WET, NDBSI, and LST-were extracted from the synthesized Landsat imagery on the GEE platform. PCA was employed to generate annual spatiotemporal maps of RSEI for each CZT-GH subarea from 1990 to 2020. Subsequently, Theil-Sen-Mann-Kendall (MK) was applied to analyze the EEQ trends in GH. Lastly, PSM and Wilcoxon methods were utilized to assess and evaluate the effectiveness of the GH policy.
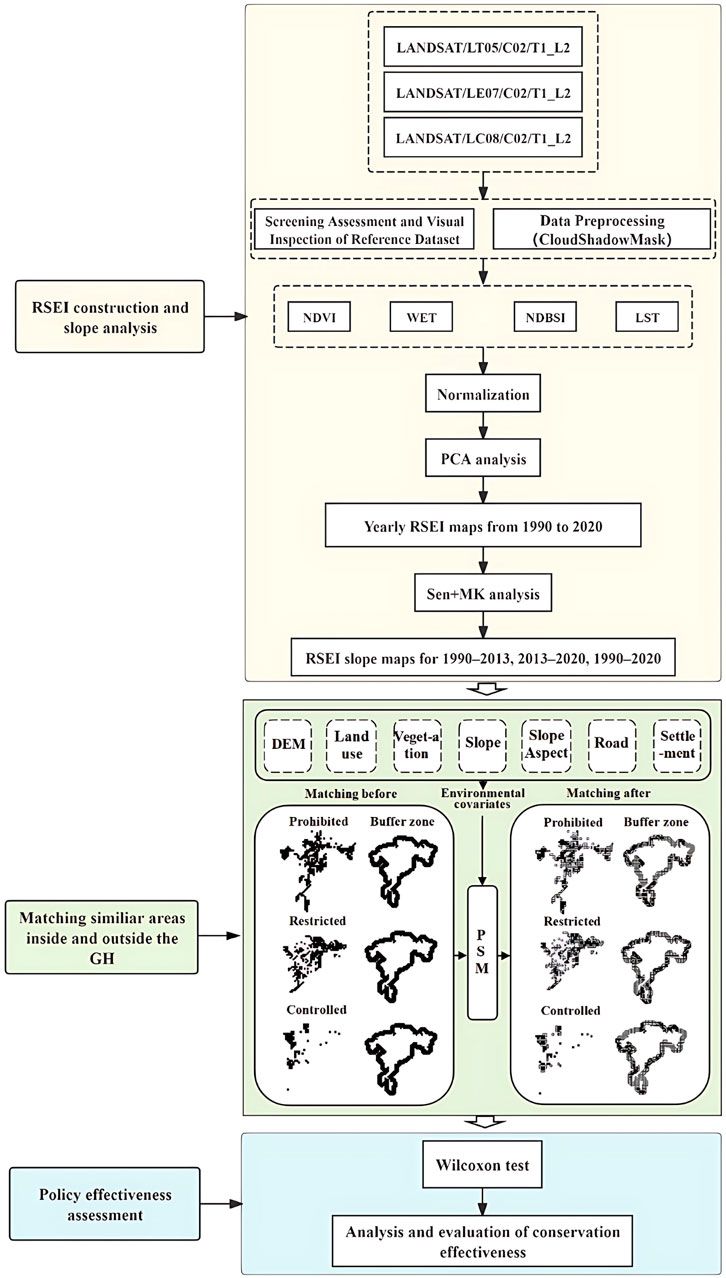
Figure 2. Research flow chart.
2.5.1 Least squares linear regression analysis
The least squares linear regression equation was applied to quantitatively analyze the interannual variation trend of EEQ in GH (Zhang et al., 2023a). In this regression model, time (year) serves as the independent variable, while RSEI represents the dependent variable. RSEI interannual trend graphs were generated for the periods 1990–2013, 2013–2020, and 1990–2020, along with a line graph of RSEI from 1990 to 2020. The interannual variation slope calculation formula is presented in Supplementary Figure S1.
Linear trend estimation and correlation coefficient statistical tests enable clearer evaluation and comparison of changes across different time periods.
2.5.2 Theil-Sen and Mann-Kendall
This study utilized the Theil-Sen (Jiang B. et al., 2024; Li et al., 2025) and Mann-Kendall (Jiao et al., 2021; Zhou S. et al., 2024) methods to analyze the temporal variation trends of the RSEI in the CZT-GH for the periods 1990–2013 and 2013–2020. These robust non-parametric statistical methods do not require normal distribution assumptions and are insensitive to outliers (Wan et al., 2023; Yue et al., 2020), making them ideal for analyzing trends in extended time series datasets (Li et al., 2020; Shen X. et al., 2022; Wu et al., 2021). The temporal trends were classified into five categories based on their magnitude and direction: “Serious degradation” (βRSEI ≤ −0.005, Z < 1.96), “Slight degradation” (βRSEI ≤ −0.005, −1.96 < Z < 1.96), “No change” (−0.005 < βRSEI < 0.005, −1.96 < Z < 1.96), “Slight improvement” (βRSEI ≥ 0.005, −1.96 < Z < 1.96), and “Strong improvement” (βRSEI ≥ 0.005, Z ≥ 1.96) (Tang et al., 2023; Wu et al., 2021). The Theil-Sen-MK method’s statistical fundamentals are displayed in Supplementary Table S3, S4. The formula for β is shown in Supplementary Figure S1.
In the Theil-Sen method, β indicates the trend of change, where xj and xi represent time series data, with β > 0 indicating an increasing trend and β < 0 indicating a decreasing trend. The statistical significance of the trend in Theil-Sen is determined by the MK Z value, established at three confidence levels: 90%, 95%, and 99% (Wang G. et al., 2023). The significance level (α) is set at 0.05, with a time series sample size (n) of 30. The standardized test statistic Z calculation for the RSEI time series is illustrated in Supplementary Figure S1.
2.5.3 Propensity score matching (PSM)
PSM is a methodology used to balance covariates between treatment and control groups by matching subjects with similar propensity scores, thereby simulating randomization (Rosenbaum, 1989). To evaluate whether GH policy implementation significantly influenced EEQ protection from 1990 to 2020, the data underwent propensity score matching. Seven factors were selected as covariates based on their capacity to capture environmental heterogeneity and their relevance to EEQ, as identified in previous studies: DEM, slope, slope aspect, land use, vegetation cover type, distance to the nearest residential area, and distance to the nearest road (Joppa and Pfaff, 2010; Zhang et al., 2023a; Zhang Z. et al., 2022). Topographic elevation significantly influences precipitation distribution and hydrological processes, directly affecting the region’s soil and water conservation potential (Jiang et al., 2021). Slope and aspect variations influence soil fertility and vegetation growth, subsequently affecting biodiversity (Zhang et al., 2023b). Land use types determine regional connectivity and ecological services (Field and Parrott, 2022). Vegetation cover indicates ecological conditions and can be modified by different land use practices, impacting conservation outcomes (Zhou Y. et al., 2024). Proximity to roads and residential areas reflects external connectivity, indicating urban expansion and potential human activity pressure on ecosystems (Tong et al., 2023). Due to spatial and temporal limitations and the difficulty in obtaining detailed data, socioeconomic drivers (e.g., GDP growth, population density) and policy-specific interventions (e.g., zoning enforcement intensity) were not considered in the PSM analysis.
The study area was divided into 1 km by 1 km grids (Chen et al., 2017), with grids in GH designated as treatment samples and grids in the 3 km buffer zone as control samples. PSM was conducted independently between each GH subarea (controlled, prohibited, and restricted development area) and the 3 km buffer zone. The matching outcomes for the controlled development area and its buffer zone (Buffer-C), prohibited development area and its buffer zone (Buffer-P), and restricted development area and its buffer zone (Buffer-R) are illustrated in Figures 6a–f, respectively. Covariate data were obtained using grid masks for each GH subarea and the 3 km buffer zone. The extracted data within the grids were converted to points. The study employed propensity scores from treatment and control groups as the distance metric and performed matching based on the nearest neighbor method, minimizing potential bias from confounding variables (Eskelson et al., 2009). This method eliminates environmental variations between GH and non-GH grids, enabling one-to-one matching under comparable environmental conditions (Xu A. et al., 2024). The caliper (δ) was set to 0.2 to achieve a balance between obtaining sufficient matched pairs while avoiding poor matches that could skew the results (Lunt, 2014). Matching was performed using the MatchIt package in R. 4.3.2 (Jiang M. et al., 2024).
2.5.4 Wilcoxon analysis
The Wilcoxon analysis is a non-parametric approach suitable for evaluating non-normally distributed data (Bauer, 1972; McKeever et al., 2024). This study extracted matched grid data in GH and the 3 km buffer zone and transformed it into matrix data. The Wilcoxon test (α = 0.05) was applied to analyze and compare the differences in βRSEI between 1990–2013 and 2013–2020 in GH and the 3 km buffer zone, as well as in the matched buffer zones of each subarea before and after the implementation of GH policy. A P-value <0.05 from a Wilcoxon test result indicates a significant difference in conservation effectiveness. Additionally, a βRSEI >0 represents an improvement in EEQ, and a higher βRSEI indicates a greater improvement in conservation effectiveness. This analysis evaluates the impact of the conservation effectiveness of GH policy, conducted in R. 4.3.2.
3 Result
3.1 Composition and variation of RSEI in the CZT-GH
A PCA on the RSEI of CZT-GH (1990–2020) reveals that the cumulative contribution rate of the main components (PC1) in GH is 63.7% ± 2.4% (mean ± SD) (Table 3). The majority of characteristics of the NDVI, WET, LST, and NDBSI can be represented by these first principal components (mean ± SD). According to their contribution rates to RSEI, the NDVI and WET contribute positively to ecology, while NDBSI and LST demonstrate adverse ecological impacts.
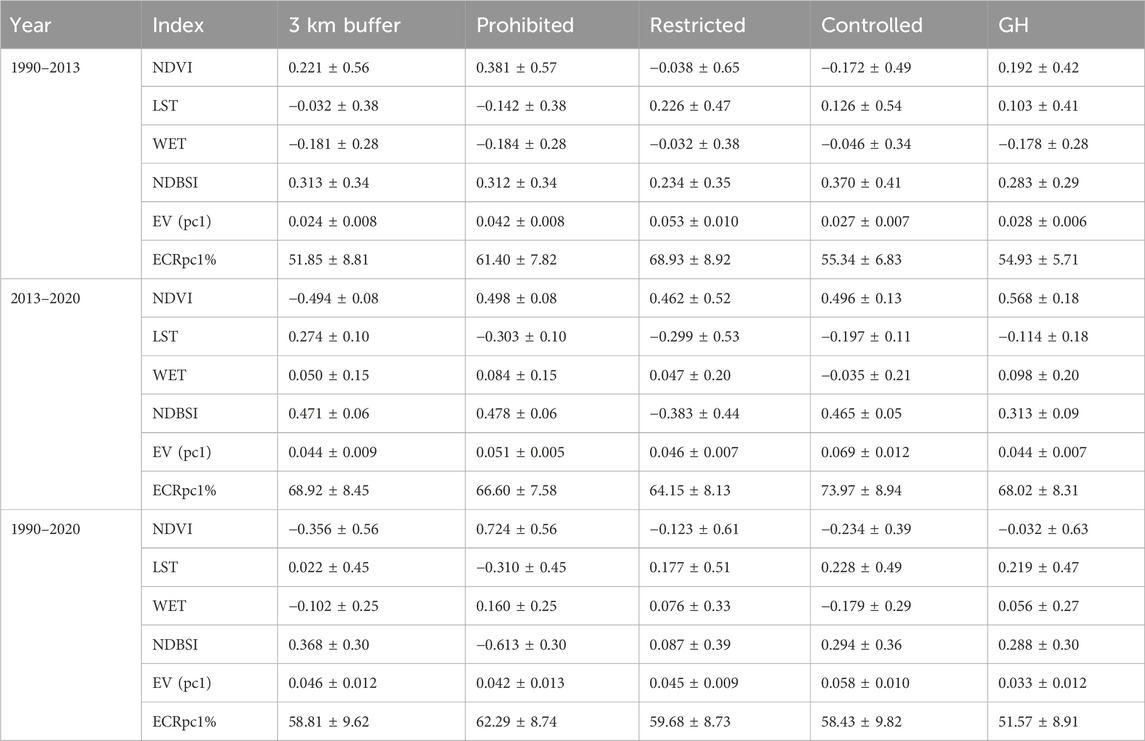
Table 3. Results of PCA of four indexes.
During the three monitoring periods, the overall RSEI levels predominantly fall into the “Moderate” and “Good” categories, with areas of low values primarily located in the controlled construction area and the southeastern part of the buffer zone (Supplementary Figure S2a–c). Higher RSEI values are predominantly observed in the prohibited development area and restricted development area, along with their adjacent buffer zones. The southern part of the CZT-GH demonstrated a notable increase in RSEI from 2013 to 2020 (Supplementary Figure S2b). This improvement is attributed to GH policy, which prioritizes protecting the natural environment and controlling large-scale economic development.
As illustrated in Supplementary Figure S2c, the “Poor” category comprises the smallest area at 6.00% of the total, followed by “Fair” at 11.22%, “Moderate” category at 19.79%, “Good” category at 37.02%, and “Excellent” category at 25.98%. The percentages of each category demonstrate fluctuations (Figure 3). The “Fair” “Poor” and “Good” categories exhibit a relative fluctuation trend, the “Moderate” category shows a significant reduction, and the “Excellent” categories display clear growth. Before (1990–2013) and after (2013–2020) policy implementation, the average proportion of areas with the “Moderate”, “Fair”, and “Poor” categories decreased from 22.36% to 10.17%, while the share of “Good” and “Excellent” categories increased from 77.15% to 89.69%.
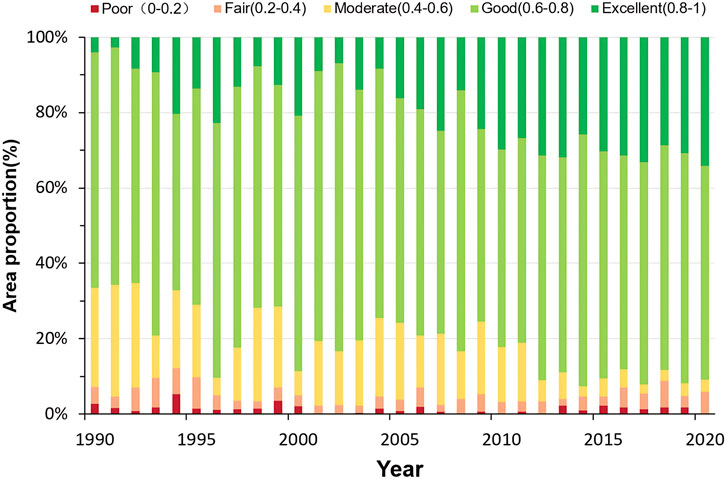
Figure 3. Area distribution of RSEI level in the CZT-GH from 1990 to 2020.
3.2 Long-term trend of RSEI
The RSEI in the area exhibited a fluctuating upward trend, indicating an improvement in the overall EEQ in the CZT-GH (Figure 4). The annual RSEI across the entire region has increased by 0.0038 over the study period. The growth rate from 1990 to 2013 was slightly lower than that from 2013 to 2020, with rates of 0.0045 years-1 and 0.0089 years-1, respectively.
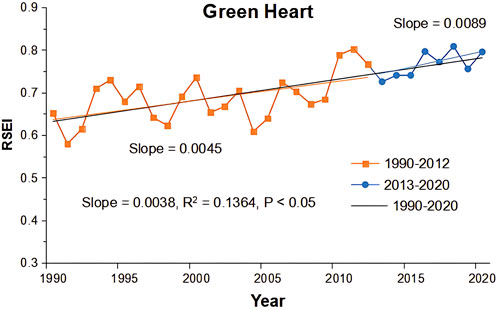
Figure 4. Temporal trends in the RSEI values for the CZT-GH from 1990 to 2020.
The βRSEI analysis using the Theil-Sen-MK method revealed distinct spatial variations in EEQ changes across the study area from 1990 to 2020 (Figure 5). The “No change” category decreased substantially from 75.49% to 29.16% between the periods 1990–2013 and 2013–2020. Simultaneously, areas showing “Slight improvement” and “Strong improvement” categories in EEQ increased significantly from 23.86% to 59.38% during these periods. As shown in Figures 5a,b, the dominant EEQ trend spatially transitioned from “No change” to “Slight improvement,” becoming widely distributed across various subareas. Regions exhibiting “Serious degradation” and “Slight degradation” categories increased from 0.97% to 12.24%, shifting from the northern part of GH to the southeastern and southern buffer zones between 1990–2013 and 2013–2020.
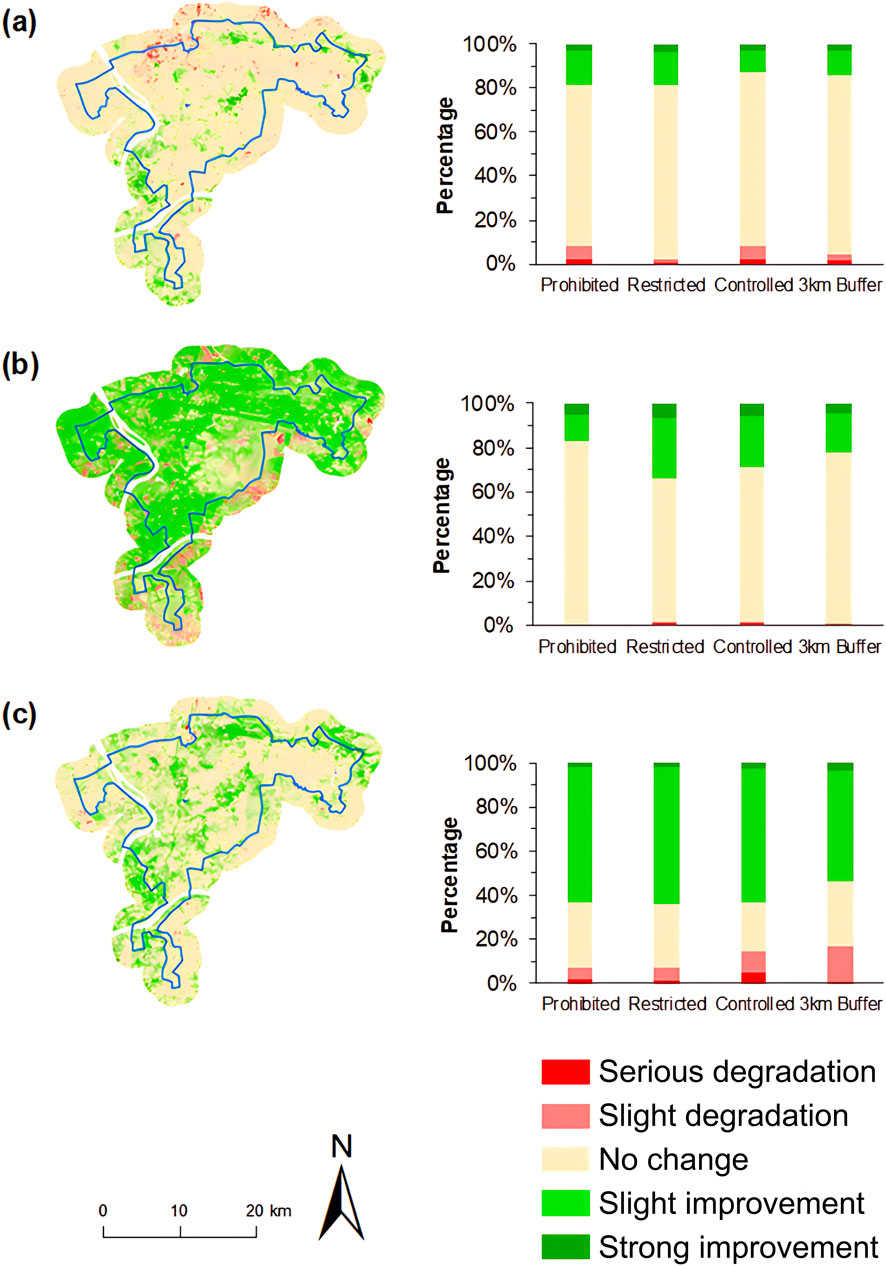
Figure 5. RSEI changing trends at the significant 0.05 level from 1990 to 2013 (a), 2013–2020 (b), and 1990–2020 (c), with corresponding sub-region percentages for each period.
Throughout 1990–2020, roughly 12% of the total study area demonstrated “Slight improvement” and “Strong improvement” categories in EEQ change trends (Figure 5c), mainly concentrated in the northern GH and southwestern buffer zones. The “Slight improvement” category constituted 8.7% of this change. The predominant EEQ change trend remained “No change,” comprising approximately 83% and primarily distributed across central GH and the eastern buffer zone. The areas classified under the “Slight degradation” and “Serious degradation” categories represented only 2.24% and 0.94% of the total area, respectively.
3.3 PSM for assessing conservation effects on EEQ
In the PSM results, the prohibited development area and restricted development area yielded 172 and 174 matched data points, respectively (Table 4). Within the Buffer-P and Buffer-R, the matched data locations demonstrated a high overlap rate, predominantly situated in the southern, eastern, and western regions (Figures 6c,e). The propensity score matching results in the controlled construction area indicated near-complete fulfillment of the matching criteria (Figure 6b).
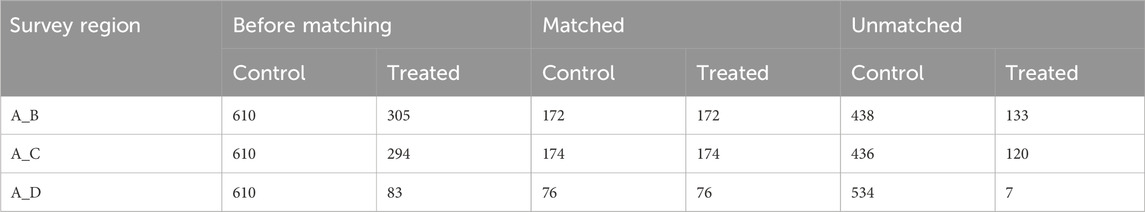
Table 4. PSM results between GH and the 3 km buffer zone. A refers to the 3 km buffer zone. B refers to the prohibited development area. C refers to the restricted development area. D refers to the controlled construction area. Numbers in the table are the values, which refer to the values of grids.
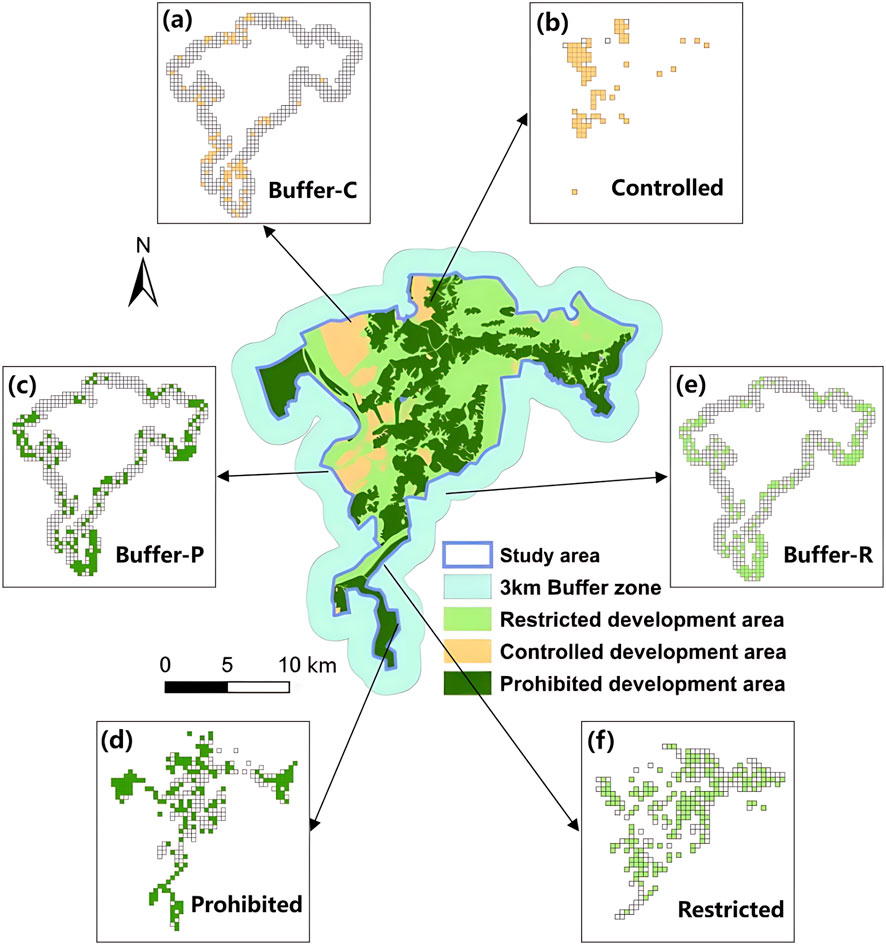
Figure 6. PSM results between the inner and outer zones of the GH. Subplots (a), (c), and (e) represent the buffer zones (Buffer-C, Buffer-P, and Buffer-R) matched through the controlled construction area, prohibited development area, and restricted development area, respectively. Subplots (b), (d), and (f) show the corresponding development area within these zones that have been matched through PSM.
3.4 Conservation outcomes in GH and surrounding buffer zone
Following policy implementation (2013–2020), the βRSEI of the GH buffer zone and subareas exhibited distinct variations (Figures 7d–f). The prohibited development area showed an average βRSEI of 0.0079, significantly exceeding the Buffer-P (0.0054, P < 0.001). The restricted development area displayed an average βRSEI of 0.0082, notably higher than the Buffer-R (0.0049, P < 0.0001). The controlled construction area demonstrated an average βRSEI of 0.0084, compared to the Buffer-C’s 0.0055, indicating a significant difference (P < 0.01). However, before GH policy implementation (1990–2013), no significant differences were observed between the matched buffer zones and GH subareas, including prohibited development, restricted development, and controlled construction areas (Figures 7a–c).
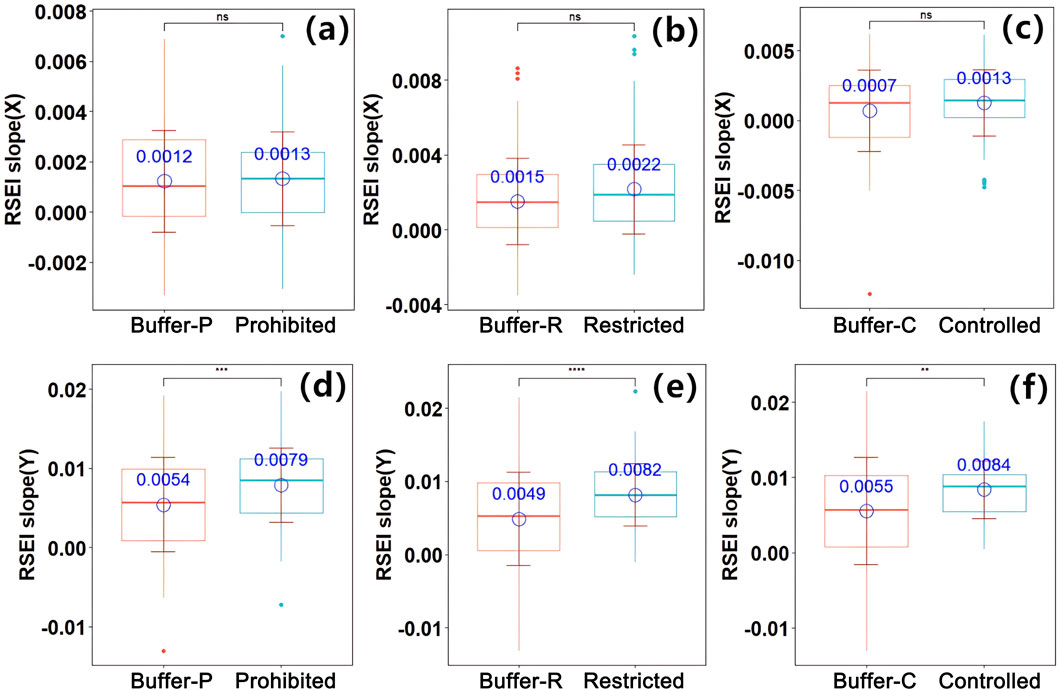
Figure 7. Boxplot of the significance of βRSEI across different time periods within and outside the GH areas. Wilcoxon test for prohibited zones and Buffer-P, 1990–2013 (a); Wilcoxon test for restricted zones and Buffer-R, 1990–2013 (b). Wilcoxon test for controlled zones and Buffer-C, 1990–2013 (c); Wilcoxon test for prohibited zones and Buffer-P, 2013–2020 (d); Wilcoxon test for restricted zones and Buffer-R, 2013–2020 (e); Wilcoxon test for controlled zones and Buffer-C, 2013–2020 (f). (Note: Numerical levels are represented by symbols: (1) ns: 0.05, (2) *: <0.05, (3) **: <0.01, (4) ***: <0.001, (5) ****: <0.0001.).
The average βRSEI values for the matched buffer zones of each GH subarea after policy implementation were significantly higher than those of the corresponding areas before policy implementation (Supplementary Figure S3). The implementation of the GH policy resulted in notable positive conservation outcomes within the 3 km buffer zone.
4 Discussion
4.1 Spatiotemporal dynamics and influences on RSEI growth in the CZT-GH
Before (1990–2013) and after (2013–2020) policy implementation, the RSEI of the CZT-GH within the “Good” (0.6–0.8) and “Excellent” (0.8–1.0) categories demonstrate an upward trend, increasing from 77.15% to 89.69% (Figure 3), and primarily concentrated in the central and north-east regions of GH (Supplementary Figure S2). This aligns with previous research that reported over 60% of the RSEI in the Changsha-Zhu-Xiangtan urban agglomeration ranged between 0.65 and 1 during 1999–2020, indicating an overall improvement in EEQ (Li G. et al., 2023).
The RSEI growth rate of CZT-GH from 2013 to 2020 was 0.0089 years-1, which exceeded the rate of 0.0038 years-1 observed from 1990 to 2013 (Figure 4). This increase can be attributed to the rapid economic development and land expansion in the Changsha-Zhuzhou-Xiangtan urban agglomeration from 2000 to 2010 (Deng et al., 2020). Furthermore, anthropogenic activities such as deforestation and construction adversely impacted EEQ. Li J. et al. (2022) observed that decreased vegetation cover directly correlates with declining regional EEQ in areas experiencing frequent construction and deforestation within CZT-GH from 2008 to 2013. Since 2001, urban expansion has emerged as a significant factor in reducing vegetation cover in the CZT-GH (Shunshi et al., 2019).
The GH and the 3 km buffer zone categorized as “Slight improvement” and “Strong improvement” in the βRSEI demonstrated substantial increases with spatial heterogeneity (Figure 5). The enhancement in GH stems from increased vegetation cover, stricter regulations on environmentally risky projects, and the establishment of environmentally conscious industries (Deng et al., 2020). The improvement in the 3 km buffer zone results from the development of ecological corridors, which enhanced connectivity with the GH, strengthening ecological stability (Qu et al., 2024). This EEQ improvement pattern in CZT-GH aligns with previous research findings (Dieleman and Musterd, 2013). In comparable climate regions, such as Chengdu and the Yangtze River Delta, green spaces have enhanced EEQ through greenway network construction and green development policies, emphasizing connectivity and balanced conservation with sustainable land use (Wang J. et al., 2023; Zhong et al., 2020).
4.2 Impact of GH policy on EEQ
GH policy has demonstrated positive outcomes, facilitating a comprehensive recovery of EEQ in the region from 2013 to 2020 (Figure 5b). The average βRSEI of the GH subareas is significantly higher than that of buffer zone. The average βRSEI values for the prohibited, restricted and controlled area are 0.0079, 0.0082 and 0.0084, while the corresponding average value for the buffer zone are 0.0054 (P < 0.001), 0.0049 (P < 0.0001) and 0.0055 (P < 0.01), respectively (Figure 7). The EEQ of CZT-GH primarily fell within the “Moderate”, “Good”, and “Excellent” categories in 2018, with cropland (26.61%) and forest land (48.03%) as the predominant land use types (Li J. et al., 2022). GH policy, serving as a comprehensive framework for ecological protection and urban management, has implemented measures including increased ecological construction, reduced human disturbances, and regular ecological monitoring to maintain ecosystem stability (Li T. et al., 2023; Liang et al., 2024). In the Netherlands, GH policy significantly improved air quality by approximately 20%, diminished urban heat island intensity, and enhanced regional ecological resilience by 30% from 2000 to 2020 (Dieleman and Musterd, 2013; Roodbol-Mekkes and Van Den Brink, 2015). Stockholm’s “Green Wedges” planning has driven spatial development, increasing the city’s green space by 30% and enhancing biodiversity through expanded green corridors since its inception in 1947 (Grădinaru and Hersperger, 2019). Similarly, the CZT-GH significantly enhances biodiversity by establishing ecological corridors that protect native species and key habitats for wildlife (Qu et al., 2024).
During the past decade, GH policy has established a networked ecological pattern centered on forest green spaces, supported by wetlands and farmlands, and interconnected by rivers, streams, and transport corridors. This network has strengthened ecosystem stability and improved EEQ (Wang et al., 2021). GH policy has also designated prohibited, restricted, and controlled development area to ensure sustainable resource utilization, minimize environmental damage, and increase forest cover (Li C. et al., 2023). The controlled construction area maintains EEQ through the protection of ecological patches and corridors, improving connectivity and enhancing ecosystem service efficiency (Unnithan Kumar et al., 2022; Zhang et al., 2024a). Both the controlled construction area and the 3 km buffer zone feature extensive, uninterrupted development zones, characterized by high urbanization levels, similar land use and vegetation types, and dense populations and road networks, which create comparable covariate conditions across most areas of the controlled construction area. The prohibited and restricted development areas boost EEQ through restored forests and wetlands, establishing multi-level ecological redlines and strictly controlling land use to create a comprehensive ecological barrier (Hunan, 2025).
While the EEQ of GH and its buffer zones has exhibited varying degrees of change following policy implementation (Figure 5b), it remains vulnerable to urbanization impacts. Moving forward, the CZT-GH should enhance policies for subareas. Prohibited development area should prioritize ecological and landscape protection, with strict enforcement of ecological redlines and routine satellite monitoring. Restoration efforts should focus on native vegetation and habitat reconstruction to recover ecosystems, including wetlands and forests (Valente et al., 2021). Moreover, restricted development areas should adopt protection-first and moderate development strategies while promoting advanced primary sectors and supporting green tertiary sectors such as eco-agriculture and rural tourism (Wang et al., 2022). These areas should control land use and integrate ecological restoration to balance development with conservation (Li Q. et al., 2022). Additionally, controlled construction areas must strictly define development boundaries and utilize land efficiently to maintain ecological corridor connectivity. Green infrastructure requires reinforcement, urban expansion needs rational planning, and sprawl-driven ecological degradation should be prevented (Wu et al., 2020).
Balancing economic growth and ecological integrity in the CZT-GH relies on monetizing ecosystem services through provincial horizontal ecological compensation, which has effectively promoted inclusive green development (Li J. et al., 2022). The government directs capital toward high-end primary industries and eco-tourism within restricted and controlled zones, harmonizing local livelihood strategies with conservation objectives (Liu X. et al., 2024). GH requires a remote-sensing and connectivity-informed ecological security pattern to constrain urban expansion, maintain landscape linkages, and minimize patch fragmentation (Tang et al., 2023).
4.3 Positive conservation effectiveness of GH and 3 km buffer zone on EEQ
Between 2013 and 2020, substantial positive conservation effects on EEQ were detected between the matched buffer zones and GH subareas (Figure 7; Supplementary Figure S3). The establishment of a multi-scale ecological corridor network enhances landscape connectivity, protects ecological sources, reduces resistance, and enables species and energy movement. This consequently improves the EEQ of GH and its buffer zone (Ouyang et al., 2024). Additionally, the government limits overdevelopment within GH and implements arable land and forest protection planning, facilitating vegetation growth and restoration (Wu and Wang, 2023). These strategies mitigate urban sprawl’s ecological impact, improving regional EEQ (Li C. et al., 2023; Shao et al., 2024).
Prior studies have established that buffer zones are essential for effective ecosystem protection. The buffer zones at 0–2 km, 2–6 km, and 6–10 km in the Wuyishan PA exhibited significant conservation effects, suggesting a 0–10 km width effectively balances ecosystem preservation and controlled human activity, thereby reducing urban development impacts (Zhang et al., 2023b). Chen et al. (2017) revealed that the 0–10 km buffer zone for the Cangshan nature reserve demonstrated a significant positive spillover effect on forest cover. The 2 km buffer along the Weihe River in Shaanxi effectively minimized ecological risks and maintained ecosystem service values. The targeted zoning approach successfully mitigated ecological risks from land-use changes and protected the ecosystem (Xie et al., 2024).
The GEE platform enabled historical monitoring and analysis of EEQ spatiotemporal dynamics in CZT-GH. The PSM approach assessed EEQ variations before and after GH policy implementation. This study presents a replicable framework for evaluating the conservation effectiveness of protection policies in similar urban areas, using RSEI and PSM. It contributes to assessing policy effectiveness and facilitating further improvements.
4.4 Limitations and future directions
This study primarily focuses on the spatiotemporal dynamics of EEQ in the CZT-GH and its 3 km buffer zone from 1990 to 2020, and evaluates the conservation effectiveness of the GH policy. However, this study is unable to assess the long-term impact of recent urban renewal initiatives (e.g., sponge city projects), as it concluded in 2020. Future research should integrate post-2020 data to explore the synergies or trade-offs between ecological protection and urban development. Additionally, it should also enhance the policy implementation mechanism, establish transferable indicators for cross-scenario comparisons, and combine ecological assessments with economic cost evaluations. Furthermore, ecosystem services (e.g., carbon sequestration, pollination, and flood regulation) in the CZT-GH should be further emphasized in future work to expand the scope of our analysis, while also highlighting the hydrological connectivity between upstream and downstream areas and their impact on EEQ.
5 Conclusion
This study systematically analyzed the spatiotemporal trends of EEQ in the world’s largest urban GH (CZT-GH) and its 3 km buffer zone from 1990 to 2020, based on remote sensing data and employing PSM to minimize bias and evaluate the effectiveness of GH policy before and after its implementation in each zone. The results indicate that the RSEI in the CZT-GH showed an upward trend from 1990 to 2020, with an accelerated growth rate observed after the implementation of the GH policy (2013–2020). Regions with the “Good” and “Excellent” categories of RSEI were mainly located in the central and northeastern areas, while the “Poor” and “Fair” categories of RSEI were mainly located in the controlled construction area and the southeastern part of the buffer zone. The average proportion of areas with improving EEQ increased from 77.15% to 89.69% from 2013 to 2020. The implementation of GH policy enhanced EEQ in GH subareas and in its 3 km buffer zone, demonstrating notable conservation effectiveness. The implementation of GH policy enhanced EEQ in GH subareas and in its 3 km buffer zone, demonstrating notable conservation effectiveness. The βRSEI was categorized as the “Strong improvement” and “Strong improvement” categories which increased from 75.49% to 29.16% during 2013–2020. This research provides a scientific foundation for urban GH planning and promotes sustainable ecological enhancement and optimization of policy decisions.
Data availability statement
The original contributions presented in the study are included in the article/Supplementary Material, further inquiries can be directed to the corresponding author.
Author contributions
CW: Writing – original draft. HL: Writing – original draft. CM: Writing – review and editing. XL: Writing – review and editing. DG: Writing – review and editing.
Funding
The author(s) declare that financial support was received for the research and/or publication of this article. This study was financially supported by the National Natural Science Foundation Regional Innovation and Development Joint fund (U23A2015), National Natural Science Foundation of China (42307109).
Conflict of interest
The authors declare that the research was conducted in the absence of any commercial or financial relationships that could be construed as a potential conflict of interest.
Generative AI statement
The author(s) declare that no Generative AI was used in the creation of this manuscript.
Any alternative text (alt text) provided alongside figures in this article has been generated by Frontiers with the support of artificial intelligence and reasonable efforts have been made to ensure accuracy, including review by the authors wherever possible. If you identify any issues, please contact us.
Publisher’s note
All claims expressed in this article are solely those of the authors and do not necessarily represent those of their affiliated organizations, or those of the publisher, the editors and the reviewers. Any product that may be evaluated in this article, or claim that may be made by its manufacturer, is not guaranteed or endorsed by the publisher.
Supplementary material
The Supplementary Material for this article can be found online at: https://www.frontiersin.org/articles/10.3389/fenvs.2025.1626195/full#supplementary-material
References
Bauer, D. F. (1972). Constructing confidence sets using rank statistics. J. Am. Stat. Assoc. 67, 687–690. doi:10.1080/01621459.1972.10481279
Cai, Z., Zhang, Z., Zhao, F., Guo, X., Zhao, J., Xu, Y., et al. (2023). Assessment of eco-environmental quality changes and spatial heterogeneity in the Yellow River Delta based on the remote sensing ecological index and geo-detector model. Ecol. Inf. 77, 102203. doi:10.1016/j.ecoinf.2023.102203
Campos, J. C., Garcia, N., Alírio, J., Arenas-Castro, S., Teodoro, A. C., and Sillero, N. (2023). Ecological niche models using MaxEnt in Google Earth engine: evaluation, guidelines and recommendations. Ecol. Inf. 76, 102147. doi:10.1016/j.ecoinf.2023.102147
Cao, Y., Zhou, Z., Liao, Q., Shen, S., Wang, W., Xiao, P., et al. (2023). Effects of landscape conservation on the ecohydrological and water quality functions and services and their driving factors. Sci. Total Environ. 861, 160695. doi:10.1016/j.scitotenv.2022.160695
Chen, B., Liu, F., Zhang, Y., Du, J., Wang, W., and Li, J. (2017). Assessment of forest conservation in the Cangshan Nature Reserve based on propensity score matching. Biodivers. Sci. 25, 999–1007. doi:10.17520/biods.2017086
Chen, X., Wen, S., Yang, L., He, G., Zhou, Q., and Xia, Y. (2020). A study on soil and water loss in ecological green heart area of changsha-zhuzhou-xiangtan urban agglomeration based on USLE model. J. Soil Water Conserv. 40, 118–124. doi:10.13961/j.cnki.stbctb.20200628.001
Chen, Z., Chen, J., Zhou, C., and Li, Y. (2022). An ecological assessment process based on integrated remote sensing model: a case from Kaikukang-Walagan District, Greater Khingan Range, China. Ecol. Inf. 70, 101699. doi:10.1016/j.ecoinf.2022.101699
Chen, N., Cheng, G., Yang, J., Ding, H., and He, S. (2023). Evaluation of urban ecological environment quality based on improved RSEI and driving factors analysis. Sustainability. 15, 8464. doi:10.3390/su15118464
Chen, S., Zhang, Q., Chen, Y., Zhou, H., Xiang, Y., Liu, Z., et al. (2023). Vegetation change and eco-environmental quality evaluation in the Loess Plateau of China from 2000 to 2020. Remote Sens. 15, 424. doi:10.3390/rs15020424
Chiu, M., Rezai, M.-R., Maclagan, L. C., Austin, P. C., Shah, B. R., Redelmeier, D. A., et al. (2016). Moving to a highly walkable neighborhood and incidence of hypertension: a propensity-score matched cohort study. Environ. Health Perspect. 124, 754–760. doi:10.1289/ehp.1510425
Deng, B., Affolderbach, J., and Deutz, P. (2020). Industrial restructuring through eco-transformation: green industrial transfer in changsha–zhuzhou–xiangtan, hunan Province. Sustainability 12, 6945. doi:10.3390/su12176945
Dieleman, F. M., and Musterd, S. (2013). The Randstad: a research and policy laboratory. Dordrecht: Kluwer: Springer Science and Business Media.
Dronova, I. (2017). Environmental heterogeneity as a bridge between ecosystem service and visual quality objectives in management, planning and design. Landsc. Urban Plan. 163, 90–106. doi:10.1016/j.landurbplan.2017.03.005
Du, Y., Zhang, Y., Ling, F., Wang, Q., Li, W., and Li, X. (2016). Water bodies’ mapping from Sentinel-2 imagery with modified normalized difference water index at 10-m spatial resolution produced by sharpening the SWIR band. Remote Sens. 8, 354. doi:10.3390/rs8040354
Eskelson, B. N., Temesgen, H., Lemay, V., Barrett, T. M., Crookston, N. L., and Hudak, A. T. (2009). The roles of nearest neighbor methods in imputing missing data in forest inventory and monitoring databases. Scand. J. For. Res. 24, 235–246. doi:10.1080/02827580902870490
Field, R. D., and Parrott, L. (2022). Mapping the functional connectivity of ecosystem services supply across a regional landscape. Elife 11, e69395. doi:10.7554/eLife.69395
Fu, M., Zheng, Y., Qian, C., He, Q., He, Y., Wei, C., et al. (2024). Spatiotemporal evolution and driving mechanism of Dongting Lake based on 2005–2020 multi-source remote sensing data. Ecol. Inf. 83, 102822. doi:10.1016/j.ecoinf.2024.102822
Ghahramani, M., Galle, N. J., Ratti, C., and Pilla, F. (2021). Tales of a city: sentiment analysis of urban green space in Dublin. Cities. 119, 103395. doi:10.1016/j.cities.2021.103395
Giannico, V., Spano, G., Elia, M., D’Este, M., Sanesi, G., and Lafortezza, R. (2021). Green spaces, quality of life, and citizen perception in European cities. Environ. Res. 196, 110922. doi:10.1016/j.envres.2021.110922
Grădinaru, S. R., and Hersperger, A. M. (2019). Green infrastructure in strategic spatial plans: evidence from European urban regions. Urban For. Urban Green. 40, 17–28. doi:10.1016/j.ufug.2018.04.018
He, Y., Qin, Z., He, Y., and Li, X. (2024). The impact of the chang-zhu-tan green heart protection policy on the spatiotemporal evolution of regional NDVI. Agric. Technol. 44, 113–117. doi:10.19754/j.nyyjs.20241230025
Huang, E., Zhu, G., Wang, Y., Li, R., Miao, Y., Qi, X., et al. (2025). Long-term snow cover change in the qilian mountains (1986–2024): a high-resolution landsat-based analysis. Remote Sens. 17, 2497. doi:10.3390/rs17142497
Hunan Department of natural resources of hunan Province. (2025). Available online at: http://zrzyt.hunan.gov.cn/zrzyt/xxgk/ghjh/202504/t20250408_33633740.html(Accessed April 8, 2025).
Islam, A., Pattnaik, N., Moula, M. M., Rötzer, T., Pauleit, S., and Rahman, M. A. (2024). Impact of urban green spaces on air quality: a study of PM10 reduction across diverse climates. Sci. Total Environ. 955, 176770. doi:10.1016/j.scitotenv.2024.176770
Jiang, Y., Gao, J., Yang, L., Wu, S., and Dai, E. (2021). The interactive effects of elevation, precipitation and lithology on karst rainfall and runoff erosivity. Catena. 207, 105588. doi:10.1016/j.catena.2021.105588
Jiang, B., Chen, W., Zou, Y., Wu, C., Wu, Z., Kang, X., et al. (2024). Post-fire vegetation dynamic patterns and drivers in Greater Hinggan Mountains: insights from long-term remote sensing data analysis. Ecol. Inf. 83, 102850. doi:10.1016/j.ecoinf.2024.102850
Jiang, M., Tian, Y., Sun, Y., Guo, X., Zhao, X., Yin, L., et al. (2024). Assessment of the conservation effectiveness of nature reserves on the Qinghai-Tibet plateau using human activity and habitat quality indicators. Ecol. Inf. 84, 102872. doi:10.1016/j.ecoinf.2024.102872
Jiao, W., Wang, L., Smith, W. K., Chang, Q., Wang, H., and D’Odorico, P. (2021). Observed increasing water constraint on vegetation growth over the last three decades. Nat. Commun. 12, 3777. doi:10.1038/s41467-021-24016-9
Jin, Y., Li, Y., Zhang, H., Liu, X., and Shi, H. (2024). Evaluation of effectiveness and multi-scenario analysis of land use development strategies and ecological protection redlines on carbon storage in the great bay area of China using the PLUS-InVEST-PSM model. Land 13, 1918. doi:10.3390/land13111918
Joppa, L., and Pfaff, A. (2010). Reassessing the forest impacts of protection: the challenge of nonrandom location and a corrective method. Ann. N. Y. Acad. Sci. 1185, 135–149. doi:10.1111/j.1749-6632.2009.05162.x
Kühn, M. (2003). Greenbelt and Green Heart: separating and integrating landscapes in European city regions. Landsc. Urban Plan. 64, 19–27. doi:10.1016/S0169-2046(02)00198-6
Li, B., Li, Y., Chen, Y., Zhang, B., and Shi, X. (2020). Recent fall Eurasian cooling linked to North Pacific sea surface temperatures and a strengthening Siberian high. Nat. Commun. 11, 5202. doi:10.1038/s41467-020-19014-2
Li, J., Liao, Q., Shen, S., Liu, X., and Liao, J. (2022). Study on the spatiotemporal changes of land use and ecosystem services value (ESV) of the Green Heart Area in the Changsha-Zhuzhou-Xiangtan (CZT) city group. Chin. Landsc. Archit. 38, 100–105. doi:10.19775/j.cla.2022.01.0100
Li, Q., Zhou, Y., and Yi, S. (2022). An integrated approach to constructing ecological security patterns and identifying ecological restoration and protection areas: a case study of Jingmen, China. Ecol. Indic. 137, 108723. doi:10.1016/j.ecolind.2022.108723
Li, C., Zhang, R., Li, T., Guo, H., and Guo, R. (2023). Dynamic changes and influencing factors of vegetation in the “Green Heart” zone of the Chang-Zhu-Tan urban agglomeration during the past 21 years. Int. J. Environ. Res. Public Health. 20, 4517. doi:10.3390/ijerph20054517
Li, G., Wang, H., Cao, Y., Zhang, X., and Ning, X. (2023). Spatio-temporal evolution and influencing factors of ecological environment quality in the Changsha-Zhuzhou-Xiangtan urban agglomeration. Remote Sens. Nat. Resour. 35, 244–254. doi:10.6046/zrzyyg.2022371
Li, T., Chen, C., Li, Q., Liu, L., Wang, Z., Hu, X., et al. (2023). Evolution characteristics of landscape patterns and the response of surface runoff in a rapid urbanization area: focus on the Chang–Zhu–Tan metropolitan area of China. Water 15, 3467. doi:10.3390/w15193467
Li, Y., Tian, H., Zhang, J., Lu, S., Xie, Z., Shen, W., et al. (2023). Detection of spatiotemporal changes in ecological quality in the Chinese mainland: trends and attributes. Sci. Total Environ. 884, 163791. doi:10.1016/j.scitotenv.2023.163791
Li, K., Yan, X., Hou, Y., Lv, B., Huang, Y., Liu, J., et al. (2024). Can ecological zoning act as an environmental management tool for protecting regional habitat quality: causal evidence from the national key ecological function zone in China. J. Clean. Prod. 475, 143623. doi:10.1016/j.jclepro.2024.143623
Li, X., Zhang, N., Zhang, A., Tang, J., Li, Z., and Nie, Z. (2024). Changes in grassland vegetation based on spatiotemporal variation in vegetation growth and spatial configuration dynamics of bare lands. Ecol. Inf. 80, 102473. doi:10.1016/j.ecoinf.2024.102473
Li, H., Chen, J., Ling, M., Chen, Z., Lan, Y., Huang, Q., et al. (2025). A framework for dynamic assessment of soil erosion and detection of driving factors in alpine grassland ecosystems using the RUSLE-InVEST (SDR) model and Geodetector: a case study of the source region of the Yellow River. Ecol. Inf. 85, 102928. doi:10.1016/j.ecoinf.2024.102928
Liang, S., Yang, F., Zhang, J., Xiong, S., and Xu, Z. (2024). Assessment and management zoning of ecosystem service trade-off/synergy based on the social–ecological balance: a case of the Chang-Zhu-Tan metropolitan area. Land 13, 127. doi:10.3390/land13020127
Liu, Y., Lin, Y., Wang, F., Xu, N., and Zhou, J. (2023). Post-earthquake recovery and its driving forces of ecological environment quality using remote sensing and GIScience, a case study of 2015 Ms8.1 Nepal earthquake. Geomatics Nat. Hazards Risk. 14, 2279496. doi:10.1080/19475705.2023.2279496
Liu, X., Luo, Z., and Xiao, H. (2024). Spatio-temporal variation of monthly vegetation NPP and its responses to climate and terrain factors in Chang-Zhu-Tan Green Heart Area. Environ. Sci-ger., 1–12. doi:10.13227/j.hjkx.202312025
Liu, Y., Lin, Y., Liu, W., Zhou, J., and Wang, J. (2024a). Remote sensing perspective in exploring the spatiotemporal variation characteristics and post-disaster recovery of ecological environment quality, a case study of the 2010 Ms7.1 Yushu earthquake. Geomatics Nat. Hazards Risk. 15, 2314578. doi:10.1080/19475705.2024.2314578
Liu, Y., Xiang, W., Hu, P., Gao, P., and Zhang, A. (2024b). Evaluation of ecological environment quality using an improved remote sensing ecological index model. Remote Sens. 16, 3485. doi:10.3390/rs16183485
Lu, F., Zhang, C., Cao, H., Wang, X., Zheng, T., and Huang, Z. (2025). Assessment of ecological environment quality and their drivers in urban agglomeration based on a novel remote sensing ecological index. Ecol. Indic. 170, 113104. doi:10.1016/j.ecolind.2025.113104
Lunt, M. (2014). Selecting an appropriate caliper can be essential for achieving good balance with propensity score matching. Am. J. Epidemiol. 179, 226–235. doi:10.1093/aje/kwt212
Lv, W., Yang, L., Xu, Z., and Zhang, Q. (2025). Spatiotemporal evolution of farmland ecosystem stability in the Fenhe River Basin China based on perturbation-resistance-response framework. Ecol. Inf. 86, 102977. doi:10.1016/j.ecoinf.2024.102977
Mancino, G., Ferrara, A., Padula, A., and Nolè, A. (2020). Cross-comparison between Landsat 8 (OLI) and Landsat 7 (ETM+) derived vegetation indices in a Mediterranean environment. Remote Sens. 12, 291. doi:10.3390/rs12020291
McKeever, E., Dymond, S., Keppeler, E., and Wagenbrenner, J. (2024). Basal area and hillslope position impacts to hydraulic redistribution in a coast redwood forest. Sci. Total Environ. 957, 177506. doi:10.1016/j.scitotenv.2024.177506
Ouyang, Q., Zheng, B., Luo, X., and Wu, S. (2024). Construction of ecological security pattern of urban agglomeration based on multi-scale ecological corridor networks. Ecosyst. Health Sustain. 10, 0253. doi:10.34133/ehs.0253
Pariha, H., Zan, M., and Alimjia, K. (2021). Remoting sensing evaluation of ecological environment in Urumqi City and analysis of driving factors. Arid. Zone Res. 38, 1484–1496. doi:10.13866/j.azr.2021.05.31
Qu, Y., Zeng, X., Luo, C., Zhang, H., Liu, Y., and Wang, J. (2024). Constructing wetland ecological corridor system based on hydrological connectivity with the goal of improving regional biodiversity. J. Environ. Manage. 368, 122074. doi:10.1016/j.jenvman.2024.122074
Randolph, J. J., Falbe, K., Manuel, A. K., and Balloun, J. L. (2014). A step-by-step guide to propensity score matching in R. Pract. Assess. Res. Eval. 19, 18. doi:10.7275/N3PV-TX27
Roodbol-Mekkes, P. H., and Van Den Brink, A. (2015). Rescaling spatial planning: spatial planning reforms in Denmark, England, and The Netherlands. Environ. Plann. C 33, 184–198. doi:10.1068/c12134
Rosenbaum, P. R. (1989). Optimal matching for observational studies. J. Am. Stat. Assoc. 84, 1024–1032. doi:10.1080/01621459.1989.10478868
Shao, Y., Liu, Y., Wang, X., and Li, S. (2024). Exploring the evolution of ecosystem health and sustainable zoning: a perspective based on the contributions of climate change and human activities. Sci. Total Environ. 951, 175674. doi:10.1016/j.scitotenv.2024.175674
Sharifi, F., Nygaard, A., and Stone, W. M. (2021). Heterogeneity in the subjective well-being impact of access to urban green space. Sustain. Cities Soc. 74, 103244. doi:10.1016/j.scs.2021.103244
Shen, X., Sun, J., Ma, Q., Zhang, Y., Zhong, J., Yue, Y., et al. (2022). Long-term trend of new particle formation events in the Yangtze River Delta, China and its influencing factors: 7-year dataset analysis. Sci. Total Environ. 807, 150783. doi:10.1016/j.scitotenv.2021.150783
Shen, Y., Liu, G., Zhou, W., Liu, Y., Cheng, H., and Su, X. (2022). Protected areas have remarkable spillover effects on forest conservation on the Qinghai-Tibet Plateau. Divers. Distrib. 28, 2944–2955. doi:10.1111/ddi.13466
Shi, S., Peng, S., Lin, Z., Zhu, Z., Ma, D., Yin, Y., et al. (2024). Analysis of ecological environment quality heterogeneity across different landform types in Myanmar and its driving forces. Ecol. Indic. 168, 112755. doi:10.1016/j.ecolind.2024.112755
Shunshi, H., Yulong, P., Jianxin, Q., and Zifang, T. (2019). Research on the vegetation index dynamic changes and the impact of urban expansion on it for changsha-zhuzhou-xiangtan urban agglomeration. Econ. Geogr. 39, 178–186. doi:10.15957/j.cnki.jjdl.2019.12.020
Tang, W., Liu, S., Feng, S., Xiao, F., and Ogbodo, U. S. (2023). Evolution and improvement options of ecological environmental quality in the world's largest emerging urban green heart as revealed by a new assessment framework. Sci. Total Environ. 858, 159715. doi:10.1016/j.scitotenv.2022.159715
Tong, D., Sun, Y., Tang, J., Luo, Z., Lu, J., and Liu, X. (2023). Modeling the interaction of internal and external systems of rural settlements: the case of Guangdong, China. Land Use Policy. 132, 106830. doi:10.1016/j.landusepol.2023.106830
Unnithan Kumar, S., Turnbull, J., Hartman Davies, O., Hodgetts, T., and Cushman, S. A. (2022). Moving beyond landscape resistance: considerations for the future of connectivity modelling and conservation science. Landsc. Ecol. 37, 2465–2480. doi:10.1007/s10980-022-01504-x
Valente, R. A., de Mello, K., Metedieri, J. F., and Américo, C. (2021). A multicriteria evaluation approach to set forest restoration priorities based on water ecosystem services. J. Environ. Manage. 285, 112049. doi:10.1016/j.jenvman.2021.112049
Wachmann, A., Starko, S., Neufeld, C. J., and Costa, M. (2024). Validating Landsat analysis ready data for nearshore sea surface temperature monitoring in the Northeast Pacific. Remote Sens. 16, 920. doi:10.3390/rs16050920
Wan, L., Bento, V. A., Qu, Y., Qiu, J., Song, H., Zhang, R., et al. (2023). Drought characteristics and dominant factors across China: insights from high-resolution daily SPEI dataset between 1979 and 2018. Sci. Total Environ. 901, 166362. doi:10.1016/j.scitotenv.2023.166362
Wang, L., Ye, W., and Chen, L. (2021). Research on green innovation of the Great Changsha-Zhuzhou-Xiangtan city group based on network. Land 10, 1198. doi:10.3390/land10111198
Wang, W., Li, K., Liu, Y., Lian, J., and Hong, S. (2022). A system dynamics model analysis for policy impacts on green agriculture development: a case of the Sichuan Tibetan Area. J. Clean. Prod. 371, 133562. doi:10.1016/j.jclepro.2022.133562
Wang, C., Hou, P., Liu, X., Yuan, J., Zhou, Q., and Lv, N. (2023). Spatiotemporal changes in vegetation cover of the national key ecosystem protection and restoration project areas, China. Acta Ecol. Sin. 43, 8903–8916. doi:10.20103/j.stxb.202303100453
Wang, G., Peng, W., Zhang, L., and Zhang, J. (2023). Quantifying the impacts of natural and human factors on changes in NPP using an optimal parameters-based geographical detector. Ecol. Indic. 155, 111018. doi:10.1016/j.ecolind.2023.111018
Wang, J., Zhang, Y., Zhang, X., Song, M., and Ye, J. (2023). The spatio-temporal trends of urban green space and its interactions with urban growth: evidence from the Yangtze River Delta region, China. Land Use Policy. 128, 106598. doi:10.1016/j.landusepol.2023.106598
Wu, F., and Wang, Z. (2023). Assessing the impact of urban land expansion on ecosystem carbon storage: a case study of the Changzhutan metropolitan area, China. Ecol. Indic. 154, 110688. doi:10.1016/j.ecolind.2023.110688
Wu, X., Zhang, J., Geng, X., Wang, T., Wang, K., and Liu, S. (2020). Increasing green infrastructure-based ecological resilience in urban systems: a perspective from locating ecological and disturbance sources in a resource-based city. Sustain. Cities Soc. 61, 102354. doi:10.1016/j.scs.2020.102354
Wu, J., Xu, N., Wang, Y., Zhang, W., Borthwick, A. G. L., and Ni, J. (2021). Global syndromes induced by changes in solutes of the world’s large rivers. Nat. Commun. 12, 5940. doi:10.1038/s41467-021-26231-w
Wu, R. M., Zhang, Z., Yan, W., Fan, J., Gou, J., Liu, B., et al. (2022). A comparative analysis of the principal component analysis and entropy weight methods to establish the indexing measurement. PloS one. 17, e0262261. doi:10.1371/journal.pone.0262261
Xie, Y., Zhu, Q., Bai, H., He, H., and Zhang, Y. (2024). Combining ecosystem service value and landscape ecological risk to subdivide the riparian buffer zone of the Weihe River in Shaanxi. Ecol. Indic. 166, 112424. doi:10.1016/j.ecolind.2024.112424
Xu, Z., and Zhao, S. (2023). Scale dependence of urban green space cooling efficiency: a case study in Beijing metropolitan area. Sci. Total Environ. 898, 165563. doi:10.1016/j.scitotenv.2023.165563
Xu, H., Wang, Y., Guan, H., Shi, T., and Hu, X. (2019). Detecting ecological changes with a remote sensing based ecological index (RSEI) produced time series and change vector analysis. Remote Sens. 11, 2345. doi:10.3390/rs11202345
Xu, A., Song, M., Wu, Y., Luo, Y., Zhu, Y., and Qiu, K. (2024). Effects of new urbanization on China's carbon emissions: a quasi-natural experiment based on the improved PSM-DID model. Technol. Forecast. Soc. 200, 123164. doi:10.1016/j.techfore.2023.123164
Xu, W., Xu, S., Shi, R., Chen, Z., Lin, Y., and Chen, J. (2024). Exploring the impact of university green spaces on Students' perceived restoration and emotional states through audio-visual perception. Ecol. Inf. 82, 102766. doi:10.1016/j.ecoinf.2024.102766
Xue, B., Han, B., Li, H., Gou, X., Yang, H., Thomas, H., et al. (2023). Understanding ecological civilization in China: from political context to science. Ambio 52, 1895–1909. doi:10.1007/s13280-023-01897-2
Yan, Y., Piao, S., Hammond, W. M., Chen, A., Hong, S., Xu, H., et al. (2024). Climate-induced tree-mortality pulses are obscured by broad-scale and long-term greening. Nat. Ecol. Evol. 8, 912–923. doi:10.1038/s41559-024-02372-1
Yang, Y., and Li, H. (2023). Spatiotemporal dynamic decoupling states of eco-environmental quality and land-use carbon emissions: a case study of Qingdao City, China. Ecol. Inf. 75, 101992. doi:10.1016/j.ecoinf.2023.101992
Yang, X., Meng, F., Fu, P., Zhang, J., and Liu, Y. (2022). Instability of remote sensing ecological index and its optimisation for time frequency and scale. Ecol. Inf. 72, 101870. doi:10.1016/j.ecoinf.2022.101870
Yang, H., Xu, W., Yu, J., Xie, X., Xie, Z., Lei, X., et al. (2023). Exploring the impact of changing landscape patterns on ecological quality in different cities: a comparative study among three megacities in eastern and western China. Ecol. Inf. 77, 102255. doi:10.1016/j.ecoinf.2023.102255
Ye, M., Liao, L., Fu, T., and Lan, S. (2024). Do establishment of protected areas and implementation of regional policies both promote the forest NPP? Evidence from Wuyi Mountain in China based on PSM-DID. Glob. Ecol. Conserv. 55, e03210. doi:10.1016/j.gecco.2024.e03210
Yuan, B., Fu, L., Zou, Y., Zhang, S., Chen, X., Li, F., et al. (2021). Spatiotemporal change detection of ecological quality and the associated affecting factors in Dongting Lake Basin, based on RSEI. J. Clean. Prod. 302, 126995. doi:10.1016/j.jclepro.2021.126995
Yue, H., He, C., Huang, Q., Yin, D., and Bryan, B. A. (2020). Stronger policy required to substantially reduce deaths from PM2.5 pollution in China. Nat. Commun. 11, 1462. doi:10.1038/s41467-020-15319-4
Zhang, H., Li, X., Shi, H., and Liu, X. (2021). An assessment of the effectiveness of China's nature reserves for mitigating anthropogenic pressures based on propensity score matching. Acta Geogr. Sin. 76, 680–693. doi:10.11821/dlxb202103013
Zhang, Y., She, J., Long, X., and Zhang, M. (2022). Spatio-temporal evolution and driving factors of eco-environmental quality based on RSEI in Chang-Zhu-Tan metropolitan circle, central China. Ecol. Indic. 144, 109436. doi:10.1016/j.ecolind.2022.109436
Zhang, Z., Tang, Y., Pan, H., Yao, C., and Zhang, T. (2022). Assessment of the ecological protection effectiveness of protected areas using propensity score matching: a case study in sichuan, China. Int. F. Environ. Res. Public Health. 19, 4920. doi:10.3390/ijerph19084920
Zhang, L., Fang, C., Zhao, R., Zhu, C., and Guan, J. (2023). Spatial–temporal evolution and driving force analysis of eco-quality in urban agglomerations in China. Sci. Total Environ. 866, 161465. doi:10.1016/j.scitotenv.2023.161465
Zhang, X., Jia, W., and He, J. (2023a). Spatial and temporal variation of ecological quality in northeastern China and analysis of influencing factors. J. Clean. Prod. 423, 138650. doi:10.1016/j.jclepro.2023.138650
Zhang, X., Liao, L., Huang, Y., Fang, Q., Lan, S., and Chi, M. (2023b). Conservation outcome assessment of Wuyishan protected areas based on InVEST and propensity score matching. Glob. Ecol. Conserv. 45, e02516. doi:10.1016/j.gecco.2023.e02516
Zhang, X., Fan, H., Hou, H., Xu, C., Sun, L., Li, Q., et al. (2024a). Spatiotemporal evolution and multi-scale coupling effects of land-use carbon emissions and ecological environmental quality. Sci. Total Environ. 922, 171149. doi:10.1016/j.scitotenv.2024.171149
Zhang, X., Jia, W., Lu, S., and He, J. (2024b). Ecological assessment and driver analysis of high vegetation cover areas based on new remote sensing index. Ecol. Inf. 82, 102786. doi:10.1016/j.ecoinf.2024.102786
Zheng, Z., Wu, Z., Chen, Y., Guo, C., and Marinello, F. (2022). Instability of remote sensing based ecological index (RSEI) and its improvement for time series analysis. Sci. Total Environ. 814, 152595. doi:10.1016/j.scitotenv.2021.152595
Zhong, J., Li, Z., Sun, Z., Tian, Y., and Yang, F. (2020). The spatial equilibrium analysis of urban green space and human activity in Chengdu, China. J. Clean. Prod. 259, 120754. doi:10.1016/j.jclepro.2020.120754
Zhou, S., Wu, S., Gao, J., Liu, L., Li, D., Yan, R., et al. (2024). Increased stress from compound drought and heat events on vegetation. Sci. Total Environ. 949, 175113. doi:10.1016/j.scitotenv.2024.175113
Keywords: ecological environment quality, google earth engine, remote sening ecological index, propensity score matching, urban green heart
Citation: Wu C, Liu H, Meng C, Li X and Gan D (2025) Assessing ecological environmental quality and conservation effectiveness in the World’s largest urban green heart using the remote sensing ecological index (RSEI) and propensity score matching (PSM). Front. Environ. Sci. 13:1626195. doi: 10.3389/fenvs.2025.1626195
Received: 10 May 2025; Accepted: 08 August 2025;
Published: 28 August 2025.
Edited by:
Sawaid Abbas, University of the Punjab, PakistanReviewed by:
Jie Wang, Anhui University, ChinaYaohui Liu, Shandong Jianzhu University, China
Eskinder Gidey, University of the Witwatersrand, South Africa
Mei Zan, Xinjiang Normal University, China
Copyright © 2025 Wu, Liu, Meng, Li and Gan. This is an open-access article distributed under the terms of the Creative Commons Attribution License (CC BY). The use, distribution or reproduction in other forums is permitted, provided the original author(s) and the copyright owner(s) are credited and that the original publication in this journal is cited, in accordance with accepted academic practice. No use, distribution or reproduction is permitted which does not comply with these terms.
*Correspondence: Huanyao Liu, aHlsaXVAaHVuYXUuZWR1LmNu