1 Introduction
The 2024 government work report proposed to “promote comprehensive ecological and environmental governance,” “energetically foster a green and low-carbon economy,” “actively and prudently push forward carbon peaking and carbon neutrality,” “accelerate the green transformation of development models,” and “pursue green and low-carbon development.”1 In 2022, nine departments, including the Ministry of Science and Technology, jointly released the Implementation Plan for Peaking Carbon Neutrality by Science and Technology (2022–2030)2 and put forward a range of action plans from fundamental research, technology research and development (R&D), application demonstration, result popularization, talent cultivation, international collaborations, and other areas to expedite the advancement of green and low-carbon technology innovation. Against this backdrop, the fundamental way to achieve “carbon neutrality” lies in accelerating the setup of a carbon-neutral technology innovation () system that includes the development and deployment of climate change mitigation technologies like carbon capture, carbon storage, energy generation, and transportation, promoting carbon emission reduction and offsetting, while overcoming obstacles to low-carbon innovation.
The digital economy () functions as a pivotal driver for the economic growth of nations worldwide (Lu et al., 2025). Its characteristics of penetration, substitution, and synergy (Han D. et al., 2025) not only provide the material and technological foundation for technology innovation but also offer a new digital foundation for environmental governance, becoming an important driving force for enabling . During the historical convergence period of the and the “carbon neutrality” strategy, facing the complex environment where “energy constraints” are shifting to “carbon emission reduction constraints” filled with uncertainties such as the over-emphasis on heavy industries in economic structure, it carries substantial theoretical meaning and practical worth to thoroughly examine the changes in in the digital revolution and explore how to effectively unlock the propelling force of the for .
Academic studies on the have primarily focused on conceptual definitions (Bowman, 1996; Tapscott, 1996; Lane, 1999), measurement methods, and their impact effects. Studies on measuring the can generally be classified into two perspectives. One is from a quantitative perspective, where the scale value of the is calculated (Xie and Zhang, 2024). The other is from a qualitative perspective, where an all-encompassing evaluation index framework for the is constructed that is derived from the conceptual connotation of the (Shi et al., 2023; Yuan, 2025; Lv et al., 2025). Some scholars have constructed an assessment index system for the from dimensions such as the Internet adoption rates, the count of Internet professionals, Internet-associated outputs, and mobile Internet user numbers (Shi et al., 2023; Yuan, 2025). Others have built an index system based on four areas: digital infrastructure, digital innovation capabilities, digital industry growth, and digital financial elements (Lv et al., 2025). Because the represents an economic system based on digital technology, its connotation can be divided into digital industrialization () and industrial digitalization (). Some scholars have also measured it through the lenses of and (Xue et al., 2022).
The system is extremely complex. Given the substantial disparities in the global development process of the , the academic community lacks a uniform or universal standard for its assessment. The perspectives and dimensions of research results also vary. However, developing an assessment index system has emerged as the predominant methodology employed within academic and governmental spheres for evaluating the development of the (Shi et al., 2023). Regarding impact effects, existing studies indicate that the holds a vital position in optimizing the industrial structure (Tan et al., 2024), boosting energy efficiency (Wang and Shao, 2023), and driving the green transition of industries (Yang et al., 2024). Notably, the specific mechanism by which the influences has not yet been revealed. However, the relevant literature on how the affects green technology innovation provides a theoretical foundation for this study. The research reveals that the intrinsic nature of the , along with its high innovation capacity, powerful penetration, extensive scope, as well as its development trends and patterns, can directly influence green technology innovation, and also promote the improvement of green technology innovation levels in adjacent regions (Wang et al., 2022; Song et al., 2024). Some research has also examined the pathways through which digital elements such as big data, the Internet, and information technology contribute to green technology innovation and innovation development (Jin et al., 2021), as well as the heterogeneous impacts resulting from differences in regional scale and resource endowment (Song et al., 2019; Ghasemaghaei and Calic, 2020).
By summarizing and analyzing previous literature, it becomes apparent that the existing research on how the affects remains in its infancy, and there are still some shortcomings: (1) Studies exploring how the affects remain relatively scarce, and such studies lack rigorous empirical proof to support them. (2) Most current studies focus on the impact of the but often overlook the influences generated by the two major subsystems within the , namely, the and the . The impact effects of these two internal subsystems of the still need to be further explored.
Considering this, this article chooses panel datasets from 264 Chinese prefecture-level cities spanning the years 2011 to 2022 as its research sample. Grounded in the connotation scope of the , an assessment index system for its development is constructed from two perspectives: and . The projection pursuit method optimized by the accelerated genetic algorithm (RAGA-PP) is adopted to measure it. The article seeks to examine how the and its two major subsystems affect by exploring the four “mirrors” that reveal the essence of things. First, from the perspective of a “flat mirror,” the fixed-effect model is applied to describe the effect of directly affecting and explore the regional heterogeneity of on . Second, from the perspective of a “magnifying glass,” the is divided into two internal systems, , and , and the difference between the two on is explored. The indirect influence of on is explored based on the mediating effect model from the “microscope” standpoint. Using the dynamic threshold model, the nonlinear influence of on is discussed respectively under the constraints of and . Finally, adopting a “telescope” perspective, the spatial Durbin model is employed to further probe the spatial impacts of on in geographical proximity, with the aim of providing a certain theoretical basis and experience reference for China’s and regional green development.
In comparison to earlier studies, the possible marginal contributions of this article are listed below: (1) With the as the entry point, this study employs fixed-effect models, mediating effect models, dynamic threshold models, and spatial econometric models to explore its impact on . It provides certain theoretical support and empirical proof for investigations in related fields. (2) Rooted in the connotation and scope of the , this article further divides it into and , and explores the impact effects of the two major subsystems within the , thereby enriching the existing studies.
After the introduction, the article is structured as detailed below: The second section elaborates on this article’s mechanism analysis and research hypothesis. The third section describes the model’s creation, measurement of related variables, and the data sources. The fourth section analyzes the benchmark regression results of this article. The fifth section further analyzes this study’s empirical findings. Finally, we draw the main conclusions and recommendations.
2 Mechanism analysis and research hypothesis
2.1 Analysis and research hypothesis on the impact of on
The , with its characteristics of high penetration, speed, and increasing marginal effect, is prompting significant transformations in production, lifestyles, and governance and playing an essential part in reducing urban carbon emissions (Wang L. et al., 2024; Wang Y. et al., 2024). Achieving the carbon peaking and carbon neutrality strategy requires green technology innovation, and low-carbon technology and innovations in green technology are critical to enterprise conservation of energy and emission reduction. Reducing coal use, increasing energy efficiency, and creating energy from renewable sources are three pivotal issues in reaching the carbon peak by 2030. All of these demand backing from technological “underpinning,” particularly the advancement of carbon-neutral and green technology innovations.
The continuous integration of the with green technology innovation in businesses, universities, and academic institutes can markedly spur urban green technology innovation and promote . The promotes in the following three areas: First, regarding human capital, the has spawned numerous emerging industries rooted in digital technology, including big data and blockchain, thereby drawing in a flow of high-caliber talents. Digital technology’s broad-based adoption and application will boost the requirement for highly skilled and well-educated workers (Han J. et al., 2025), hence continually enhancing the structure of human capital. The refinement of the human capital structure lays a robust groundwork of innovative elements for the growth of urban , and contributes to elevating the standard of urban carbon-neutral and green technology innovation (Ling et al., 2024). Second, regarding financing constraints, financing restrictions and funding availability exert a significant influence on enterprise innovation and green technology innovation (Hall et al., 2016; Cao et al., 2021). The platform effect of the can transcend time and space constraints, strengthen the ability to process information, ease the information asymmetry problem between banks and companies, and empower financial institutions to precisely assess enterprise operations. This allows for efficient provision of credit funds to support enterprise development and optimizes the deployment of bank resources. Moreover, the relaxation of corporate financing constraints enables more funds for green technology innovation and development, thus boosting the advancement and innovation of green technologies (Cao et al., 2021). Decreased financing constraints can encourage economic entities to expand R&D spending and introduce R&D personnel to carry out . Third, in terms of industry–university–research cooperation, the use of digital technology can remove obstacles to the flow of information (Zhang et al., 2025). It not only allows companies to promptly grasp the market needs for low-carbon technologies and products but also reinforces collaboration and links between enterprises, universities, and research institutions, enhances the collaborative innovation capabilities of enterprises, continuously improves the standard of industry–university–research collaboration, and promotes the improvement of the level.
It is worth noting that the Metcalfe Law (Zhao et al., 2020) and the existence of “network effects” can potentially empower the to exert a marginal incremental influence on . As the advances in development, data element resources are no longer scarce, and the promoting role of caused by the high penetration and fast characteristics of the is also enhanced.
In light of this, this research suggests Hypothesis 1: exerts a positive boosting influence on . It also shows the effect of marginal increase, meaning that as the advances in development, its capacity to foster creative gradually intensifies.
2.2 Analysis and research hypothesis on the influence of and on
and are two primary parts of the , and their simultaneous advancement is critical to fostering economic transformation and upgrading. In realizing and releasing data element value, and play key roles.
, as the provider of digital technologies and data elements, can offer necessary digital technologies, products, and solutions such as the Internet of Things, big data, and cloud computing to the digitalization, networking, and intelligent transformation of traditional industries (Wang and Qi, 2023). The technological transformation led by has stimulated the development potential of new technologies. Existing studies have shown that contributes positively to enhancing innovation capabilities and upgrading the industrial structure (Luo et al., 2023; Sturgeon, 2019), and the boosting of innovation capabilities and the refinement of the industrial structure are essential approaches to reduce carbon emissions and boost . Improving innovation capacity can promote negative-carbon technologies like carbon capture and disposal, reduce energy usage and pollutants, and eventually lower carbon emissions while promoting .
During the initial phase of , due to underdeveloped related infrastructure, a scarcity of skilled personnel, and insufficient exploration of digital technology application scenarios, it is challenging for the to fully exert its influence in integrating with traditional industries, and its role in promoting is limited. As advances, the powerful economies of scale effect of the becomes prominent, drawing substantial capital towards investments in R&D for carbon-neutral technologies, optimizing resource allocation, promoting knowledge and technology spillover, accelerating the agglomeration and integration of innovation elements, and thus significantly increasing the level.
is the core of the and the process of increasing output and improving efficiency caused by the application of data elements, digital technologies, and digital intelligence products in traditional real industries. relies on blockchain and other technologies to enable green development and promote , with this mainly reflected in two aspects: On the one hand, can promote inter-regional linkages of industries, form an innovation ecosystem with rapid flow of data, talent, and capital, and improve regional core technological innovation capabilities (Wang and Qi, 2023). On the other hand, reorganizes the industrial competition model and promotes the integration of industrial boundaries. Based on the theory of industrial integration, it helps to accelerate the integration of internal resources of enterprises, realize resource sharing, promote R&D capabilities, thus encouraging enterprises to engage in more innovative activities, and promote enterprises to R&D non-carbon technologies with lower carbon emission levels and zero-carbon emission, as well as negative-carbon technologies that compensate for process-related emissions. This effectively empowers green and low-carbon industrial development, improves carbon productivity, and lays a foundation for .
At lower stages of , the communication channels of digital technology among various industries are not smooth, the information barriers between different industries are high, the is difficult to effectively integrate resources, and its role in promoting is limited. As advances further, the expands in scale, the collaborative innovation between industries increases, and the technology and knowledge exchange and integration of different industries have accelerated the process of .
Notably, refers to the process where digital technologies continuously innovate and their market applications expand, thereby forming a digital industry with characteristics such as high penetration, technology-intensive nature, and foundational nature. , as the industrialization process of digital technology itself, represents a breakthrough from 0 to 1. It has the characteristics of rapid technological iteration and strong innovation spillover effects. It can leverage the advantages of digital technology to drive traditional industries towards intelligent and green development, providing foundational support for . Meanwhile, the introduction and implementation of a suite of policies like the “14th Five-Year Plan” have created a conducive setting for to exert its empowering role and for the advancement of . refers to the process of integrating digital technologies with the real economy (Xue et al., 2022). Currently, China’s industrial structure still faces the problems of being “big without being powerful” and “comprehensive but not excellent.” Traditional high-energy-consuming industries make up a relatively large share, and the integration of traditional industries and digital industries requires a process, which leads to a relatively slow progress of . The promoting effect of this on has not yet been fully manifested.
With regard to this, this article suggests Hypothesis 2: and can promote the improvement of , showing the characteristics of “marginal increase.” Compared with , serves a more significant role in encouraging .
2.3 Analysis and research hypothesis of indirect effects of on
The development of the can improve resource allocation efficiency and address issues of mismatched resources, thereby generating a favorable influence on . The , leveraging technologies like cloud computing and big data, reorganizes resource allocation and alleviates the distortions in the factor market allocation (Chen, 2020; Xu et al., 2022), achieving precise matching of factors through penetration and synergy, enhancing resource allocation efficiency, and correcting the problem of excessive resource allocation. In addition, the promotes organizational innovation, breaks down regional and industry barriers, and optimizes investment efficiency and customer channels, thereby improving resource allocation efficiency. Improving resource mismatch can effectively integrate technology resources among different industries, promote technology sharing and transfer, and improve the advancement of .
In light of this, the article proposes Hypothesis 3: The can improve by improving resource mismatch.
2.4 Spatial effect analysis and research hypothesis of on
Amid the context of the , digital information has become a key new production factor, and information technology has developed into a significant carrier for driving economic and efficient operations. In the digital network, the flow of information can break through geographical constraints and overcome space and industry barriers, exerting the superimposed effect of “flow space” and “flow industry.” Simultaneously, based on the sharing and penetration characteristics of the , key resources dominated by technology innovation and knowledge realize cross-regional flow. This means the impact of the is not confined to a single region. Studies demonstrates that China’s exhibits considerable spatial spillover, especially in promoting innovation and economic growth in surrounding urban areas (Huang et al., 2022). Relying on the spatial correlation between social and economic growth, the economy’s ability to encourage technology innovation is likely to be spatially correlated. The information flow and technology spillover across spatial constraints under the will also have a spatial impact on . The is not constrained by geographical distance. Through adopting digital information technologies, it can facilitate the dissemination of new technologies and knowledge among regions, make up for the shortage of resource endowments in adjacent areas, and optimize the cooperation models and innovative business forms among regions (Zhang et al., 2023). The progression of the and the cross-temporal connections of various Internet platforms have accelerated the dissemination and application of experiences and knowledge and can have spillover effects on surrounding areas.
Accordingly, this article puts forward Hypothesis 4: The exerts a spatial spillover impact on .
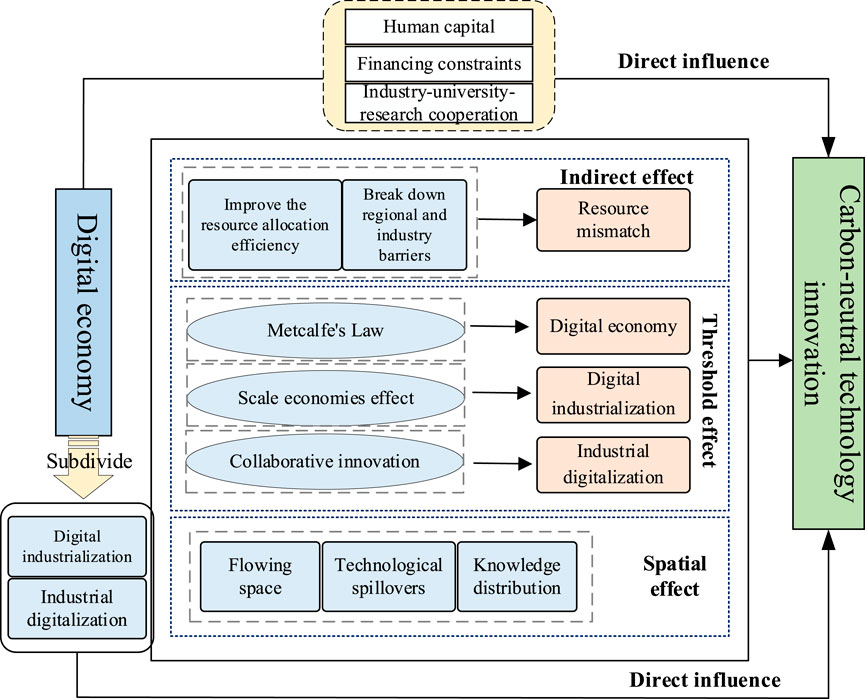
With regard to the previously mentioned analysis and research hypotheses, this article’s theoretical hypothesis framework diagram is built, as shown in Figure 1.
3 Model construction and variable measurement
3.1 Model construction
To examine the four hypotheses put forward in this article, the direct, indirect, nonlinear, and spatial effects of on are investigated by using a fixed-effect model, a mediating effect model, a dynamic threshold regression model, and a spatial Durbin model.
First, this article establishes a fixed-effect model to explore the direct implications of the d_economy and its two internal systems, namely digital_i and industrial_d on c_innovation:
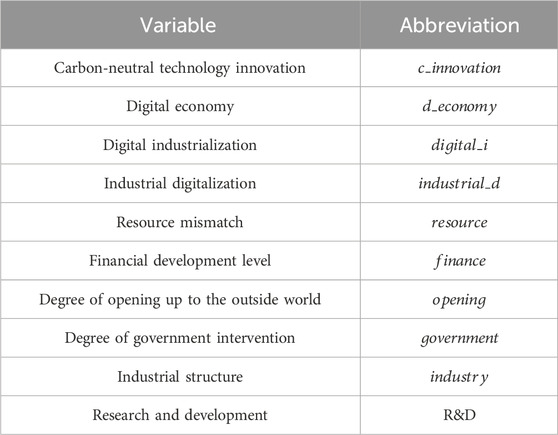
In Equation 1, denotes the explained variable, indicating the of region in period . is the core explanatory variable, including the level of regional (), the level of and the level of . represents a set of control variables, including the financial development level (), the industrial structure (), the degree of government intervention (), and the degree of opening up to the outside world (). is the constant term. signifies the urban fixed effect, denotes the time fixed effect, and signifies the random disturbance term.
Second, this article introduces resource mismatch as an intermediate variable, and the mediating effect model is employed to probe the indirect impact mechanism of ’s development level on . Drawing on the research approach of Jiang (2022), the regression model below is built:
In Equation 2, is a constant term, and the remaining variables correspond to those featured in Equation 1.
Furthermore, to explore the nonlinear relationship between and , this article designs the following dynamic threshold regression model (take a single threshold, for example):
In Equations 3–5, , , and are threshold variables. , and are threshold values. is an indicative function. The remaining variables correspond to those featured in Equation 1.
Finally, the spatial Durbin model not only enables the introduction of spatial factors to reflect the spatial correlation of but also tests the impact of other possible factors on . Therefore, a spatial Durbin model is adopted in this study to explore the spatial impact of the on , as specified below:
In Equation 6 denotes the spatial lag term of . signifies the inverse square matrix of spatial geographical distance. represents the coefficient of spatial autoregression. , , and represent the estimated coefficients of each variable, and the remaining variables are the same as in Equation 1.
3.2 Measurement and description of variables
3.2.1 Explained variable
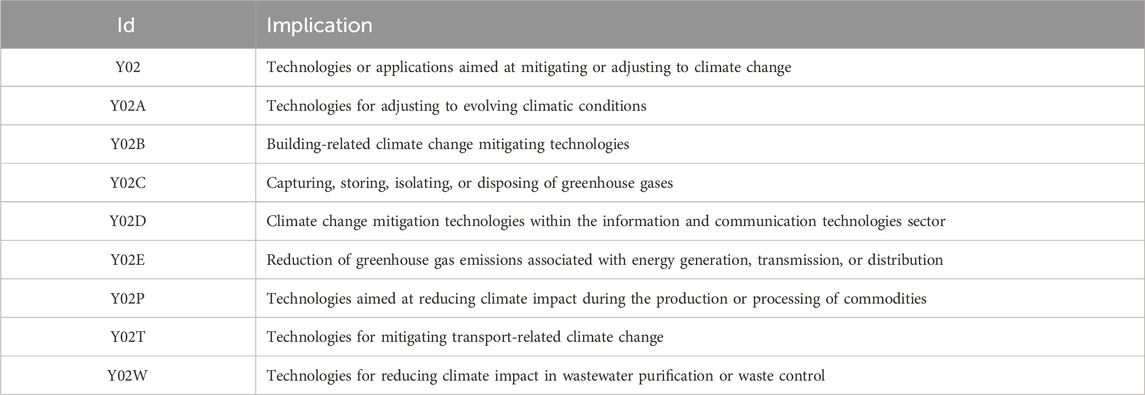
. Patent quantity provides a more accurate reflection of innovation level (Farbmacher et al., 2022) to comprehensively investigate the low-carbon technology, zero-carbon technology, and negative-carbon technology innovation in . Among them, low-carbon technology innovation refers to technological innovations that reduce greenhouse gas emissions and lower energy consumption. Zero-carbon technology innovation involves developing and utilizing non-fossil energy to achieve nearly “zero” carbon dioxide emissions. Negative-carbon technology innovation is technological innovation for capturing, storing, and utilizing carbon dioxide. This research references the findings of Gong and Xiao (2024) and uses the logarithm of the number of invention applications for Y02 patents in the Cooperative Patent Classification (CPC) plus 1 as an indicator to measure . The European Patent Office and the United States Patent and Trademark Office collaborated to create the patent categorization. It boasts advantages of unified standards, strong compatibility, and high subdivision. The categories of patents included in the CPC-Y02 patent classification system and their meanings are shown in Table 1.
3.2.2 Core explanatory variables
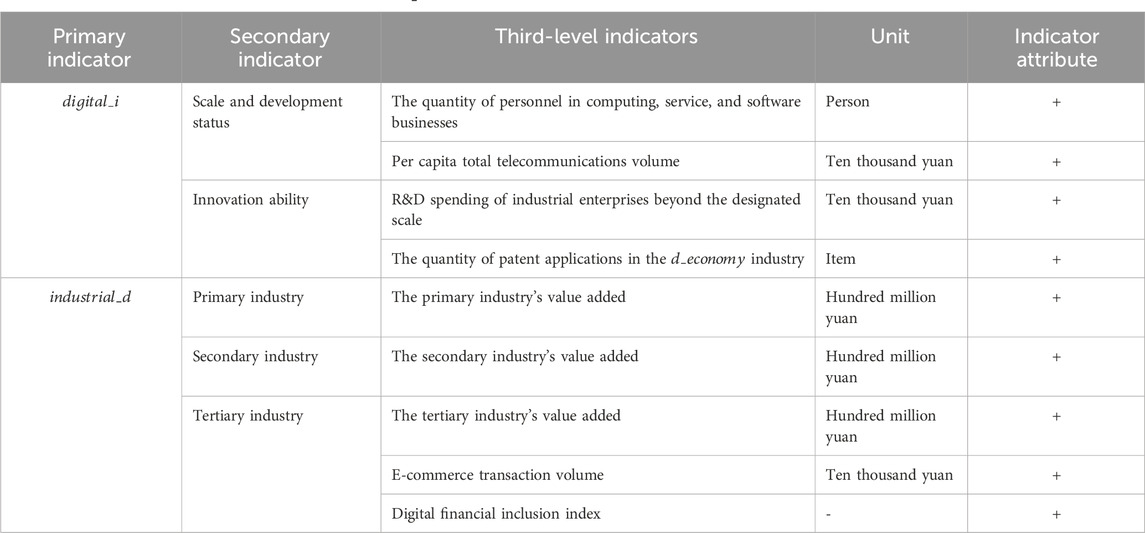
Following the National Bureau of Statistics (2021) taxonomy of the , this article gauges the ’s development level across two dimensions: and , in accordance with its conceptual definition and accounting for data accessibility at the city level. acts as the foundation for the ’s development, encompassing industries such as software and information technology services, and telecommunications. Therefore, from the standpoint of digital industry development, is measured from two dimensions: scale and development status, as well as innovation capabilities. refers to the integration of digital technologies and the real economy. Hence, it is defined from the viewpoint of integrating digital technology with the industrial sector, covering three levels: the primary industry, the secondary industry, and the tertiary industry. Table 2 details the evaluation index system of the . Considering that the selected indicators are multi-dimensional, this article employs the projection pursuit method optimized by the accelerated genetic algorithm (RAGA-PP) to compute the ’s development level (Niu and Liu, 2021). This method effectively reduces multi-dimensional data to a low-dimensional space by optimizing the projection direction , ensuring that the structural features and key information of the original data are retained as much as possible during the dimensionality reduction process. By carrying out a global search for the optimal projection direction, the numerical value of the optimal projection direction represents the weight. When the projection index function reaches its optimal value, the one-dimensional optimal projection value of the can be obtained. The specific steps for calculation are as follows:
1. Standardized sample indicators
For positive indicators:
In Equation 7, and , respectively, signify the maximum and minimum values of the variable. denotes the dimensionless data of the positive variable after normalization.
2. Establish the projection index function
In Equation 8, represents the projected value of the index, and stands for the unit projection direction of the indicator. In Equation 9 represents the projection index function. In Equation 10 denotes the average value of , is the standard deviation of , in Equation 11 is the local density of , and represents the radius of the local density window, while indicates the distance between samples. . represents a unit step function, taking the value of 1 when t ≥ 0 and 0 when t < 0.
3. Refine the projection index function
In Equation 12, represents the maximization of the objective function.
4. Calculate the index
Through step (3), the optimal projection direction value is obtained and placed in the projection function to calculate the projection values of each indicator, which is the index value.
3.2.3 Threshold variables
(), (), and () are the threshold variables. Among them, both and utilize the projection pursuit method optimized by genetic algorithms for normalization processing.
3.2.4 Intermediate variable
Optimal resource allocation refers to a state where the free movement of factors leads to maximized social output within a market mechanism, while resource mismatch or market distortions signify deviations from this optimal state. In this article, resource mismatch is selected as the intermediate variable. With reference to the relevant studies of Hsieh and Klenow (2009), this article employs the production function to gauge the level of factor market distortion in urban areas. The extent of resource mismatch in each city is assessed by comparing the market distortion level of that city with the highest distortion level observed among all cities in the current year. The C-D production function is constructed, and the logarithm is taken, as follows:
In Equation 13, and represent marginal output of capital and the marginal output of labor, respectively. In Equation 14, and stand for the levels of capital and labor distortion. By combining the distortions in capital and labor, the overall market distortion degree is , where is calculated using the gross regional product. denotes the capital stock, which is assessed through the perpetual inventory approach. represents the workforce count, indicated by the count of employment at the city’s end of the year. is the capital price, set at 10%, representing a 5% depreciation rate and a 5% effective interest rate. denotes labor expenses, reflected through the average salary of the people employed in each city in the current year. represents the output elasticity of capital, and indicates that of labor.
3.2.5 Control variables
To achieve a more precise and thorough insight into how the influences , this article draws on existing studies and introduces the following control variables (Dian et al., 2024; Li and Yue, 2024; Huang et al., 2023; Wu et al., 2019): (1) Financial development level (): The financial development level is indicated by the ratio of year-end deposit and loan balances from financial institutions to the gross regional product. (2) Industrial structure (): The industrial structure can be depicted by the ratio of tertiary industry value added to the gross regional product. (3) Degree of government intervention (): The ratio of governmental spending to gross regional product is employed as a measure for assessing the degree of government intervention. (4) Degree of opening up to the outside world (): The proportion of total imports and exports to gross regional product is used as an indicator of the degree of opening up to the outside world.
3.3 Sources of data and descriptive statistics
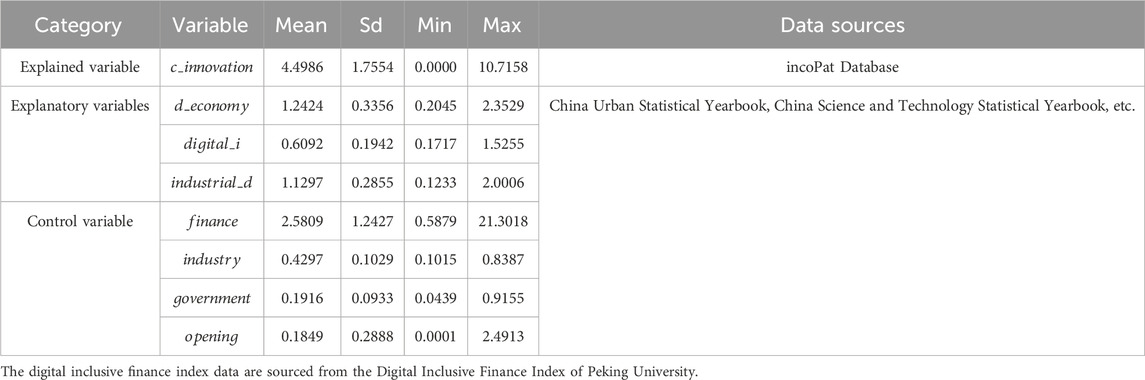
During the 12th Five-Year Plan period, China started emphasizing the growth of the information technology sector and cultivating it as a strategic emerging industry. Although the term “” has not been explicitly proposed, the extensive use of information technology and the strengthening of digital trends have established a firm basis for the subsequent advancement of the . The period from 2011 to 2022 witnessed the whole process of the initial rise of the to the in-depth development, and it is also a key period for the proposal and implementation of . Therefore, this article selects 264 Chinese cities, ranging from 2011 to 2022, as the samples applied in its study. Logarithmic transformation is applied to the related variables to avoid heteroskedasticity and multicollinearity. Table 3 presents the descriptive statistics of each variable and the data sources.
4 Empirical test and result analysis
4.1 Collinearity test
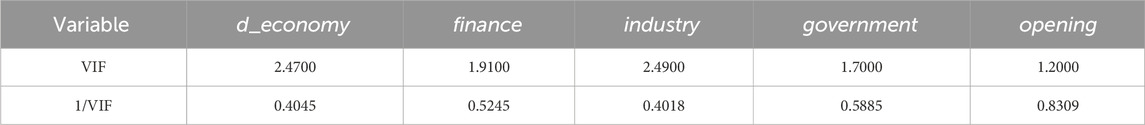
Given that potential multicollinearity may exist among different variables, the variance inflation factor (VIF) is first employed to perform a collinearity test prior to conducting the baseline regression analysis. The outcomes in Table 4 reveal that each VIF value is strictly less than 5, which signifies no multicollinearity among the variables (Batrancea and Tulai, 2022).
4.2 Analysis of benchmark regression results
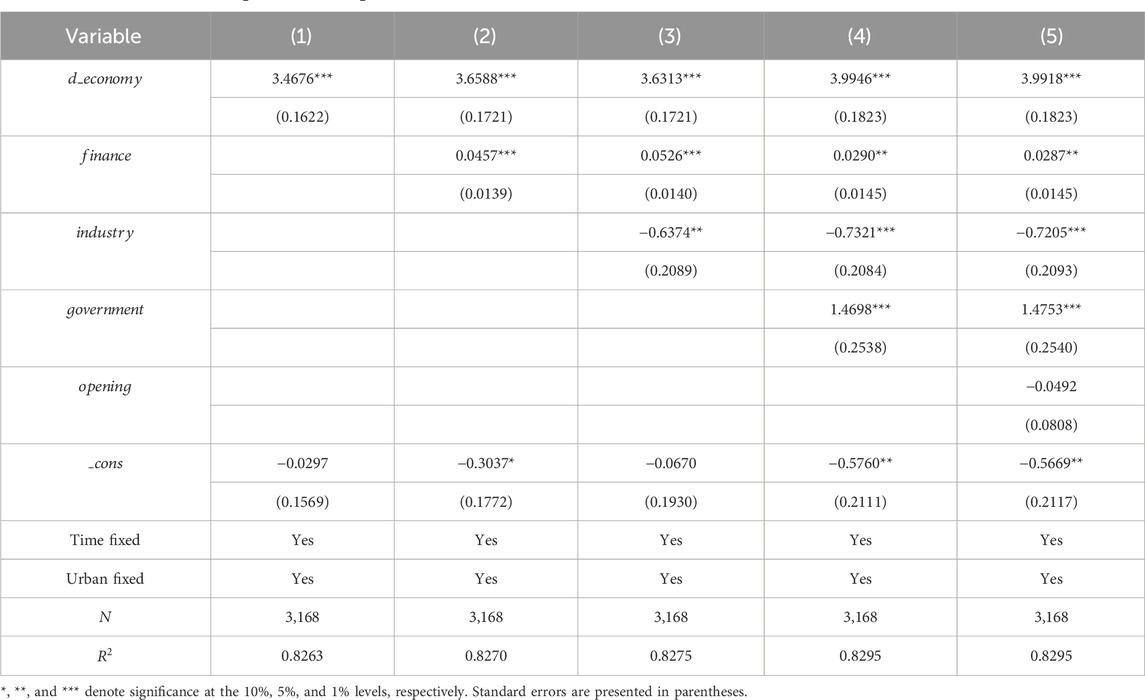
Table 5 exhibits the benchmark regression outcomes on how the facilitates . Among them, columns (1) to (4) show the estimation results with control variables added incrementally, with column (5) providing the estimation result incorporating the full set of controls. Note that the number of added control variables does not affect the positive impact of on , and with the increase of the quantity of incorporated control variables, the enhancing effect of on is generally increased. A 1% rise in the results in a 3.9918% growth in the . This verifies that Hypothesis 1 is valid. Relying on the extensive application of technologies such as big data, cloud computing, blockchain, and artificial intelligence, the can reduce the difficulty and expense of obtaining information, accelerate the spillover of knowledge and technology, and facilitate regional and R&D, thus overall boosting the level.
Concerning control variables, the financial development level can markedly promote the improvement of , which indicates that regions with a higher financial development level can offer adequate funding for the research of projects. The coefficient of government intervention’s effect is positive and relatively notable, which shows that the government can establish and improve industrial policies related to carbon-neutral technology, guide traditional industries to transform toward a green and low-carbon direction, and provide certain support for . However, the industrial structure exerts a negative effect on . This result aligns with the findings reached by Huang et al. (2023). The possible cause may be that the unreasonable industrial structure makes it difficult to efficiently focus innovation resources in the field of , and more resources such as capital, talent, and technology will flow to traditional high-carbon industries or other non-key fields, leading to inadequate resources for research. There are certain restrictions on its development.
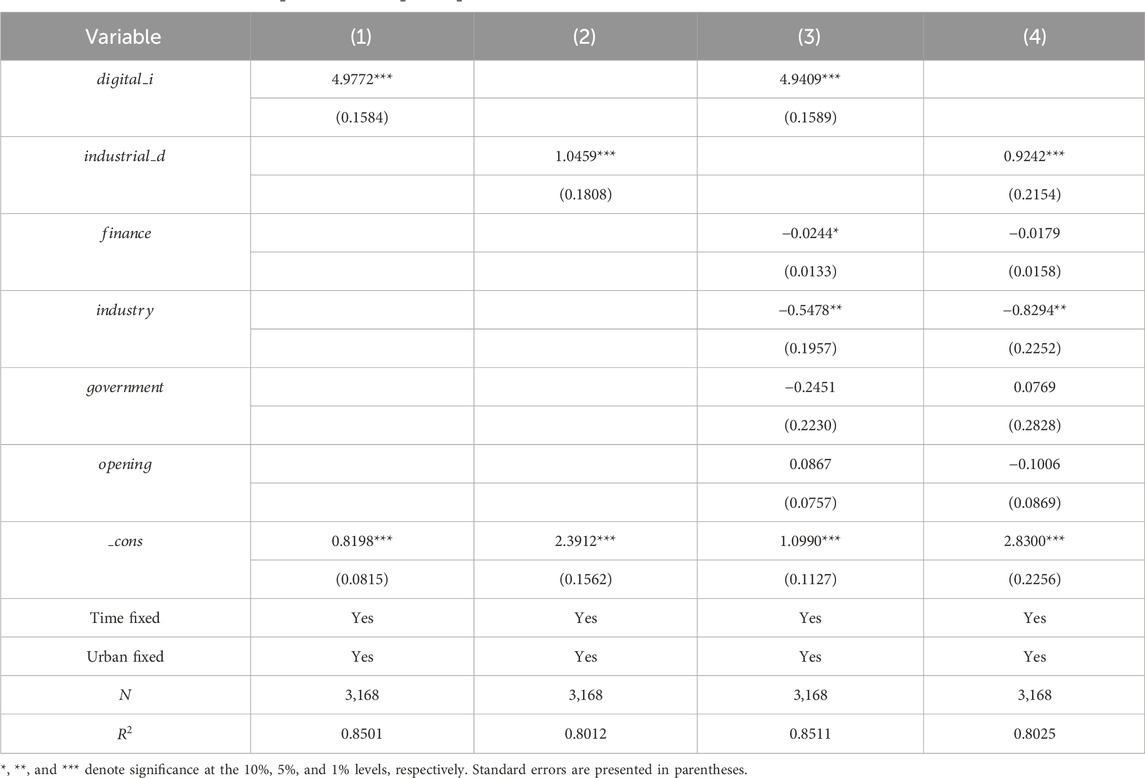
In addition, to further explore how the two systems of the affect , this article adds the core explanatory variables of , , and control variables into the full-sample baseline regression analysis. As illustrated in Table 6, column (1) and column (3) display the estimation findings with no control variables included, whereas columns (2) and (4) show the estimation outcomes after including the control variables. One can observe that, whether or not control variables are incorporated, and both impose a notable enhancing effect on , and the promoting effect of is stronger. This finding aligns with the Wang and Wei (2023) study on how and affect enterprise innovation. Specifically, each 1% growth of will lead to a 4.9409% increment in ; for every 1% increase in , will increase by 0.9242%. The possible reasons are as follows: On the one hand, , as the foundational part of the , encompasses industries such as electronic information manufacturing, telecommunications, software, and information services. These are the industrial foundations for the development of the entire . Compared to traditional industries like industry, they inherently possess the advantages of being green and low-carbon. Furthermore, the digital industry can leverage the penetration and expansion of digital technologies to boost the upgrading of traditional industries, drive the transformation of industries towards intelligence and greenness, and lay a certain foundation for . On the other hand, from the standpoint of the concept of , integrating traditional industries and digital industries is a process that takes time and will not immediately lead to an increase in production efficiency. Corresponding environmental effects may also have a certain time lag. Thus, the promotion influence of on is relatively weak.
4.3 Endogeneity and robustness
4.3.1 Endogeneity test
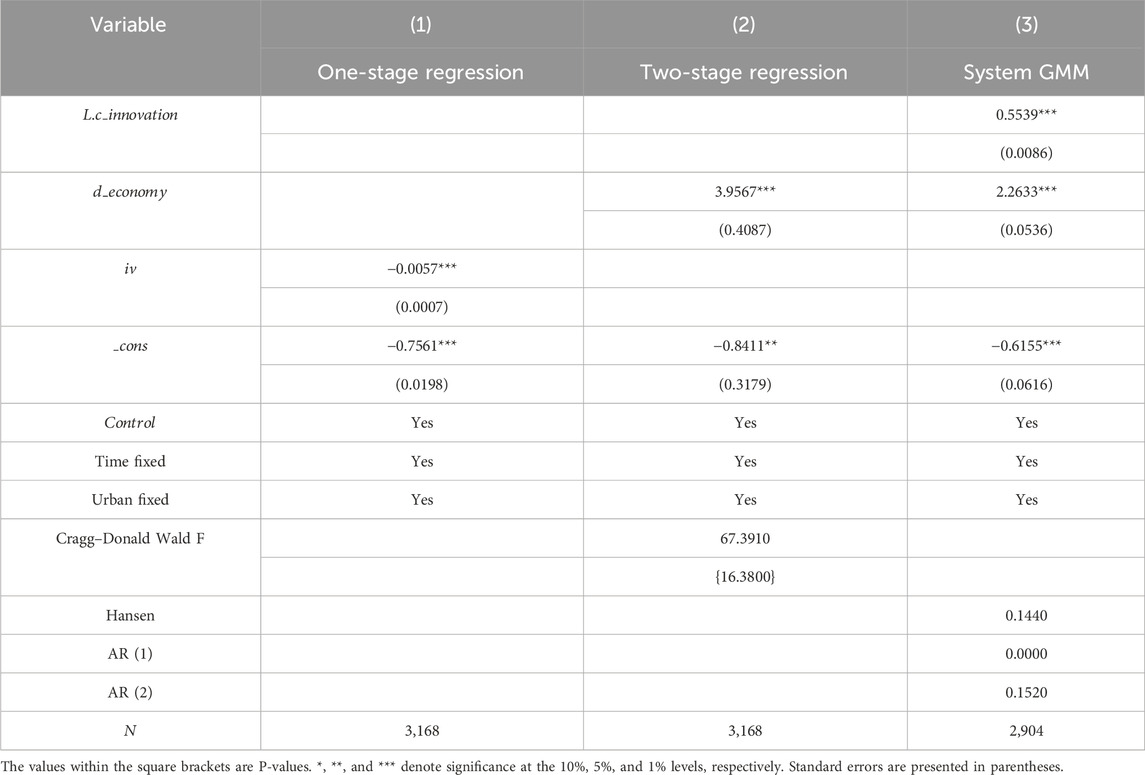
Consider the exclusion of important variables or the likelihood of a reverse causal link between the and , leading to endogeneity issues. With reference to the research conducted by Chang et al. (2021), the topographic relief was selected as the instrumental variable for the . On one side, the topographic relief can function to reflect the complexity of a locality’s terrain, which in turn influences the installation and commissioning of digital infrastructure. In general terms, the larger the topographic relief, the higher the expense and difficulty associated with constructing digital infrastructure. Hence, the topographic relief fulfills the relevance condition for being used as an instrumental variable. On the other side, the topographic relief, as a natural factor, has no direct correlation with other economic variables and thus satisfies the exogeneity condition required for being used as an instrumental variable. Because the original data of the employed instrumental variable exists in cross-sectional form, following the approach of Nunn and Qian (2014), this article incorporates a variable that varies with time to build a panel instrumental variable. Therefore, an interaction term between the topographic relief and the time trend is created to serve as the test instrument variable. Using this foundation, the two-stage least squares method (2SLS) and the system GMM model are employed to conduct the model concurrently. The outcomes of these tests are presented in Table 7.
According to the outcomes of the two-stage least squares regression (1) and model (2), the first-stage regression demonstrates that the instrumental variables exhibit a significant correlation with the endogenous variable , which confirms the hypothesis regarding the instrumental variables’ correlation. Second-stage estimates indicate the coefficient of holds a notably positive value at the 1% level, confirming that the study’s finding holds after alleviating the endogenous problem. Moreover, the Cragg–Donald Wald statistic equals 67.3910, which exceeds the 10% critical threshold of 16.3800, thereby implying that there is no issue with weak instrumental variables. According to the results of the system GMM model (3), the AR test reveals that the model’s first-order sequences exhibit correlation, whereas the second-order sequences lack it, implying insignificant serial correlation in the original model’s error terms. It is worth noting that both types of models, after tackling the endogeneity problem, show that the significantly boosts , which supports Hypothesis 1.
4.3.2 Robustness test
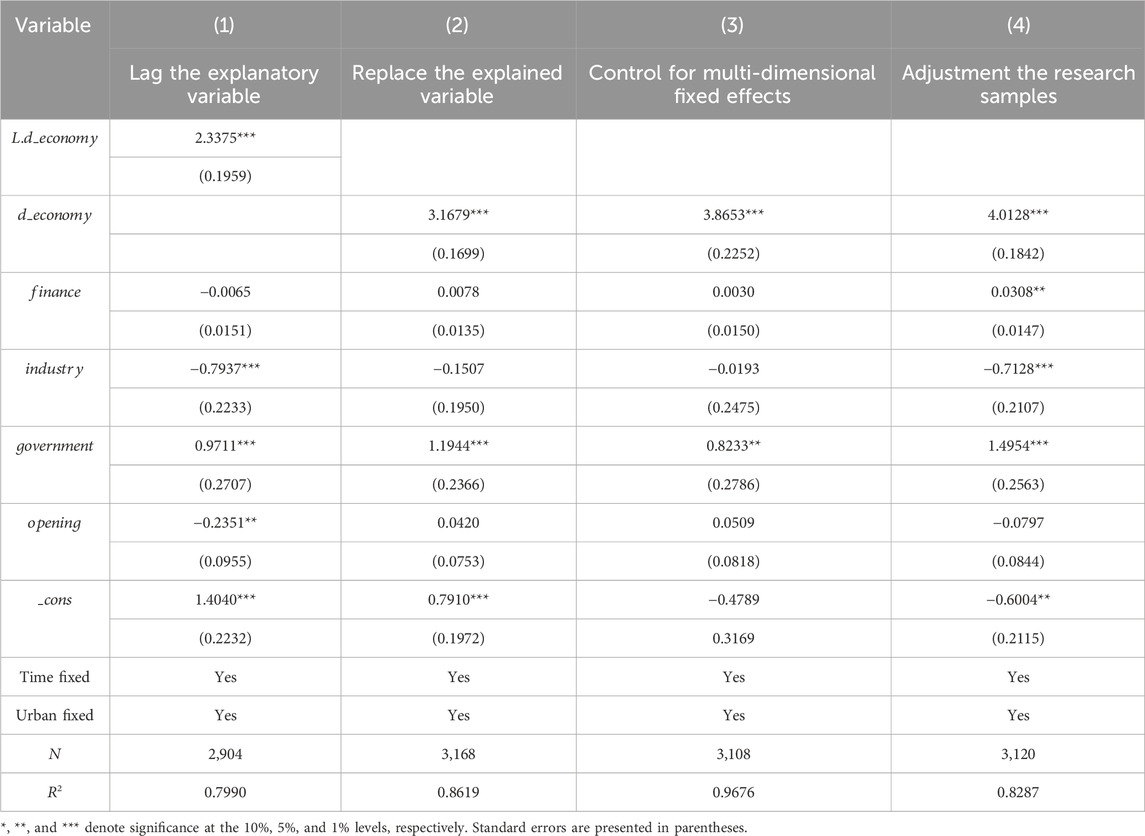
To verify the dependability of the findings, this study conducts a robustness test on the benchmark regression results through the following methods. (1) Lag the explanatory variable. With reference to Chang et al. (2025), this article chooses the lagged one-period as the core explanatory variable. A new regression is conducted on the ’s empowerment of , with the findings displayed in column (1) of Table 8. (2) Replace the explained variable. The number of published Cooperative Patent Classification (CPC) Y02 patents after adding 1 and then taking the logarithm, is used to measure (Gong and Xiao, 2024), with the outcomes displayed in column (2) of Table 8. (3) Control for multi-dimensional fixed effects. Drawing on the method of Wu (2020), this article, based on the baseline regression, incorporates the interaction effect between provinces and time. The findings are exhibited in column (3) of Table 8. (4) Adjustment the research samples. Beijing, Tianjin, Shanghai, and Chongqing, which function as municipalities directly under the central government, have significant advantages in urban hierarchy, policy orientation, and economic size. Including these cities in the empirical sample might introduce a risk of bias to the results of the basic model test (Lu et al., 2025). After removing the four municipalities directly under the central government, the regression is conducted again, with the results displayed in column (4) of Table 8. It is observable that the ’s coefficients under different testing methods are all significantly positive, confirming the robust stimulative influence of the on .
4.4 Regional heterogeneity analysis
4.4.1 Heterogeneity of geographical location
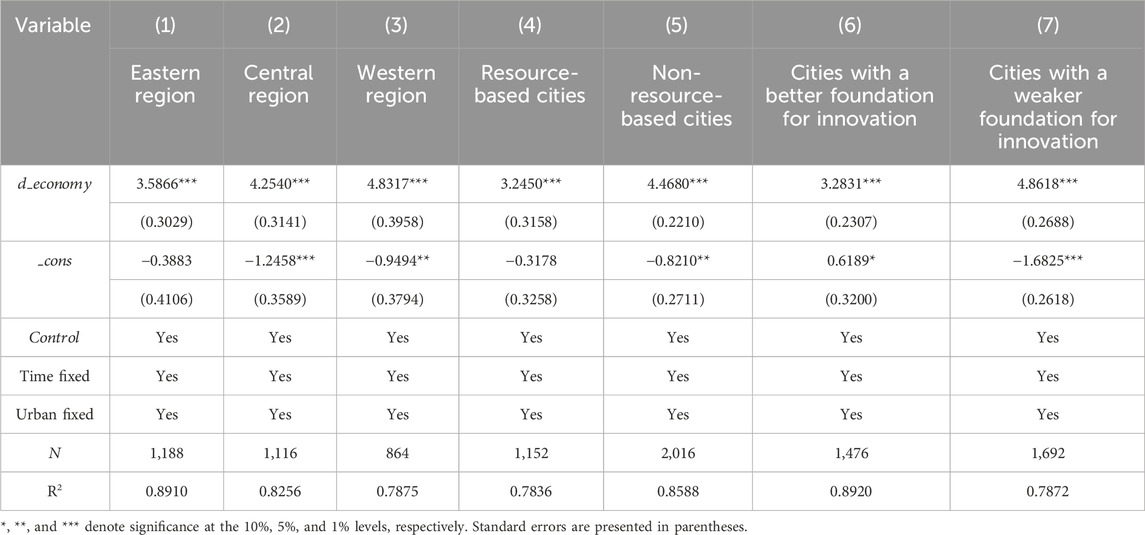
Because of discrepancies in cities’ geographic locations, urban infrastructure, economic development degrees, and government subsidies, the might exert a varied effect on . In accordance with the categorization standards set by the National Bureau of Statistics, the sample cities are grouped into the eastern, central, and western regions to perform heterogeneity analysis. The outcomes in columns (1) to (3) of Table 9 reveal that the economic development level in the eastern, central, and western regions exhibits a notable positive impact on , with the influence effect being western region > central region > eastern region. This research finding is basically consistent with the conclusion of Fan and Shen (2025). The primary cause might lie in the fact that, as a pioneer of China’s economic development, the eastern region has long been deeply engaged in the field of technology, has obvious advantages in initial technology endowment, has a high maturity of green innovation network, and has built a relatively dense relationship among various entities in the network. Although this perfect innovation network structure lays a solid foundation for technological innovation, it also limits the space for further development of core elements of the , such as information technology and big data. Given the relative stability of the existing network structure, there is limited room for the dividend release of when new digital technology elements are integrated. In the midwestern areas, the green innovation network is still in its developmental phase, and the elements of the , such as information technology and big data, have broad application and integration space. When these elements are integrated into the local innovation system, they can be deeply integrated with local innovation resources, and then vigorously promote the promotion of . This driving effect is not only reflected in the technical breakthrough level but also radiates to the optimization of the entire innovation ecology, releasing greater economic and environmental benefits. Especially in the western areas, traditional industries urgently need to be digitally transformed, and the plasticity of the green innovation network is strong, which makes the more significant in promoting than the central region, showing great development potential.
4.4.2 Heterogeneity of resource endowments
The economic growth of resource-intensive cities primarily relies on inputs like workforce and natural mineral resources, with most industries being led by the heavy chemical industry. These cities exhibit a low degree of technological advancement, particularly in the realm of green tech innovation and progression, which constitutes a weak link for resource-dependent cities. With reference to the National Sustainable Development Plan for Resource-based Cities (2013–2022), this article separates the sample into two groups: resource-based cities and non-resource-based cities in order to investigate whether can successfully foster the growth of in resource-based cities. Finally, 96 resource-based cities and 168 non-resource-based cities are identified. Referring to the findings in columns (4) and (5) of Table 9, it is observable that under different levels of resource endowment, the ’s development exerts a notable positive effect on . The impact coefficient of resource-based cities’ development level on stands at 3.2450, whereas the equivalent coefficient in non-resource-based cities is 4.4680. In contrast to resource-based cities, non-resource-based cities exhibit a stronger promoting effect, and this conclusion from the study aligns basically with the findings presented by Zheng et al. (2025). A possible cause could be that resource-based cities have a high degree of dependence on resources in their developmental processes. Their industrial structure is mainly composed of resource-oriented industries with high energy usage and high emissions (Kim and Lin, 2017). The abundant natural resources can bring them continuous income, which leads to the fact that the talents and funds needed for are crowded out by the investment in resource exploitation. On the other side, resource-based cities have a low concentration of technology-based enterprises, and there is a shortage of technological resources. The resource industry sector is also a sector lacking technological progress and featuring weak demand for innovation. In consequence, resource-based cities lack the driving force for innovation, and the cannot fully exert its effects. Rather, resource-based cities tend to adapt to the needs of attaining the “carbon neutrality” goal. As the advances, they combine their own development advantages to promote the development of .
4.4.3 Heterogeneity of innovation base
In response to environmental regulatory measures, enterprises, as key market participants, may reallocate innovation resources based on the severity of the policies (Takalo et al., 2021) to fulfill the demand for . Hence, varying urban innovation foundations can result in diverse allocations of innovation resources, causing the heterogeneous effects of development levels on . Based on the China City Innovation Index released by Fudan University’s Industrial Development Research Center to evaluate the innovation foundation levels among diverse cities, this article categorizes the research samples into 123 cities possessing a strong innovation foundation and 141 cities with a weak innovation foundation. Columns (6) and (7) in Table 9, respectively, present the regression outcomes for cities with strong and weak innovation foundations. The outcomes reveal that the advancement of in cities featuring strong and weak innovation bases alike exerts a notable positive impact on . Specifically, the influence coefficient of the on stands at 3.2831 for cities with a strong innovation foundation, while that of cities with a weaker innovation foundation is 4.8618. Cities with a weaker innovation base have a stronger catalytic effect than cities with a better innovation base. This article suggests that a plausible reason could be, based on the marginal effect theory, cities with a strong innovation foundation have already invested resources in , achieved certain results in the early stage, and may face diminishing marginal returns when they continue to increase investment in . Cities with weak innovation foundation face diminishing marginal returns due to the small investment in the early stage. The investment of the can bring more obvious results in a relatively brief period, and the marginal benefit is relatively high. The integration of can quickly fill the technical shortcomings and bring significant innovation.
5 Further analysis
5.1 Indirect effect test
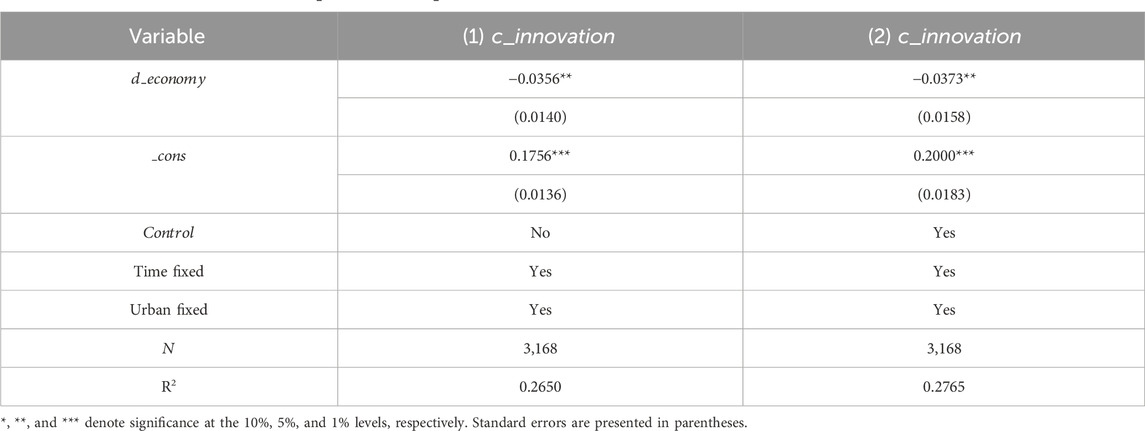
Table 10 displays the test outcomes for the mediating function of resource mismatch in the ’s influence on . As shown in Table 10, whether or not control variables are added, the ’s coefficient holds a notably negative in both scenarios. Amid the division of global value chains, resource mismatch acts as a key factor that impedes the innovative development of enterprises. Currently, most scholars have confirmed that resource mismatch imposes a negative effect on the level of technological innovation (Wang and Guo, 2025). projects are characterized by lengthy cycles, increased costs, and considerable risk. In the case of unreasonable resource allocation, investors usually prefer conventional projects with shorter return cycles and lower risks, which encroaches upon the funds required for carbon-neutral technology R&D, thereby hindering the improvement of . is able to notably alleviate resource mismatch by accelerating capital flow, optimizing allocation, and providing diversified financing channels, directing more human, material, and financial resources to technology R&D projects that have real innovation potential and can effectively reduce carbon emissions, thereby fostering advancements in the level of .
5.2 Threshold effect test
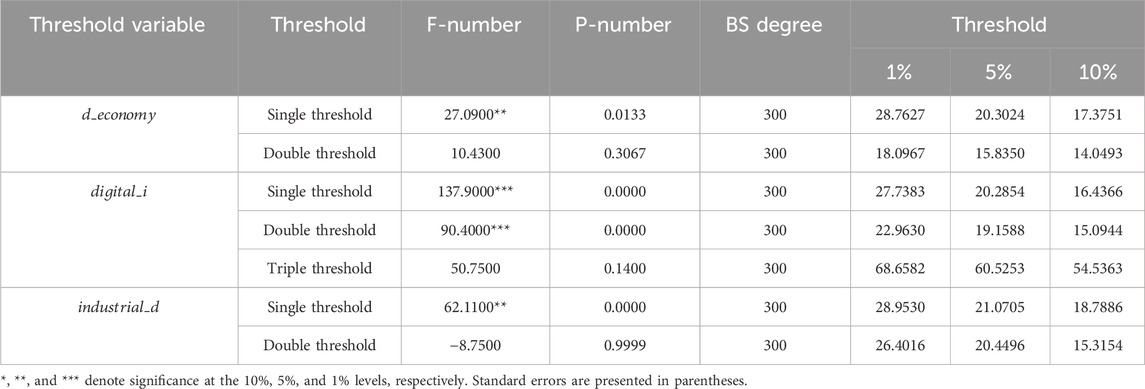
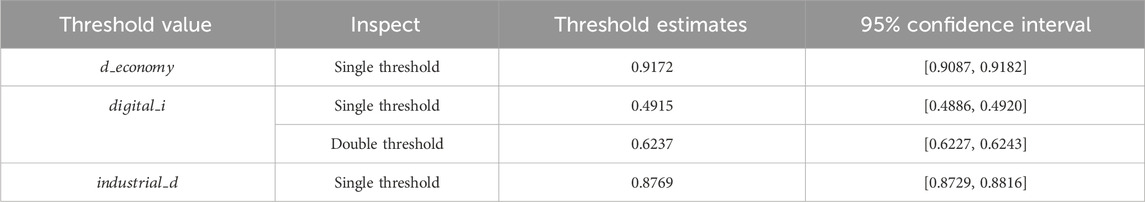
This article examines a dynamic threshold regression model where the thresholds are set as variables of , , and to investigate the nonlinear effect of on . First, an examination was conducted to verify the presence of panel threshold effects in the model and the number of thresholds. After 300 bootstrap samplings, the models constructed in Table 13 were subjected to single, double, and triple threshold tests (see Table 11). The outcomes show that the exhibits a single threshold, with the threshold figure being 9.9172. has a double threshold, namely, 0.4915 and 0.6237, and has a single threshold, which is 0.8769 (see Table 12).
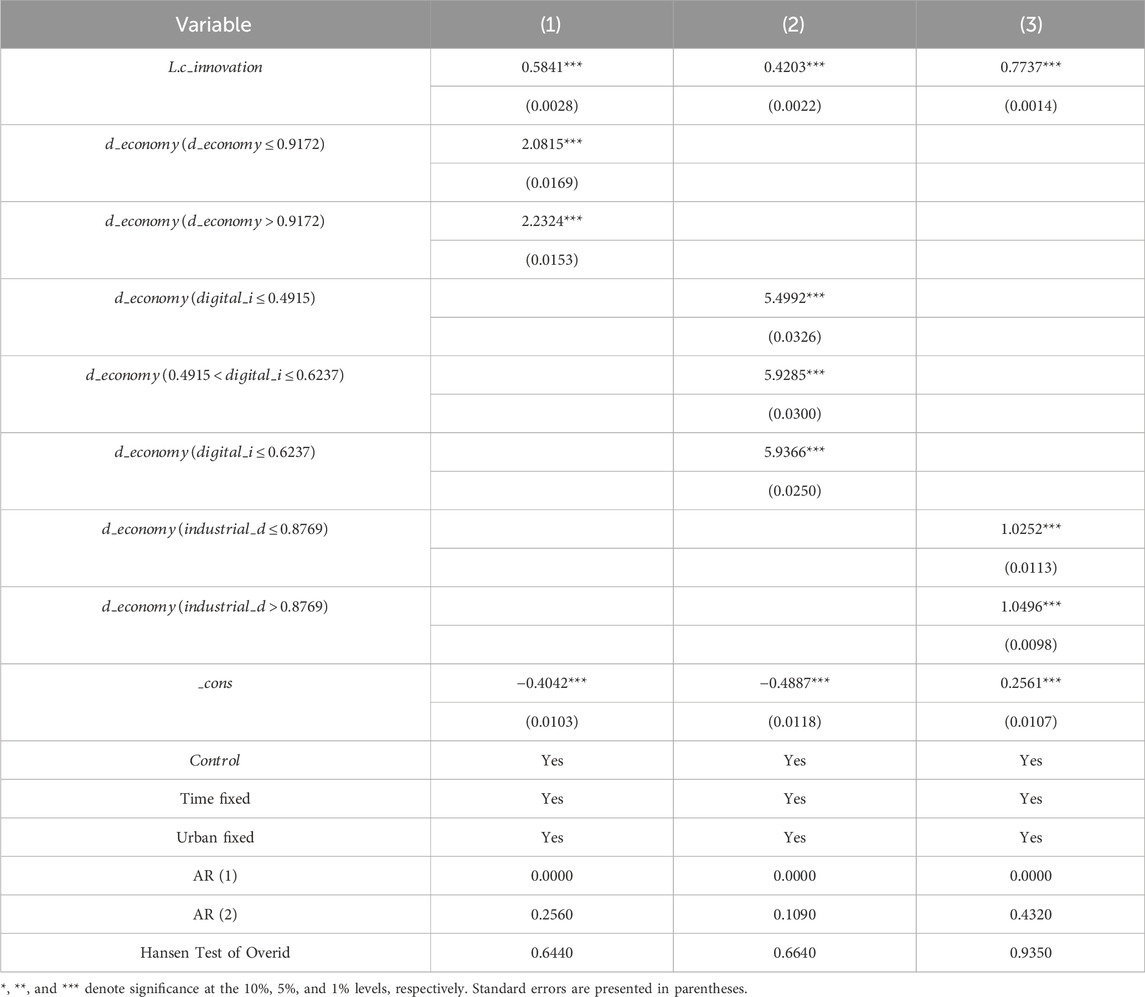
Table 13 displays the outcomes of the threshold regression. The regression outcomes with the acting as the threshold variable are presented in column (1). The findings demonstrate that the exerts a notable promoting effect on and shows a “marginal increasing” characteristic. Specifically, when the ’s development level falls below the threshold of 0.9172, it exerts a beneficial influence on , with an impact coefficient of 2.0815. When the is above the threshold, its impact coefficient on grows to 2.2324. This research result is consistent with the view of economies of scale theory. That is, as the ’s scale grows continually, the cost advantages of the in technology R&D, talent attraction, and other aspects gradually emerge, and the promotion role of gradually increases. From the regression findings reported in column (2), where acts as the threshold variable, it is noticeable that under the constraint of , the enabling influence of the on also presents a “marginal increase” feature. The growth of can revolutionize the research paradigm of , strengthen the willingness for , reduce the transaction costs for entities in accessing innovation resources, and improve the independent innovation capabilities of carbon technologies. As displayed in column (3) using as the threshold variable, when is smaller than 0.8769, the ’s influence on is significantly positive, with a coefficient of 1.0252, and rises to 1.0496 when the level of is higher than 0.8769. With the improvement of , an ecosystem has gradually formed and continuously improved, even forming a digital ecosystem that cuts across industries and regional areas (Hou et al., 2025). This can reduce the innovation and R&D costs across regions, industries, and enterprises, optimize the distribution of various innovation factors and resources, and drive improvements in .
Further calculations reveal that the average level of China’s during the observation period is 1.2424, which fell within the optimal threshold range. This indicates that the is currently capable of effectively driving the improvement of . The average level of is 0.6092, which is still within the second threshold range. The gap from the lower limit value of the optimal range 0.6237 is comparatively slight, which signifies that the current improvement in contributes to boosting the ’s exertion of its enabling effectiveness on . The average level of is 1.1297, which is also within the optimal threshold range. This reveals that under the constraints of , the is capable of effectively driving improvements in . Therefore, promoting the advancement of the and its two major subsystems is highly beneficial for enhancing . The promulgation of documents such as the Development Plan for the 14th Five-Year Plan and the Action Plan for Carbon Peak Before 2030 has provided policy guidance for continuously advancing the , , , and the enhancement of . In the future, the government ought to proactively encourage the growth of the , , and to further stimulate its positive contribution to the improvement of .
In conclusion, under the constraints of the , , and , the ’s role in promoting has shown a “marginal increasing” impact, further verifying Hypotheses 1 and 2 of this article. This research’s result is mostly aligned with the conclusion of Wang et al. (2022), but it focuses on the nonlinear influence of the on green technology innovation, rather than . The outcomes of this article reveal that the not only aids green technology innovation but also promotes .
5.3 Spatial effect test
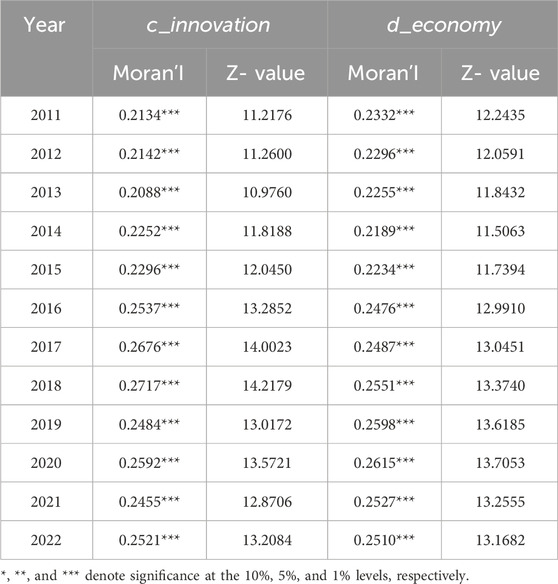
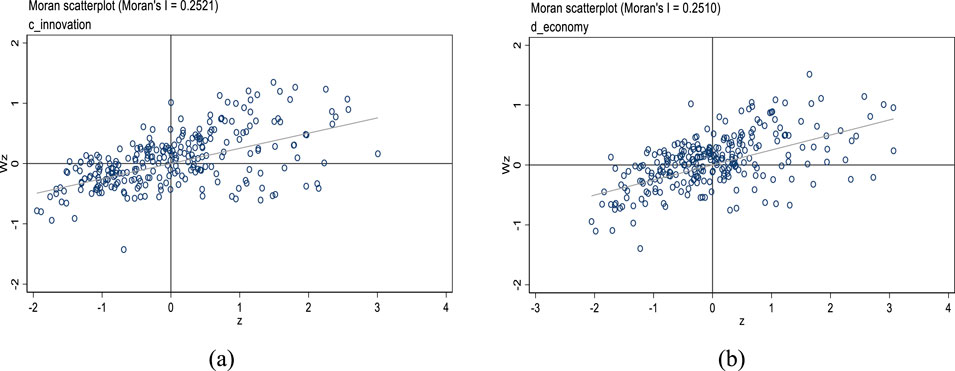
Table 14 presents the findings of the global Moran’I test for the levels of and the development degree of individual cities spanning 2011 to 2022. Both and exhibit positive spatial autocorrelation significant at the 1% level when using a geographic distance-based weight matrix, which points to a notable spatial correlation between and across every city. The local Moran scatter plot in Figure 2 shows that the and activities in various cities are mainly located in the first and third quadrants, presenting “high-high” type aggregation and “low-low” type aggregation characteristics and having strong spatial correlation. Hence, adopting spatial econometric models to carry out additional research is justified.
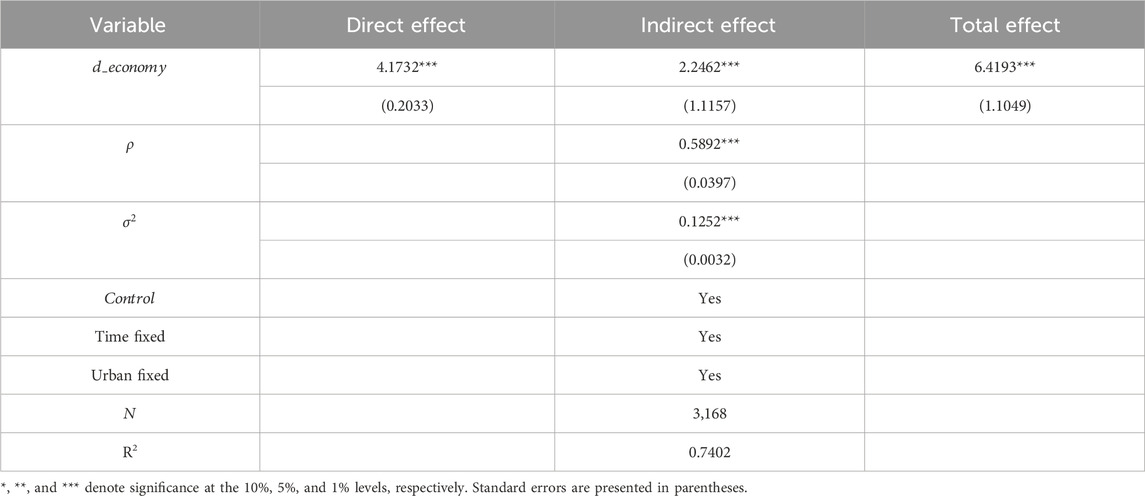
After passing the LM, Hausman Wald, and LR tests, this article finally selects the spatial Durbin model (SDM) based on both time and urban fixed effects. As the spatial lag terms of both the independent and the dependent variable are added to the outcomes derived from the spatial Durbin model analysis, solely taking into account the direct regression results will overlook the independent variable’s marginal influence on the dependent variable, leading to bias in the estimation results (Anselin, 2001). Drawing upon the research conducted by Lesage and Pace (2009), the effects of independent variables on dependent variables within the spatial Durbin model are segmented into direct, indirect, and comprehensive effects. The direct effect here incorporates the cumulative effect of spatial feedback from a city’s spillover effect on adjacent cities, which is to say it includes the city’s own feedback effect and the spillover effect of its neighboring cities (Yuan et al., 2020). The indirect effect signifies the spillover impact, reflecting the indirect influence a city exerts on its neighboring cities. Total effect represents the summed value of these two types of effects in a city. The spatial Durbin model’s effect decomposition outcomes are provided in Table 15.
(1) Direct effect. The can significantly promote . A 1% growth in is associated with a 4.1732% rise in the region’s . (2) Indirect effect. The regression coefficient for the indirect effect is notably positive, signifying that the can exert a positive spatial spillover influence on among geographically adjacent regions through spatial characteristics, thereby confirming Hypothesis 4. Likely reasons are that the can break through geographical barriers through information networks, enhance the movement and convergence of production factors across regions, promote the cross-regional dissemination of knowledge and technology, improve the learning and imitation efficiency of various market entities, and thereby increase the level of surrounding cities. (3) Total effect. With the accumulation of positive direct and indirect effects, the exhibits a pronounced positive influence on .
5.4 Spatial heterogeneity
Considering that the ’s effect on urban differs across spaces, this article groups and regresses each city with reference to the National Sustainable Development Plan for Resource-based Cities (2013–2020) and the digital infrastructure level of each city to examine how ’s impact differs across city types. Considering geographical factors, this part is still based on the geographical distance weight matrix.
5.4.1 Heterogeneity of resource endowments
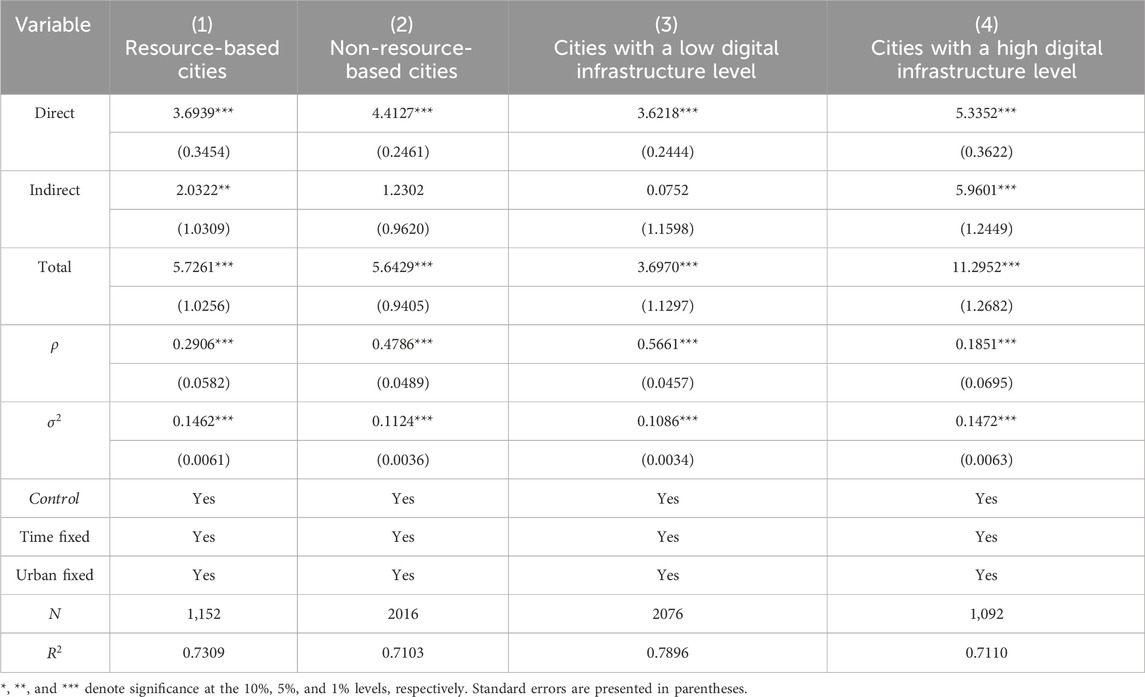
Following the National Sustainable Development Plan for Resource-based Cities (2013–2022), this article splits the samples into 96 resource-based cities and 168 non-resource-based cities. Results from the regression are shown in columns (1) and (2) of Table 16. In resource-based cities, the coefficients of both direct and indirect effects are markedly positive, signifying that the development has a notable role in driving in the city and can also influence the improvement of in neighboring regions via the spillover effect. In non-resource city regions, the exhibits statistically meaningful direct impacts on ; however, its spillover effects, although positive, fails to pass the significance test. This indicates that the spatial spillover effects of the have not been fully realized, possibly due to the “core city siphoning effect” masking the indirect effects.
5.4.2 Heterogeneity of digital infrastructure levels
Digital infrastructure constitutes the base for development and stands as a crucial impetus for the modernization of the ecological environment governance system and capabilities. Varied levels of digital infrastructure might exert an influence on the spatial spillover effects of the . To gauge digital infrastructure development, this research employs a set of metrics: the number of Internet broadband access users per hundred people, the number of mobile phone users per hundred inhabitants, and the density of long-distance optical cables (Fan and Shen, 2025). The entropy approach is adopted for carrying out the measurement. Taking the average digital infrastructure level in the sample observation period as a standard, cities are categorized into 173 with low and 96 with high digital infrastructure. The outcomes are exhibited in columns (3) and (4) of Table 16. For cities with either low or high digital infrastructure levels, the delivers a significant direct promoting effect on . For cities with low digital infrastructure standards, the indirect effect is positive but fails to satisfy the significance test, while the indirect effect in cities with high digital infrastructure is markedly positive. The likely cause is that more advanced digital infrastructure, through a networked structure, can enhance the interconnection among industries and enterprises (Deng et al., 2023), optimize resource allocation, facilitate the breaking of geographical distance constraints between regions, promote better spatial resource allocation of factors, and also help change the traditional innovation model of the entities in this city, forming resource aggregation and scale effects, and further empowering the development of .
6 Conclusions and suggestions
6.1 Research summary
This article adopts a digital empowerment perspective and leverages panel data from 264 Chinese prefecture-level cities from 2011 to 2022. It establishes an assessment index system for the level based on the two aspects of and . It uses fixed-effects models, mediating models, dynamic threshold models, and spatial Durbin models to probe the impact of the and its two major systems of and on . The primary conclusions follow: (1) The delivers a notable positive effect on , and this conclusion holds following the execution of multiple robustness tests. Concerning regional heterogeneity, the boosting influence of on presents the characteristics of western region > central region > eastern region, non-resource-based cities > resource-based cities, and cities with a weaker innovation foundation > cities with a better innovation foundation. (2) The two subsystems of , and , both play a marked positive role in , and delivers a stronger promotional impact on . (3) Under the constraints of the , , and , has a nonlinear impact on , and both exhibit the characteristics of “marginal increase.” That is, as the , and keep advancing, their promoting effects on gradually increase. (4) The can promote the advancement of by addressing the issue of resource mismatch. (5) exerts a positive spatial spillover influence on . It can both improve in the local area and foster the growth of in nearby regions.
6.2 Policy suggestions
1. Based on regional development differences, heterogeneous governance strategies should be implemented. Previous studies have found that the has different promoting effects on in different geographical locations, resource endowments, and levels of innovation foundation. Thus, the government ought to design tailored policies by referencing each city’s geographical position, resource endowment, and innovation foundation. For cities located in the central and western regions, resource-based cities, and those with a relatively weak foundation for innovation, endeavors should be devoted to accelerating the advancement of digital infrastructure and the process, providing the necessary material and technological foundation for a deeper integration of the and the real economy. Simultaneously, digital transformation will be implemented for key industries and key enterprises, starting from individual cases and gradually achieving the digital transition and industrial upgrading of the entire economy. This will facilitate the balanced development of and and help attain the “carbon neutrality” goal. Cities in the eastern region, non-resource-based cities, and those with a strong foundation for innovation, given their digital infrastructure is comparatively advanced, should not only accelerate the development of but also further deepen the integration depth and breadth of the with the real economy and fully leverage the environmentally friendly advantages of the .
2. Drive the deep progression of . Previous studies have found that has a stronger promoting effect on than . Consequently, there is a necessity to further boost the progression of and better leverage its role in facilitating . Reinforcing the supply of relevant technologies is necessary to advance the growth of the digital industry. This involves intensifying efforts in core technology R&D, building digital industrial clusters, and upgrading digital infrastructure. We should promote the establishment of new digital infrastructure, such as information network upgrades, cloud-network synergy optimization, and deep integration of computing and networks, and improve the basic institutional framework of the data element market, activate the value of data elements, and unleash the vitality of data elements. A national cluster of digital technology laboratories should be established, with the government taking the lead and leading enterprises serving as the core, to tackle key digital technologies and cutting-edge technologies, providing solid technical support for promoting .
3. Strengthen cooperation and exchanges among cities, and promote coordinated development of cities. Previous studies have found that exerts a positive spatial spillover influence on . Therefore, it is necessary to cultivate a digital economic development model that promotes cross-regional collaboration to enhance communication and cooperation among cities in order to alleviate the imbalance in regional progress. On the one hand, government departments should inspire enterprises inside and outside the region to build digital service platforms, jointly carry out technology development, actively share transformation experience, cooperate in digital projects, and form a coordinated development model for regional development by promoting cooperation among enterprises and linkage of industry associations. On the other hand, government departments should build an open policy environment and service system, formulate trans-regional development plans, clarify the positioning and development direction of each region, and form a coordinated development model of across time and space. When formulating management policies, it is important to give due consideration to the radiation and leading influence of high-level neighboring cities on the target city. We should also strengthen cooperation and exchanges with high-level regions, such as leveraging the radiation and leading role of cities with high development levels, like Shanghai and Nanjing, on other cities that are developing more slowly.
6.3 Deficiency and prospect
Although this article makes a certain supplement to the lack of relevant research on and , it also offers a theoretical reference for the research on the impact of on , albeit its limitations require further attention. (1) This study takes the panel data of Chinese cities as the research sample. Although it can provide certain references for enabling the to boost the level of , it does not involve comparative studies in other regions. In the future, more representative economic belts or economic circles like the Yangtze River Economic Belt or the Beijing–Tianjin–Hebei region can be selected as samples for empirical research to strengthen the practical value of the research outcomes. (2) The measurement index system built around 264 cities in China and the measurement model built are designed for the research samples of this article. The conclusion must be further verified by more empirical data.
Data availability statement
The datasets presented in this article are not readily available because the disclosure of the materials analyzed during the current study is subject to the restrictions under an ongoing project. The corresponding author is willing to share the datasets upon any reasonable request under necessary confidentiality agreements. Requests to access the datasets should be directed to Yiming Chen YzU1MzMyMDI1QDE2My5jb20=.
Author contributions
YG: Formal Analysis, Investigation, Methodology, Supervision, Writing – original draft, Writing – review and editing. CL: Conceptualization, Data curation, Funding acquisition, Methodology, Resources, Validation, Visualization, Writing – review and editing. YC: Conceptualization, Methodology, Software, Supervision, Writing – review and editing.
Funding
The author(s) declare that no financial support was received for the research and/or publication of this article.
Conflict of interest
The authors declare that the research was conducted in the absence of any commercial or financial relationships that could be construed as a potential conflict of interest.
Generative AI statement
The author(s) declare that no Generative AI was used in the creation of this manuscript.
Any alternative text (alt text) provided alongside figures in this article has been generated by Frontiers with the support of artificial intelligence and reasonable efforts have been made to ensure accuracy, including review by the authors wherever possible. If you identify any issues, please contact us.
Publisher’s note
All claims expressed in this article are solely those of the authors and do not necessarily represent those of their affiliated organizations, or those of the publisher, the editors and the reviewers. Any product that may be evaluated in this article, or claim that may be made by its manufacturer, is not guaranteed or endorsed by the publisher.
Footnotes
1https://www.gov.cn/yaowen/liebiao/202403/content_6939153.htm
2https://www.most.gov.cn/xxgk/xinxifenlei//fdzdgknr/qtwj/qtwj2022/202208/W020220817583603511166.pdf
References
Anselin, L. (2001). Spatial effects in econometric practice in environmental and resource economics. Amer. J. Agr. Econ. 83 (3), 705–710. doi:10.1111/0002-9092.00194
CrossRef Full Text | Google Scholar
Batrancea, L. M., and Tulai, H. (2022). Thriving or surviving in the energy industry: lessons on energy production from the European economies. Energies 15, 8532. doi:10.3390/en15228532
CrossRef Full Text | Google Scholar
Bowman, J. P. (1996). The digital economy: Promise and peril in the age of networked intelligence. Educom. Rev. 10, 69–71. doi:10.5465/ame.1996.19198671
CrossRef Full Text | Google Scholar
Cao, S., Nie, L., Sun, H., Sun, W., and Taghizadeh-Hesary, F. (2021). Digital finance, green technological innovation and energy-environmental performance: evidence from China’s regional economies. J. Clean. Prod. 327, 129458. doi:10.1016/j.jclepro.2021.129458
CrossRef Full Text | Google Scholar
Chang, T., Xu, Y., Yu, H., Wu, H., and Xue, Y. (2021). What is the role of telecommunications infrastructure construction in green technology innovation? A firm-level analysis for China. Energy Econ. 103, 105576. doi:10.1016/j.eneco.2021.105576
CrossRef Full Text | Google Scholar
Chang, X., Fu, K., and Conteh, M. (2025). How digitalization impacts the high-quality development of the manufacturing industry: evidence from China. Sustainability 17, 5586. doi:10.3390/su17125586
CrossRef Full Text | Google Scholar
Deng, X., Guo, M., and Liu, Y. (2023). Digital economy development and the urban-rural income gap: evidence from Chinese cities. PLOS ONE 18 (2), e0280225. doi:10.1371/journal.pone.0280225
PubMed Abstract | CrossRef Full Text | Google Scholar
Dian, J., Song, T., and Li, L. (2024). Facilitating or inhibiting? Spatial effects of the digital economy affecting urban green technology innovation. Energy Econ. 129, 107223. doi:10.1016/j.eneco.2023.107223
CrossRef Full Text | Google Scholar
Fan, Y., and Shen, X. (2025). Research regarding the impact mechanism of digital economy development on economic resilience—Mediating effect based on upgraded industries. Sustainability 17, 5749. doi:10.3390/su17135749
CrossRef Full Text | Google Scholar
Farbmacher, H., Huber, M., Lafférs, L., Langen, H., and Spindler, M. (2022). Causal mediation analysis with double machine learning. Econ. J. 25 (2), 277–300. doi:10.1093/ectj/utac003
CrossRef Full Text | Google Scholar
Ghasemaghaei, M., and Calic, G. (2020). Assessing the impact of big data on firm innovation performance: big data is not always better data. J. Bus. Res. 108, 147–162. doi:10.1016/j.jbusres.2019.09.062
CrossRef Full Text | Google Scholar
Gong, Y., and Xiao, Y. (2024). Impact of sci-tech finance policy on carbon neutrality technology innovation. China Popul. Resour. Environ. 34 (10), 66–79. doi:10.12062/cpre.20240719
CrossRef Full Text | Google Scholar
Hall, H. B., Moncada-Paternò-Castello, P., Montresor, S., and Vezzani, S. (2016). Financing constraints, R&D investments, and innovative performances: new empirical evidence at the firm level for Europe. Econ. Innov. New Tech. 25 (3), 183–196. doi:10.1080/10438599.2015.1076194
CrossRef Full Text | Google Scholar
Han, D., Lu, K., and Liu, P. (2025). Multiplication of number and quality rise: data elements enable low-carbon innovation. Humanit. Soc. Sci. Commun. 12 (1), 810–817. doi:10.1057/s41599-025-05194-z
CrossRef Full Text | Google Scholar
Han, J., Zheng, W., Cai, H., Ming, Q., Yan, X., Fu, Y., et al. (2025). A study of the spatial spillover effects and mechanisms of the digital economy on tourism carbon neutrality ability. Environ. Dev. Sustain. doi:10.1007/s10668-025-06293-2
CrossRef Full Text | Google Scholar
Hsieh, C., and Klenow, J. P. (2009). Misallocation and manufacturing TFP in China and India. Q. J. Econ. 124 (4), 1403–1448. doi:10.1162/qjec.2009.124.4.1403
CrossRef Full Text | Google Scholar
Hou, J., Li, H., and Fu, Y. (2025). Study on the nonlinear mechanisms and spatial effects of the digital economy on urban carbon emissions in the Yangtze River Delta region. Ecol. Economy 41 (07), 30–40+48.
Google Scholar
Huang, X., Zhou, J., and Zhou, Y. (2022). Digital economy’s spatial implications on urban innovation and its threshold: evidence from China. Complexity 2022, 3436741–25. doi:10.1155/2022/3436741
CrossRef Full Text | Google Scholar
Huang, X., Zhang, S., Zhang, J., and Yang, K. (2023). Research on the impact of digital economy on regional green technology innovation: moderating effect of digital talent aggregation. Environ. Sci. Pollut. Res. Int. 30 (29), 74409–74425. doi:10.1007/s11356-023-27279-5
PubMed Abstract | CrossRef Full Text | Google Scholar
Jin, F., Qi, Z., and Liang, Y. (2021). Big data, financial industry agglomeration and green technological innovation. Rev. Econ. Manage. 37 (04), 97–112. doi:10.13962/j.cnki.37-1486/f.2021.04.008
CrossRef Full Text | Google Scholar
Kim, D., and Lin, S. (2017). Natural resources and economic development: new panel evidence. Environ. Resour. Econ. 66, 363–391. doi:10.1007/s10640-015-9954-5
CrossRef Full Text | Google Scholar
Lane, N. (1999). Advancing the digital economy into the 21st century. Inf. Syst. Front. 1, 317–320. doi:10.1023/A:1010010630396
CrossRef Full Text | Google Scholar
Lesage, J. P., and Pace, R. K. (2009). Introduction to spatial econometrics. Boca Raton, FL: CRC Press.
Google Scholar
Li, X., and Yue, S. (2024). Blessing or curse? The role of digital technology innovation in carbon emission efficiency. J. Environ. Econ. Manage. 365, 121579. doi:10.1016/j.jenvman.2024.121579
PubMed Abstract | CrossRef Full Text | Google Scholar
Ling, S., Gao, H., and Yuan, D. (2024). Catalytic role of the digital economy in fostering corporate green technology innovation: a mechanism for sustainability transformation in China. Econ. Anal. Pol. 84, 278–292. doi:10.1016/j.eap.2024.09.005
CrossRef Full Text | Google Scholar
Lu, Y., Zhuang, J., Yang, C., Li, L., and Kong, M. (2025). How the digital economy promotes urban-rural integration through optimizing factor allocation: theoretical mechanisms and evidence from China. Front. Sustain. Food Syst. 9, 1494247. doi:10.3389/fsufs.2025.1494247
CrossRef Full Text | Google Scholar
Luo, S., Yimamu, N., Li, Y., Wu, H., Irfan, M., and Hao, Y. (2023). Digitalization and sustainable development: how could digital economy development improve green innovation in China? Bus. Strat. Environ. 32 (4), 1847–1871. doi:10.1002/bse.3223
CrossRef Full Text | Google Scholar
Lv, T., Geng, C., Fu, S., Zhao, Q., Hu, H., and Zhang, X. (2025). Exploring the impact of the digital economy on carbon emission intensity: a case study of the urban agglomeration in the middle reaches of the yangtze river. Environ. Dev. Sustain. doi:10.1007/s10668-025-06436-5
CrossRef Full Text | Google Scholar
Niu, H., and Liu, Z. (2021). Measurement on carbon lock-in of China based on RAGA-PP model. Carbon Manage 12 (5), 451–463. doi:10.1080/17583004.2021.1966513
CrossRef Full Text | Google Scholar
Shi, Y., Zhang, T., and Jiang, Y. (2023). Digital economy, technological innovation and urban resilience. Sustainability 15 (12), 9250. doi:10.3390/su15129250
CrossRef Full Text | Google Scholar
Song, M., Fisher, R., and Kwoh, Y. (2019). Technological challenges of green innovation and sustainable resource management with large scale data. Technol. Forecast. Soc. Change 144 (144), 361–368. doi:10.1016/j.techfore.2018.07.055
CrossRef Full Text | Google Scholar
Song, S., Wen, J., Li, Y., and Li, L. (2024). How does digital economy affect green technological innovation in China? New evidence from the “Broadband China” policy. Econ. Anal. Pol. 81, 1093–1112. doi:10.1016/j.eap.2024.01.008
CrossRef Full Text | Google Scholar
Tan, L., Yang, Z., Irfan, M., Jian Ding, C., Hu, M., and Hu, J. (2024). Toward low-carbon sustainable development: exploring the impact of digital economy development and industrial restructuring. Bus. Strat. Environ. 33, 2159–2172. doi:10.1002/bse.3584
CrossRef Full Text | Google Scholar
Takalo, S. K., Tooranloo, H. S., and Parizi, Z. S. (2021). Green innovation: a systematic literature review. J. Clean. Prod. 279, 122474. doi:10.1016/j.jclepro.2020.122474
CrossRef Full Text | Google Scholar
Tapscott, D. (1996). The digital economy: promise and peril in the age of net-worked intelligence. New York: McGraw-Hill.
Google Scholar
Wang, H., and Guo, X. (2025). The impact of resource misallocation on green technology innovation: evidence from 288 cities in China. Humanit. Soc. Sci. Commun. 12, 823. doi:10.1057/s41599-025-05225-9
CrossRef Full Text | Google Scholar
Wang, D., and Qi, Y. (2023). The spatial mechanism of the digital economy enabling dual circulation development: from the perspectives of digital industrialization and industrial digitalization. Foreign Econ. manage. 45 (09), 3–21. doi:10.16538/j.cnki.fem.20221122.401
CrossRef Full Text | Google Scholar
Wang, L., and Shao, J. (2023). Digital economy, entrepreneurship and energy efficiency. Energy 269, 126801. doi:10.1016/j.energy.2023.126801
CrossRef Full Text | Google Scholar
Wang, Q., and Wei, Y. (2023). Research on the influence of digital economy on technological innovation: evidence from manufacturing enterprises in China. Sustainability 15, 4995. doi:10.3390/su15064995
CrossRef Full Text | Google Scholar
Wang, C., Liu, T., Zhu, Y., Lin, M., Chang, W., Wang, X., et al. (2022). Digital economy, environmental regulation and corporate green technology innovation: evidence from China. Int. J. Environ. Res. Public Health 19 (21), 14084. doi:10.3390/ijerph192114084
PubMed Abstract | CrossRef Full Text | Google Scholar
Wang, L., Zhao, H., Liu, J., Zhu, H., and Liu, Y. (2024). How does the digital economy affect carbon emissions from tourism? Empirical evidence from China. J. Clean. Prod. 469, 143175. doi:10.1016/j.jclepro.2024.143175
CrossRef Full Text | Google Scholar
Wang, Y., Liu, K., and Liu, F. (2024). Digital economy: a driver for smart carbon reduction. Environ. Dev. Sustain. doi:10.1007/s10668-024-05916-4
CrossRef Full Text | Google Scholar
Wu, J. (2020). A joint test for serial correlation and heteroscedasticity in fixed-T panel regression models with interactive effects. Econ. Lett. 197, 109594. doi:10.1016/j.econlet.2020.109594
CrossRef Full Text | Google Scholar
Wu, H., Hao, Y., and Weng, J. (2019). How does energy consumption affect China’s urbanization? New evidence from dynamic threshold panel models. Energy Pol. 127, 24–38. doi:10.1016/j.enpol.2018.11.057
CrossRef Full Text | Google Scholar
Xie, M., and Zhang, C. (2024). Can linguistic big data empower digital economy?: evidence from China. Econ. Anal. Pol. 84, 1771–1787. doi:10.1016/j.eap.2024.11.007
CrossRef Full Text | Google Scholar
Xu, Q., Zhong, M., and Liu, X. (2022). How does digitalization affect energy? International evidence. Energy Econ. 107, 105879. doi:10.1016/j.eneco.2022.105879
CrossRef Full Text | Google Scholar
Xue, Y., Chang, T., Wu, H., Liu, J., and Hao, Y. (2022). The emerging driving force of energy consumption in China: does digital economy development matter? Energy Policy 165, 112997. doi:10.1016/j.enpol.2022.112997
CrossRef Full Text | Google Scholar
Yang, X., Xu, Y., Razzaq, A., Wu, D., Cao, J., and Ran, Q. (2024). Roadmap to achieving sustainable development: does digital economy matter in industrial green transformation? Sustain. Dev. 32, 2583–2599. doi:10.1002/sd.2781
CrossRef Full Text | Google Scholar
Yuan, R. (2025). The synergistic effect of digital economy and environmental governance on urban green development. Front. Environ. Sci. 13, 1506794. doi:10.3389/fenvs.2025.1506794
CrossRef Full Text | Google Scholar
Yuan, H., Feng, Y., Lee, J., Liu, H., and Li, R. (2020). The spatial threshold effect and its regional boundary of financial agglomeration on green development: a case study in China. J. Clean. Prod. 244, 118670. doi:10.1016/j.jclepro.2019.118670
CrossRef Full Text | Google Scholar
Zhang, Y., Ma, G., Tian, Y., and Dong, Q. (2023). Nonlinear effect of digital economy on urban-rural consumption gap: evidence from a dynamic panel threshold analysis. Sustainability 15, 6880. doi:10.3390/su15086880
CrossRef Full Text | Google Scholar
Zhang, Y., Yang, S., Li, Z., and Cai, M. (2025). Research on digital economy empowering urban low-carbon transition. Sustain. Environ. 10 (3). doi:10.22158/se.v10n3p91
CrossRef Full Text | Google Scholar
Zhao, T., Zhang, Z., and Liang, S. (2020). Digital economy, entrepreneurship, and high-quality economic development: empirical evidence from urban China. J. Manage. World 36 (10), 65–76. doi:10.3969/j.issn.1002-5502.2020.10.006
CrossRef Full Text | Google Scholar
Zheng, H., Wang, Y., and Cai, J. (2025). Bridging green innovation and energy efficiency: the digital economy’s unique role in carbon neutrality. Environ. Dev. Sustain. doi:10.1007/s10668-025-06246-9
CrossRef Full Text | Google Scholar
 Yingying Geng
 Chaoyang Li2