 Yongjun Song1,2
 Huimin Wang3*
 Qingkai Lu4*
 Chen Ma5Jinke Wang4Feng Gan4Siqin Zhang4Haojun Xu4Zimeng Zhao4
- 1Shandong Provincial Map Institute, Jinan, Shandong, China
- 2Qingdao Key Laboratory of Spatial Information Dynamic Perception and Smart Cartography in the Yellow River Basin, Qingdao, Shandong, China
- 3Shandong Institute of Land Spatial Data and Remote Sensing Technology, Jinan, Shandong, China
- 4Academy of Ecological Civilization Development for JING-JIN-JI Megalopolis, Tianjin Normal University, Tianjin, China
- 5School of Astronautics, Research Center of Satellite Technology, Harbin Institute of Technology, Harbin, China
Rapid urbanization reshapes regional water resources by reconfiguring land systems and altering the balance between runoff and infiltration. Empirical evidence that jointly accounts for human and natural drivers while addressing spatial dependence remains limited. Using harmonized 1-km data for the Beijing–Tianjin–Hebei region during 2014–2023, including land use from CLCD, nighttime lights from VIIRS, and precipitation, this study combines Sen–Mann–Kendall trend detection with spatial models estimated by Integrated Nested Laplace Approximation. The results show that urbanization, measured by nighttime lights, has a consistently stronger association with water resource related land change than precipitation. The interaction between precipitation and nighttime lights is place specific and positive in Beijing and Shijiazhuang, with coefficients of 0.0622 and 0.1579, which indicates amplification of urbanization linked land conversion under wetter conditions. The integrated framework distinguishes human and climatic signals and reveals spatial heterogeneity that is relevant to water sensitive urban planning.
1 Introduction
Water is an essential resource for human survival and the evolution of ecosystems, playing a critical role in the sustainable development of socio-economic systems (Akhtar et al., 2021). In the context of a global population exceeding eight billion, both developed and developing countries face severe water shortages and pollution, which have become major threats to public life and health (Nayan et al., 2020). The growing imbalance between water supply and demand is becoming increasingly evident, particularly in regions undergoing rapid urbanization. The conflict between water supply and the demands of urban expansion has become a key bottleneck limiting sustainable development (Feng et al., 2022). Urbanization, as a key feature of modern societal development, is not only a manifestation of economic growth and population concentration but also a process that brings about profound changes in resource utilization and the structure of the ecological environment. Rapid urbanization is often accompanied by shifts in land use and environmental degradation, particularly having a far-reaching impact on the allocation and utilization of water resources (Garg et al., 2019; Wei et al., 2020; Zhuge et al., 2023). Factors such as land use changes, population mobility, and infrastructure development during the urbanization process significantly impact various stages of the water cycle (Kalfas et al., 2024). Specifically, urbanization leads to increased water consumption in urban areas, often resulting in reduced river and lake water levels, as well as higher wastewater discharge. These changes not only directly affect water quality but may also contribute to the degradation of ecosystems (Camara et al., 2019; Cheng et al., 2022). At the same time, the increase in chemical concentrations due to water pollution can lead to the outbreak of widespread diseases and fatalities. The interplay between urbanization, water scarcity, and water pollution is closely interrelated, forming a complex vicious cycle (Wang et al., 2024; Yao et al., 2025b). Traditional urbanization studies often rely on government statistical data, which lack timeliness and accuracy, making it difficult to monitor urbanization spatially in real-time. The breakthroughs in remote sensing technology have provided a new paradigm for urbanization monitoring, offering more direct and frequent temporal coverage of the study areas (Liu et al., 2024; Yao et al., 2022c; Yao et al., 2022a). This approach has shown superior performance in detecting urban sprawl and urban areas (Wang et al., 2022). Compared to the limitations of spatial and temporal resolution in traditional statistical data, nighttime remote sensing data, by capturing the characteristics of human activity light sources, can more accurately represent the spatial-temporal heterogeneity of urban built-up area expansion (Li et al., 2020; Yao et al., 2024b). The Defense Meteorological Satellite Program’s Operational Line Scanner (DMSP/OLS) nighttime imagery, as an early form of nighttime remote sensing data, has been widely used for urbanization monitoring. DMSP/OLS data records the nighttime light emitted from the Earth’s surface, capturing light sources from both human activities and natural phenomena, with a long historical record spanning over 30 years. This data source has demonstrated unique advantages in large-scale urban area monitoring, urban sprawl tracking, and population density inversion, making it particularly suitable for monitoring historically established and large-scale urban regions (Hasan et al., 2019). With advancements in technology, the introduction of NPP/VIIRS data has significantly improved the spatial-temporal resolution of urbanization monitoring. Compared to DMSP/OLS, NPP/VIIRS offers higher spatial resolution and more frequent observation cycles, allowing for a more detailed capture of nighttime light variations. This data has been widely applied in areas such as urban expansion, land use change, and regional economic activity monitoring (Xu et al., 2020; Yang et al., 2019; Yao et al., 2025a).
The Beijing-Tianjin-Hebei (BTH) region has long been subject to rigid water resource constraints. The per capita water resources in the Haihe River Basin have consistently remained at approximately 250–300 m3, significantly lower than both the national and global averages (Xu et al., 2020). In Beijing, the per capita water availability has long been below 200 m3 (recently around 150 m3), far beneath the international threshold of “absolute water scarcity.” Against the backdrop of continuously growing demand, the North China Plain has experienced long-term groundwater over-extraction and declining water tables. Related studies, based on GRACE data, indicate significant groundwater depletion in the region (Wang et al., 2024). To alleviate the supply-demand imbalance, the South-to-North Water Diversion Middle Route Project has been supplying water to northern China since its operation in 2014. By early 2022, it had transferred over 50 billion m3 of water, becoming a critical support for regional water supply security. During the same period, the national government implemented the “Strictest Water Resources Management” policy and the “Three Red Lines” control system, imposing binding constraints on total water withdrawal and usage efficiency. This further underscores the institutional context of water governance in BTH. In summary, the BTH region exemplifies a structural constraint characterized by supply-demand imbalance, groundwater over-extraction, and inter-basin water transfer. It serves as a typical area for identifying the impact of urbanization and hydroclimatic conditions on land changes related to water resources and their spatial heterogeneity, as well as a representative empirical context for regional governance practices such as “determining urban development based on water capacity.” In the process of urbanization, accurately assessing its impact on the environment, particularly on water resources, is a crucial issue in current research (Ngondo et al., 2021; Yao et al., 2024a; Zhai et al., 2022). To better understand these changes, researchers typically rely on trend analysis and spatial analysis methods to reveal the spatial-temporal evolution patterns of urbanization (Yao et al., 2022b). Trend analysis methods are used to identify long-term trends in variables over time, while spatial analysis methods help to uncover the regional differences in the impact of urbanization (Bao and He, 2019; Zhao et al., 2018). As research demands continue to grow, efficiently processing complex spatiotemporal data has become a key challenge in analyzing the urbanization process.
Trend analysis methods reveal long-term change patterns by calculating the trend of a variable over time. Linear regression models, particularly those based on the computation of time-series slopes, are commonly used trend analysis tools. These models can effectively capture long-term trends within a given time period and help identify key temporal points in the urbanization process, providing scientific evidence for policy and resource management (Hu et al., 2021; Sohail et al., 2019).
In spatial analysis, the Geographic Weighted Regression (GWR) model is commonly used to handle spatial heterogeneity and reveal spatial variations at the local level. However, GWR has limitations in dealing with complex spatial autocorrelation structures, especially when working with large-scale datasets, where computational efficiency tends to be low (Huang et al., 2010). Although Bayesian hierarchical models can effectively address spatial autocorrelation and uncertainty, they suffer from high computational complexity, particularly when applied to large datasets, creating a significant bottleneck for practical applications. To overcome the computational challenges of traditional Bayesian models, the Integrated Nested Laplace Approximation (INLA) method was introduced (Niekerk et al., 2022; Palmí-Perales et al., 2022; Rue et al., 2009). INLA constructs a hierarchical random effects model, maintaining the advantages of Bayesian inference while significantly improving computational efficiency. Its use of approximate Laplace approximation allows for the rapid calculation of posterior distributions, greatly enhancing the efficiency of analyzing large-scale datasets (Brownscombe et al., 2019; Lindgren and Rue, 2015; Poggio et al., 2016). INLA is particularly well-suited for spatial analysis, as it effectively captures spatial dependencies, providing precise parameter estimation and inference results. It shows remarkable advantages when dealing with multi-dimensional, large-scale, and multi-scale data (Achieng and Zhu, 2021; Romero et al., 2023). In urbanization studies, the INLA method enables the simultaneous consideration of spatial heterogeneity and temporal trends, offering a powerful analytical tool for understanding the complex spatial dynamics of urbanization and its impact on water resources, land use, and environmental quality (Gong et al., 2021; Satria et al., 2021; Schaeffer et al., 2024; Wood, 2019). The Integrated Nested Laplace Approximation (INLA) framework was selected for its ability to simultaneously model spatial dependence and temporal structures in multi-year, kilometer-scale grid data, effectively addressing parameter inconsistency and estimation bias. This approach enables the specification and testing of “urbanization × precipitation” interaction effects within a unified model, facilitating examination of how climatic conditions modulate urbanization impacts. Additionally, the stochastic partial differential equation (SPDE) method employed in INLA constructs sparse precision matrices that substantially improve computational efficiency, making it particularly suitable for high-resolution, multi-source data integration scenarios such as the Beijing-Tianjin-Hebei (BTH) region.
This study asks how rapid urbanization affects regional water resources, where water-resource change is proxied by land-use change (ΔLULC) and urbanization by nighttime lights (NTL) dynamics. We (i) characterize spatiotemporal patterns of ΔLULC; (ii) estimate the marginal effect of urbanization (NTL) on ΔLULC; (iii) incorporate precipitation to examine the joint human–natural influence in rapidly urbanizing cities and its spatial heterogeneity; and (iv) keep the narrative centered on the urbanization pathway while reporting precipitation as a complementary, robustness-oriented factor. The research is in line with the national-level policy orientations such as “coordinated development of the Beijing-Tianjin-Hebei region” and “water-based urban development, sponge cities, and protection of blue and green corridors”, aiming to provide evidence support for the optimization of urban space and the resilient construction of infrastructure under the rigid constraints of water resources.
2 Study area overview and data
2.1 Overview of the study area
The Beijing-Tianjin-Hebei region is located between longitudes 113°04′–119°53′and latitudes 36°01′–42°37′, in the northern part of the North China Plain, as shown in Figure 1. This region includes 11 prefecture-level cities from Beijing, Tianjin, and Hebei Province. It is bordered by Liaoning, Inner Mongolia, Shanxi, Henan, and Shandong provinces, and to the east, it faces the Bohai Sea. The area has a typical warm temperate semi-humid, semi-arid continental monsoon climate, characterized by cold, dry winters with little snow and hot, rainy summers. The topography features a northwest high and southeast low gradient. The Beijing-Tianjin-Hebei region lies within the Haihe River Basin in China, and the main rivers include the Chaobai River, Jiyun River, Yongding River, and Daqing River (Li et al., 2018).
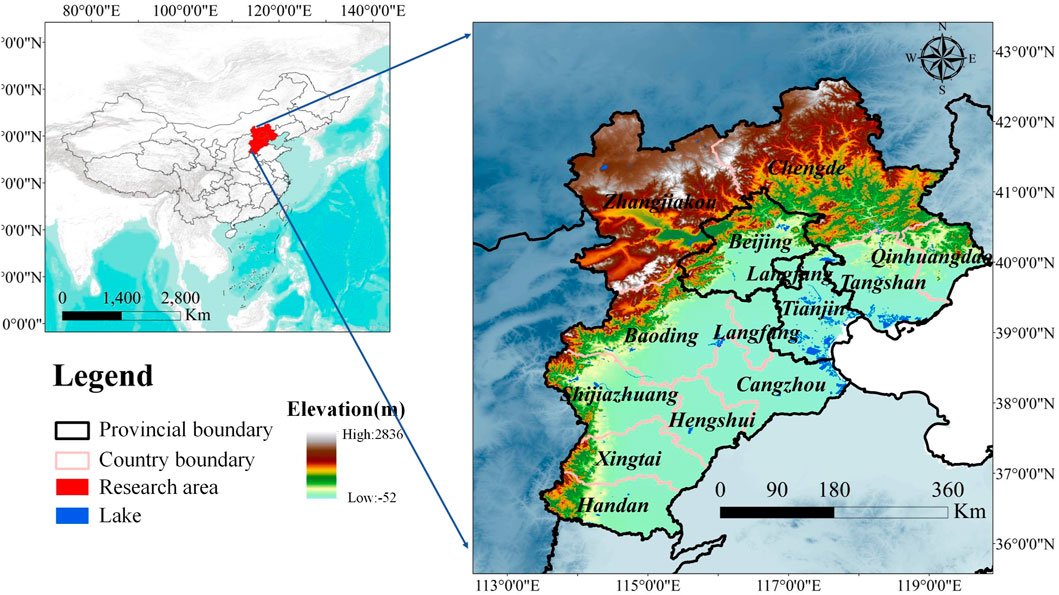
Figure 1. Overview of the study area.
BTH is one of China’s three world-class urban agglomerations (together with the Yangtze River Delta and Pearl River Delta) and has undergone rapid urban development and built-up expansion over the past decade, making it a nationally significant testbed for urbanization research. At the same time, it sits in northern China’s water-stressed zone: the Haihe River Basin is widely documented as one of the most water-scarce basins in the country, with per-capita water availability on the order of ∼300 m3—far below national and global averages; this chronic scarcity underpins long-standing groundwater depletion and the need for large-scale inter-basin transfers. Since late 2014, the central route of the South-to-North Water Diversion has delivered water to Beijing and Tianjin, highlighting both the severity of local constraints and the policy salience of water-related land-use change in this urban cluster. The period from 2014 to 2023 has been an important phase for the coordinated development of Beijing, Tianjin, and Hebei. During this period, the region has seen significant improvements in both economic scale and industrial structure. In terms of economic output, the regional GDP has experienced leapfrog growth, increasing from 5.5 trillion yuan in 2013 to 10.4 trillion yuan in 2023, surpassing five trillion-yuan milestones over the 10 years, with an average annual growth rate of approximately 5.5%. In terms of industrial structure, the regional economy has undergone continuous optimization and upgrading, with the ratio of the three major industries shifting from 6.2:35.7:58.1 in 2013 to 4.6:27.7:67.7 in 2023, with the value added by the service sector rising by nearly 10 percentage points. Moving forward, the region will continue to promote the “six chains and five clusters” industrial collaborative development, building a horizontally coordinated and vertically integrated joint working system. This will help resolve the “bottleneck” issues in industrial coordination and foster new achievements in the coordinated development of the Beijing-Tianjin-Hebei industries (Bao and He, 2019).
2.2 Motivation for satellite datasets
Our objective is to quantify how rapid urbanization reshapes water-resource–related land dynamics through a hydrology-focused lens centered on impervious surfaces and water bodies. This requires (i) spatially exhaustive, temporally consistent observation of land-surface endpoints at regional scale and (ii) city-comparable drivers representing human and natural influences. Satellite datasets meet these needs with three advantages. Impervious expansion alters infiltration–runoff partitioning, while gains/losses of water surfaces reflect storage and conveyance changes; both are directly observable as land-cover transitions. A national, consistent land-cover product enables us to construct the dependent variable at the 1-km grid and to derive annual trends with uniform rules. VIIRS Day/Night Band nighttime lights provide a stable, radiometrically calibrated indicator of urban activity and built-environment intensity, avoiding saturation and facilitating decade-scale comparability—therefore serving as our human factor proxy. A spatially downscaled 1-km precipitation field supplies the natural factor, capturing hydro-climatic gradients that condition urban effects and enabling a joint (human × natural) assessment in the comprehensive model. All datasets are harmonized to ∼1 km and annual time steps, matching the resolution of our INLA/SPDE specification and typical planning geographies. This common grid reduces cross-product mismatch, limits error propagation from multi-class classification (by focusing on impervious and water), and ensures that results are comparable across cities and years. We acknowledge that satellite proxies are not direct hydrologic measurements and that seasonality may affect small-water detection; these uncertainties are addressed by annual aggregation, typical-area inspection, and explicit modeling of human–natural interactions.
2.3 Study data
The data sources for this study include land use data, nighttime light data, and precipitation data, as shown in Table 1. The CLCD (Annual China Land Cover Dataset) was integrated using the Google Earth Engine (GEE) platform, incorporating all available satellite sensor observation data from 1982 to 2022. This dataset provides an in-depth analysis of the spatiotemporal characteristics of LUCC (Land Use and Land Cover Change) across China, with precise classification results obtained using a random forest classifier. Based on the current land use classification in China, the CLCD categorizes land cover into nine types: cropland, forest, grassland, shrubland, water bodies, ice and snow, barren land, impervious surfaces, and wetlands. This study uses the version 1 Visible Infrared Imaging Radiometer Suite (VIIRS) Day/Night Band (DNB) monthly cloud-free composite nighttime light product. Compared to DMSP/OLS nighttime light data, NPP/VIIRS data has higher spatial resolution, a broader radiometric detection range, and does not suffer from saturation issues. Additionally, NPP/VIIRS data benefits from onboard calibration, enhancing the overall data quality. The monthly precipitation dataset for China is based on the global 0.5° climate data provided by CRU and the high-resolution global climate dataset from WorldClim, downscaled to China using the Delta spatial downscaling method. The dataset has been validated using 496 independent meteorological observation points, ensuring its reliability. The spatial resolution is 0.0083333° (approximately 1 km), covering the period from January 2014 to December 2023. The data is in NETCDF format. Empirically, we proxy water-resource-related change by land-use/land-cover change (ΔLULC) at the grid-cell level, because hydrologically relevant pathways of urbanization—such as impervious-surface expansion altering infiltration and runoff, and the redistribution of water/wetlands—are consistently observable as land-surface transitions at regional scales. The variable of interest is urbanization, represented by nighttime lights (NTL) dynamics from VIIRS, which capture built-environment intensity and expansion. Precipitation is included as a natural background/moderator to quantify human–natural joint influence in rapidly urbanizing cities; the narrative focus remains on the urbanization pathway.
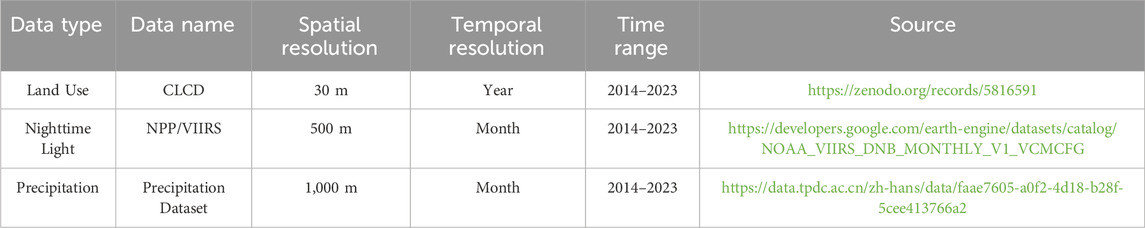
Table 1. Introduction to the study data.
All datasets were first harmonized to a common spatial resolution of 0.008333° (∼1 km) and an annual temporal resolution. CLCD 30 m categorical maps were reprojected and resampled to the 1-km grid using a majority algorithm to form the annual land-use mosaic. For the outcome construction, the water-surface share in each 1-km cell was computed as the ratio of underlying 30 m water pixels within that cell; the dependent variable y is ΔLULC, defined as the year-on-year change in this share and reported in percentage points per year (pp·yr-1). VIIRS DNB monthly composites were aggregated to annual totals (sum of monthly values) and bilinearly resampled to the common 1-km grid. Precipitation was likewise aggregated from monthly to annual totals (mm·yr-1) and snapped to the same 1-km grid.
3 Research methods
The specific technical approach of this study is shown in Figure 2. The process begins by obtaining multi-source remote sensing data: land use data, precipitation data, and nighttime light remote sensing data, which are then processed through various operations to yield the analysis results. Specifically, land use transition matrices are calculated from the land use data to determine the transition relationships between different land types, thus quantifying the land use changes during urbanization. The transition matrix helps analyze the variations in land use types across different years, providing foundational data for subsequent spatial analysis.
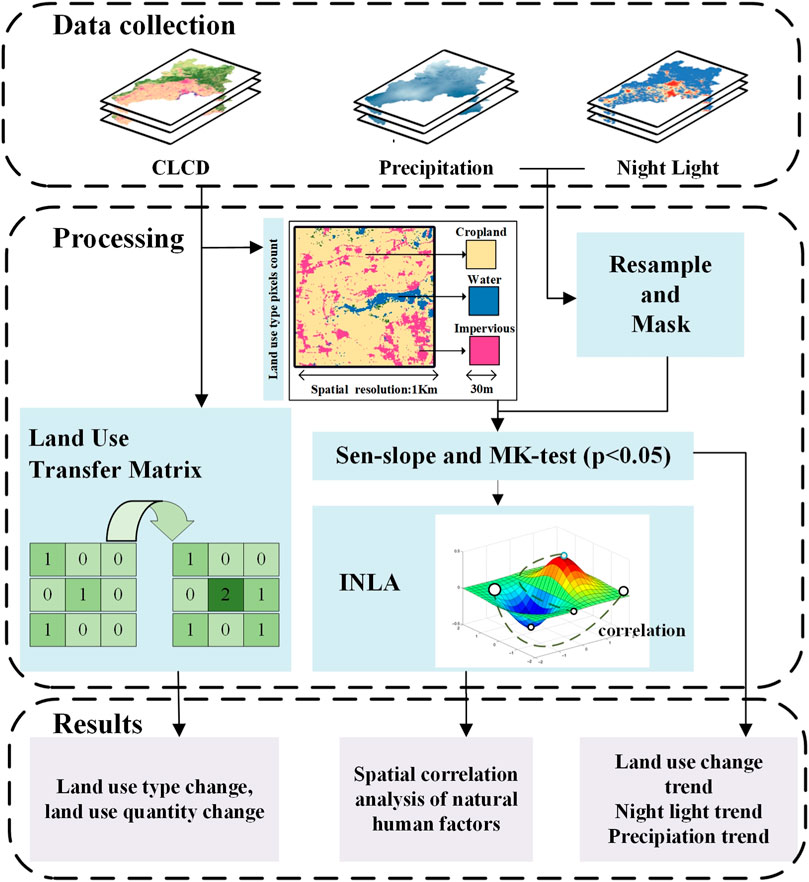
Figure 2. Technology roadmap.
All datasets are first harmonized to a common spatial resolution of 1 km (WGS-84) and to an annual temporal resolution for 2014–2023. CLCD 30 m categorical maps are reprojected and resampled to 1 km using a majority (mode) algorithm appropriate for discrete classes; on this 1 km grid, the impervious-surface share in each cell is computed by counting the underlying 30 m impervious pixels within the cell extent. VIIRS nighttime-light monthly composites are aggregated to calendar-year totals and bilinearly resampled to the same 1 km grid. Monthly precipitation is likewise aggregated to calendar-year totals on the 1 km grid. This harmonization ensures spatial co-registration and strictly comparable annual time stamps across variables. Following this, the Sen–Mann–Kendall (Sen + MK) trend analysis is applied to the annual level series—namely, the impervious-surface share per 1 km cell, the annual nighttime-light totals, and the annual precipitation totals—which allows for the extraction of interannual trend changes in water-related land use, precipitation, and nighttime brightness over time. The Sen-slope method helps identify the magnitude of change in the data, while the MK test (Mann-Kendall test) is used to assess the significance of the trends and determine the reliability of data changes.
The trend results of the three datasets are then subjected to spatial correlation analysis using the INLA method, which can reveal the spatial dependencies between different variables and analyze how natural and human factors jointly influence changes in water resources. The INLA (Integrated Nested Laplace Approximation) method is effective in handling the complex relationships within spatial data, helping to identify the spatial patterns behind water resource changes and their interactions with other environmental factors.
3.1 Land use transfer matrix
The land use transition matrix, as an application of the Markov model in the field of land use change, is a two-dimensional matrix constructed by analyzing changes in the land use status of the same region at different time points. This matrix quantitatively expresses the interactions and transitions between different land types, visually displaying the direction of land use type changes and the corresponding changes in quantity. It provides a powerful tool for understanding the dynamics of land use. The expression of the land use transition matrix is given by Equation 1.
In Equation 1, A represents the area; n is the number of land use types; i and j correspond to the land use types at the beginning and end of the study period, respectively.
3.2 Change trend analysis
This study employs a combined approach of Theil-Sen median analysis and Mann-Kendall (M-K) test to identify trends in the long time series of land use data, nighttime light, and precipitation in the Beijing-Tianjin-Hebei region. The Theil-Sen median analysis is a robust non-parametric statistical method for trend calculation, suitable for trend analysis of long time series data (Fu et al., 2023). The calculation formula is given by Equation 2:
In the Equation 2, β represents the slope of the time series data for land use, nighttime light, and precipitation, indicating the trend of data change. β > 0 indicates an increasing trend, while β < 0 indicates a decreasing trend. The median refers to the median function of the time series.
Due to the lack of statistical significance testing in this method, this study employs the M-K test method for evaluation. The M-K test is also a non-parametric statistical test proposed by Mann et al. The formula for the M-K test is given by Equations 3–6:
In the Equation 3, S represents the test statistic, which follows a normal distribution; Var(S) is the variance of S; sgn is the sign function of the rank sequence; Z is the standard normal statistic. At a significance level of α, when |Z| > Z1-α/2, the time series exhibits significant variability at the α level. In this study, a significance level of 0.05 was chosen, and the results are classified as follows: significant increase (β > 0, P < 0.05), no significant improvement (β > 0, P > 0.05), stable (no change), significant decrease (β < 0, P < 0.05), and no significant decrease (β < 0, P > 0.05).
3.3 Correlation analysis
INLA is an efficient Bayesian approximation inference method, particularly suitable for handling large datasets and complex models (Bakka et al., 2018; Blangiardo et al., 2013). This method combines Gaussian approximation and Laplace approximation to provide both efficient and accurate solutions through analytical approximation calculations. Compared to traditional Markov Chain Monte Carlo (MCMC) methods, the advantage of INLA lies in its faster computational speed and its ability to avoid sample convergence issues, making it especially suitable for Bayesian inference in latent Gaussian models. Latent Gaussian models are widely used in INLA, including general linear models, generalized linear models, generalized additive models, and spatiotemporal models. INLA uses a combination of analytical approximation and sparse matrices to calculate posterior distributions, which not only improves computational efficiency but also avoids the convergence and mixing issues commonly associated with MCMC methods. Stochastic partial differential equations (SPDE) are widely used to model dynamic systems with random properties, particularly in spatial statistics for constructing spatial random processes that describe the uncertainty and complexity of spatial data. Spatiotemporal field modeling is shown in Equation 7.
In this equation,
We represent the spatial random field via the SPDE approach and build a constrained Delaunay mesh over the BTH boundary with a coastal buffer. The mesh uses an inner target edge length of about 10 km, an outer extension of about 25 km, and a 1 km cutoff to merge nearly coincident 1-km centroids. This resolution follows exploratory correlation lengths of several tens of kilometers and balances accuracy with cost. Continuous covariates are standardized. We adopt penalized-complexity (PC) priors: for the spatial field, P (range <30 km) = 0.5 and P (sd > 1) = 0.01; for observation noise, P (sd > 0.5) = 0.01; for the yearly temporal component (random walk of order 1), P (sd > 0.3) = 0.01. Fixed effects, including the precipitation × nighttime-lights interaction, use Normal (0, 5) priors on the standardized scale. Results are robust when halving or doubling the inner edge length and when moderately varying these PC prior scales.
4 Experimental results and analysis
4.1 Spatiotemporal pattern evolution analysis of the Beijing-Tianjin-Hebei region
Figure 3 illustrates the distribution of different land use types from 2014 to 2023. The results show that, with the acceleration of urbanization, significant changes have occurred in the land use types of the Beijing-Tianjin-Hebei region, particularly the reduction of water body coverage and the expansion of urban impervious surfaces. Specifically, the proportion of urban construction land has continuously increased, while natural ecological land such as grasslands, shrubs, and wetlands has gradually decreased. Forest coverage increased during the study period, which may be related to ecological restoration projects in North China. Additionally, the urbanization process in the Beijing-Tianjin-Hebei region exhibits spatial heterogeneity. Core cities such as Beijing and Tianjin have experienced rapid urbanization, while some regions of Hebei have seen slower urbanization, resulting in regional differences in land use patterns.
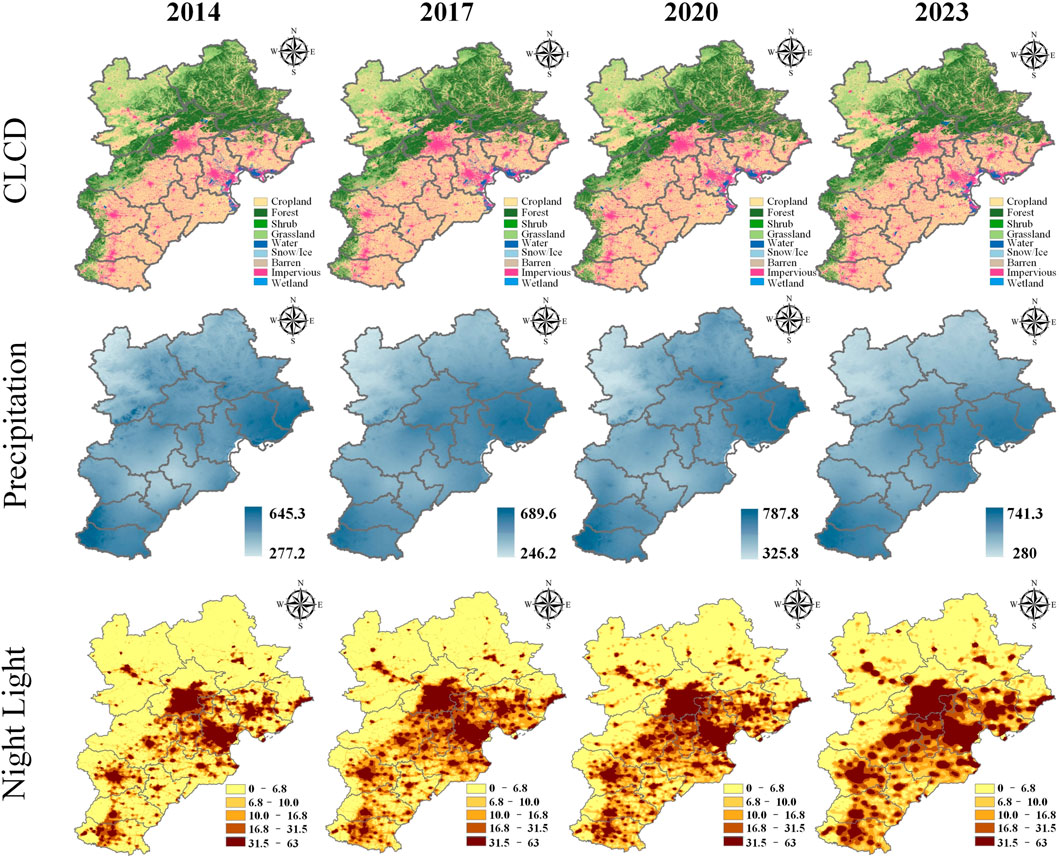
Figure 3. Spatial distribution of land use, annual precipitation, and night light in the Beijing-Tianjin-Hebei region from 2014 to 2023.
From the spatial distribution map of precipitation, it is evident that precipitation in the Beijing-Tianjin-Hebei region is concentrated in the eastern and southern areas, with generally lower precipitation in the western part. The annual precipitation in the region showed a fluctuating upward trend during the study period. In 2014, precipitation ranged from 277.2 to 645.3 mm, rising to 325.8–787.8 mm in 2020, with a slight decrease in 2023. The maximum precipitation in the region was 741.3 mm, still showing a significant increase compared to 2014, indicating a continued trend of regional wetting. This fluctuation may be related to the increased frequency of extreme weather events under global climate change, which aligns with the findings in the IPCC’s Sixth Assessment Report that precipitation variability in the East Asian monsoon region has increased.
Nighttime light data, as a key indicator of urbanization, reflects the intensity of human activity in the region. From Figure 3, it is clear that the intensity of nighttime lights in the Beijing-Tianjin-Hebei region increased significantly from 2014 to 2023, particularly in core cities such as Beijing, Tianjin, and Shijiazhuang in the central and southern parts of the region. During the study period, urbanization in these cities continued to progress. Peripheral cities like Baoding, Handan, and Xingtai also saw some expansion in nighttime light intensity, reflecting the overall trend of rapid urbanization in the Beijing-Tianjin-Hebei region.
Mathematical statistical analysis of land use type data for the Beijing-Tianjin-Hebei region from 2014 to 2023 reveals that the total surface water area in the region has fluctuated little over the period, with significant regional differences across cities (Figure 4b). In particular, cities such as Shijiazhuang, Xingtai, Handan, Baoding, and Beijing have shown notable increases in surface water area, with Beijing and Shijiazhuang experiencing increases of more than 40%. Conversely, Tangshan and Tianjin have seen substantial reductions, while Qinhuangdao also experienced a slight decline. Spatially, surface water improvements are evident in the central and southern regions of Beijing-Tianjin-Hebei, while coastal cities in the east exhibit a prominent degradation trend. As shown in Figure 4c, changes in impervious surface area from 2014 to 2023 also display clear regional heterogeneity in Hebei Province and the two municipalities of Beijing and Tianjin. Chengde saw the largest increase, with a growth rate of 40.30%. Beijing and Zhangjiakou also experienced significant increases, with growth rates of 18.62% and 18.57%, respectively. In contrast, Tianjin and Shijiazhuang had lower growth rates. Notably, Baoding, Cangzhou, Tangshan, and Tianjin showed relatively high increments in impervious surface area. It is worth noting that all cities in the region experienced an increase in impervious surface area, with a total growth rate of 11.91%, indicating that the overall urbanization process in the Beijing-Tianjin-Hebei region is still accelerating.
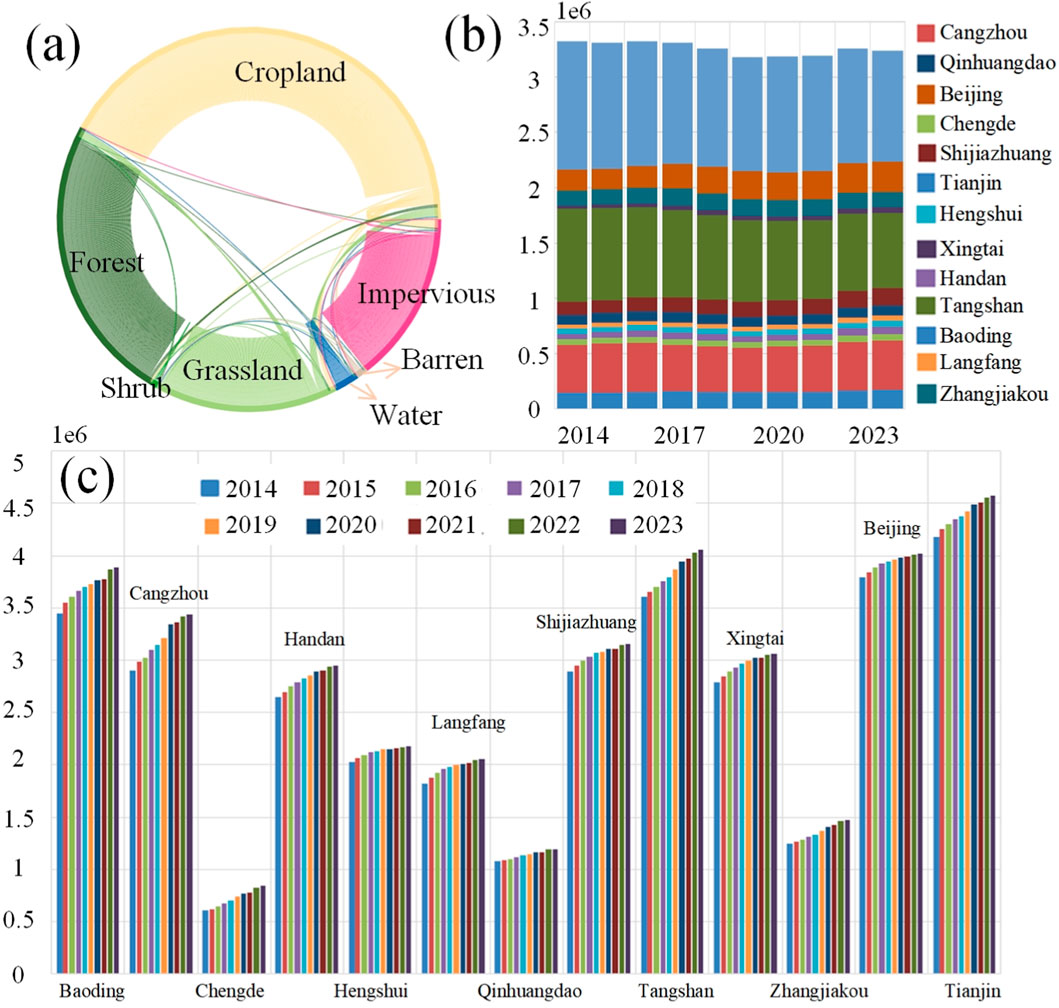
Figure 4. Statistical data chart (a) Land use transfer matrix from 2014 to 2023 (b) Annual surface water distribution in various urban areas of the Beijing-Tianjin-Hebei region (c) Annual impervious water distribution in various cities of the Beijing-Tianjin-Hebei region.
Table 2 presents the land use type transition matrix data for the Beijing-Tianjin-Hebei region from 2014 to 2023. According to Table 2 and Figure 4a, the total area of cropland, forest, and water bodies in the Beijing-Tianjin-Hebei region showed no significant changes from 2014 to 2023. The total area of shrubland, grassland, and impervious surfaces changed by approximately 13%, with the most notable change being a 68.24% increase in barren land. Cropland was reduced by 5,789.84 km2, with 54.9% of it converted to impervious surfaces and 31.5% to grassland. The converted cropland was primarily used for modern urban development and related purposes. A total of 4,826.41 km2 of cropland was converted into other land uses, with 68.4% originating from grassland and 24.6% from forested land. Forestland decreased by 1,543.59 km2 but increased by 3,621.31 km2, resulting in a net increase of 2,077.72 km2, with most of the land being converted from cropland and into grassland. Shrubland decreased by 88.13 km2, with conversions both into and from forestland and grassland, with the area converted from shrubland to grassland being larger than that converted in the opposite direction. Grassland decreased by 6,561.63 km2, with approximately 50% of the land converted into cropland and forestland. It also increased by 2,119.11 km2, with 86.07% of the increase coming from cropland. The total area of water bodies decreased by 74.78 km2, with equal contributions from cropland and impervious surfaces. The land converted into water bodies was predominantly cropland and impervious surfaces, with cropland representing a larger proportion. Barren land decreased by 77.45 km2, with most of the land being converted from water bodies and impervious surfaces, while it was only converted into grassland and water bodies. The total area of impervious surfaces increased by 3,568.56 km2, with only 241.69 km2 of land being converted out, 95% of which was water bodies. The total area converted into impervious surfaces amounted to 3,810.26 km2, with 83.48% originating from cropland.
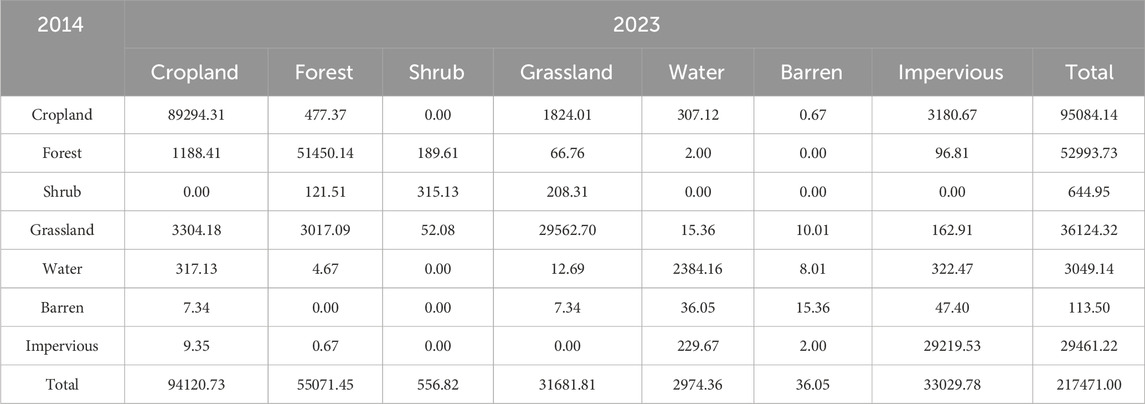
Table 2. Land use transfer matrix in the Beijing-Tianjin-Hebei region from 2014 to 2023 Unit: km2.
Figure 5 illustrates the trends in precipitation and nighttime light changes in the Beijing-Tianjin-Hebei region from 2014 to 2023. As shown in Figure 5a, positive values of precipitation slope are primarily concentrated in the southeastern part of the region, especially in Beijing, Tianjin, Baoding, Cangzhou, and Langfang. These areas not only have high positive slope values but also extensive coverage, indicating that precipitation has been increasing over time in these regions. The region is predominantly flat and close to the ocean, which allows it to receive abundant moisture from the sea, leading to relatively higher precipitation. In contrast, the lowest precipitation slope values are concentrated around the transition zone between Beijing, Zhangjiakou, and Chengde. This area, located at the junction of plains and mountains, experiences a reduction in precipitation over time due to the obstructive effect of the mountains. Figure 5b presents the slope of changes in nighttime lights. The positive values in the nighttime light slope are concentrated in the southeastern part of the region, particularly in Beijing, Tianjin, Shijiazhuang, and Baoding. These areas exhibit the largest distribution of high positive slope values in nighttime light, coinciding with major cities in the Beijing-Tianjin-Hebei region that are densely populated and have extensive impervious surfaces. As a result, the trend in nighttime light changes is particularly prominent. Figure 5c further illustrates the significance of the trend in nighttime light changes. The results show that the regions with significant increases in nighttime light coincide with the areas exhibiting the highest values of precipitation and nighttime light slopes, predominantly located in the southeastern plains of the Beijing-Tianjin-Hebei region. Specifically, areas with an increasing trend in nighttime light are mainly concentrated in the periphery of the urban circles of Beijing, Tianjin, Shijiazhuang, and Baoding, while areas with significant reductions in nighttime light are primarily located at the boundary between Handan and Xingtai, the southern part of Tianjin, and the northern part of Tangshan. This trend suggests a clear expansion of the urban circles of Beijing, Tianjin, Shijiazhuang, and Baoding, and the precipitation in these areas is also showing an increasing trend over time.
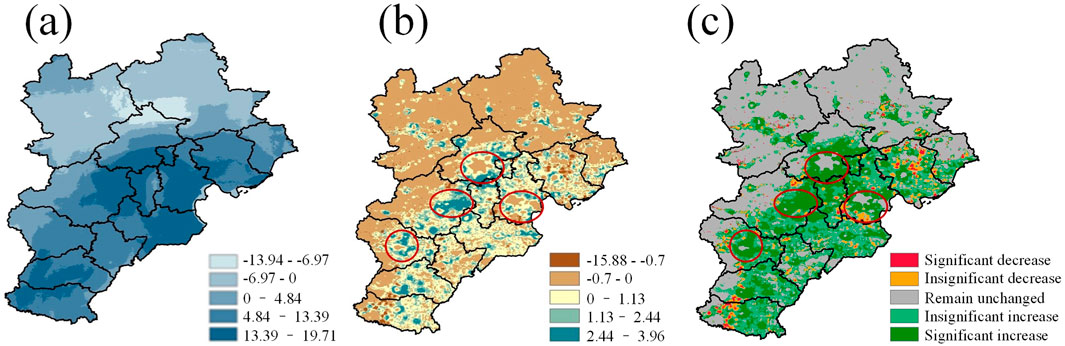
Figure 5. Trend analysis (a) Change slope of precipitation data (b) Change slope of night light data (c) Change trend of night light data.
Given the unique geographic location, economic development level, and population density of Beijing, Tianjin, Shijiazhuang, and Baoding within the Beijing-Tianjin-Hebei region, the performance of these four cities in terms of precipitation and nighttime light changes is regionally representative. To make the city selection transparent and reproducible, we adopt a quantitative criterion based on the Sen–MK classification of annual VIIRS nighttime-light trends at 1-km resolution (2014–2023). For each city, we compute the proportion of grid cells exhibiting a “significant increase” (positive Sen slope with MK p < 0.05) and a “weak increase” (positive Sen slope but not significant). Cities are ranked by the combined share of “significant increase + weak increase,” and the top four are selected. Under this rule, Beijing, Tianjin, Shijiazhuang, and Baoding rank highest across the region. Studying the trend changes in these cities is of significant importance for revealing the impact of the urbanization process on surface water, especially in the context of the interaction between regional climate change and human activities. Therefore, this study will focus on these four cities and conduct an in-depth analysis of the specific impacts of urban expansion on the distribution and changes in surface water. We also verified that the ranking is robust when using only the “significant increase” share or when applying alternative thresholds on trend magnitude; the same four cities remain within the top tier.
4.2 Typical region analysis
4.2.1 Land use change analysis
Figures 6a1–d1 presents the land use type distribution maps for Beijing, Tianjin, Shijiazhuang, and Baoding in 2014. Each map uses different colors to represent major land use types such as cropland, forestland, grassland, water bodies, and impervious surfaces. It is evident that during this period, cropland and forestland accounted for a significant proportion of land use in each city, while impervious surfaces were relatively concentrated in the urban core and surrounding areas. Figures 6a2–d2 shows the land use conditions in these cities in 2023. Compared to 2014, impervious surfaces have expanded significantly, reflecting further growth in urban construction land. At the same time, the distribution patterns of forestland and grassland have undergone localized changes in some areas, and water bodies have experienced noticeable increases, decreases, or shifts in certain cities.
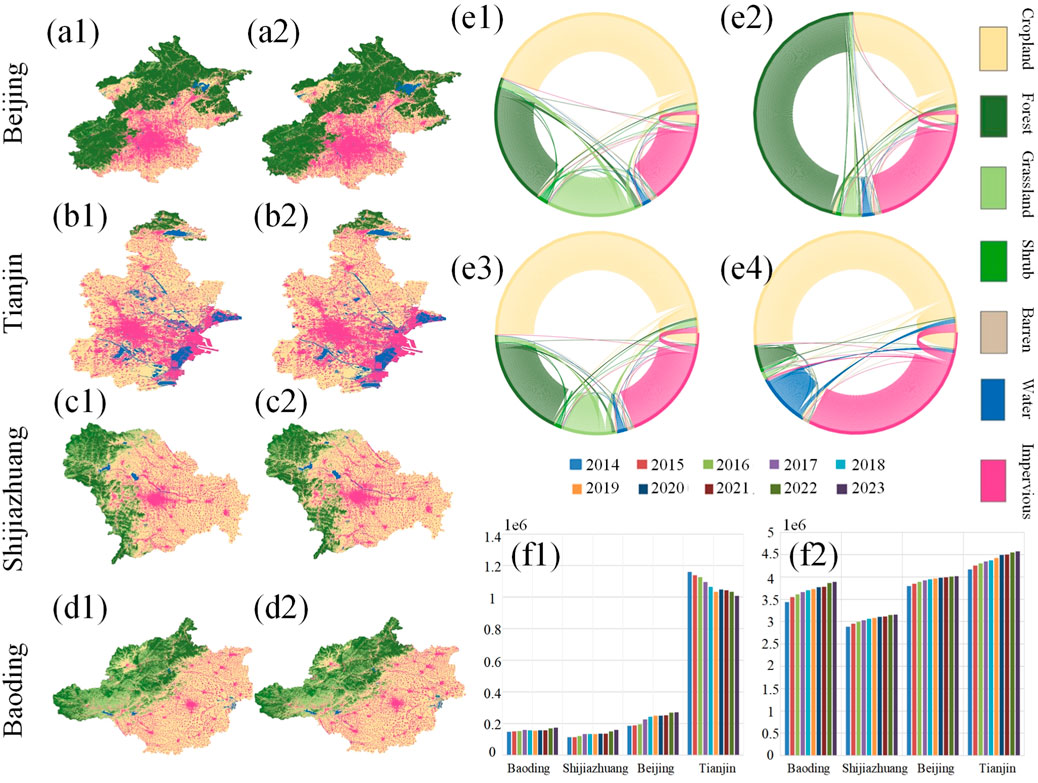
Figure 6. (a1–d1) Land use situation of four cities in 2014 (a2–d2) Land use situation of four cities in 2023 (e1–e4) Land use transfer matrix of four cities in 2014–2023 (f1) Water body data statistics of four cities in 10 years (f2) Statistics of impervious water surface in four cities over 10 years.
The land use transitions in each city are presented in Figures 6e1–e4, with Figure 6f1 showing the changes in water body area over the 10-year period and Figure 6f2 depicting the changes in impervious surface area. Specifically, in Beijing, the area of impervious surfaces increased by approximately 201.91 km2 over the 10 years. This change primarily resulted from the conversion of cropland, forestland, and grassland, reflecting the large-scale land hardening during the urbanization process. Meanwhile, the area of water bodies increased from 168.1416 km2 in 2014 to 243.4581 km2 in 2023, an increase of approximately 75.32 km2. This growth is attributed not only to the retention of water bodies but also to the conversion of some cropland and impervious surfaces into water bodies. In Tianjin, the total area of cropland decreased from 6,478.5555 km2 in 2014 to 6,279.0588 km2 in 2023, while the area of impervious surfaces increased from 3,750.426 km2 in 2014 to 4,115.0403 km2 in 2023, indicating that urbanization led to a certain degree of cropland conversion. Notably, 640.89 km2 of cropland was converted into impervious surfaces, reflecting a significant shift of agricultural land to urban construction land. In contrast, the water body area decreased from 1,043.5383 km2 in 2014 to 905.7015 km2 in 2023, a reduction of about 137.84 km2. Of this, 75.285 km2 of water bodies were converted into impervious surfaces, and some water bodies were transformed into cropland, forestland, or other land types, indicating that water bodies have been influenced by both human intervention and natural changes over the past decade. In Shijiazhuang, the overall cropland area remained stable, but there was significant internal movement, with approximately 513.0612 km2 of cropland converted into impervious surfaces, while some cropland was supplemented by forestland, grassland, and other land types. Forestland showed some degree of expansion, while shrubland and grassland decreased. Water body area increased from 102.2166 km2 to 143.4438 km2, an increase of about 41.2272 km2, reflecting a trend of water body recovery or addition in some areas. The area of impervious surfaces increased by about 244 km2, a significant portion of which came from the conversion of cropland. Overall, these changes reflect the expansion of impervious surfaces due to urbanization, the degradation of grassland and shrubland, and, in some areas, an increase in water bodies and expansion of forestland. In Baoding, cropland remained the dominant land type, although it decreased from 10,310.7267 km2 in 2014 to 10,166.8284 km2 in 2023, still maintaining an area greater than 10,000 km2. During this period, forestland showed some expansion, while grassland slightly decreased. Water body area increased from 132.1227 km2 to 157.4334 km2, reflecting a slight increase. The area of impervious surfaces significantly increased from 3,094.5438 km2 to 3,497.2848 km2, an increase of more than 400 km2, with cropland conversion to impervious surfaces (about 675.2403 km2) being particularly evident, indicating that urban or construction land expansion had a considerable impact on agricultural land. Overall, the matrix reflects the land use change trends in Baoding from 2014 to 2023, characterized by the reduction of cropland and grassland and the increase in impervious surfaces and forestland. This pattern not only indicates the pressure of urbanization but also suggests that some areas may have implemented forest restoration or greening activities.
4.2.2 Human factor analysis
The trends in nighttime lights for the four cities (Beijing, Tianjin, Shijiazhuang, and Baoding) over the past decade are shown in Figures 7a1–a4. The trend maps use a color gradient to represent the intensity of nighttime light changes in different regions. Nighttime lights in Beijing and Shijiazhuang increased significantly, particularly in the city centers and surrounding areas, indicating a rapid urbanization process and increased nighttime activity. Tianjin exhibited more uniform changes in nighttime lights, with some localized growth, while Baoding showed minimal changes, suggesting a slower pace of urbanization.
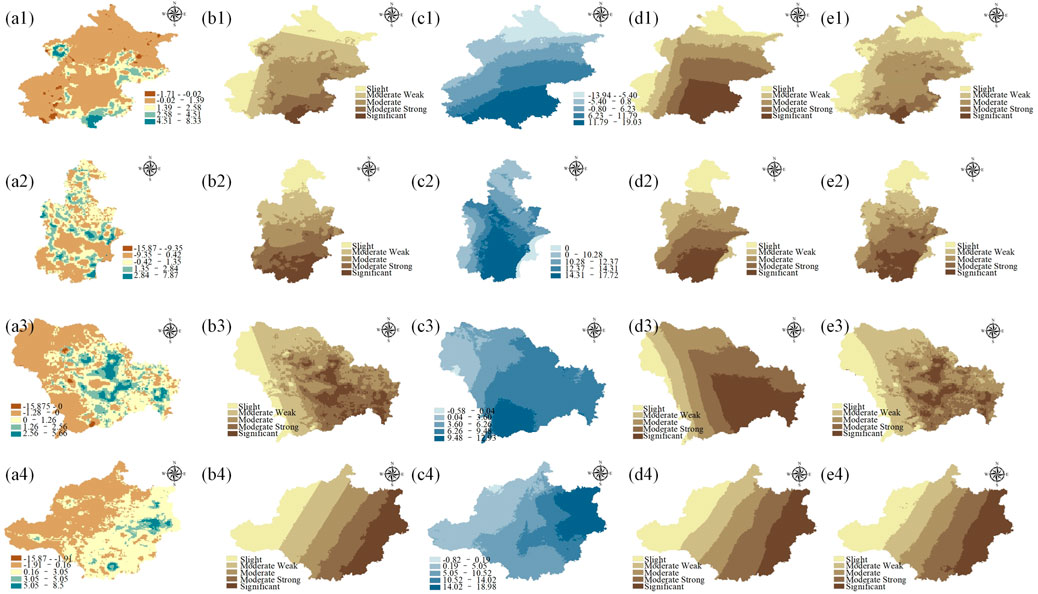
Figure 7. (a1–a4) Night lighting trend diagram of the four cities; (b1–b4) Distribution of INLA results of night light on land use; (c1–c4) Precipitation trend chart of four cities; (d1–d4) Distribution of INLA results of night light on land use; (e1–e4) Distribution of INLA results of night light and precipitation on land use.
A univariate spatial correlation analysis based on INLA was performed by combining the nighttime light trend data with the land use trend data, and Table 3 presents the posterior statistical results for the fixed effects of the model. The parameter estimates indicate a generally positive relationship between the 10-year trends of nighttime lights and land use changes, although there are notable differences among the cities. Specifically, Beijing has an estimated mean of 0.0109 with a narrow credible interval, suggesting that the impact of nighttime light changes on land use is relatively stable. Tianjin’s mean is 0.0186, which also shows a positive relationship, but the larger standard deviation indicates significant internal regional variation. Shijiazhuang has the highest mean, reaching 0.0576, with the credible interval entirely in the positive range, indicating the most significant positive correlation between nighttime light and land use changes in this city. In contrast, Baoding’s mean is only 0.0039, and the credible interval crosses zero, implying that the impact of nighttime light changes on land use is neither stable nor significant.
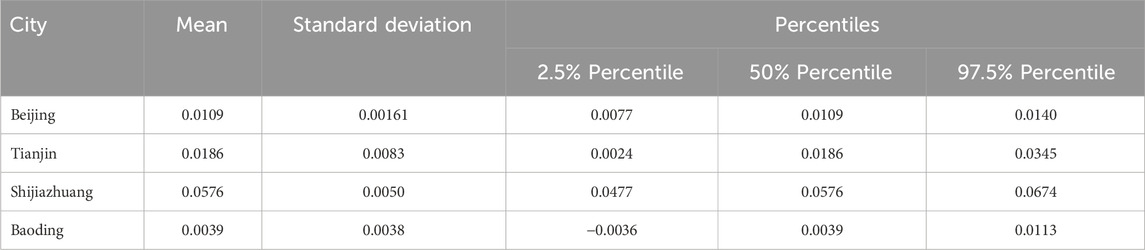
Table 3. Night light factor parameter estimation based on annual scale INLA model.
Figures 7b1–b4 further illustrates the spatial patterns of nighttime light slope changes and land use changes across different regions within the cities. The color gradients clearly reflect the differences in trends between the city center and peripheral areas. In Shijiazhuang (Figure 7b3), nighttime lights and land use changes are highly coupled, showing a relatively uniform and significant positive effect. Beijing and Tianjin (Figures 7b1,b2) exhibit moderate levels of correlation, with higher uncertainty in some regions of Tianjin, resulting in more scattered color variations in the map. Baoding (Figure 7b4) shows minimal change in some regions, consistent with the lower effect values observed in the parameter estimates. Overall, these results suggest that during the urbanization process, nighttime light, as an indicator of urban activity, is closely related to land use changes. However, the intrinsic correlation and spatial heterogeneity vary across cities due to differences in development stages and regional characteristics.
4.2.3 Natural factor analysis
The precipitation trend maps presented in Figures 7c1–c4 provide a visual representation of the spatial distribution of precipitation changes in each city over the past decade. In these maps, Beijing and Tianjin show relatively uniform changes in precipitation, with some areas exhibiting an increasing trend. Shijiazhuang, however, displays more uneven precipitation changes, with some areas experiencing an increase while others remain stable. Baoding shows minimal precipitation change, with relatively stable precipitation levels. By combining the precipitation trend data with the land use trend data for univariate spatial correlation analysis based on INLA, the output values from INLA reflect the extent to which precipitation trends influence land use changes. According to the parameter estimation table (Table 4), the 10-year trends in precipitation and land use are generally positively correlated. Specifically, Beijing’s mean is 0.0095, with a moderate standard deviation. The credible interval shows that precipitation changes have a significant and stable positive impact on land use. Tianjin’s mean is 0.0089, also showing a positive correlation, but the value is slightly lower and more concentrated. Shijiazhuang’s mean is 0.0077, lower than that of Beijing and Tianjin, but the smaller standard deviation indicates a more uniform relationship between precipitation and land use in this city. In contrast, Baoding has a mean of only 0.0042, suggesting that precipitation changes have a weaker impact on land use. The corresponding spatial distribution maps (Figures 7d1–d4) show that the precipitation trends in the core and surrounding areas of each city align with the distribution of land use changes to varying extents. The color gradient, from light to dark, illustrates the strength of the correlation between the size of the precipitation slope and land use transformation. In Beijing and Tianjin, more prominent positive correlation areas tend to appear around the central urban areas, while Shijiazhuang exhibits a more evenly distributed, moderate correlation across the city. Baoding, however, only shows significantly higher correlation in some areas. Overall, these results indicate that precipitation changes have a positive impact on land use in all four cities, but the extent of this impact varies according to the city’s size and development model.
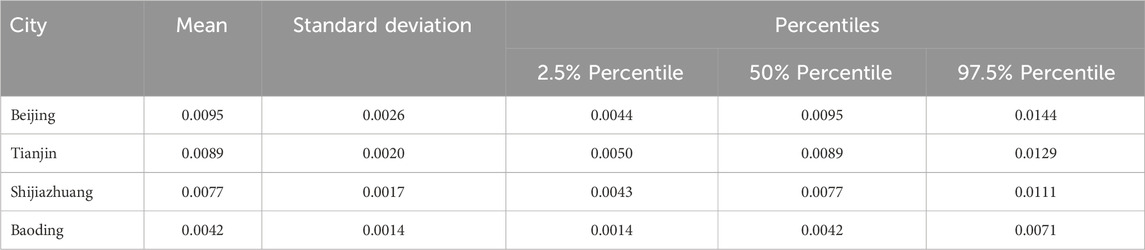
Table 4. Precipitation factor parameter estimation based on annual scale INLA model.
4.2.4 Comprehensive factor analysis
A bivariate spatial correlation analysis based on INLA was conducted using the nighttime light trend data, precipitation trend data, and land use trend data. From the parameter estimation table (Table 5), it is evident that the impacts of precipitation and nighttime light on land use change, as well as their interaction effects, vary across different cities: In Beijing, the average effect of precipitation is 0.0061, which is small but still positive, while nighttime light has a significant negative effect (−0.0309). The positive interaction term (0.0622) indicates that under wetter conditions the association between urban expansion and water-related land-use change is strengthened, consistent with intensified drainage upgrades and surface hardening in built-up areas during wet years. In Tianjin, all three effect values cross the zero interval, indicating that the impact of precipitation and nighttime light on land use is unstable or not significant. This is consistent with its coastal-plain setting and engineered water system, where tide-influenced hydrology and extensive flood-control works can dampen the co-variation between precipitation and urban land conversion. In Shijiazhuang, the effect of precipitation is −0.1100 and the effect of nighttime light is −0.0326, both of which are negative. However, the interaction term is significantly positive (0.1579), which has a clear physical meaning when local geography is considered: Shijiazhuang sits on the Taihang Mountain piedmont and alluvial-fan zone, where short, intense summer storms produce flashy runoff across fan toes and low-lying peri-urban areas. In such settings, wetter years amplify the pace of road paving, yard concretization, river training, and storm-drain upgrades associated with urban growth; consequently, the combined action of precipitation and urban expansion yields a larger incremental land-use change than either factor alone. In Baoding, the effects of precipitation and nighttime light, as well as their interaction term, are not significant, suggesting that the joint effect of natural and human factors on land use is relatively weak in this area. As a simple diagnostic, stratifying city-level observations by precipitation terciles shows that the slope associated with nighttime lights is larger in wetter groups for Shijiazhuang (and to a lesser extent Beijing/Baoding), which is consistent with the positive interaction reported in Table 5.
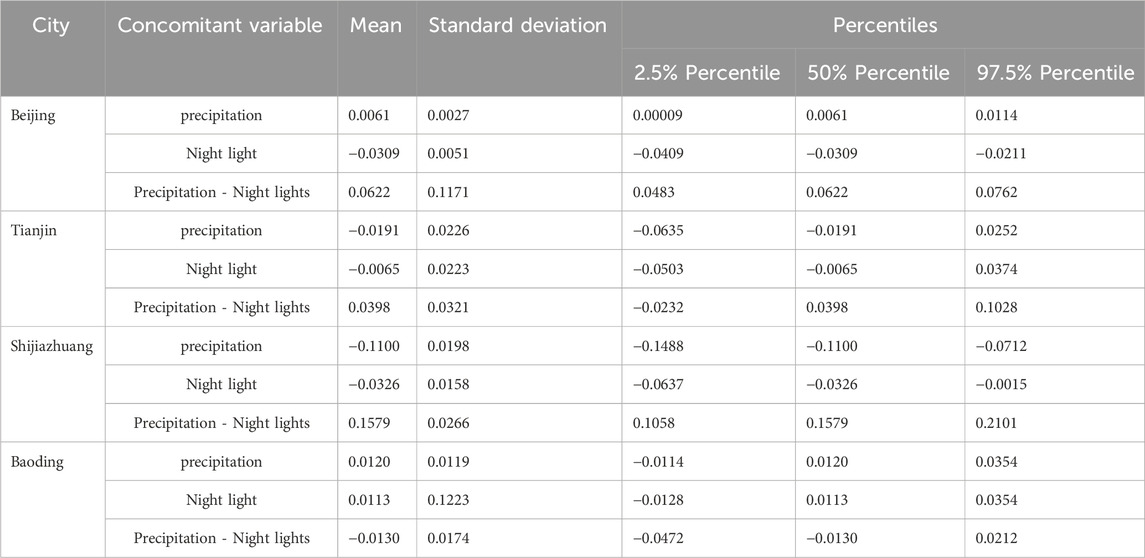
Table 5. Multi-factor parameter estimation based on annual scale INLA model.
Figures 7e1–e4 illustrates the combined effects of precipitation and nighttime light on land use change. These maps show the interaction effects of natural and human factors. In Beijing (e1), the combined effect of precipitation and nighttime light on land use is significant, especially in the city center and surrounding areas, where strong positive correlations are observed, indicating that the combined effect of natural and human factors has a clear impact on land use changes. In Tianjin (e2), the interaction effect of precipitation and nighttime light is more balanced, with some areas showing a strong positive interaction effect, particularly in suburban and rural areas, which may reflect the joint influence of natural and human factors on land use changes in those regions. In Shijiazhuang (e3), the combined effect of precipitation and nighttime light exhibits a strong positive impact, especially in areas of rapid urban development, where the interaction of natural and human factors drives land use change. In Baoding (e4), the interaction effect is weak, showing that the combined effect of precipitation and nighttime light on land use change is relatively small, possibly due to the slower pace of urbanization or the more independent roles of natural and human factors.
The bivariate INLA output values reveal the spatial impact of natural and human factors (precipitation and nighttime light) on land use change. Beijing and Shijiazhuang exhibit strong correlations and interaction effects, especially in the city center and rapidly developing areas, while Tianjin and Baoding show weaker correlations or insignificant effects. This indicates that different cities respond to land use changes under the influence of natural and human factors to varying degrees, and the interaction effects of these factors display significant spatial heterogeneity.
The land use data was resampled to retain only the impervious surfaces and water body types. As shown in Figures 8a1–d1 and (Figures 8a2–d2), there is a significant increase in red-colored impervious surfaces between 2014 and 2023 in Beijing, Tianjin, Shijiazhuang, and Baoding, reflecting the rapid urban expansion. At the same time, blue-colored water bodies exhibit varying degrees of change in specific areas. In the case of Beijing, the selected Miyun Reservoir is one of the capital’s important water sources. The surrounding expansion of impervious surfaces observed in the image indicates increased surface runoff and reduced infiltration, which could potentially impact both water quality and water supply to the reservoir. In Tianjin, the selected area is located along the Yongding River, where accelerated urbanization around the town has led to increased construction activities along both banks, which may alter the river’s ecological functions and water environment. Shijiazhuang’s Huangbizhuang Reservoir, which faces similar pressures, is also experiencing urban expansion around its perimeter, potentially leading to increased non-point source pollution and changes in water flow management. In Baoding, the selected Tang River basin is facing growing environmental and ecological pressures as the distribution of impervious surfaces continues to expand, particularly along the riverbanks. Comparing the satellite images in Figures 8a3–d3 and (Figures 8a4–d4), it is visually apparent that these areas have transitioned from agricultural or semi-natural states to more densely built urban areas. These changes not only reflect the impact of urbanization on the surrounding water resource systems but also emphasize the need for greater attention to the balance between water source protection and ecological restoration in future urban planning.
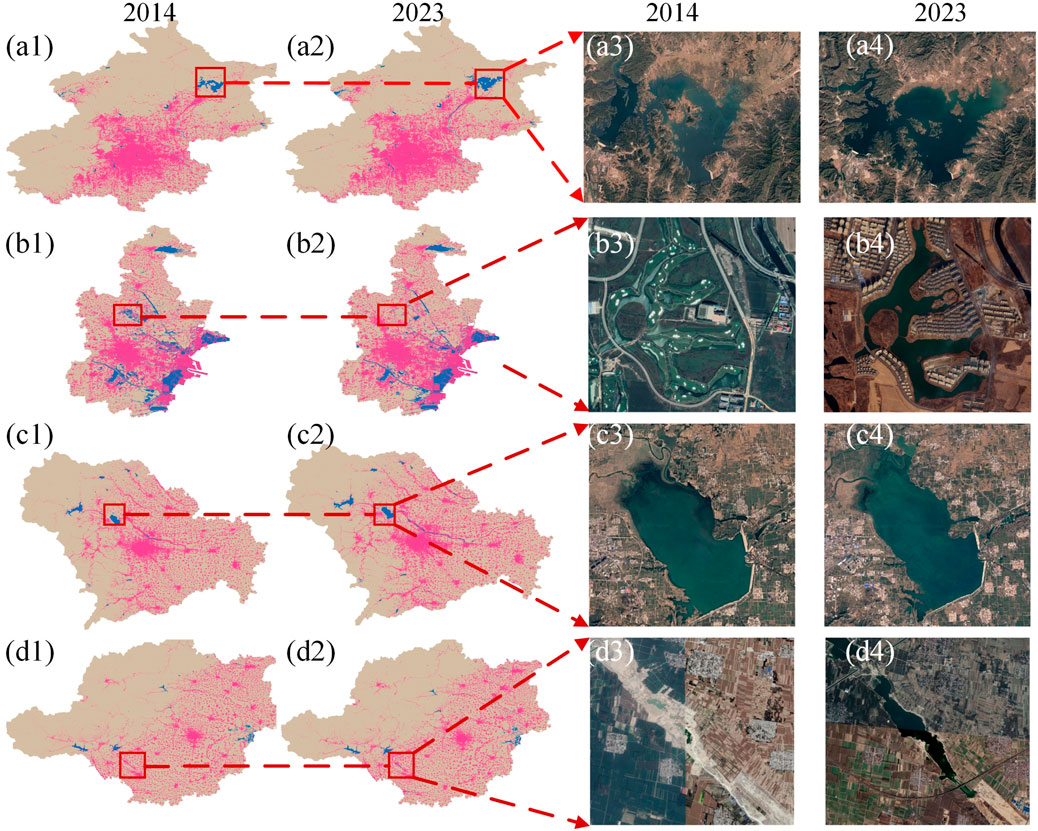
Figure 8. (a1–d1) four cities in 2014 through the water and the water distribution (a2–d2) four cities in 2023 through the water and the water distribution (a3–d3) 2014 real terrain situation (a4–d4) 2023 real terrain.
5 Discussion
5.1 Limitation analysis
5.1.1 Scale effects caused by inconsistent resolutions of multi-source data
This study conducts a comprehensive analysis using land use data, precipitation data, and nighttime light remote sensing data, and matches different data sources to a unified spatial scale (1 km resolution). However, during the data downscaling process, significant differences in the original spatial resolutions of the various datasets can result in information loss or boundary blurring due to interpolation and resampling, particularly in regions with complex terrain and significant climate variations. These errors are likely to accumulate further in subsequent trend analysis and spatial correlation modeling. Additionally, forcing different datasets to match a 1 km resolution may overlook local details present in higher-resolution data, making it difficult to accurately capture small-scale land use changes or localized precipitation characteristics within the study area, thereby affecting the reliability of the results.
5.1.2 The static assumption of the land use transition matrix and the ignorance of dynamic changes
Land use transition matrix calculations are an important method for identifying land type changes. However, this approach typically analyzes data from two fixed time points, assuming that land use change is a linear and static process. This static assumption fails to adequately capture the dynamic driving mechanisms of land use changes influenced by complex factors such as rapid urbanization, policy adjustments, or ecological restoration. For example, the rate of land use change and the direction of transitions may vary significantly across regions and over time. Ignoring these trends can lead to an oversimplified understanding of processes such as urban expansion, farmland degradation, and vegetation restoration. Furthermore, land use transition matrices struggle to capture the spatial heterogeneity of land use changes, particularly in urban fringe areas or ecologically sensitive zones, where land use transitions tend to be more complex and unpredictable. As a result, matrix analysis may introduce biases in interpreting regional differences.
5.1.3 Urban expansion typologies and water-related change
We analyze BTH through a hydrology-focused lens—impervious surfaces and water bodies—with rapidly urbanizing cities pre-selected by NTL before typical-area inspection. This framing aligns with our observed impervious growth and water-body signals. Recent LULC studies provide a compact reference frame. In West Africa, post-classification change detection shows net gains of settlements/cropland at the expense of natural covers, alongside contrasted water-body trajectories (humid vs arid), helping separate anthropogenic and climatic influences (Asenso Barnieh et al., 2020). For urban morphology, the infill–edge–leapfrog triad is widely observed; in Hyderabad, built-up area increased while water bodies decreased (e.g., ∼17.95→8.96 km2, 1979–2020), illustrating co-evolution between impervious growth and water-related change (Ul Din and Mak, 2021). Scope and limitations relative to these studies. Our manuscript intentionally models only impervious and water (two classes) rather than a full multi-class transition system; we therefore do not compute sprawl indices or a complete transition-matrix accounting (gains/losses) beyond hydrologically salient endpoints, whereas prior work formalizes multi-class gains/losses and transition probabilities (Hu et al., 2019). In addition, water-body mapping is season-sensitive (e.g., flood-season imagery), a known caveat we consider when interpreting local water signals. Future work can integrate urban morphology metrics and multi-class transitions to complement our NTL-guided, hydrology-focused approach.
5.2 Research on the coupling coordination and sustainable development strategy of the “water-soil-energy-carbon-human” system
5.2.1 Analysis of water-soil-energy-carbon coupling coordination degree
This study empirically addresses the water–soil (land-use/hydrology) and water–climate links using impervious-surface dynamics (CLCD), urbanization intensity (VIIRS nighttime lights), and precipitation. Energy and carbon are discussed conceptually as part of the broader framework and left for future integration. Our results show that cities with a higher share of grids displaying increasing nighttime lights also tend to exhibit stronger positive impervious trends (Sen–MK). Moreover, the positive precipitation × nighttime-lights interaction is spatially heterogeneous (Table 5), indicating that wetter conditions can amplify urbanization-related land-use change in specific settings.
5.2.2 Complex feedback mechanism of man-water system
Urbanization increases impervious cover, alters runoff/infiltration, and changes flood and scarcity risks; water conditions in turn influence urban form and infrastructure. The piedmont/alluvial-fan context of Shijiazhuang aligns with its large positive interaction (0.1579): short, intense summer storms trigger flashy runoff, and wet years accelerate hard-surface expansion and drainage upgrades, strengthening the urbanization–land-use linkage. By contrast, Tianjin’s coastal-plain hydrosystem (tide influence and engineered drainage) dampens such co-variation, yielding weaker and unstable interactions. These city-specific patterns ground the mechanism discussion in regional geography.
5.2.3 Future research direction and policy suggestions
Future work should integrate city-scale energy-use and carbon-emission inventories to complete the coupling beyond the land-use and precipitation components quantified here. For practice in the Beijing–Tianjin–Hebei “water-based urban planning” agenda, and consistent with our spatial findings (persistent increases in impervious surfaces and heterogeneous precipitation × urbanization interactions), we propose an actionable package that mandates low-impact development in all new build and redevelopment (e.g., permeable pavements, bioretention/rain gardens, green roofs, and on-site detention/retention with post-development runoff control) drawing on the Xiong’an New Area model; delineates and strictly protects blue–green corridors and riparian buffers, restricting conversion in cells identified with sustained impervious growth; and requires plot-level net-runoff-increase controls linked to phased upgrades of municipal drainage capacity. Measures should be calibrated to local geography: in Shijiazhuang’s piedmont/alluvial-fan setting, prioritise upstream detention, fan-toe conveyance retrofits, and hillside development controls; in Tianjin’s coastal plain, strengthen tide–river joint scheduling, upgrade pumps and gates, and preserve coastal wetlands as multi-functional storage; in Beijing and Baoding, favour compact infill over outward expansion, enforce minimum permeability ratios in redevelopment districts, and reconnect canals and wetlands to restore storage–conveyance functions.
6 Conclusion
This study focuses on the Beijing–Tianjin–Hebei region and, based on remote sensing, meteorological, and land use data, employs Integrated Nested Laplace Approximation to analyze land system dynamics during 2014–2023. The study quantitatively distinguishes the roles of natural drivers (precipitation) and human drivers (urbanization measured by nighttime lights) in water resource related land change while addressing spatial dependence. The specific conclusions are as follows:
1. Distinguishing the three analytical lenses. We distinguish three complementary lenses before interpreting city-level patterns of impervious growth and water-body change. Human factor analysis isolates the anthropogenic signal by regressing land-use change on the NTL trend in a univariate INLA, yielding the marginal association between urbanization and land transformation under a spatially structured error. Natural factor analysis analogously regresses land-use change on the precipitation trend, quantifying the hydro-climatic contribution in space. Comprehensive factor analysis fits a bivariate INLA with NTL and precipitation and their interaction (precipitation × NTL); the main effects represent each driver’s conditional association, while the interaction indicates amplification or attenuation of urbanization effects under wetter or drier tendencies. This tripartite design allows us to (i) attribute variation to human and natural drivers separately and (ii) test whether their joint action exceeds either driver alone—consistent with the spatial heterogeneity reported for Beijing, Tianjin, Shijiazhuang, and Baoding.
2. Theoretical implications. Urbanization is the primary driver of water resource related land change in rapidly developing areas, whereas precipitation acts as a conditioning background that can amplify or attenuate the urbanization signal through interaction. The strength and sign of this modulation are place specific and reflect regional geomorphology and hydrosystem settings, such as piedmont alluvial fans compared with coastal plains. Integrating trend detection with spatial modeling provides a coherent approach to separate human and climatic influences and to reveal spatial heterogeneity that is masked in nonspatial analyses.
3. Policy implications. Findings support a water sensitive urban planning portfolio for the region. Planning authorities should require low impact development in new construction and redevelopment, protect blue and green corridors and riparian buffers where imperviousness is rising, and link plot approvals to controls on net increases in runoff together with staged upgrades of drainage capacity. Implementation should be calibrated to local geography: piedmont cities prioritize upstream detention, conveyance improvements on fan toes, and stricter hillside development control; coastal cities integrate tide and river scheduling, improve pumps and gates, and preserve coastal wetlands as multi functional storage; core cities emphasize compact infill, minimum permeability ratios in redevelopment, and the reconnection of canals and wetlands to restore storage and conveyance.
4. Limitations and future research. Proxy indicators cannot fully substitute for hydrologic measurements, annual aggregation may conceal seasonal processes, and causal identification requires stronger designs. Future work should incorporate energy use and carbon emission inventories to extend the coupling analysis beyond land use and precipitation, add seasonal and event scale diagnostics, and adopt quasi experimental strategies to strengthen attribution and policy evaluation.
In conclusion, the study provides a place specific and policy relevant perspective on how rapid urbanization shapes water resource related land dynamics under varying climatic backgrounds, offering an analytical basis for sustainable land and water management in Beijing–Tianjin–Hebei and similar water limited urban regions.
Data availability statement
The original contributions presented in the study are included in the article/supplementary material, further inquiries can be directed to the corresponding authors.
Author contributions
YS: Supervision, Writing – review and editing, Writing – original draft. HW: Writing – review and editing, Writing – original draft, Investigation. QL: Methodology, Conceptualization, Writing – original draft, Writing – review and editing. CM: Writing – review and editing, Writing – original draft, Supervision. JW: Writing – original draft, Visualization, Writing – review and editing. FG: Writing – review and editing, Writing – original draft, Visualization. SZ: Visualization, Writing – original draft, Writing – review and editing. HX: Writing – original draft, Visualization, Writing – review and editing. ZZ: Writing – review and editing, Visualization, Writing – original draft.
Funding
The author(s) declare that financial support was received for the research and/or publication of this article. This research was funded by the Tianjin Normal University Research Innovation Project for Postgraduate Students (grant number 2024KYCX114Y) and 2022 Tianjin Municipal Graduate Students’ Scientific Research and Innovation Project (Grant Number 2022SKYZ270).
Conflict of interest
The authors declare that the research was conducted in the absence of any commercial or financial relationships that could be construed as a potential conflict of interest.
Generative AI statement
The author(s) declare that no Generative AI was used in the creation of this manuscript.
Any alternative text (alt text) provided alongside figures in this article has been generated by Frontiers with the support of artificial intelligence and reasonable efforts have been made to ensure accuracy, including review by the authors wherever possible. If you identify any issues, please contact us.
Publisher’s note
All claims expressed in this article are solely those of the authors and do not necessarily represent those of their affiliated organizations, or those of the publisher, the editors and the reviewers. Any product that may be evaluated in this article, or claim that may be made by its manufacturer, is not guaranteed or endorsed by the publisher.
References
Achieng, K. O., and Zhu, J. (2021). Estimation of groundwater recharge using multiple climate models in bayesian frameworks. J. Water Clim. Change 12, 3865–3885. doi:10.2166/wcc.2021.345
Akhtar, N., Syakir Ishak, M. I., Bhawani, S. A., and Umar, K. (2021). Various natural and anthropogenic factors responsible for water quality degradation: a review. Water 13, 2660. doi:10.3390/w13192660
Asenso Barnieh, B., Jia, L., Menenti, M., Zhou, J., and Zeng, Y. (2020). Mapping land use land cover transitions at different spatiotemporal scales in West Africa. Sustainability 12, 8565. doi:10.3390/su12208565
Bakka, H., Rue, H., Fuglstad, G., Riebler, A., Bolin, D., Illian, J., et al. (2018). Spatial modeling with R-INLA: a review. WIREs Comput. Stats 10, e1443. doi:10.1002/wics.1443
Bao, C., and He, D. (2019). Scenario modeling of urbanization development and water scarcity based on system dynamics: a case study of beijing–tianjin–hebei urban agglomeration, China. IJERPH 16, 3834. doi:10.3390/ijerph16203834
Blangiardo, M., Cameletti, M., Baio, G., and Rue, H. (2013). Spatial and spatio-temporal models with R-INLA. Spatial Spatio-temporal Epidemiol. 4, 33–49. doi:10.1016/j.sste.2012.12.001
Brownscombe, J. W., Griffin, L. P., Gagne, T. O., Haak, C. R., Cooke, S. J., Finn, J. T., et al. (2019). Environmental drivers of habitat use by a marine fish on a heterogeneous and dynamic reef flat. Mar. Biol. 166, 18. doi:10.1007/s00227-018-3464-2
Camara, M., Jamil, N. R., and Abdullah, A. F. B. (2019). Impact of land uses on water quality in Malaysia: a review. Ecol. Process 8, 10. doi:10.1186/s13717-019-0164-x
Cheng, C., Zhang, F., Shi, J., and Kung, H.-T. (2022). What is the relationship between land use and surface water quality? A review and prospects from remote sensing perspective. Environ. Sci. Pollut. Res. 29, 56887–56907. doi:10.1007/s11356-022-21348-x
Feng, M., Zhao, R., Huang, H., Xiao, L., Xie, Z., Zhang, L., et al. (2022). Water–energy–carbon nexus of different land use types: the case of zhengzhou, China. Ecol. Indic. 141, 109073. doi:10.1016/j.ecolind.2022.109073
Fu, J., Wang, W., Hunter, P. D., Li, W., and Sun, J. (2023). Trends in normalized difference vegetation index time series in differently regulated Cascade reservoirs in Wujiang catchment, China. Ecol. Indic. 146, 109831. doi:10.1016/j.ecolind.2022.109831
Garg, V., Nikam, B. R., Thakur, P. K., Aggarwal, S. P., Gupta, P. K., and Srivastav, S. K. (2019). Human-induced land use land cover change and its impact on hydrology. HydroResearch 1, 48–56. doi:10.1016/j.hydres.2019.06.001
Gong, W., Reich, B. J., and Chang, H. H. (2021). Multivariate spatial prediction of air pollutant concentrations with INLA. Environ. Res. Commun. 3, 101002. doi:10.1088/2515-7620/ac2f92
Hasan, S., Shi, W., Zhu, X., and Abbas, S. (2019). Monitoring of land use/land cover and socioeconomic changes in south China over the last three decades using landsat and nighttime light data. Remote Sens. 11, 1658. doi:10.3390/rs11141658
Hu, Y., Zhen, L., and Zhuang, D. (2019). Assessment of land-use and land-cover change in Guangxi, China. Sci. Rep. 9, 2189. doi:10.1038/s41598-019-38487-w
Hu, J., Wu, Y., Wang, L., Sun, P., Zhao, F., Jin, Z., et al. (2021). Impacts of land-use conversions on the water cycle in a typical watershed in the southern Chinese loess Plateau. J. Hydrology 593, 125741. doi:10.1016/j.jhydrol.2020.125741
Huang, B., Wu, B., and Barry, M. (2010). Geographically and temporally weighted regression for modeling spatio-temporal variation in house prices. Int. J. Geogr. Inf. Sci. 24, 383–401. doi:10.1080/13658810802672469
Kalfas, D., Kalogiannidis, S., Papaevangelou, O., and Chatzitheodoridis, F. (2024). Assessing the connection between land use planning, water resources, and global climate change. Water 16, 333. doi:10.3390/w16020333
Li, S., Yang, H., Lacayo, M., Liu, J., and Lei, G. (2018). Impacts of land-use and land-cover changes on water yield: a case study in Jing-Jin-Ji, China. Sustainability 10, 960. doi:10.3390/su10040960
Li, X., Yang, X., and Gong, L. (2020). Evaluating the influencing factors of urbanization in the Xinjiang uygur autonomous region over the past 27 years based on VIIRS-DNB and DMSP/OLS nightlight imageries. PLoS ONE 15, e0235903. doi:10.1371/journal.pone.0235903
Lindgren, F., and Rue, H. (2015). Bayesian spatial modelling with R - INLA. J. Stat. Soft. 63. doi:10.18637/jss.v063.i19
Liu, T., Yao, J., Cao, Y., Qin, T., Wu, Q., Mo, F., et al. (2024). Spatial-temporal heterogeneity of vegetation reduces concentration of atmospheric pollution particles in the east China metropolitan area. Ecol. Indic. 169, 112902. doi:10.1016/j.ecolind.2024.112902
Nayan, N. K., Das, A., Mukerji, A., Mazumder, T., and Bera, S. (2020). Spatio-temporal dynamics of water resources of hyderabad metropolitan area and its relationship with urbanization. Land Use Policy 99, 105010. doi:10.1016/j.landusepol.2020.105010
Ngondo, J., Mango, J., Liu, R., Nobert, J., Dubi, A., and Cheng, H. (2021). Land-use and land-cover (LULC) change detection and the implications for coastal water resource management in the wami–ruvu basin, Tanzania. Sustainability 13, 4092. doi:10.3390/su13084092
Niekerk, J. van, Krainski, E., Rustand, D., and Rue, H. (2022). A new avenue for Bayesian inference with INLA.
Palmí-Perales, F., Gómez-Rubio, V., Bivand, R. S., Cameletti, M., and Rue, H. (2022). Bayesian inference for multivariate spatial models with R-INLA.
Poggio, L., Gimona, A., Spezia, L., and Brewer, M. J. (2016). Bayesian spatial modelling of soil properties and their uncertainty: the example of soil organic matter in Scotland using R-INLA. Geoderma 277, 69–82. doi:10.1016/j.geoderma.2016.04.026
Romero, J. M., Salazar, D. C., and Melo, C. E. (2023). Hydrogeological spatial modelling: a comparison between frequentist and Bayesian statistics. J. Geophys. Eng. 20, 523–537. doi:10.1093/jge/gxad023
Rue, H., Martino, S., and Chopin, N. (2009). Approximate bayesian inference for latent gaussian models by using integrated nested laplace approximations. J. R. Stat. Soc. Ser. B Stat. Methodol. 71, 319–392. doi:10.1111/j.1467-9868.2008.00700.x
Satria, R., Aguero-Valverde, J., and Castro, M. (2021). Spatial analysis of road crash frequency using Bayesian models with integrated nested laplace approximation (INLA). J. Transp. Saf. and Secur. 13, 1240–1262. doi:10.1080/19439962.2020.1726542
Schaeffer, B. A., Reynolds, N., Ferriby, H., Salls, W., Smith, D., Johnston, J. M., et al. (2024). Forecasting freshwater cyanobacterial harmful algal blooms for Sentinel-3 satellite resolved U.S. Lakes and reservoirs. J. Environ. Manag. 349, 119518. doi:10.1016/j.jenvman.2023.119518
Sohail, M. T., Mahfooz, Y., Azam, K., Yen, Y., Genfu, L., and Fahad, S. (2019). Impacts of urbanization and land cover dynamics on underground water in islamabad, Pakistan. Desalination Water Treat. 159, 402–411. doi:10.5004/dwt.2019.24156
Ul Din, S., and Mak, H. W. L. (2021). Retrieval of land-Use/Land cover change (LUCC) maps and urban expansion dynamics of hyderabad, Pakistan via landsat datasets and support vector machine framework. Remote Sens. 13, 3337. doi:10.3390/rs13163337
Wang, J., Qiu, S., Du, J., Meng, S., Wang, C., Teng, F., et al. (2022). Spatial and temporal changes of urban Built-Up area in the yellow river basin from nighttime light data. Land 11, 1067. doi:10.3390/land11071067
Wang, M., An, Y., Yang, R., Shan, X., Li, L., and Feng, X. (2024). Analysis of the coupling coordinated development of the water-soil-energy-carbon system in northwest China. Land 13, 715. doi:10.3390/land13050715
Wei, Y., Yuanxi, L., Yu, L., Mingxiang, X., Liping, Z., and Qiuliang, D. (2020). Impacts of rainfall intensity and urbanization on water environment of urban Lakes. Ecohydrol. and Hydrobiology 20, 513–524. doi:10.1016/j.ecohyd.2020.06.006
Wood, S. N. (2019). Simplified integrated nested laplace approximation. Biometrika asz044, asz044. doi:10.1093/biomet/asz044
Xu, P., Jin, P., and Cheng, Q. (2020). Monitoring regional urban dynamics using DMSP/OLS nighttime light data in Zhejiang Province. Math. Problems Eng. 2020, 1–10. doi:10.1155/2020/9652808
Yang, C., Yu, B., Chen, Z., Song, W., Zhou, Y., Li, X., et al. (2019). A spatial-socioeconomic urban development status curve from NPP-VIIRS nighttime light data. Remote Sens. 11, 2398. doi:10.3390/rs11202398
Yao, J., Mo, F., Zhai, H., Sun, S., Feger, K.-H., Zhang, L., et al. (2022a). A spatio-temporal prediction model theory based on deep learning to evaluate the ecological changes of the largest reservoir in north China from 1985 to 2021. Ecol. Indic. 145, 109618. doi:10.1016/j.ecolind.2022.109618
Yao, J., Sun, S., Zhai, H., Feger, K.-H., Zhang, L., Tang, X., et al. (2022b). Dynamic monitoring of the largest reservoir in north China based on multi-source satellite remote sensing from 2013 to 2022: water area, water level, water storage and water quality. Ecol. Indic. 144, 109470. doi:10.1016/j.ecolind.2022.109470
Yao, J., Zhai, H., Yang, X., Wen, Z., Wu, S., Zhu, H., et al. (2022c). Spatiotemporal variations of aerosols in China during the COVID-19 pandemic lockdown. Remote Sens. 14, 696. doi:10.3390/rs14030696
Yao, J., Li, J., Cao, Y., Chen, M., Zhang, C., Mo, F., et al. (2024a). Analysing the influence of surface greening on soil conservation in China using satellite remote sensing. J. Hydrology 636, 131253. doi:10.1016/j.jhydrol.2024.131253
Yao, J., Xu, N., Wang, M., Gong, P., Lu, H., Cao, Y., et al. (2024b). Promoting global surface water monitoring research with the SWOT satellite. TIG 2, 100099. doi:10.59717/j.xinn-geo.2024.100099
Yao, J., Mo, F., Xu, N., Ma, C., Wang, M., Xia, H., et al. (2025a). The Chinese laser altimetry satellite will significantly enhance the 3D mapping capability of global coastal zones. TIG 3, 100121. doi:10.59717/j.xinn-geo.2024.100121
Yao, J., Xu, N., Wang, M., Liu, T., Lu, H., Cao, Y., et al. (2025b). SWOT satellite for global hydrological applications: accuracy assessment and insights into surface water dynamics. Int. J. Digital Earth 18, 2472924. doi:10.1080/17538947.2025.2472924
Zhai, H., Yao, J., Wang, G., and Tang, X. (2022). Impact of land use on atmospheric particulate matter concentrations: a case study of the beijing–tianjin–hebei region, China. Atmosphere 13, 391. doi:10.3390/atmos13030391
Zhao, R., Liu, Y., Tian, M., Ding, M., Cao, L., Zhang, Z., et al. (2018). Impacts of water and land resources exploitation on agricultural carbon emissions: the water-land-energy-carbon nexus. Land Use Policy 72, 480–492. doi:10.1016/j.landusepol.2017.12.029
Keywords: land use, urbanization, water resources, InlA, trend analysis
Citation: Song Y, Wang H, Lu Q, Ma C, Wang J, Gan F, Zhang S, Xu H and Zhao Z (2025) The impact of rapid urbanization on water resources based on INLA. Front. Environ. Sci. 13:1628308. doi: 10.3389/fenvs.2025.1628308
Received: 14 May 2025; Accepted: 22 September 2025;
Published: 01 October 2025.
Edited by:
Hugo Wai Leung MAK, Hong Kong University of Science and Technology, Hong Kong SAR, ChinaCopyright © 2025 Song, Wang, Lu, Ma, Wang, Gan, Zhang, Xu and Zhao. This is an open-access article distributed under the terms of the Creative Commons Attribution License (CC BY). The use, distribution or reproduction in other forums is permitted, provided the original author(s) and the copyright owner(s) are credited and that the original publication in this journal is cited, in accordance with accepted academic practice. No use, distribution or reproduction is permitted which does not comply with these terms.
*Correspondence: Huimin Wang, d2FuZ2h1aW1pbjIwMDZAMTI2LmNvbQ==; Qingkai Lu, MTg3NTQ3NzUxMDNAMTYzLmNvbQ==