 Yue Zhang
 Xin Yang2†
 Chao Liu
 Ting Wang
- 1Business School, Hohai University, Nanjing, China
- 2The People’s Hospital of Danyang, Affiliated Danyang Hospital of Nantong University, Danyang, China
- 3School of Management Engineering, Nanjing Institute of Technology, Nanjing, China
- 4School of Public Administration, Hohai University, Nanjing, China
As the dual imperatives of carbon reduction and economic expansion gain prominence, the pursuit of high-quality development has taken on greater urgency, with talent agglomeration emerging as a critical driving force. Yet its specific impact on carbon emissions remains unclear. To address this question, this study employs a two-tier stochastic frontier model using panel data from 30 Chinese provinces spanning 2013–2023, enabling the identification and decomposition of the dual effects of talent agglomeration on carbon emissions. The results show that talent agglomeration exerts asymmetric bilateral impacts, with the inhibitory effect dominating the promotive effect and producing an overall decline in emissions. Specifically, the promotive channel increased emissions by 16.2%, while the inhibitory channel reduced them by 43.8%, resulting in a net decrease of 27.6% relative to the frontier level. The net inhibitory effect became more pronounced after 2020 following a brief uptick in 2014, and spatial heterogeneity was evident, with the largest reductions occurring in the western region, followed by the central and eastern regions. Further heterogeneity analysis indicates that larger net reductions occur at higher levels of talent agglomeration (≥40%), higher economic development (70%–100%), and under stricter environmental regulation, whereas in the early stages of urbanization the promotive effect dominates but gradually shifts toward inhibition as urbanization deepens. These findings demonstrate that although talent agglomeration has dual channels of influence, its overall impact is to reduce emissions, thereby providing more precise guidance for carbon reduction policies that reconcile economic growth with environmental sustainability.
1 Introduction
China is undergoing a transformative period aimed at achieving high-quality and sustainable development (Wang and Han, 2023). One of the most major dilemma in this transition lies in reducing carbon emissions while maintaining progress in industrialization and urbanization (Shi et al., 2018). In response, the State Council launched the “Beautiful China” initiative to foster a low-carbon innovation system, underscoring the importance of talent as a driver of emission reduction and sustainable growth. Building on this agenda, regional governments have increasingly adopted measures to attract and concentrate high-level talent, positioning it as a cornerstone of innovation and economic transformation. Measures such as improving foundational infrastructure, reforming the household registration system, and enhancing the business climate have been implemented to create favorable environments conducive to both innovation and sustainability (Meyers et al., 2020; Wang and Chen, 2023). As high technical and scientific talent has facilitated technological advancement and industrial restructuring (Wang L. et al., 2020), it is necessary to achieve synergistic effects that align both economic and environmental goals. Consequently, clarifying the dual impacts of talent agglomeration and identifying ways to reinforce its dominant inhibitory effect have become pressing concerns for both policymakers and scholars during this transitional phase.
While substantial evidence highlights the link between economic development and environmental outcomes, there remains a critical need to integrate talent mobility into low-carbon innovation strategies. Existing studies show that R&D talent plays a pivotal role in promoting sustainable development at multiple levels (Crowley-Henry and Al Ariss, 2018; Lin et al., 2021). Compared to other factors, talent agglomeration shaped by population mobility significantly influences industrial innovation competitiveness and supports sustainable economic progress, offering multifaceted economic, social, and environmental value (Wang L. et al., 2020; Shi and Lai, 2023). As a concentration of high-quality human capital, talent agglomeration is essential for innovation. It also generates knowledge spillovers that promote regional industrial development and facilitate green technology diffusion (Liu and Zhang, 2021). However, some studies have indicated that excessive agglomeration, especially when combined with regional development imbalances or mismatches in industrial layout, can exacerbate environmental pollution, thus hindering emission reduction efforts (Liu and Zhang, 2021; Shen and Peng, 2021). Moreover, the inhibitory effects from technological innovation and industrial upgrading induced by talent agglomeration do not fully offset the promotive effects arising from congestion and urbanization, yielding only limited net reductions in carbon emissions. Consequently, this study examines the synergistic effects of talent agglomeration on the environment to clarify its role in supporting China’s carbon reduction strategies and sustainable development goals.
The contributions of this research are fourfold. First, this research introduces a comparative framework that evaluates both the promotive and inhibitory effects of talent agglomeration on carbon emissions, moving beyond the traditional one-dimensional perspective and addressing biases in existing literature. Second, it develops a robust analytical model that captures regional variations in economic development, urbanization, and policy conditions, thereby enriching current research that often isolates factors such as technological innovation or policy design. Third, it offers empirical evidence on the environmental impacts of talent agglomeration, particularly in the context of China’s diverse regional economies. Fourth, the findings indicate that in most regions—especially in eastern provinces—the restraining effect of talent agglomeration on carbon emissions outweighs its stimulative effect, offering policymakers practical guidance on leveraging talent strategies to support both carbon reduction and sustainable economic growth.
The subsequent content of this study is organized in the following way: Section 2 discusses relevant literature and formulates the hypotheses. Section 3 introduces the models and research data. Section 4 describes the empirical process and results, followed by the conclusion, policy implications, and suggestions for further study in the final section.
2 Literature review and hypothesis development
2.1 Literature review
At present, there has been little investigation into the environmental effects of scientific and technological talent agglomeration. The overwhelming majority of the literature has examined the relationship between socioeconomic dynamics, such as industrial agglomeration and urbanization, on carbon emissions, arguing that these factors significantly enhance regional energy efficiency and environmental protection while highlighting the unintended negative consequences of neglecting a comprehensive approach (Zhang Y. et al., 2024). Some research shows that regional agglomeration of population and industry increases energy demand and carbon emission (York, 2007; Li et al., 2022). Nonetheless, when examining the agglomeration effects, researchers have largely found substantial evidence supporting improved public infrastructure efficiency, thereby reducing energy emission intensity (Glaeser and Kerr, 2009; Wuyts and Dutta, 2014).
Research supporting the first view contends that agglomeration can effectively reduce carbon emissions. This is because industrial agglomeration facilitates the scaling of regional industries, which helps lower production costs and promotes resource sharing, thereby improving energy efficiency and supporting environmental protection (Zou et al., 2024). Using panel data at the provincial level spanning 1991 to 2016, Zhang et al. (2017) demonstrated that regional industrial agglomeration can directly enhance regional production efficiency in the short term. High human capital not only promotes knowledge sharing and collaboration, driving process innovation and product quality improvement in enterprises (Dost and Badir, 2018), but also contributes to promoting sustainable practices through low-carbon policies, green technological innovation, and industrial optimization (Yang et al., 2022). High human capital promotes knowledge sharing and collaboration, significantly driving process innovation and product quality improvement in enterprises Regional industrial and population agglomeration has been recognized as a crucial strategy advancing environmental sustainability and fostering a green economy (Wang et al., 2020b).
In contrast, other research suggests that regional industrial and population agglomeration can exacerbate environmental degradation. On one hand, regional industrial and population agglomeration significantly increases energy demand, complicates the acquisition of resources such as land and energy, and leads to higher emissions of industrial pollutants (Andersson and Lööf, 2011). On the other hand, while agglomeration can improve accessibility in urban areas, it may also generate large volumes of waste and further raise energy consumption (Yi et al., 2022). For example, a study using urban population density and per capita energy consumption in China found a positive correlation between the two (Wang et al., 2024). Moreover, in highly agglomerated regions, the productivity gains associated with concentration may be accompanied by higher carbon emissions (Oliveira et al., 2014).
Nonetheless, certain research has suggested that the relationship between agglomeration economies and carbon emissions is nonlinear (Wang F. et al., 2020). Some researcher noted that there is significant difference across countries at different stages of development. While some scholars found that agglomeration in low-income countries effectively reduces carbon emissions, others observed the opposite trend in high-income countries, with an increase in carbon emissions. As demonstrated by Wang and Wang (2019), agglomeration is linked to environmental pollution in a manner that follows an inverted U-shaped trajectory. Initially, agglomeration generates sizable innovation and knowledge spillovers; once density surpasses a critical level, congestion and crowding erode these benefits, so the spillover gains weaken and may vanish. Only when surpassing a specific threshold does agglomeration begin to positively contribute to reducing pollution emissions (Wang F. et al., 2020; Wu et al., 2021). The research identified a positive N-shaped relationship between agglomeration and carbon emissions, suggesting that after surpassing an inefficient level of agglomeration, further agglomeration can theoretically mitigate carbon emissions (Li et al., 2022). Over extended periods, this relationship consistently exhibits a positive N shape, indicating that, theoretically, beyond certain levels of inefficiency, agglomeration can again contribute to reducing carbon emissions.
Despite the importance of talent agglomeration, research on this topic remains superficial, and the heterogeneous characteristics of these impacts have not been comprehensively explored. Therefore, this study further expands in three aspects: First, it establishes a bilateral analytical framework for assessing the effect of talent agglomeration on carbon emissions and evaluates this relationship across 30 provinces in China. Second, it investigates the twofold impact of talent agglomeration on regional carbon emissions and empirically explores its spatiotemporal evolution and changing patterns. Third, the study explores the differential impacts of urbanization and economic development at different levels of development and investigates practical paths to reinforce the inhibitory effects of talent agglomeration on emissions.
2.2 Hypothesis
The agglomeration of elements within a region can enhance the quality and flow direction of these elements, thereby achieving economies of scale and generating economic benefits (Ye et al., 2022). But are the environmental impacts of spatial agglomeration the same? Agglomeration can promote the sharing of public facilities and technologies within a region, reduce pollution, and enhance collaborative innovation, thereby improving ecological efficiency (Tian et al., 2024). The increase in regional energy consumption and exacerbation of congestion caused by agglomeration place significant pressure on the sustainable development of the regional ecological environment (Martin and Sunley, 2006). As an essential prerequisite for innovation, scientific and technological talent extends urbanization and industrial agglomeration in regional development. Thus, its dynamics have two opposing effects on carbon utilization.
2.2.1 The inhibition impact of talent agglomeration on carbon emission
Talent agglomeration strengthens knowledge exchange and collaboration, catalyzing green innovation and accelerating the adoption, diffusion, and assimilation of low-energy technologies, thereby reducing carbon emissions. High-value knowledge and skills serve as the primary drivers of innovation, directly enhancing regional innovation capacity under supportive policies and favorable environmental conditions (Zhou et al., 2018). By fostering innovation and creativity, talent agglomeration can facilitate the regional adoption of low-energy technologies, thereby reducing carbon emissions while simultaneously improving energy efficiency (Wang and Wang, 2019). Moreover, regions with abundant knowledge and specialized skills tend to drive the practical implementation of innovation that reduces carbon emissions. Talent agglomeration enhances technological assimilation by translating individual innovations into practical applications and facilitating the sharing and absorption of technologies within the region, thereby lowering carbon emissions (Wingreen and Blanton, 2018).
The gathering and concentration of R&D talent facilitate the development of green industries, thus driving cleaner industrial restructuring. The foundation for regional adjustments and upgrades lies in restructuring labor markets with scientific and technological talent, which reduces the costs and risks of technological advancements for businesses and facilitates emissions reduction (Cheng et al., 2021). Green technologies, which optimize energy consumption, improve resource efficiency, and enable sustainable energy systems, rely heavily on the support of scientific and technological talent, thereby cutting carbon emissions. Moreover, the diffusion of talent across regions supports further reductions in carbon emissions and advances progress toward sustainable development goals (Wang et al., 2022).
Talent agglomeration process involves the improvement of regional public services, enhancing service quality and advancing decarbonization. Regions with well-developed public services and living infrastructure are more likely to attract scientific and technological talent while simultaneously reducing carbon emissions. Owing to the improved urban living environment, regions are more likely to attract talent and enhance public services, which supports emissions reduction (Jiang et al., 2020). Additionally, the agglomeration process raises overall environmental awareness, driven by higher standards for environmental quality and stronger preferences for low-carbon living, thereby curbing emissions (Zhang P. et al., 2024).
Hypothesis 1. Talent agglomeration can inhibit regional carbon emissions.
2.2.2 The promotion impact of talent agglomeration on carbon emission
Some researchers argue that agglomeration acts as a contributing factor to China’s carbon emissions. The degree of agglomeration will lead to modifications in production equipment capacity (Robertson and Gatignon, 1986). As the scale of talent agglomeration grows, competition intensifies and resource allocation becomes increasingly unequal, particularly hindering the diffusion of innovative green technologies. Intense competitive pressures diminish collaboration and create technological barriers, restricting the dissemination of green technologies. In addition, the consolidation of existing production structures reinforces carbon-intensive practices, thereby aggravating environmental pressures.
In China, severe distortions in resource allocation influence corporate investment preferences and production behaviors, resulting in environmental damage (Peng et al., 2021). The substantial costs associated with acquiring scientific and technological talent drive enterprises to scale up production, boost output, and redirect resources away from technological innovation, thereby impeding advancements in production technology (Cao et al., 2023). This path dependency exacerbates resource misallocation, leading to higher levels of environmental pollution. Moreover, talent agglomeration tends to raise regional living and production costs, contributing to increased greenhouse gas emissions and crowding effects (Han et al., 2018). The agglomeration of scientific and technological talents accelerates urban expansion, which results in infrastructure congestion and subsequent environmental degradation. Such non-productive consumptions significantly elevate the levels of direct carbon emissions. These non-productive consumptions substantially increase direct carbon emission levels.
Hypothesis 2. Talent agglomeration can promote regional carbon emissions.
Building on the two streams of talent agglomeration’s impact on carbon emissions, we analyzed the bilateral effects through the mechanism illustrated in Figure 1.
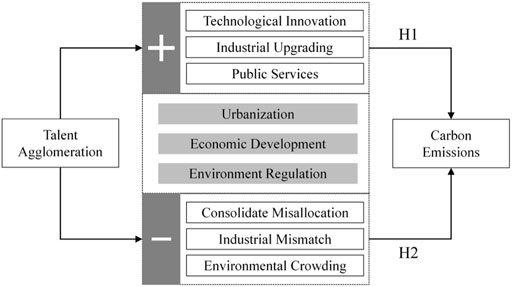
Figure 1. Mechanism analysis of the effects of talent agglomeration on carbon emissions.
3 Methodology and research data
3.1 The two-tier stochastic frontier model
To measure the bilateral relationship between talent agglomeration and carbon emissions, we follow the two-tier stochastic frontier model of Kumbhakar and Parmeter (2009). As shown in Equation 1:
As shown in Equation 1,
Given that
If
It is assumed that both
Within this framework,
The log-likelihood to be maximized is given by Equation 4:
Within this framework, let
Based on Equations 5, 6, the conditional expectations follow from Equations 7, 8:
The conditional expectations are used to quantify the absolute deviations of regional carbon utilization gaps from the frontier, representing positive and negative effects. For ease of subsequent discussion and comparison, these conditional expectations are further converted into percentages that represent deviations from the frontier level. Equations 9, 10 transform these expectations into percentage deviations from the frontier:
Finally, the net effect is defined in Equation 11:
Herein,
3.2 Data source and sample selection
Referring to the conceptual and empirical framework, and considering data availability, Chinese provincial panel data spanning 2013 to 2023 were used to investigate the effect of scientific and technological talent concentration on interprovincial atmospheric pollution. Owing to data constraints, the regions of Tibet, Hong Kong, Macao, and Taiwan were excluded from this study. All variables involving price factors were adjusted for inflation using 2010 as the base year.
3.2.1 Variable selection
3.2.1.1 Carbon emission
As specified in Equation 12, a carbon emission calculation method is derived from the guidelines of the Intergovernmental Panel on Climate Change (IPCC), which serves as a standard approach for estimating greenhouse gas emissions. This approach is commonly applied in environmental studies to estimate emissions from various energy sources. Additionally, based on prior literature (Liu et al., 2023; Kuang et al., 2024)., the emissions are calculated using data from eight key energy sources—coke, gasoline, natural gas, raw coal, fuel oil, crude oil, kerosene, and diesel—factored into end-use consumption:
Among these,
3.2.1.2 Talent agglomeration
The degree of talent agglomeration is the clustering phenomenon formed by the same type of talent gathering in a certain area, with strong spatial characteristics (Shi and Lai, 2019). Building on previous research, this study employs the location entropy index to measure the level of talent agglomeration. Specifically, as shown in Equation 13:
In this model,
3.2.1.3 Other inter-provincial characteristic variables
Drawing on existing research, it has been identified that carbon emission is influenced not only by talent agglomeration but also by urbanization, industrialization and local governance (Taskin and Zaim, 2001). Following the approach of Sun and Huang (2020), urbanization is represented by the non-agricultural population ratio (lnUrb). And the level of economic development (lnPGdp) and environmental regulation (ER) are selected as control variables (Liu et al., 2023). Environmental regulation is evaluated by the ratio of industrial pollution control investment to GDP, indicating the government’s prioritization of environmental sustainability (Zhang et al., 2022).
3.2.2 Research area and data source
Given the notable regional disparities in socioeconomic development, governance capacity, and environmental complexity, as well as unique challenges in implementing talent agglomeration policies on carbon emissions in China (Li and Ramanathan, 2018; Wu et al., 2020) we address these differences effectively by dividing the research area into eastern, central, and western regions. Figure 2a delineates this regionalization, while Figure 2b reports provincial mean carbon emissions for 2013–2023. Overall, a clear spatial gradient emerges, with emissions decreasing from north to south and from east to west, and the eastern region consistently recording the highest totals, followed by the central region.
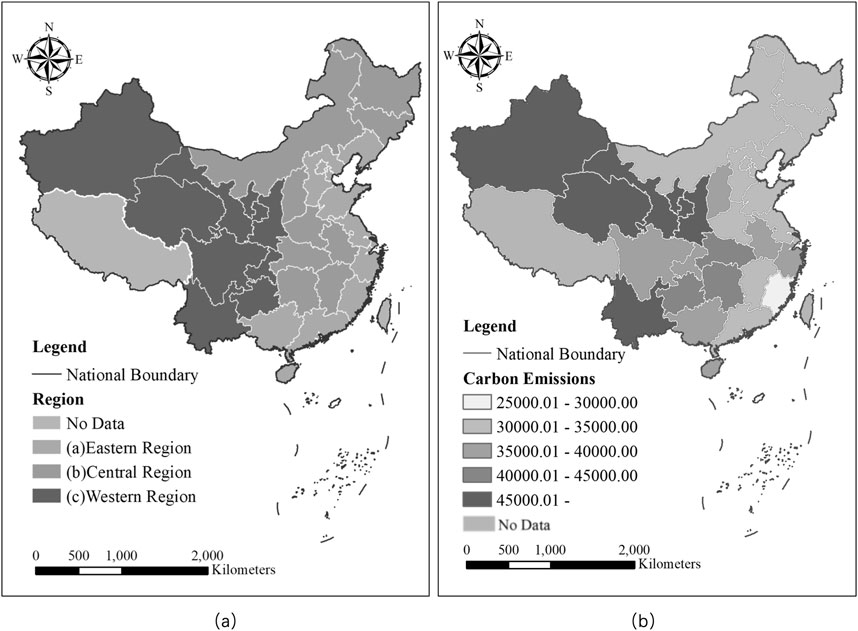
Figure 2. Provinces and regions covered with average carbon emissions during the study period.
The scope of this research encompasses the provinces of China over the years 2013–2023, excluding Tibet, Hong Kong, Macao, and Taiwan due to data limitations. Data concerning energy were extracted from the China Energy Statistics Yearbook, while information from other domains was drawn from the China Statistical Yearbook and the China Statistical Yearbook of Science and Technology. The energy consumption data for 2018 were projected using linear regression, while interpolation techniques were employed to address other missing data. Descriptive statistical results for all variables can be found in Table 1.
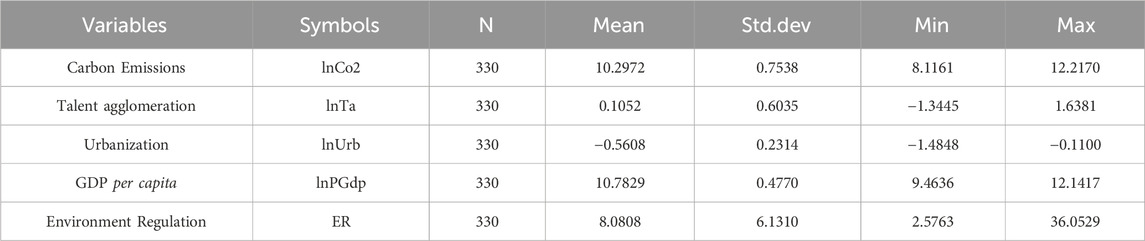
Table 1. Descriptive statistics of variables.
4 Empirical analysis
4.1 Estimation of bilateral stochastic frontier model
4.1.1 Analysis of factors influencing carbon emission
The dual impacts of agglomeration on carbon emissions are estimated using Equation 12. The results are presented in Table 2, with column 2 displaying the OLS estimates that exclude deviation effects, column 3 to column 5 report maximum-likelihood estimates from the two-tier stochastic frontier model. Specification M2 includes year fixed effects only, M3 includes regional fixed effects only, and M4 includes both sets of fixed effects. In M4, urbanization (lnUrb = 0.166*,Z = 63.21) and environmental regulation (ER = 0.294*,Z = 17.29) are positively associated with carbon emissions, whereas per-capita GDP (lnPGdp = −0.029*, Z = −57.28) is negatively associated; relative to the OLS baseline, these sign and significance reversals indicate that explicitly modeling inefficiency within the two-tier stochastic frontier model yields materially different inferences.
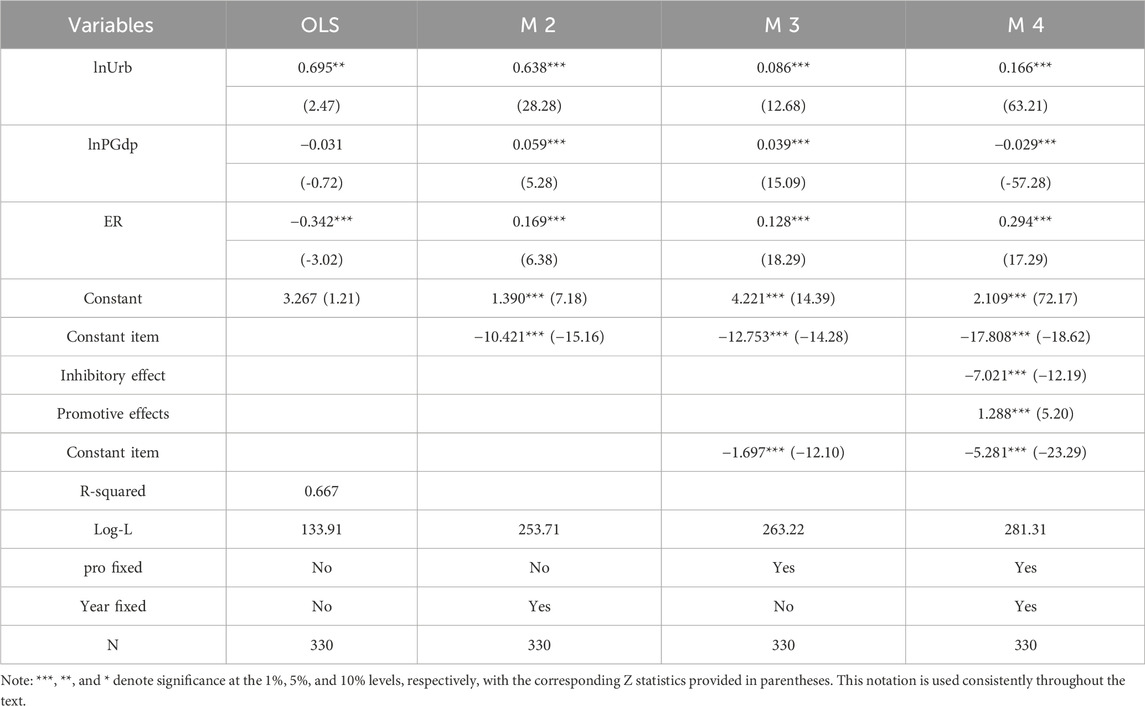
Table 2. The basic estimation of the two-tier stochastic frontier model.
4.1.2 Variance decomposition: analyzing the impact coefficients of bilateral effects
The results demonstrate that talent agglomeration exerts a net inhibitory effect on carbon emissions, primarily by improving energy efficiency. As shown in Table 3, talent agglomeration exerts both promotive and inhibitory effects on carbon emissions, with the inhibitory effect measured at 0.438, significantly exceeding the promotive effect of 0.162. The results confirm the coexistence of bilateral effects, while further indicating that the inhibitory effect dominates, thereby supporting both theoretical assumptions. Overall, the impact on emission reduction is positive, with E (
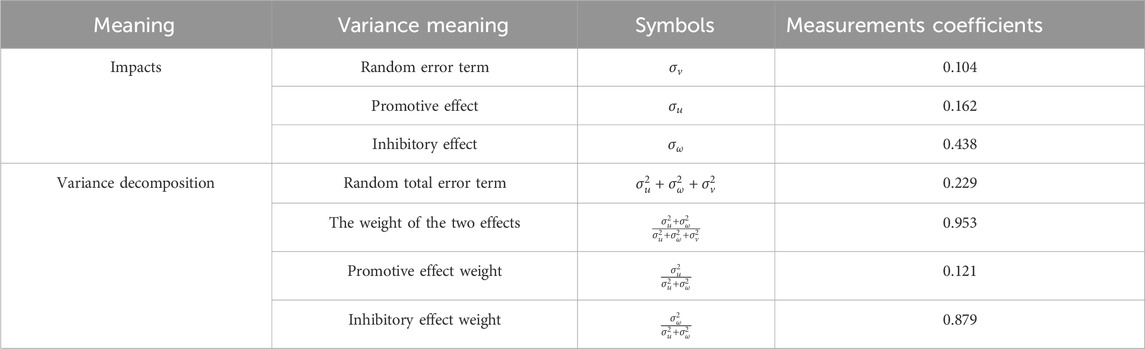
Table 3. Variance decomposition of the impact of talent agglomeration.
Further analysis reveals that the combined bilateral component accounts for 95.3% of the variance in carbon emissions. As shown in Table 3, within this component, the promotive effect accounts for only 12.1%, whereas the inhibitory effect accounts for 87.9%, further evidencing the leading role of the inhibitory effect in emission reduction.
4.1.3 Frontier-level examination analyzing the bilateral effect
Based on Equations 9–11, the promotive, inhibitory, and net effects of talent agglomeration on carbon emissions were estimated as percentages. As shown in Table 4, talent agglomeration increases emissions by 16.2% and reduces them by 43.8%, producing a net reduction of 27.6% relative to the frontier level. This finding suggests that, with the coexistence of both promotive and inhibitory effects of talent agglomeration, assuming the frontier carbon emission is 100%, the final emission level would be 72.4%.
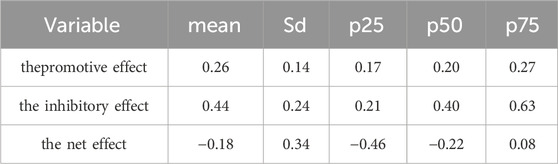
Table 4. Estimation of the net effect of talent agglomeration on carbon emissions (%).
Table 4 demonstrates the variations in the promotive, inhibitory, and net effects of talent agglomeration on carbon emissions. Specifically, at the 25th percentile, the combined effects result in a 28.6% reduction in actual carbon emissions across one-quarter of the regions. At the 50th percentile, the combined effects lead to a 4.2% reduction, while at the 75th percentile, there is a 38.8% increase in carbon emissions. This finding further substantiates the overall inhibitory effect of scientific talent agglomeration on regional carbon emissions. Further analysis reveals that at the second percentile, the impact of environmental regulation decreases by 23.4% compared to the first percentile, whereas at the third percentile, the effect of environmental regulation increases instead of decreasing. This further corroborates the conclusion that talent agglomeration plays a positive environmental role by reducing carbon emissions.
The distribution of the promotive, inhibitory, and net effects of talent agglomeration on carbon emissions is presented in Figure 3, based on province–year estimates for 2013–2023. As shown in Figure 3a, the promotive effect exhibits a right-tailed distribution: most observations lie below 15%, and the frequency drops sharply beyond 20%. This pattern suggests that the emissions-increasing channel is typically weak but occasionally exhibits spikes in a small subset of observations, which may be consistent with short-run scale effects. As shown in Figure 3b, the inhibitory effect has a heavier right tail than the promotion distribution: most observations are at low percentages, with occasional large reductions, which may reflect the lagged materialization of efficiency and regulation gains. As shown in Figure 3c, the net-effect distribution is concentrated on negative values and positive observations are rare, indicating the dominance of the reducing mechanism. This distribution highlights that the inhibitory effect is both more frequent and more substantial than the promotive effect. Overall, these distributions confirm that talent agglomeration exerts a net inhibitory impact on carbon emissions, consistent with our theoretical analysis.

Figure 3. Characteristics of the net effect of talent agglomeration on regional carbon emissions (%).
4.2 Spatial characteristics in the effect of talent agglomeration on regional carbon emissions
Subsequently, we examine the spatial variation in the emission-reducing effects of talent agglomeration across China’s three major regions: Eastern, Central, and Western. Overall, talent agglomeration generates both promotive and inhibitory effects across regions, with the inhibitory effect consistently prevailing and leading to net emission reductions. These results suggest that while talent agglomeration consistently contributes to carbon emission reductions, the magnitude of its impact varies significantly by region.
In the western regions, where infrastructure and technological development levels are relatively low, the technological advancements and government policy support, including talent-rewarding policies and improvements in infrastructure, financial development, and credit optimization, driven by talent agglomeration can substantially improve carbon emission efficiency (Zhuo and Deng, 2020; Zheng et al., 2022). These measures strengthen innovation capacity and energy efficiency, ensuring that the inhibitory effect outweighs the promotive effect and produces the greatest emission reduction in the western region. In the central region, although energy-intensive industries still account for a larger share of the industrial structure (Fan et al., 2011), recent policy-driven talent agglomeration has enhanced efficiency improvements and management upgrading, leading to significant emission reductions (Yang et al., 2021). In the eastern regions, with better infrastructure and technological conditions, and a focus on technology industries and services, talent agglomeration primarily promotes management optimization and technological innovation (Chen et al., 2020). The overall evidence suggests that although both promotive and inhibitory effects coexist in all three regions, the inhibitory effect consistently dominates, producing regionally differentiated but uniformly negative net effects on carbon emissions.
Table 5 displays the frequency distributions of the promotive, inhibitory, and net effects of talent agglomeration on carbon emissions. The inhibitory effect exhibits a pronounced right-tailed distribution, extending beyond the 90th percentile, indicating that in certain provinces carbon emissions indicating that in certain provinces, large reductions occur as talent agglomeration increases. In contrast, the promotive effect weakens beyond the 90th percentile and remains below the inhibitory effect, underscoring its secondary role. The comparative distributions show that while both effects coexist, the inhibitory effect is more frequent and more substantial, consistently dominating the promotive effect. Accordingly, the overall distribution of effects is concentrated on the left half-axis below zero, with higher frequencies than on the right half-axis, confirming that the net impact of talent agglomeration is negative at most quantile points. These findings confirm the dominance of the inhibitory effect and underscore the need for region-specific emission reduction strategies.
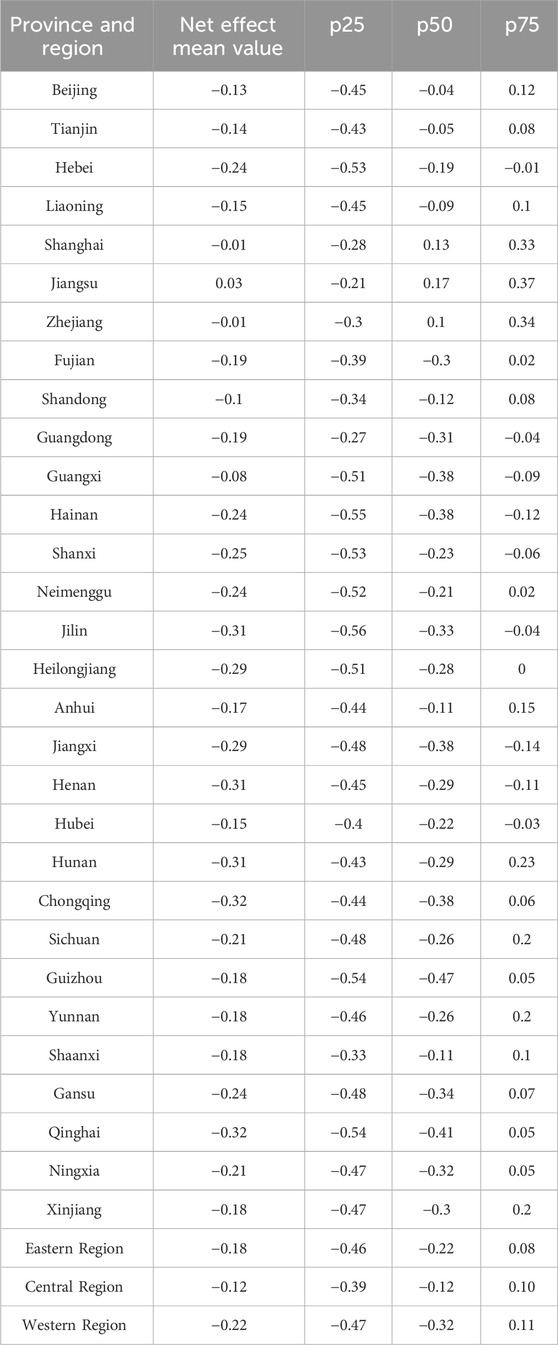
Table 5. Characteristics of the net effect of talent agglomeration on regional carbon emissions (%).
4.3 Temporal characteristics of talent agglomeration impacts on carbon emissions
Different from the linear or nonlinear regression methods used in other literature, the approach in this paper can be used to decompose the bilateral effects of talent agglomeration on carbon emissions for different years, and then analyze the trend characteristics of this impact over time. Figure 4 shows the annual variations in the promotive, inhibitory, and net effects. The results indicate that while both effects coexist, the inhibitory effect generally dominates, keeping the net effect negative in all years except 2014, when a temporary surge in promotion (46.27%) produced a positive net outcome (25.39%). The inhibitory effect peaked in 2013 (71.08%) and again in 2021 (67.80%), while the promotive effect reached its lowest in 2020 (19.90%). This produced a sizable negative net effect in 2020 (−17.36%), which deepened further by 2023 (−27.06%). These patterns suggest that while agglomeration may temporarily raise emissions in the early phase (e.g., 2014), its maturation strengthens the inhibitory channel through efficiency gains and structural upgrading, leading to persistently negative net effects that intensify after 2020.
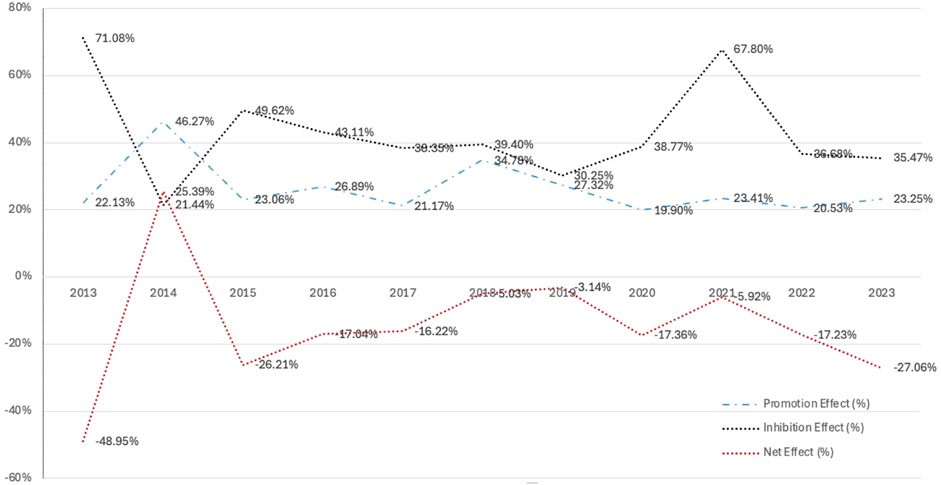
Figure 4. Temporal trends of the bilateral effects of scientific and technological talent agglomeration.
In summary, the net effect of talent agglomeration on carbon emissions was predominantly negative during 2013–2023. Drawing on China’s practice, implementation exhibits a phased transition and lagged cumulative effects: an early and temporary scale-up (e.g., 2014), a near-neutral middle stage around 2018–2019, and a post-2020 efficiency-dominated phase in which the inhibitory channel strengthens with a lag (promotion bottoming in 2020 at 19.90%, inhibition peaking in 2021 at 67.80%). This shows that the impact of talent agglomeration on carbon emissions exhibits stage-specific dynamics and lagged materialization.
4.4 Heterogeneity test of the net effect of talent agglomeration on carbon emission
Drawing from the preceding mechanism analysis, this study hypothesizes that the effects of talent agglomeration on carbon emissions are twofold. The promotive effects may increase energy consumption and emissions through urban expansion, energy-intensive industrial structures and resource misallocation, while the inhibitory effects may enhance energy efficiency and reduce carbon intensity through knowledge exchange, green innovation and industrial upgrading. To examine the heterogeneous effects of talent agglomeration on carbon emissions, this study categorizes regions by urbanization, economic development, and environmental regulation levels, and tests the impacts across different percentiles. The results are presented in Table 6.

Table 6. Differences of the bilateral effects under various talent agglomeration levels (%).
First, this study tested the effects of different degrees of talent agglomeration on emissions. In the 10%–40% range, emissions show a significant increase, followed by a decrease beyond 40%. This inverted U shape identifies a 40% agglomeration degree as the inflection point, demonstrating a substantial impact on sustainable development. However, regional disparities in China make it challenging for all areas to attract talent equally due to varying conditions for talent attraction.
Next, the study examined the urbanization level, a crucial element of the macroeconomic environment that is highly correlated with regional population structure and production methods (Nathaniel et al., 2021). At low levels of urbanization, the promotive effect dominates, as increased infrastructure construction and energy demand temporarily raise emissions. As urbanization advances, however, the inhibitory effect strengthens and overtakes the promotive effect, resulting in a net reduction in emissions. This pattern indicates that while both effects coexist, the balance shifts toward inhibition as urbanization deepens. In the 70%–100% range, the inhibitory effect becomes dominant, reducing emissions relative to lower levels of economic development. This further confirms the inverted U-shaped relationship, with promotive effects stronger at early stages and inhibitory effects prevailing as economic development advances.
Finally, we examined the relationship between talent agglomeration and carbon emissions under different levels of environmental regulation. At low levels of regulation (bottom 40%), the promotive effect dominates, and emissions increase. By contrast, in regions with stricter regulation, the inhibitory effect overtakes the promotive effect, resulting in significant net reductions. This further supports the view that emissions are more effectively reduced through environmental regulation than through other measures.
4.5 Robustness
Three verification methods were adopted to ensure the robustness of the results.
First, considering that potential reverse causality may exist, in which talent agglomeration may affect carbon emissions while carbon emissions may also affect talent agglomeration, this paper adopts the instrumental variable (IV) approach to address the endogeneity problem. Based on this consideration, the first lag of talent agglomeration variable is selected as the instrumental variable, and a two-stage least squares (2SLS) estimation is conducted under the framework of province and year two-way fixed effects. The regression results are reported in Models M5 and M6 of Table 7. In M6, the Cragg–Donald Wald F statistic is 40.5, and the Kleibergen–Paap rk Wald F statistic is 35.2 (p < 0.001), indicating that the selected instrumental variable satisfies the relevance condition. As shown in M6, the impact of talent agglomeration on carbon emissions remains significantly negative, which is consistent with the main conclusions of the baseline regression and the bilateral frontier decomposition, suggesting that the findings of this paper are not driven by endogeneity due to reverse causality.
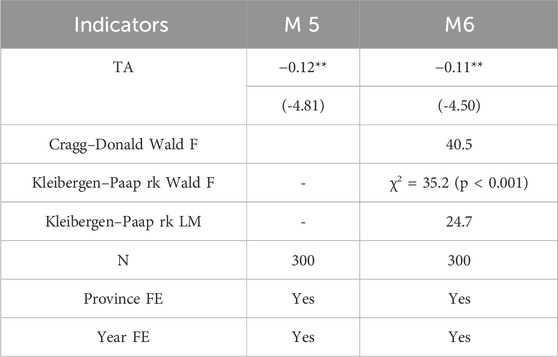
Table 7. Endogeneity test results of the impact of talent agglomeration on carbon emissions.
Then replacing the proportion of total city RCE to GDP as a proxy for carbon emissions still confirmed the existence of bilateral effects. The findings show that the promoting effect is 0.5590, while the inhibiting effect stands at 0.9486. This result confirms the statistical significance of talent agglomeration on carbon emissions and clarifies that talent agglomeration has bilateral effects on carbon emissions, consistent with the findings mentioned above.
Moreover, based on the impact weights, the promoting and inhibiting effects of talent agglomeration account for 9.2% and 90.8%, respectively. This indicates that over the years, the inhibiting effect has been dominant, which is consistent with the study’s conclusions. The variations in the inhibiting, net, and promoting effects were re-estimated, and these results are illustrated in Table 8. The study found that as the degree of talent agglomeration increases, its promoting effect raises carbon emissions, while the inhibiting effect curbs regional carbon emissions. The net effect leads to actual carbon emissions falling below the frontier level, aligning with the conclusions.
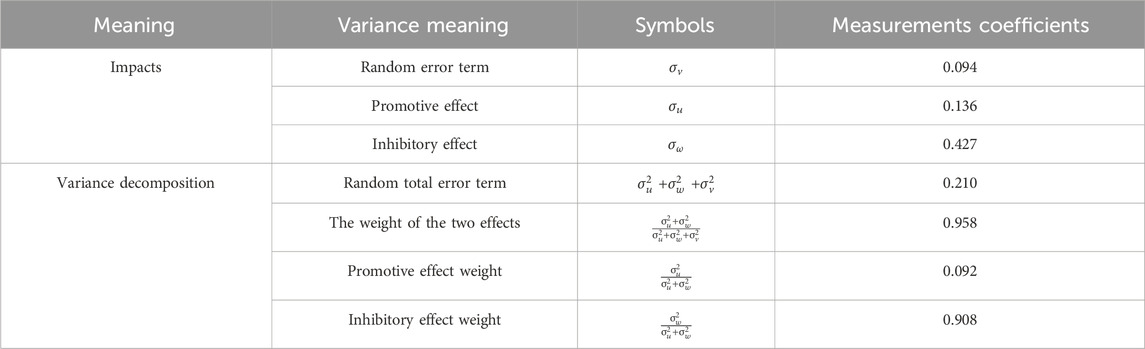
Table 8. Robustness test for the deviation of talent agglomeration’s impacts on regional carbon emissions (%).
5 Conclusion and policy implications
5.1 Conclusion
This study proposed a decomposition approach to examine the bilateral effects of talent agglomeration on carbon emissions. Utilizing panel data from 30 Chinese provinces from 2013 to 2023 and applying a two-tier stochastic frontier model, the study empirically decomposed the promotive and inhibitory effects of talent agglomeration and assessed their net impact. It further investigated the temporal, regional, and contextual heterogeneity of these effects.
The empirical findings reveal the following: (1) Talent agglomeration exhibits asymmetric bilateral effects on regional carbon emissions, with an overall inhibitory impact. On average, it increases emissions by 16.2% through the promotive channel but reduces them by 43.8% through the inhibitory channel, leading to a net reduction of 27.6% relative to the frontier level. (2) The net effect of talent agglomeration on carbon emissions is predominantly negative across different periods. After a brief increase in 2014, the inhibitory effect strengthened, particularly after 2020. (3) Regional heterogeneity is evident: the western region achieves significantly larger net reductions than the central and eastern regions. (4) Heterogeneity analysis shows that regions with higher talent agglomeration (≥40%), advanced economic development (70%–100%), and stricter environmental regulation experience greater net reductions in emissions, whereas at low urbanization stages the promotive effect dominates but shifts toward inhibition as urbanization deepens.
5.2 Policy implications
For policymakers aiming to harness talent agglomeration as a mechanism to promote sustainable development, our findings provide essential guidance, highlighting that while both promotive and inhibitory effects coexist, the inhibitory effects dominate overall, leading to a net reduction in carbon emissions. Tailoring strategies to fit specific regional conditions is therefore crucial to fully leverage talent’s role in emission reduction.
First, policymakers should adopt a demand-oriented approach to talent agglomeration, ensuring that talent attraction is closely aligned with local industrial development and environmental needs. Our findings demonstrate that enhancing the degree of talent agglomeration contributes significantly to effective emission reductions, if strategies are tailored to fit specific regional conditions. Accordingly, the identification and prioritization of key demands in industrial upgrading, R&D, and technology transfer is proposed, along with policies to guide the precise agglomeration of talent to address these needs. By aligning talent policies with local economic and environmental priorities, regions can foster multi-stakeholder collaboration and build sustainable innovation ecosystems that amplify the environmental benefits of talent agglomeration.
Second, the optimization of the spatial layout of talent agglomeration and the strengthening of cross-regional cooperation are advocated to enhance overall emission reduction. Empirical evidence shows that the inhibitory effect has strengthened since 2020, with the western region demonstrating greater emission reductions than the central and eastern regions. Regional cooperation should proceed along two complementary paths. Promoting local and neighboring talent exchange is anticipated to mitigate the negative spillover effects of over-agglomeration; meanwhile, cooperation and technical support with economically similar regions—through interregional talent cooperation funds, joint R&D, and technology transfer platforms—can unlock positive spillover potential and ensure that inhibitory effects dominate, resulting in net emission reductions. Ultimately, building cross-regional complementary innovation networks is essential to generate synergistic effects among regions, thereby enhancing national carbon reduction benefits and promoting high-quality economic development.
Finally, it is necessary to tailor talent agglomeration strategies to distinct regional conditions to strengthen the inhibitory effects on carbon emissions. Establish flexible, region-specific policies that align with the economic development stage, industrial structure, and existing talent levels in each area. Developed regions should consolidate the energy-efficiency gains of talent agglomeration, whereas less-developed regions should focus on building the foundations to enhance its inhibitory effects. In practice, this requires creating supportive platforms and career opportunities for talent retention—such as establishing region-specific priority projects and improving compensation schemes—so that talent agglomeration can more effectively contribute to carbon reduction and environmental sustainability across regions. These tailored strategies will ensure that talent agglomeration contributes effectively to carbon reduction and environmental sustainability in each region.
5.3 Research limitation and future work
These findings open the door to future longitudinal research linking the bilateral effects of talent agglomeration on carbon emissions by showing that such agglomeration might be generally viewed as related to significant environmental outcomes, thus supplementing and extending previous studies. Like any other study, this study is not free from limitations. Owing to data constraints, this study analyzes the bilateral effects of talent agglomeration on carbon emissions from a macro perspective and does not account for the impact of micro-level enterprises and individual talent contributions on regional energy conservation and emission reduction. Ideally, these findings should be replicated in a study that explores a wider variety of environmental pollutants, including carbon dioxide emissions, wastewater contamination, and solid waste pollution. This approach would yield a more comprehensive understanding of how scientific and technological talent agglomeration impacts the environment.
Data availability statement
The raw data supporting the conclusions of this article will be made available by the authors, without undue reservation.
Author contributions
YZ: Writing – original draft, Validation, Conceptualization. XY: Conceptualization, Funding acquisition, Resources, Writing – original draft, Formal analysis. QW: Writing – review and editing, Supervision, Project administration. CL: Writing – review and editing, Validation, Supervision, Conceptualization. YR: Validation, Methodology, Software, Writing – review and editing. TW: Visualization, Writing – review and editing.
Funding
The author(s) declare that no financial support was received for the research and/or publication of this article.
Conflict of interest
The authors declare that the research was conducted in the absence of any commercial or financial relationships that could be construed as a potential conflict of interest.
Generative AI statement
The author(s) declare that no Generative AI was used in the creation of this manuscript.
Any alternative text (alt text) provided alongside figures in this article has been generated by Frontiers with the support of artificial intelligence and reasonable efforts have been made to ensure accuracy, including review by the authors wherever possible. If you identify any issues, please contact us.
Publisher’s note
All claims expressed in this article are solely those of the authors and do not necessarily represent those of their affiliated organizations, or those of the publisher, the editors and the reviewers. Any product that may be evaluated in this article, or claim that may be made by its manufacturer, is not guaranteed or endorsed by the publisher.
References
Andersson, M., and Lööf, H. (2011). Agglomeration and productivity: evidence from firm-level data. Ann. Reg. Sci. 46, 601–620. doi:10.1007/s00168-009-0352-1
Cao, H., Peng, L., Yan, Z., and Xu, J. (2023). Does perfect regional innovation ecosystem curb carbon emissions? A measure based on the niche fitness. Environ. Impact Assess. Rev. 102, 107219. doi:10.1016/j.eiar.2023.107219
Chen, S., Shi, A., and Wang, X. (2020). Carbon emission curbing effects and influencing mechanisms of China’s emission trading scheme: the mediating roles of technique effect, composition effect and allocation effect. J. Clean. Prod. 264, 121700. doi:10.1016/j.jclepro.2020.121700
Cheng, L., Yin, L., Wang, J., Shen, T., Chen, Y., Liu, G., et al. (2021). Behavioral decision-making in power demand-side response management: a multi-population evolutionary game dynamics perspective. Int. J. Electr. Power Energy Syst. 129, 106743. doi:10.1016/j.ijepes.2020.106743
Crowley-Henry, M., and Al Ariss, A. (2018). Talent management of skilled migrants: propositions and an agenda for future research. Int. J. Hum. Resour. Manag. 29, 2054–2079. doi:10.1080/09585192.2016.1262889
Dost, M., and Badir, Y. F. (2018). Generation or adoption? The role of social capital. Manag. Decis. 57, 1457–1471. doi:10.1108/MD-11-2017-1108
Fan, S., Kanbur, R., and Zhang, X. (2011). China’s regional disparities: experience and policy. Rev. Dev. Finance 1, 47–56. doi:10.1016/j.rdf.2010.10.001
Glaeser, E. L., and Kerr, W. R. (2009). Local industrial conditions and entrepreneurship: how much of the spatial distribution can we explain? J. Econ. Manag. Strateg. 18, 623–663. doi:10.1111/j.1530-9134.2009.00225.x
Han, F., Xie, R., Lu, Y., Fang, J., and Liu, Y. (2018). The effects of urban agglomeration economies on carbon emissions: evidence from Chinese cities. J. Clean. Prod. 172, 1096–1110. doi:10.1016/j.jclepro.2017.09.273
Jiang, X., Fu, W., and Li, G. (2020). Can the improvement of living environment stimulate urban innovation? Analysis of high-quality innovative talents and foreign direct investment spillover effect mechanism. J. Clean. Prod. 255, 120212. doi:10.1016/j.jclepro.2020.120212
Kuang, Y., Fan, Y., Bin, J., and Fan, M. (2024). Impact of the digital economy on carbon dioxide emissions in resource-based cities. Sci. Rep. 14, 16514. doi:10.1038/s41598-024-66005-0
Kumbhakar, S. C., and Parmeter, C. F. (2009). The effects of match uncertainty and bargaining on labor market outcomes: evidence from firm- and worker-specific estimates. J. Prod. Anal. 31, 1–14. doi:10.1007/s11123-008-0117-3
Lei, P., Cai, Q., and Jiang, F. (2024). Assessing the impact of environmental regulation on enterprise high-quality development in China: a two-tier stochastic frontier model. Energy Econ. 133, 107502. doi:10.1016/j.eneco.2024.107502
Li, R., and Ramanathan, R. (2018). Exploring the relationships between different types of environmental regulations and environmental performance: evidence from China. J. Clean. Prod. 196, 1329–1340. doi:10.1016/j.jclepro.2018.06.132
Li, X., Zhou, M., Zhang, W., Yu, K., and Meng, X. (2022). Study on the mechanism of haze pollution affected by urban population agglomeration. Atmosphere 13, 278. doi:10.3390/atmos13020278
Lin, X., Ren, T., Wu, H., and Xiao, Y. (2021). Housing price, talent movement, and innovation output: evidence from Chinese cities. Rev. Dev. Econ. 25, 76–103. doi:10.1111/rode.12705
Liu, X., and Zhang, X. (2021). Industrial agglomeration, technological innovation and carbon productivity: evidence from China. Resour. Conserv. Recycl. 166, 105330. doi:10.1016/j.resconrec.2020.105330
Liu, C., Wang, W., Ding, C., Teng, X., Ye, Y., and Zhang, Z. (2023). The bilateral effects of digital economy on regional carbon emissions in China. Front. Environ. Sci. 11, 1287811. doi:10.3389/fenvs.2023.1287811
Martin, R., and Sunley, P. (2006). Path dependence and regional economic evolution. J. Econ. Geogr. 6, 395–437. doi:10.1093/jeg/lbl012
Meyers, M. C., van Woerkom, M., Paauwe, J., and Dries, N. (2020). HR managers’ talent philosophies: prevalence and relationships with perceived talent management practices. Int. J. Hum. Resour. Manag. 31, 562–588. doi:10.1080/09585192.2019.1579747
Nathaniel, S. P., Nwulu, N., and Bekun, F. (2021). Natural resource, globalization, urbanization, human capital, and environmental degradation in Latin American and Caribbean countries. Environ. Sci. Pollut. Res. 28, 6207–6221. doi:10.1007/s11356-020-10850-9
Oliveira, E. A., Andrade, J. S., and Makse, H. A. (2014). Large cities are less green. Sci. Rep. 4, 4235. doi:10.1038/srep04235
Peng, H., Shen, N., Ying, H., and Wang, Q. (2021). Can environmental regulation directly promote green innovation behavior? Based on situation of industrial agglomeration. J. Clean. Prod. 314, 128044. doi:10.1016/j.jclepro.2021.128044
Robertson, T. S., and Gatignon, H. (1986). Competitive effects on technology diffusion. J. Mark. 50, 1–12. doi:10.1177/002224298605000301
Shen, N., and Peng, H. (2021). Can industrial agglomeration achieve the emission-reduction effect? Socioecon. Plann. Sci. 75, 100867. doi:10.1016/j.seps.2020.100867
Shi, J., and Lai, W. (2019). Incentive factors of talent agglomeration: a case of high-tech innovation in China. Int. J. Innov. Sci. 11, 561–582. doi:10.1108/IJIS-05-2019-0048
Shi, J., and Lai, W. (2023). Fuzzy AHP approach to evaluate incentive factors of high-tech talent agglomeration. Expert Syst. Appl. 212, 118652. doi:10.1016/j.eswa.2022.118652
Shi, K., Chen, Y., Li, L., and Huang, C. (2018). Spatiotemporal variations of urban CO2 emissions in China: a multiscale perspective. Appl. Energy 211, 218–229. doi:10.1016/j.apenergy.2017.11.042
Sun, W., and Huang, C. (2020). How does urbanization affect carbon emission efficiency? Evidence from China. J. Clean. Prod. 272, 122828. doi:10.1016/j.jclepro.2020.122828
Taskin, F., and Zaim, O. (2001). The role of international trade on environmental efficiency: a DEA approach. Econ. Model. 18, 1–17. doi:10.1016/S0264-9993(00)00025-0
Tian, Y., Zhang, Y., Zhang, T., and Zhu, Y. (2024). Co-agglomeration, technological innovation and haze pollution: an empirical research based on the middle reaches of the yangtze river urban agglomeration. Ecol. Indic. 158, 111492. doi:10.1016/j.ecolind.2023.111492
Wang, L., and Chen, L. (2023). Impacts of digital economy agglomeration on carbon emission: a two-tier stochastic frontier and spatial decomposition analysis of China. Sustain. Cities Soc. 95, 104624. doi:10.1016/j.scs.2023.104624
Wang, J., and Han, P. (2023). The impact of industrial agglomeration on urban green land use efficiency in the yangtze river economic belt. Sci. Rep. 13, 974. doi:10.1038/s41598-023-28250-7
Wang, Y., and Wang, J. (2019). Does industrial agglomeration facilitate environmental performance: new evidence from urban China? J. Environ. Manage. 248, 109244. doi:10.1016/j.jenvman.2019.07.015
Wang, F., Fan, W., Liu, J., Wang, G., and Chai, W. (2020a). The effect of urbanization and spatial agglomeration on carbon emissions in urban agglomeration. Environ. Sci. Pollut. Res. 27, 24329–24341. doi:10.1007/s11356-020-08597-4
Wang, L., Xue, Y., Chang, M., and Xie, C. (2020b). Macroeconomic determinants of high-tech migration in China: the case of yangtze river Delta urban agglomeration. Cities 107, 102888. doi:10.1016/j.cities.2020.102888
Wang, H., Du, S., Zhong, Y., Liu, S., Xu, T., Zhao, Y., et al. (2024). Unveiling the impact mechanism of urban resilience on carbon dioxide emissions of the pearl river Delta urban agglomeration in China. Environ. Impact Assess. Rev. 105, 107422. doi:10.1016/j.eiar.2024.107422
Wingreen, S. C., and Blanton, J. E. (2018). IT professionals’ person–organization fit with IT training and development priorities. Inf. Syst. J. 28, 294–317. doi:10.1111/isj.12135
Wu, H., Li, Y., Hao, Y., Ren, S., and Zhang, P. (2020). Environmental decentralization, local government competition, and regional green development: evidence from China. Sci. Total Environ. 708, 135085. doi:10.1016/j.scitotenv.2019.135085
Wu, L., Jia, X., Gao, L., and Zhou, Y. (2021). Effects of population flow on regional carbon emissions: evidence from China. Environ. Sci. Pollut. Res. 28, 62628–62639. doi:10.1007/s11356-021-15131-7
Wuyts, S., and Dutta, S. (2014). Benefiting from alliance portfolio diversity: the role of past internal knowledge creation strategy. J. Manag. 40, 1653–1674. doi:10.1177/0149206312442339
Yang, X., Zhang, J., Ren, S., and Ran, Q. (2021). Can the new energy demonstration city policy reduce environmental pollution? Evidence from a quasi-natural experiment in China. J. Clean. Prod. 287, 125015. doi:10.1016/j.jclepro.2020.125015
Yang, S., Wang, W., Feng, D., and Lu, J. (2022). Impact of pilot environmental policy on urban eco-innovation. J. Clean. Prod. 341, 130858. doi:10.1016/j.jclepro.2022.130858
Ye, J., Wan, Q., Li, R., Yao, Z., and Huang, D. (2022). How do R&D agglomeration and economic policy uncertainty affect the innovative performance of Chinese high-tech industry? Technol. Soc. 69, 101957. doi:10.1016/j.techsoc.2022.101957
Yi, Y., Qi, J., and Chen, D. (2022). Impact of population agglomeration in big cities on carbon emissions. Environ. Sci. Pollut. Res. 29, 86692–86706. doi:10.1007/s11356-022-21722-9
York, R. (2007). Demographic trends and energy consumption in european union nations, 1960–2025. Soc. Sci. Res. 36, 855–872. doi:10.1016/j.ssresearch.2006.06.007
Zhang, Z., Wang, M., Tian, L., and Zhang, W. (2017). Research on the development efficiency of regional high-end talent in China: a complex network approach. PLoS One 12, e0188816. doi:10.1371/journal.pone.0188816
Zhang, L., Mu, R., Zhan, Y., Yu, J., Liu, L., Yu, Y., et al. (2022). Digital economy, energy efficiency, and carbon emissions: evidence from provincial panel data in China. Sci. Total Environ. 852, 158403. doi:10.1016/j.scitotenv.2022.158403
Zhang, P., Qian, Y., Wang, X., and Yang, F. (2024a). Can technological talent agglomeration improve carbon emission efficiency? Evidence from China. Environ. Dev. Sustain. doi:10.1007/s10668-024-04909-7
Zhang, Y., Liu, C., Wang, T., and Zhang, X. (2024b). Do all roads lead to rome? Conditions and configurations of digital economy on carbon emission efficiency. J. Environ. Manage. 371, 123154. doi:10.1016/j.jenvman.2024.123154
Zheng, C., Deng, F., Li, C., and Yang, Z. (2022). The impact of China’s Western development strategy on energy conservation and emission reduction. Environ. Impact Assess. Rev. 94, 106743. doi:10.1016/j.eiar.2022.106743
Zhou, Y., Guo, Y., and Liu, Y. (2018). High-level talent flow and its influence on regional unbalanced development in China. Appl. Geogr. 91, 89–98. doi:10.1016/j.apgeog.2017.12.023
Zhuo, C., and Deng, F. (2020). How does China’s Western development strategy affect regional green economic efficiency? Sci. Total Environ. 707, 135939. doi:10.1016/j.scitotenv.2019.135939
Keywords: talent agglomeration, carbon emissions, bilateral stochastic frontier model, promotive effect, heterogeneous characteristics
Citation: Zhang Y, Yang X, Wang Q, Liu C, Ren Y and Wang T (2025) Talent agglomeration and carbon emissions in China: promotive effect or inhibitory effect? analysis on heterogeneous bilateral stochastic frontier model. Front. Environ. Sci. 13:1630688. doi: 10.3389/fenvs.2025.1630688
Received: 21 May 2025; Accepted: 20 August 2025;
Published: 17 September 2025.
Edited by:
Irina Georgescu, Bucharest Academy of Economic Studies, RomaniaCopyright © 2025 Zhang, Yang, Wang, Liu, Ren and Wang. This is an open-access article distributed under the terms of the Creative Commons Attribution License (CC BY). The use, distribution or reproduction in other forums is permitted, provided the original author(s) and the copyright owner(s) are credited and that the original publication in this journal is cited, in accordance with accepted academic practice. No use, distribution or reproduction is permitted which does not comply with these terms.
*Correspondence: Yue Zhang, enl0b2tpb0BoaHUuZWR1LmNu
†These authors have contributed equally to this work and share first authorship