 Masahiro Tomita
 Eran Friedler*
- Faculty of Civil and environmental Engineering, Technion – Israel institute of Technology, Haifa, Israel
Non-conventional water sources such as surface water (stormwater) and greywater have gained attention due to ever-increasing water demand and growing water scarcity. Electrocoagulation (ELC) is often used for treating these waters. Rotational and hydraulic mixing have been the conventional mixing methods for ELC, however there is no dominant design for ELC reactors. In this research, mixing in ELC was achieved by a novel wave-like sinusoidal oscillatory mixing. The electrodes in this combined treatment method have a dual function as a source of coagulant and as mixing paddles. The aim of the research was to develop and study the novel oscillatory ELC for different types of water: synthetic surface water (SSW), synthetic greywater (SGW), and real greywater (RGW). Experiments with SSW revealed the distance between the electrodes should be in the range of 0.8–1.0 cm to ascertain optimal mixing. The oscillatory ELC efficiently removed turbidity from the SSW. ELC removed 96, 91, 34, 42, and 2% of the turbidity, TP, COD, DOC, and TN from SGW. Floatation by gas bubbles generated in the process removed pollutants effectively, thus the slow mixing time could be shortened from 30 to 10 min, implying smaller volumes of mixing tanks. For RGW ELC removed 96, 47, 72, 35, and 11% of the turbidity, TP, COD, DOC, and TN respectively at pH 8. In ELC, hydrogen gas production at the cathode releases hydroxides to the solution. Aluminum ions produced at the anode, consume most of the hydroxides present in the solution to form several dissolved aluminum species. This keeps the pH of the solution relatively stable during ELC treatment (unlike CC with aluminum species). In summary, the oscillatory ELC was found to be a viable option to treat stormwater and greywater, requiring less pH adjustment, having lower footprint, less sludge production, no addition of chemical coagulants, and easy operation and maintenance over conventional chemical coagulation.
1 Introduction
Ever-increasing population and economic growth are posing worldwide water scarcity. Water treatment technology for clean water production must be thoroughly investigated together with efficient and low-cost wastewater reclamation to meet this demand. Recovery of greywater (GW), wastewater containing water from baths, showers and washbasins (excluding wastewater from toilets and kitchens), has gained attention over the last two decades for its high potential in reducing water consumption (Gross et al., 2015).
Treating surface water (SW) and GW requires methods such as coagulation and filtration. Among these methods, electrocoagulation (ELC) is an attractive technology, as it only requires compact settings and easy operation and maintenance (Mollah et al., 2004). The operation and maintenance of ELC are simplified because unlike chemical coagulation (CC), ELC does not require transportation, storage, and dosing of chemicals. ELC only requires replacement of sacrificial electrodes every few months. Few studies have explored ELC for GW treatment (Lin et al., 2005; Bani-Melhem and Smith, 2012; Vakil et al., 2014; Barişçi and Turkay, 2016; Elazzouzi et al., 2017). However, additional research on ELC for SW and GW treatment is still required to assess its performance. Furthermore, unlike established method of conventional chemical coagulation, there is no dominant design for ELC reactors, making the actual implementation difficult (Holt et al., 2005; Govindan et al., 2025).
Katoshevski (2006) first developed a mathematical model for particle grouping under wave-like oscillating flow inspired from grouping of fuel droplets in a combustion chamber. Katoshevski et al. (2010) studied grouping of particles emitted from diesel engines. In this research, particles were subjected to low and high velocities periodically in alternating diameter pipe. Due to variation in local velocities, particles could not immediately react to the changes, collided with each other and tended to agglomerate. This oscillatory grouping was investigated for particles in water as well. Winter et al. (2007) showed that numerical model’s simulations were in scale with flocs created by oscillatory flow in tidal channels. In oscillatory mixing of water, the paddle moves back and forth in a sinusoidal motion for both rapid and slow mixing. Halfi et al. (2019), Halfi et al. (2020) demonstrated that oscillatory mixing removed colloids from water faster than conventional coagulation-flocculation. Bendory and Friedler (2025) further performed oscillatory mixing with alum for synthetic surface water treatment and optimized parameters such as amplitude, rapid- and slow-mixing duration and frequency, beaker shape, and paddle type and location. At optimal conditions, the oscillatory mixing removed turbidity from water as efficient as the conventional mixing. The research emphasized the significant effect of the size of vortices created by the oscillatory mixing on the particles grouping.
In this research, electrodes of ELC are used as paddles for creating this wave-like oscillation for rapid- and slow-mixing. The goal of the study is to develop and study the performance of the oscillatory ELC system for a different type of water (synthetic surface water - SSW, synthetic greywater - SGW, and real greywater - RGW). We hypothesize that the oscillatory ELC system should perform equal or to-better than-conventional flocculation (represented by jar test) for pollutants removal (namely: turbidity, COD, DOC, TP, and TN). The current study proposes a new design for ELC, examining its feasibility and shedding light on various facets of oscillatory ELC for treating surface water and greywater.
2 Materials and methods
2.1 Experimental systems
2.1.1 Oscillatory ELC
A typical ELC device consists of sacrificial anode, cathode, and energy supplied by a DC source. The sacrificial anode (aluminum in the current research) releases aluminum ions to the solution when electricity is applied, while the stainless-steel cathode releases hydrogen gas. In conventional ELC, the electrodes are stationary, and a mixer mixes the solution to distribute the coagulants. In the current study, the electrodes have dual functions as a source of coagulant/gas and as mixers. The electrodes were attached to a non-conductive support. This support was connected to a moving bridge (Figure 1) to introduce oscillatory mixing (paddles move back and forth horizontally) for both rapid- and slow-mixing. A servo motor (AKM32D, Kollmorgen, Brno, Czech Republic) was connected to a linear rail and a moving element (forward and backward, M55 Ball Screw Drive, Thompson, Bidford, United Kingdom). The sinusoidal motion of the servo linear motor was controlled by the Control Studio software (Servotronix, Petach-Tikva, Israel). Figure 2 shows typical feedback from the software for sinusoidal pattern of velocity and position of the paddles. The paddle’s range of motion is ±20 mm, where 0 is defined as the center of the amplitude. Based on Bendory and Friedler (2025), amplitude, rapid- and slow-mixing frequency were kept as 20 mm, 1 Hz and 0.5 Hz respectively. The duration of rapid mixing depended on the time needed for electrolysis (release of the right amount of aluminum ions to the water), and settling time was set as 30 min. Parameters such as slow mixing duration, pH, current, and distance between electrodes were investigated and optimized with different test waters. The dimensions of all electrodes (anode and cathode) were 30 mm width x 120 mm length x 2 mm thickness, and the submerged area of the electrodes were 61.4 cm2. The cathode was made of stainless steel. Aluminum was chosen as the sacrificial electrode (anode) due to its availability, low cost, better dissolution, and high coagulation efficiency (Sahu et al., 2014). The height of the electrodes (paddle for CC) was adjusted, so that the distance between the lower tip of the electrode to the bottom of the beaker was 2.0 cm. The center of the electrodes was set at half the radial distance from the center of the beaker (Bendory and Friedler, 2025).
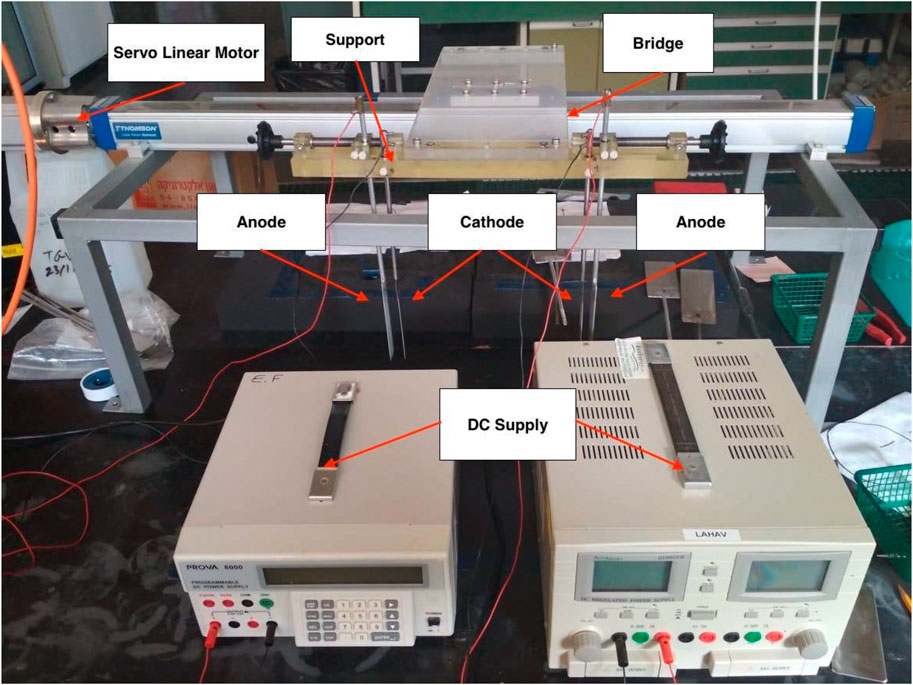
Figure 1. Oscillatory ELC device. The device has two stations for oscillatory ELC, each one comprising of an anode and a cathode.
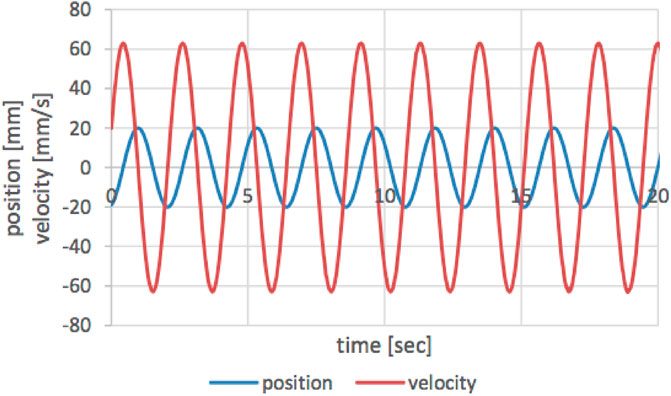
Figure 2. The sinusoidal motion - velocity and the oscillatory device position vs. time.
2.1.2 Oscillatory CC and Jar test
Oscillatory Chemical Coagulation (CC), performed by oscillatory mixing, mixes the coagulant (alum in the current study) to the solution by linear mixing like oscillatory ELC. However, unlike oscillatory ELC, oscillatory CC has only one stainless paddle that mixes the solution. Oscillatory CC was used to verify oscillatory ELC system performance for SSW treatment. Parameters such as amplitude, mixing duration, frequency, settling duration, pH, dose, and paddle type and location were adapted from Bendory and Friedler (2025). Conventional jar test device (Phipps & Bird Stirrer) was used to compare results with the oscillatory ELC for synthetic greywater and real greywater.
2.2 Test solutions
The research was carried out with three different types of water: Synthetic surface water (SSW) was investigated to verify oscillatory ELC’s performance; synthetic greywater (SGW) was examined to further optimize oscillatory ELC’s parameters for greywater treatment and to compare oscillatory ELC with CC (jar test); lastly, oscillatory ELC and jar test performance for real greywater (RGW) treatment were compared.
2.2.1 Synthetic surface water (SSW)
The mineral content of synthetic surface water was prepared according to Zarchi et al. (2013), imitating the annual averages of mineral composition of surface water at Israel’s central surface water filtration plant. Ground Kaolin clay (ACROS Organics, Al2H4O9Si2), with a volume-weighted median diameter of 3.4 µm and zeta potential of −47.7 mV, was added as a representative of mineral colloidal particles. This very fine clay was selected to challenge the system. 37.5 mg/L kaolin particles were added to the water solution to achieve initial turbidity of 50 NTU.
2.2.2 Synthetic greywater (SGW)
Physicochemical characteristics of greywater vary significantly by location and time as it is affected by the specific water usage, socio-economic background, lifestyle, time of the day, seasons, and so on. Because raw greywater’s characteristics are highly variable, it makes oscillatory ELC system parameter’s optimization difficult. Thus, at first, the treatment was employed on synthetic greywater (having constant concentration of pollutants) and then on the real greywater.
Synthetic greywater (SGW) recipe was taken from Diaper et al. (2008) modified by Song et al. (2017), with the following ingredients: Velveta Hand & Body Care Cream for moisturizer, Colgate Triple Action (Original Mint) toothpaste, SpeedStick Stainguard Clean Antiperspirant deodorant, Shufersal Purifed Soy Oil, and Pinuk shampoo.
The volume of synthetic greywater prepared for one set of experiments was 20 L. Ingredients except for clay were added together to a 1 L beaker with distilled water. This concentrated solution was heated and kept at around 40°C and mixed by a magnetic stirrer for 1 h. Then the solution was transferred to a tank and filled with distilled water very close to 20 L (a small margin was kept for the addition of Kaolin solution). The tank was mixed overnight. Kaolin, pure, ACROS OrganicsTM (Clay) solution was prepared with distilled water in 500 mL beaker to achieve 50 mg/L in the 20 L tank. The Kaolin solution was mixed for at least 15 min by magnetic stirrer and was added to the above tank. The tank was mixed for another 15 min to achieve a homogenous solution. Then, mixing was stopped for 15 min for settling to imitate collection tank of greywater. 12 L from the solution was pumped to another tank from just below the surface of the SGW in the tank to collect supernatant. The final characteristics of the SGW are shown in Table 1 below.
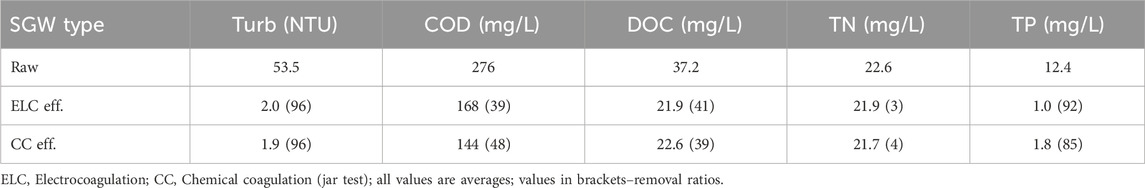
Table 1. SGW quality (raw and treated).
2.2.3 Real greywater (RGW)
Real greywater (RGW) was collected from greywater collecting tank in a residential house near Haifa, Israel. The RGW was light greywater that did not contain streams from the kitchen sink and washing machine. About 20 L of RGW was collected and mixed prior to the experiments.
2.3 Default experimental procedure
The default experimental procedure describes the experiments mainly done for optimizing parameters for oscillatory ELC. The procedure is similar to that of oscillatory CC, thus both oscillatory CC and ELC’s procedure are addressed here.
1.5 L of test water was poured to 2 L beaker. When performing oscillatory ELC, electrodes were connected to DC power supply (PROVA 8000 and Aviv Energy WJ3003XIII). The servo linear motor was operated for 1 min at 1 Hz before electrolysis (coagulant addition) to homogenize the solution. When pH adjustment was necessary, H2SO4 (0.1 N) or NaOH (0.1 N) was added, and the solution was mixed for another 1 min at 1 Hz of oscillatory frequency.
For the oscillatory ELC, rapid mixing with 1 Hz was performed according to the electrolysis duration as determined by Faraday’s law. Worth noting that there is a deviation between the theoretical dose determined by Faraday’s law and the actual dose. Usually, the actual dose is higher than the theoretical one, yielding current efficiency over 100%. This is due to pitting corrosion (Chen, 2004) and dissolution of anode material from localized low pH. Hence, to compare the actual dose of ELC to CC, we measured actual aluminum concentration by ICP-AES (Thermo SCIENTIFIC, iCAP 6000 SERIES). The ICP results revealed current efficiency of 112% with high coefficient of determination (99.996%, Figure 3). ELC’s theoretical dose was multiplied by this factor to obtain the same aluminum dose as CC.
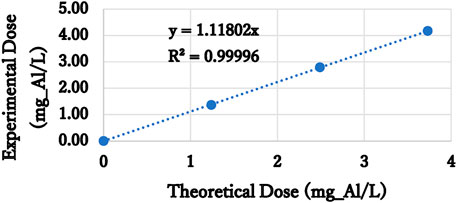
Figure 3. Amount of theoretical aluminum dose vs. amount of experimental measured aluminum.
For oscillatory CC, the rapid mixing time was 1 min at 1 Hz as determined by Bendory and Friedler (2025).
After rapid mixing, the solution was slow-mixed with oscillation frequency of 0.5 Hz for specific amount of time according to the experiment (10–30 min). Finally, the solution was left to settle for 30 min. Then, the solution was sampled by pipette from 3 cm below the solution water surface.
2.4 Jar test
500 mL of test water was poured into 1 L beaker. Alum and H2SO4 (0.1 N) or NaOH (0.1 N) was inserted to the water when pH adjustment was necessary, and mixed for 5 min at 100 rpm. Slow mixing was performed at 25 rpm for 30 min, after which, the water was left still for 30 min for sedimentation. The solution was sampled by pipette from 3 cm below the solution water surface.
2.5 Vortices characterisation
Water coloring experiments were performed in order to observe and characterise vortices created by the oscillatory mixing. Synthetic surface water without Kaolin was dosed with a small amount of dye (acid red 1, Sigma Aldrich). The water was slowly mixed, and the surface of the beaker was filmed by a webcam (Logitech C170). The experiments were performed with different distances between electrodes (0.7–2.5 cm).
2.6 Microscopic observation
Microscopic observation for the raw water, sediments, and supernatant was carried out by confocal microscope (DMi8, LEICA) with x25 magnification lens. Images were taken for synthetic greywater. The results were analyzed with LAS X software (Leica Application Suite X). Raw samples were taken from SGW. From the treated greywater, samples were taken after 30 min of sedimentation. For oscillatory ELC-treated samples, sediments were collected from the bottom of the beaker, supernatant from 3 cm below the solution’s surface, and gas-floated flocs from the solution surface. For jar test treated samples, sediments were collected from the bottom of the beaker and supernatant from 3 cm below the solution’s surface. Samples were collected by glass pipettes. Pipettes’ tips were intentionally broken to widen the entrance to the samples in order not to break the flocs. Samples were placed on microscope slides and covered, then dried in an oven at 60°C for more than an hour. After drying, samples were kept in a desiccator until microscopic observation.
2.7 Measurement methods
General physicochemical parameters were analyzed by standard analysis methods (APHA, 2012): Total Phosphorus (TP) was measured by method 4500P; Chemical Oxygen Demand (COD) by method 5220B; Total Suspended Solids (TSS) by method 2540D. DOC (Dissolved Organic Carbon) samples were filtered by 0.45 μm filter. DOC and Total Nitrogen (TN) were measured by total organic carbon analyzer, TOC-V CPH, equipped with total nitrogen measuring unit TNM-1 (Shimadzu, Japan). TP, COD, DOC and TN samples were taken from 3 cm below the solution’s surface, after 30 min of sedimentation.
Turbidity was measured by portable turbidimeter (2100P, HACH, Loveland, CO, United States). Turbidity was measured at 15 min intervals unless otherwise denoted.
3 Results and discussions
3.1 Synthetic surface water (SSW)
3.1.1 Distance between electrodes
SSW experiments first explored the effects of distance between the electrodes on the mixing hydraulics and the consequential turbidity removal. The oscillatory CC and ELC systems may not provide identical oscillatory motion to the test solution, as oscillatory CC has one paddle and oscillatory ELC two. However, when the distance between the two paddles of the ELC is small enough, the two systems may be hydraulically similar. Furthermore, the larger the distance is between the paddles (serving also as electrodes in ELC) the higher the ohmic drop, that results in increased energy consumption. Therefore, the distance must be adjusted to retain oscillatory motion and manage energy consumption.
To verify that the similarity of the hydraulics of the two paddles- and one paddle-systems when the distance between the two paddles is small enough, coloring experiments were performed. Paddles moving in an oscillatory manner create a vortex that is crucial for mixing in the oscillatory flocculation process. Red dye was introduced to water to observe this vortex (Figure 4 top left). When the paddle moved to the left (as indicated by the blue arrow), a vortex formed on the right side of the paddle. The size of the vortex is important in oscillatory coagulation-flocculation as it can enhance sedimentation already during slow mixing (Bendory and Friedler, 2025).
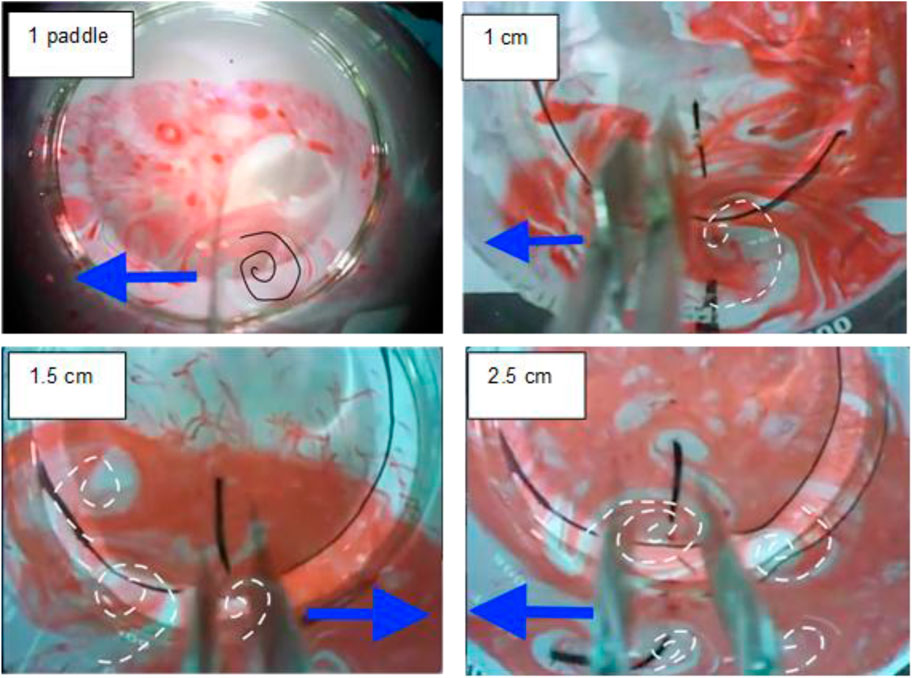
Figure 4. Dye experiments with different distance between electrodes (paddles) Blue arrows–Paddles movement direction; spiral lines - vortices.
At 1.0 cm distance between the electrodes (paddles), one distinct big vortex was observed. At 1.5 cm, hydrodynamics of the water has changed dramatically, as three smaller vortices were observed: one to the left side of the electrodes, another on the top left side, and a third in between the two electrodes. The vortex to the left was expected to be seen when the paddles displaced the water. However, the vertex of the right electrode created the vortex in the top left. This distance between the electrodes was large enough that the left electrode did not hinder the vortex formation from the right electrode. Additionally, another vortex in the center of the electrodes that were not present at 1.0 cm distance can be observed. At a 2.0 cm distance, the vortices were similar to that of 1.5 cm. However, at 2.5 cm distance, smaller 4 vortices emerging from the four vertexes of the electrodes are observed. At this distance, the electrodes form more vortices because they interfere less with each other. Therefore, it can be postulated that at 1.0 cm distance between the electrodes, the oscillatory ELC and CC systems are similar hydraulically.
Further experiments were performed with the ELC system to study the effect of distance between electrodes on the sediment pattern, turbidity removal efficiency, and voltage required. Distances of 0.7, 1.0, and 1.5 cm, were examined at a current of 0.18 A for 120 s (equivalent to 1.5 mgAL/L). At all distances turbidity was efficiently removed with 97% removal and “moon shaped” sedimentation as observed in oscillatory CC (Bendory and Friedler, 2025). Therefore, it may be deduced that at distances of 0.7–1.5 cm between paddles, the hydraulics and performance of oscillatory ELC is very similar to that of oscillatory CC. However, as expected, the voltage required increased as the distances increased: 4.0, 4.6, and 5.9 V for 0.7, 1.0, and 1.5 cm respectively. Hence, in order to reduce the voltage required, minimal distance between the electrodes is preferred. Sahu et al. (2014) recommended minimal electrode distance of 0.8 and 1.0 cm for high and low cell voltage ELC respectively. Therefore, further experiments were performed with 1.0 cm distance for SSW, and 0.85 cm for SGW and RGW.
3.1.2 Current density
Current density is a crucial parameter in the ELC process, as it determines the rate of coagulant dosing and gas production, time for electrolysis, and energy consumption.
Currents of 0.18, 0.25, and 1.0 A (29.3, 40.7, 163 A/m2 respectively) were investigated at pH 7. To achieve a dose of 0.81 mgAl/L, the electrolysis durations were 65, 47, and 13 s respectively. To keep rapid mixing duration constant, for short electrolysis duration (<65 s), the rapid mixing continued (without current) to reach 65 s at 1 Hz (default).
The particles subjected to 1.0 A did not settle as efficiently as ones subjected to lower currents (84% vs. 95% removal for 1.0 and 0.18 A at the end of sedimentation, respectively; Figure 5). This was due to higher gas density at the cathode, which encouraged flotation of particles (Holt et al., 2005; Ricordel et al., 2010). Although, according to Faraday’s law, the total amount of hydrogen gas produced was the same, the gas production rate was lower under lower currents, thus, particles efficiently removed with little or no flotation. At 0.18 A (current density of 29.3 A/m2), the oscillatory ELC removed 95% of the turbidity, very similar to oscillatory CC (Bendory and Friedler, 2025). Thus, 0.18 A was selected as the optimal current for SSW treatment.
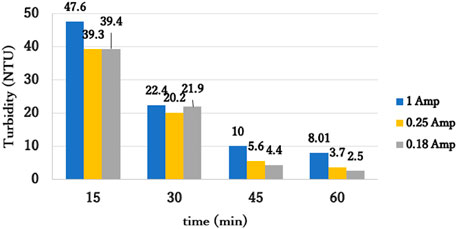
Figure 5. Turbidity vs. time from termination of rapid mixing for different current; Alum dose 0.81 mgAl/L; pH 7 Initial turbidity: 50 NTU; 30 min slow mixing, 30 min sedimentation.
3.2 Synthetic greywater (SGW)
Real greywater (RGW) quality, as aforementioned, vary significantly. Therefore, initially, the oscillatory ELC was tested first on synthetic greywater (SGW) to optimize its operational parameters. Turbidity, COD, DOC, TN, and TP removal was quantified for both oscillatory ELC and CC (jar test). Finally, microscopic images of the sediments and floating particles for oscillatory ELC and CC (jar test) were compared.
3.2.1 Current
CC (jar test) of SGW revealed the optimal dose at 10 mgAl/L at pH 7, reaching final turbidity of 2 NTU (97% removal). Although the initial turbidity was not so different from SSW, the particles present in the water were mostly organic, making turbidity removal more challenging. Currents of 0.13, 0.50, and 1.0 A (21.2, 81.4 and 163 A/m2, respectively) at pH 7 were investigated with electrolysis time of 1,107, 288, and 144 s respectively (to achieve 10 mgAl/L). At high currents (0.5 and 1 A), gas production rate was high enough to initiate significant flotation of particles, and an immediate reduction in turbidity can be seen (Figure 6). For 0.13 A, an initial increase in turbidity was observed right after the rapid mixing, probably due to lower H2 gas bubbles production rate (no flotation of aggregated particles). The final turbidity removal (after slow mixing and sedimentation) was highest at 0.5 A with 95%. Although the difference between removal ratios of 1.0 A and 0.5 A is not significant, nevertheless, for 1.0 A, higher voltage was required (15.3 vs. 9.1 V) and higher passivation rate is expected. Thus, 0.5 A was chosen as the optimal current for SGW treatment.
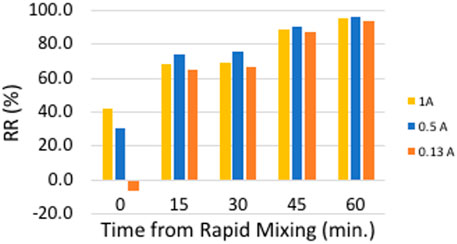
Figure 6. ELC - Turbidity removal ratio vs. time from rapid mixing for different currents Initial turbidity 55.5 NTU; Dose 10 mgAl/L; pH 7; 30 min slow mixing, 30 min sedimentation.
3.2.2 pH
Two pH values were studied: 8.33 (the original pH of the SGW solution) and 7. One advantage of ELC over CC (jar test) is that ELC does not consume alkalinity. When alum is introduced to a solution, hydroxide ions are consumed, reducing the pH. In ELC, hydrogen gas production at the cathode releases hydroxides to the solution. Aluminum ions produced at the anode, consume most of the hydroxides present in the solution to form Al(OH)3(s) and several other dissolved aluminum species. This keeps the pH of the solution relatively stable during ELC treatment. Indeed, the pH has hardly changed from 8.33 to 8.42 after the electrolysis in the ELC experiment.
The final turbidity removals for pH 8.3 and 7 were 98% and 96% respectively, showing that ELC was effective in this range. According to Amirtharajah and Mills (1982), at 10 mgAL/L dose with pH of 7–8, the system is very close to the region for optimal sweep flocculation. The aluminum precipitation is guaranteed without seeding when the aluminum concentration is above
3.2.3 Slow mixing time
Series of experiments were conducted to study the effects of slow mixing time on final turbidity removal. Rapid mixing was kept at 288 s at 0.5 A (current density 81 A/m2), and the sedimentation time at 30 min. The final turbidity removal for slow mixing time of 10, 20 and 30 min, were 97, 98% and 98% respectively, exhibiting marginal differences in turbidity removal. This may stem from the contribution of the gas produced to flotation of particles. Reduction in the slow mixing time needed, lowers the volume needed for the treatment tank.
3.2.4 Comparison between CC and oscillatory ELC
Oscillatory ELC and CC (jar test) removed COD, DOC, TN and TP similarly (Table 1). Both treatments removed turbidity efficiently as already verified in previous sections. DOC (dissolved organic carbon) was removed by ∼40% for both ELC and jar test. DOC can be removed by reacting or by binding with metal ions from coagulation (Crittenden et al., 2012). Although DOC removal at alkaline pH is said to be less efficient, due to the high coagulant dose (needed for removing the turbidity), 40% DOC removal was achieved. Both systems hardly removed any TN, as most of the TN was dissolved. In contrast, ELC and CC achieved 92% and 85% TP removal, respectively. The removal mechanisms for phosphates in coagulation are removal of phosphates containing solids, direct adsorption to aluminum precipitates, and phosphate precipitate formation (Aguilar et al., 2002). Among these, adsorption to aluminum precipitates is the most likely mechanism (Arnaldos and Pagilla, 2010), because the system was operated by sweep flocculation regime with abundance of aluminum precipitates. As expected, COD removal was 39% and 48% for oscillatory ELC and CC, respectively.
3.2.5 Microscopic image
Microscopic images of the sediments for SGW treated by oscillatory ELC and CC are presented in Figure 7. The CC (jar test) final turbidity was 1.4 NTU with initial turbidity of 33.5 NTU (96% removal). Oscillatory ELC’s final turbidity 1.7 NTU with initial turbidity of 53.3 NTU (97% removal). The raw SGW solution (Figure 7a) contained many tiny particles and some large particles (of about 100 μm). Sediments of the CC (Figure 7b) were enmeshed in the aluminum hydroxide structure. The image verifies that the primary mechanism for coagulation-flocculation was sweep coagulation. The sediments of the oscillatory ELC (Figure 7c) were also enmeshed in aluminum hydroxide; however, they were scarcer than in the CC. Oscillatory ELC’s sediments were less dense because there was significantly less sediments as opposed to the jar test. This was due to ELC separating particles into two parts: sediments and floating layer. Furthermore, ELC produces only aluminum ions, as opposed to the jar test introducing sulfates as well. Thus, overall sludge production in ELC is lower than that of CC. Figure 7d presents the particles that were floated by the oscillatory ELC. One can see a dense pack of particles, which tells us that flotation was an essential mechanism in particle removal for SGW.
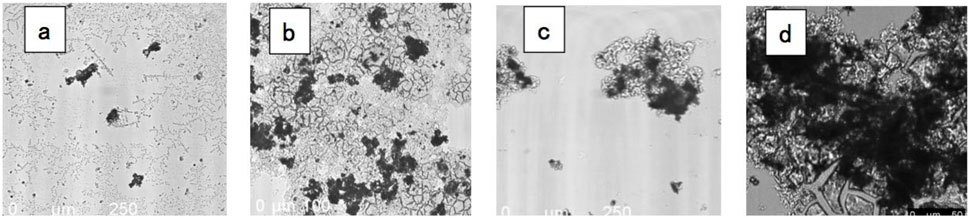
Figure 7. Confocal microscope (DMi8, LEICA) images of original particles in SGW (a); sediments of CC (jar test) (b); sediments of oscillatory ELC (c); floating particles of oscillatory ELC (d) X25 magnification for (a–c); X50 magnification for (d).
3.3 Real greywater (RGW)
To verify the findings of SGW, a preliminary experiment was conducted with RGW (real greywater), taken from a single-family home. The characteristics of the raw RGW were as follows: pH 7.5, turbidity 65 NTU, COD 120 mg/L, DOC 8 mg/L, TN 3.4 mg/L, and TP 1.4 mg/L. The RGW collected and tested was on the weaker side of RGW compared with the literature (Li et al., 2009; Gross et al., 2015), hence, its pollutants concentrations were generally lower than in the SGW.
The oscillatory ELC was performed at 0.5 A for 288 s (equivalent to 10 mgAl/L). Average residual turbidity 2.4 NTU (96% removal). COD, DOC, TN and TP were removed by 72, 35, 12% and 43% respectively. These removal ratios are comparable with the ones achieved with SGW. TP is an exception with only 43% removal in RGW vs. 92% removal in SGW, although its final concentration in the treated effluent were similar (0.8 and 1.0 mg/L, respectively). This difference in removal efficiency probably stems from the fact that the initial TP concentration in the SGW was an order of magnitude higher than in the RGW (1.2 vs. 1.4 mg/L). This preliminary experiment indicates the possible feasibility of using ELC for treatment of greywater.
4 Conclusion
This research studied the performance of oscillatory ELC as a means of surface water (stormwater) and greywater treatment. Experiments were performed with SSW, SGW and RGW.
At 0.18 A (current density of 29.3 A/m2) and 120 s of electrolysis (optimal dose of 1.5 mgAl/L), the oscillatory ELC removed 95% of the turbidity from SSW, very similar to oscillatory CC. At high current densities (e.g., 1 A, 163 A/m2) H2 gas production rate at the cathode was high and resulted in the floatation of some of the formed aggregates. In ELC at 1.0 cm distance between the electrodes (paddles), the oscillatory ELC and oscillatory CC systems were found to be hydraulically similar. This indicates that at this distance the two paddles behave like one paddle.
The optimal dose for ELC of SGW was 10 mgAl/L, much higher than the dose required for SSW (1.5 mgAl/L). This is probably due to the different nature of particles present in SGW and SSW. The overall turbidity removal from SGW (after slow mixing and sedimentation) was highest at 0.5 A (81 A/m2) with 98%. High turbidity removal was achieved already after 10 min of slow mixing, indicating that the volume of tanks needed for the treatment can be smaller. The ELC further removed 39, 41% and 92% of the COD, DOC, and TP present in the SGW.
One advantage of ELC over CC is that ELC does not consume alkalinity. When alum is introduced to a solution (during CC), hydroxide ions are consumed, reducing the pH. In ELC, hydrogen gas production at the cathode releases hydroxides to the solution. Aluminum ions produced at the anode, consume most of the hydroxides present in the solution to form several dissolved aluminum species. This keeps the pH of the solution relatively stable during ELC treatment. Indeed, the pH has hardly changed from 8.33 to 8.42 after the electrolysis in the ELC experiment. Hence, for SGW, oscillatory ELC was found to be preferable over the classical radial CC (represented the jar test) because it required shorter slow mixing time (10 min vs. 30 min), no pH adjustment, no chemical coagulant addition, less sludge production, and easier operation and maintenance.
Preliminary experiment with ELC of RGW corroborates the findings of SGW and thus, further work on RGW is recommended. Oscillatory ELC (and CC) still require further treatment such as filtration and disinfection, however, it succeeded in reducing the pollutant load significantly. Future research should include assessment of pathogens removal by oscillatory ELC, studying the effect of passivation under long-term operation, and study of aggregates flotation H2 gas formed in the cathode during the electrolysis step.
Data availability statement
The raw data supporting the conclusions of this article will be made available by the authors, without undue reservation.
Author contributions
MT: Data curation, Formal Analysis, Investigation, Methodology, Visualization, Writing – original draft. EF: Conceptualization, Funding acquisition, Methodology, Project administration, Resources, Validation, Writing – review and editing, Supervision.
Funding
The author(s) declare that financial support was received for the research and/or publication of this article. The research was partially funded by Israel Ministry of Science and Technology, grant number 3-12586.
Conflict of interest
The authors declare that the research was conducted in the absence of any commercial or financial relationships that could be construed as a potential conflict of interest.
Generative AI statement
The author(s) declare that no Generative AI was used in the creation of this manuscript.
Publisher’s note
All claims expressed in this article are solely those of the authors and do not necessarily represent those of their affiliated organizations, or those of the publisher, the editors and the reviewers. Any product that may be evaluated in this article, or claim that may be made by its manufacturer, is not guaranteed or endorsed by the publisher.
References
Aguilar, M. I., Sáez, J., Lloréns, M., Soler, A., and Ortuño, J. F. (2002). Nutrient removal and sludge production in the coagulation-flocculation process. Water Res. 36, 2910–2919. doi:10.1016/S0043-1354(01)00508-5
Amirtharajah, A., and Mills, K. M. (1982). Rapid-mix design for mechanisms of alum coagulation. J. AWWA 74, 210–216. doi:10.1002/j.1551-8833.1982.tb04890.x
APHA (2012). Standard methods for the examination of water and wastewater. Washington, D.C., USA: Standard Methods.
Arnaldos, M., and Pagilla, K. (2010). Effluent dissolved organic nitrogen and dissolved phosphorus removal by enhanced coagulation and microfiltration. Water Res. 44, 5306–5315. doi:10.1016/j.watres.2010.06.066
Bani-Melhem, K., and Smith, E. (2012). Grey water treatment by a continuous process of an electrocoagulation unit and a submerged membrane bioreactor system. Chem. Eng. J. 198-199, 201–210. doi:10.1016/j.cej.2012.05.065
Barişçi, S., and Turkay, O. (2016). Domestic greywater treatment by electrocoagulation using hybrid electrode combinations. J. Water Process Eng. 10, 56–66. doi:10.1016/j.jwpe.2016.01.015
Bendory, I. S., and Friedler, E. (2025). Novel oscillatory flocculation system for colloids removal from water. Water 17, 665. doi:10.3390/w17050665
Chen, G. (2004). Electrochemical technologies in wastewater treatment. Sep. Purif. Technol. 38, 11–41. doi:10.1016/j.seppur.2003.10.006
Crittenden, J. C., Trussell, R. R., Hand, D. W., Howe, K. J., and Tchobanoglous, G. (2012). MWH’s water treatment: principles and design. 3rd Edition. Hoboken, New Jersey, USA: MWH’s Water Treatment. doi:10.1002/9781118131473
Diaper, C., Toifl, M., and Storey, M. (2008). Greywater technology testing protocol. Commonwealth Scientific and Industrial Research Organisation.
Elazzouzi, M., Haboubi, K., and Elyoubi, M. S. (2017). Electrocoagulation flocculation as a low-cost process for pollutants removal from urban wastewater. Chem. Eng. Res. Des. 117, 614–626. doi:10.1016/j.cherd.2016.11.011
Govindan, K., McNamara, P. J., Lavin, J., Raja, M., Samuel, M., Kuru, W., et al. (2025). Response surface methodology for evaluating electrocoagulation treatment of bath and laundry greywater. J. Water Process Eng. 71, 107273. doi:10.1016/j.jwpe.2025.107273
Halfi, E., Brenner, A., and Katoshevski, D. (2019). Separation of colloidal minerals from water by oscillating flows and grouping. Sep. Purif. Technol. 210, 981–987. doi:10.1016/j.seppur.2018.08.054
Halfi, E., Brenner, A., and Katoshevski, D. (2020). Effect of container geometry on colloids removal from water in oscillation-based flocculation. Water Supply 20, 328–334. doi:10.2166/ws.2019.165
Holt, P. K., Barton, G. W., and Mitchell, C. A. (2005). The future for electrocoagulation as a localised water treatment technology. Chemosphere 59, 355–367. doi:10.1016/j.chemosphere.2004.10.023
Katoshevski, D. (2006). A mathematical study of a fire in the interaction zone between flows with different velocities. Aerosol Air Qual. Res. 6, 193–212. doi:10.4209/aaqr.2006.06.0007
Katoshevski, D., Ruzal, M., Shakked, T., and Sher, E. (2010). Particle grouping, a new method for reducing emission of submicron particles from diesel engines. Fuel 89, 2411–2416. doi:10.1016/j.fuel.2010.04.001
Li, F., Wichmann, K., and Otterpohl, R. (2009). Review of the technological approaches for grey water treatment and reuses. Sci. Total Environ. 407, 3439–3449. doi:10.1016/j.scitotenv.2009.02.004
Lin, C. J., Lo, S. L., Kuo, C. Y., and Wu, C. H. (2005). Pilot-scale electrocoagulation with bipolar aluminum electrodes for on-site domestic greywater reuse. ASCE J. Env. Eng 131, 491–495. doi:10.1061/(ASCE)0733-9372(2005)131:3(491)
Merzouk, B., Gourich, B., Sekki, A., Madani, K., and Chibane, M. (2009). Removal turbidity and separation of heavy metals using electrocoagulation–electroflotation technique. J. Hazard. Mater. 164, 215–222. doi:10.1016/j.jhazmat.2008.07.144
Mollah, M. Y. A., Morkovsky, P., Gomes, J. A. G., Kesmez, M., Parga, J., and Cocke, D. L. (2004). Fundamentals, present and future perspectives of electrocoagulation. J. Hazard. Mater. 114, 199–210. doi:10.1016/j.jhazmat.2004.08.009
Ricordel, C., Darchen, A., and Hadjiev, D. (2010). Electrocoagulation-electroflotation as a surface water treatment for industrial uses. Sep. Purif. Tech. 74, 342–347. doi:10.1016/j.seppur.2010.06.024
Sahu, O., Mazumdar, B., and Chaudhari, P. K. (2014). Treatment of wastewater by electrocoagulation: a review. Env. Sci. Poll. Res. 21, 2397–2413. doi:10.1007/s11356-013-2208-6
Song, H., Alfiya, Y., Dubowski, Y., and Friedler, E. (2017). Sorption and biodegradation of propylparaben in greywater by aerobic attached-growth biomass. Sci. Tot. Env. 598, 925–930. doi:10.1016/j.scitotenv.2017.04.032
Vakil, K. A., Sharma, M. K., Bhatia, A., Kazmi, A. A., and Sarkar, S. (2014). Characterization of greywater in an Indian middle-class household and investigation of physicochemical treatment using electrocoagulation. Sep. Purif. Technol. 130, 160–166. doi:10.1016/j.seppur.2014.04.018
Winter, C., Katoshevski, D., Bartholomä, A., and Flemming, B. W. (2007). Grouping dynamics of suspended matter in tidal channels. J. Geophys. Res. Oceans 112. doi:10.1029/2005JC003423
Keywords: electrocoagulation, greywater, stormwater, oscillatory mixing, onsite treatment
Citation: Tomita M and Friedler E (2025) Oscillatory electrocoagulation for treatment of surface water and greywater. Front. Environ. Sci. 13:1632164. doi: 10.3389/fenvs.2025.1632164
Received: 20 May 2025; Accepted: 08 July 2025;
Published: 15 July 2025.
Edited by:
Antonio Albuquerque, University of Beira Interior, PortugalReviewed by:
Gbekeloluwa B. Oguntimein, Morgan State University, United StatesBhavya D. K., AMC Institutions, India
Copyright © 2025 Tomita and Friedler. This is an open-access article distributed under the terms of the Creative Commons Attribution License (CC BY). The use, distribution or reproduction in other forums is permitted, provided the original author(s) and the copyright owner(s) are credited and that the original publication in this journal is cited, in accordance with accepted academic practice. No use, distribution or reproduction is permitted which does not comply with these terms.
*Correspondence: Eran Friedler, ZXJhbmZAdGVjaG5pb24uYWMuaWw=