 Guoping He
 Qinglian Nong
- School of International Business, Hainan University, Haikou, China
A comprehensive examination of the impact of rural three-industry integration on agricultural non-point source pollution is essential for promoting sustainable agricultural development. This study employs panel data from 30 provinces in China (excluding Hong Kong, Macao, Taiwan, and Tibet) for the period 2011–2022. It adopts a two-way fixed effects model, a moderating effects model, and a spatial Durbin model to investigate the impact of rural three-industry integration on agricultural non-point source pollution, as well as its spatial spillover effects and the moderating role of environmental regulation. The results indicate that: (1) The effect of rural three-industry integration on agricultural non-point source pollution follows an inverted U-shaped pattern, with a turning point at an integration level of 0.29. As of 2022, most regions remain on the left side of the curve, suggesting a tendency for rural three-industry integration to exacerbate agricultural non-point source pollution. (2) All three types of environmental regulations weaken the effect of rural three-industry integration on agricultural non-point source pollution, but their moderating effects differ. Market-based and public-voluntary regulations shift the turning point of the curve to the left, bringing forward the stage at which integration begins to reduce pollution, whereas command-and-control regulations shift the turning point to the right, extending the stage in which integration intensifies pollution. (3) Rural three-industry integration has a significant spatial spillover effect on agricultural non-point source pollution. This study demonstrates the nonlinear characteristics and spatial effects of rural three-industry integration on agricultural non-point source pollution. It further clarifies the distinct roles of different types of environmental regulation in this relationship. The findings provide valuable guidance for policy formulation, promote the development of rural three-industry integration, and enhance its potential to reduce agricultural non-point source pollution.
1 Introduction
Agriculture, as the foundation of the national economy, plays a crucial role in ensuring food security, supporting rural economic development, and maintaining social stability. However, the expansion of conventional agricultural practices has exacerbated agricultural non-point source pollution, posing significant threats to environmental quality, water security, and the sustainable development of agriculture (Nuruzzaman et al., 2025). Agricultural non-point source pollution is characterized by its randomness, dispersion, spatial variability, temporal lag, and uncertainty, making it a major threat to the safety of water resources (Zou et al., 2020). According to the Second National Pollution Source Census Bulletin released in 2020, China’s agricultural emissions of chemical oxygen demand, total nitrogen, and total phosphorus reached 21.4398 million tons, 3.0414 million tons, and 0.3154 million tons, respectively, accounting for 49.8%, 46.5%, and 67.2% of total water pollutant emissions. Agriculturally advanced nations, including the United States and major European countries, pioneered early-stage governance of agricultural non-point source pollution, thereby providing actionable models for China. Nevertheless, the inherent systemic complexity of this pollution continues to pose substantial governance challenges (Lu et al., 2023). Effectively mitigating agricultural non-point source pollution while balancing rural ecological protection and economic development remains a critical concern for both policymakers and researchers.
Since the 2015 No. 1 Central Document first advocated the integration of rural primary, secondary, and tertiary industries, it has remained a central focus of the government’s rural policy. The 2024 No. 1 Central Document reaffirms the commitment to promoting integrated rural industry development, strengthening ecological civilization, and advancing efforts to combat agricultural and rural pollution. China is currently undergoing a critical transition from traditional to modern agriculture. A key question is whether rural three-industry integration can mitigate rural environmental pollution while fostering economic growth. Although existing studies have explored this issue, the specific impact of three-industry integration on non-point source pollution remains debated. Moreover, limited research has examined potential spatial effects in this relationship or the role of environmental regulation (see Section 2 for details). This study investigates three central questions: (1) How does rural three-industry integration affect agricultural non-point source pollution? (2) What roles do various types of environmental regulation play in this process? and (3) Does this effect generate spatial spillover impacts? The findings aim to offer insights that facilitate the effective application of rural three-industry integration in mitigating agricultural non-point source pollution.
This paper makes three main contributions. First, it integrates environmental regulation into the analytical framework assessing the impact of rural three-industry integration on agricultural non-point source pollution, uncovering the nonlinear characteristics and underlying mechanisms of this relationship, and examining the differential moderating effects of various types of environmental regulation. Second, from a spatial correlation perspective, it constructs a spatial weight matrix to analyze the spatial spillover effects of rural three-industry integration on agricultural non-point source pollution. Third, it offers policy recommendations aimed at harmonizing the development of rural three-industry integration with efforts to prevent and control agricultural non-point source pollution.
The paper is organized as follows. Section 2 reviews the relevant literature and introduces the research topic. Section 3 presents a theoretical analysis of the impact of rural three-industry integration on agricultural non-point source pollution, its spatial spillover effects, and the role of environmental regulation, leading to the formulation of research hypotheses. Section 4 outlines the data sources and variable definitions. Section 5 empirically tests the hypotheses and discusses the findings of the paper. Finally, Section 6 concludes the paper and offers policy recommendations.
2 Literature review
2.1 Meaning and measurement of rural three-industry integration
The concept of rural three-industry integration originates from Naraomi Imamura’s “Sixth Industry” theory in Japan. In 2015, the No. 1 Central Document officially introduced the concept of integrating rural primary, secondary, and tertiary industries. It emphasized the need to extend the agricultural industrial chain, increase agricultural value-added, and leverage the development of specialized industries, rural tourism, infrastructure improvement, and policy support to achieve rural economic diversification and high efficiency, ultimately improving farmers’ income. Rural three-industry integration is rooted in agriculture and, through its intersection with secondary and tertiary industries, drives the optimization and reorganization of capital, technology, and resources. Ultimately, it seeks to achieve agricultural modernization, increase farmers’ income, and promote integrated urban-rural development (Li et al., 2017).
The existing literature has developed various indicator systems and measurement methods to assess the level of rural three-industry integration from multiple perspectives. The indicator system encompasses several key dimensions. These include the extension of the agricultural industry chain (e.g., agricultural product processing and primary processing machinery), the expansion of agricultural functions (e.g., leisure agriculture and non-agricultural employment), the integration of agricultural production with agricultural services (e.g., forestry, animal husbandry, fishery services and rural financial development), technological penetration (e.g., agricultural mechanization and labor productivity), benefit linkages (e.g., farmers’ cooperatives and agricultural insurance density), and the comprehensive effects of integration (e.g., economic, social, and ecological benefits). Common measurement methods include the entropy method, analytic hierarchy process, factor analysis, and cluster analysis (Ge et al., 2022; Hu et al., 2023; Li Z. et al., 2023; Wang R. et al., 2023). For instance, Xie et al. (2025) constructed a composite index to evaluate rural three-industry integration using the entropy weight method, based on four indicators: the share of income from agricultural product processing, the share of operational area under facility agriculture, the share of income from leisure agriculture, and the share of output value from agricultural services. Gao et al. (2024) measured rural three-industry integration across five dimensions—extension of the agricultural industry chain, expansion of multifunctionality, cultivation of new business formats, integration with the service industry, and improvement of benefit-sharing mechanisms—using the entropy method, and examined its impact on the resilience of the agricultural economy. Li Z. et al. (2023) assessed rural three-industry integration by considering five factors—social, economic, resource, facility, and environmental—through methods such as factor analysis and cluster analysis. Moreover, some studies have broadened the research perspective to include the assessment of the coordination and efficiency of rural three-industry integration. For instance, Chen and Cheng (2018) using a system coupling model, calculated the coupling coordination degree of the integration of the three industries in China from 2007 to 2016. Li et al. (2018) adopting an input-output perspective, employed Data Envelopment Analysis (DEA) and the Malmquist Index to measure the efficiency of rural three-industry integration, evaluating its economic, social, and ecological benefits, which have collectively enriched the theoretical and empirical research on rural three-industry integration.
2.2 Measurement and influencing factors of agricultural non-point source pollution
Agricultural non-point source pollution refers to contamination resulting from the improper use of chemical inputs such as fertilizers, pesticides, and plastic films, as well as the improper or untimely disposal of livestock and poultry waste, aquaculture waste, and crop straw during agricultural production. These pollutants, including nitrogen, phosphorus, and organic matter, accumulate excessively in the soil or enter water bodies through surface runoff, groundwater flow, and soil erosion, thereby causing ecological and environmental harm (The Environmental Protection Law of the People’s Republic of China). Agricultural non-point source pollution can be divided into broad and narrow categories according to its sources (Guo, 2025). The broad category encompasses pollution from agricultural and rural activities, including contamination of farmland ecosystems caused by chemical fertilizers, pesticides, livestock and poultry manure, agricultural waste, and rural domestic waste generated during agricultural production. The narrow category pertains specifically to pollution arising from primary chemical inputs—such as fertilizers and pesticides—used in crop production. Most scholars, adopting the broader concept of agricultural non-point source pollution, use inventory analysis to calculate the emissions of three key pollutants—total nitrogen (TN), total phosphorus (TP), and chemical oxygen demand (COD)—from various sources. For example, Tao et al. (2020) calculated COD, TN, and TP emissions in the Baiyangdian Basin in China from six pollution sources: fertilizer use, solid waste from farmland, livestock and poultry farming, rural household waste, wastewater discharge, and manure treatment. Some scholars, focusing on the narrower concept of agricultural non-point source pollution, examine the impact of chemical fertilizers, pesticides, agricultural films, and diesel on the agricultural environment. For example, Zhang S. et al. (2024) argues that the loss of these inputs contributes to agricultural non-point source pollution and calculates the pollution generated by fertilizers, pesticides, and agricultural films using utilization and recovery rates. Jiang et al. (2021) using an equal-weight assignment method, measured agricultural non-point source pollution based on average usage of fertilizers, pesticides, agricultural films, and diesel.
A substantial body of literature has examined the key factors influencing agricultural non-point source pollution from a multidimensional perspective, categorizing them into three levels: production entities, industrial organization, and external institutions. (1) Production entity level: Farmers’ perceptions and behaviors form the foundation of source control. Studies indicate that farmers’ awareness of external factors—such as government regulation, market conditions, and social organizations—enhances their intrinsic cognition (attitudinal tendencies, subjective norms, and perceived behavioral control), thereby increasing their willingness to participate in managing agricultural non-point source pollution (Ma et al., 2023). Innovative fertilization strategies effectively reduce pollution while maintaining crop growth and yield (Huang et al., 2025). Large-scale farming substantially mitigates pollution and generates positive spatial spillover effects; simultaneously, agricultural production services reduce the adverse impacts of land fragmentation on pollution (Chen et al., 2023; Min et al., 2023). (2) Industrial organization level: The relationship between agricultural industrial agglomeration and non-point source pollution typically follows an inverted U-shape; however, accounting for spatial spillover effects reveals a U-shaped relationship (Wang H. et al., 2023). Conversely, Xu and Xue (2019) report an N-shaped pattern. (3) External institutional level: During pilot phases, agricultural insurance intensified fertilizer-induced pollution, but this effect dissipated after full coverage was implemented (Niu et al., 2022). Due to the negative externalities of environmental pollution, market mechanisms alone inadequately control agricultural pollution, making environmental regulation essential (Winsten, 2009). Research shows that environmental regulation reduces regional agricultural non-point source pollution, with digitalization amplifying this effect, although it may also cause pollution to shift locally (Xu et al., 2023; Zhang et al., 2023; 2025; Wen et al., 2025). Shi and Yi (2020) identified an inverted U-shaped relationship between environmental regulation and pollution, with most regions currently positioned on the left side of the turning point. Different types of environmental regulation variably affect ecological efficiency (Ren et al., 2018). Mandatory regulations initially curb emissions significantly, but excessive government intervention at higher intensities can undermine their effectiveness (Zhu et al., 2024; Zhao Y. et al., 2025). Market-based regulations, such as carbon trading, promote pollution reduction and energy consumption transformation, though their effects emerge gradually after implementation (Rong et al., 2025). Voluntary actions driven by intrinsic cognition and perceived behavioral control encourage farmers to adopt environmentally friendly practices, positively impacting the environment (Cammarata et al., 2024).
2.3 Effects of rural three-industry integration on green agricultural production and agricultural non-point source pollution
Existing literature primarily examines the impact of rural three-industry integration on the agricultural environment across three key dimensions: agricultural carbon emissions, rural ecological conditions, and green agricultural production. Regarding agricultural carbon emissions, studies show that rural industry integration reduces emissions by facilitating rural labor outflow, land scale operations, and technological advancements in agriculture (Li and Shi, 2024), with labor structure acting as a significant positive moderator (Zhang and Liu, 2024). Lu et al. (2025) identified an inverted U-shaped relationship between rural industry integration and agricultural carbon emissions, where environmental regulations shift the turning point leftward, while rural population aging shifts it rightward. Rural industry integration enhances green total factor productivity in agriculture through scale, capital, and technology effects; multidimensional human capital (migration, education, health) and land transfer further amplify this effect (Wang Y et al., 2023). In terms of the rural ecological environment, the integration of agriculture and tourism improves ecological conditions, particularly in regions with high human capital, central and western China, and non-major grain-producing areas (Wang et al., 2022; Liu et al., 2023). Overall, rural industry integration and its various forms—including internal restructuring, industrial chain extension, functional expansion, service sector crossover, and high-tech penetration—contribute to protecting and enhancing the rural ecological environment. Human capital positively moderates this relationship, whereas urbanization exerts a negative moderating effect (Cheng et al., 2024). Concerning green agricultural production, agriculture-tourism integration fosters sustainable development by optimizing resource allocation and raising farmers’ environmental awareness (Chen et al., 2025). Farmers adopting ecological agricultural practices within village industry integration reduce their use of chemical inputs such as pesticides and fertilizers (Zhao W. et al., 2025). Moreover, the integration of rural three industries in counties along the Yangtze River Economic Belt significantly promotes green agricultural development, exhibiting dual threshold effects associated with industrial upgrading and technological innovation (Tian et al., 2024).
Despite its growing importance, literature systematically examining the impact of rural three-industry integration on agricultural non-point source pollution remains limited. Luo and Wei (2022) empirically demonstrate that rural industry integration affects agricultural production behavior by promoting scale operations, enhancing rural human capital, and advancing technological progress, thereby reducing the use of inputs such as fertilizers and pesticides and mitigating agricultural non-point source pollution. Conversely, Lai et al. (2023) identify an inverted U-shaped relationship between rural three-industry integration and agricultural non-point source pollution, with land and population urbanization accelerating the onset of emission reduction effects driven by rural industry integration. These studies offer preliminary insights into the relationship but diverge significantly regarding the effect’s direction—linear versus nonlinear. Notably, natural resource development associated with rural three-industry integration may also cause environmental pollution and ecological degradation, posing potential threats to rural environments (He et al., 2025). Although the academic community broadly acknowledges the positive role of rural three-industry integration in enhancing agricultural production efficiency, agriculture’s long production cycles, low profit margins, and rural structural challenges—such as part-time farming and population aging—combined with environmental effects that encompass both emission reduction mechanisms (e.g., reduced input use) and emission risks (e.g., resource exploitation), render the net effect of rural three-industry integration on agricultural non-point source pollution inconclusive (Cao and Yang, 2025).
In summary, rural three-industry integration and environmental regulations significantly influence agricultural non-point source pollution. However, several gaps remain in the existing literature. First, the precise mechanisms by which rural three-industry integration affects agricultural non-point source pollution are still debated. Second, the moderating effects of different types of environmental regulation have received limited attention. Third, whether spatial spillover effects exist in this context remains to be empirically examined. This paper utilizes panel data from 30 provincial-level regions of China (excluding Hong Kong, Macao, Taiwan, and Tibet) for the period 2011 to 2022 to examine the impact of rural three-industry integration on agricultural non-point source pollution, its spatial spillover effects, and the role of environmental regulations. The findings aim to provide insights into leveraging rural integration to mitigate agricultural pollution.
3 Theoretical analysis and hypothesis
3.1 Non-linear impact of rural three-industry integration on agricultural non-point source pollution
The development of rural three-industry integration may lead to two opposing effects on agricultural non-point source pollution. One is exacerbating agricultural non-point source pollution. The integration of agricultural services with production strengthens the bargaining power and transaction position of agricultural producers, potentially reducing the unit price of agricultural inputs. Consequently, producers may increase their use of fertilizers, pesticides, and other pollutants, thereby intensifying non-point source pollution. Moreover, the integration of agricultural services, such as tillage, irrigation, and other support functions, reduces the cost of purchasing equipment, enabling producers to allocate more funds to buying fertilizers, pesticides, and other inputs, which in turn increases the intensity of their application and exacerbates non-point source pollution (Li Q. et al., 2023). Additionally, deeper integration of agricultural product processing and marketing with agricultural production, coupled with enhanced economic linkages, can raise agricultural producers’ income, allowing for greater investment in fertilizers and pesticides, which further intensifies non-point source pollution (Wang et al., 2024).
The other is mitigating agricultural non-point source pollution. First, integrating agricultural services with production strengthens producers’ bargaining power in transactions, lowering the cost of green inputs and technologies as well as transaction costs. Simultaneously, training and other services reduce producers’ learning costs for green technologies, promoting the adoption of environmentally friendly practices and reducing non-point source pollution (Yang et al., 2022). Second, the development of production-oriented services, such as tillage, irrigation, fertilization, and integrated pest and disease management, generates economies of scale, decreases the unit cost of green technologies, and encourages producers to adopt sustainable practices. Third, integrating agricultural product processing and marketing with production, along with enhanced benefit linkages, not only raises producers’ income and their ability to purchase green inputs and technologies but also strengthens downstream firms’ oversight, motivating producers to adopt green practices (Li et al., 2020). Finally, integrating agricultural product processing and marketing supports the implementation of the “Three Certifications and One Geographical Indication”, which encompasses quality certification, safety certification, environmental standards, and geographical indications. This integration improves both the quality and market competitiveness of agricultural products and encourages producers to adopt sustainable production practices, thereby further reducing non-point source pollution.
Numerous studies demonstrate that rural three-industry integration promotes rural economic growth and increases farmers’ income. Moreover, the Environmental Kuznets Curve highlights a nonlinear relationship between economic development and environmental pressure. Consequently, the effect of rural three-industry integration on agricultural non-point source pollution may exhibit a nonlinear pattern. When rural three-industry integration is at a low level, the limited availability of green inputs and technologies, coupled with incomplete policies and regulations, may result in the pollution-reducing effects being weaker than the pollution-intensifying effects, thereby leading to an increase in non-point source pollution. However, as rural three-industry integration expands and deepens, the continuous development of green inputs and technologies, along with improvements in policies and regulations, may gradually tip the balance, allowing the pollution-reducing effects to surpass the pollution-intensifying effects, ultimately reducing non-point source pollution. Therefore, the impact of rural three-industry integration on agricultural non-point source pollution may be closely related to the level of integration and could follow an inverted U-shape. Based on this, the following hypothesis is proposed:
H1. The impact of rural three-industry integration on agricultural non-point source pollution is non-linear and follows an inverted U-shape.
3.2 The moderating effect of environmental regulation on the relationship between rural three-industry integration and agricultural non-point source pollution
Environmental regulation, as a policy instrument, aims to restrict and guide economic activities through laws, regulations, and market mechanisms to mitigate negative environmental impacts. For example, governments may implement environmental investment tax incentives to reduce enterprises’ investment costs, effectively curbing the development of inferior technologies and promoting the adoption of energy-saving practices (Tchorzewska, 2024). In the agricultural sector, environmental regulation internalizes pollution costs through mechanisms such as Pigouvian taxes, emission standards, and adjustments to agricultural input prices, thereby holding producers accountable for pollution-related costs (Buttel, 2003). This, in turn, encourages the adoption of environmentally friendly technologies in rural industries and facilitates the green transformation of the industrial structure, potentially alleviating the pollution-intensifying effects of rural three-industry integration (Guo et al., 2022). However, the innovation compensation effect of environmental regulation is often delayed. It may increase the costs of green production and environmental governance, crowding out investment in agricultural green innovation and diminishing the emission-reduction impact of rural three-industry integration. Based on these considerations, the following hypothesis is proposed:
H2. Environmental regulation may play a significant moderating role in the relationship between rural three-industry integration and agricultural non-point source pollution.
Environmental regulations can be broadly categorized into three types: command-and-control, market-based, and public-voluntary regulations (You et al., 2024). Although all environmental regulations aim to reduce pollution, they differ fundamentally in their operational mechanisms. Command-and-control regulations enforce compliance through legally binding standards and penalties for non-compliance. In contrast, market-based regulations utilize economic incentives to motivate behavioral changes among firms and individuals. Public-voluntary regulations, meanwhile, rely on individuals’ sense of social responsibility to encourage environmentally protective actions (Karp and Gaulding, 1995). Given the varying mechanisms and impacts of these regulatory types, their moderating effects on the relationship between rural three-industry integration and agricultural non-point source pollution are likely to differ. Thus, the following hypothesis is proposed:
H3. The moderating effect of different types of environmental regulation on the impact of rural three-industry integration on agricultural non-point source pollution may vary.
3.3 The spatial spillover effects of rural three-industry integration on agricultural non-point source pollution
Grounded in the spatial externality theory of new economic geography, rural three-industry integration not only significantly influences agricultural non-point source pollution in the local area but may also play a crucial role in affecting pollution in neighboring areas. As an innovative agricultural development model, rural three-industry integration breaks the closed nature of traditional agriculture. Given the similar land resources and climatic conditions in neighboring areas, as well as the homogeneity of agricultural production, the emission, diffusion, and control of agricultural non-point source pollution are all influenced by the surrounding environment (Gao et al., 2021). Rural three-industry integration can generate both a demonstration effect and a crowding-out effect on local and neighboring agricultural production. On one hand, it promotes the transformation and upgrading of agricultural production methods, optimizes agricultural resource allocation, increases labor productivity, and ultimately raises farmers’ incomes (Peng et al., 2024). These benefits create a “demonstration effect”, wherein neighboring areas are incentivized to optimize and reorganize their agricultural resources through imitation and learning, thus impacting their agricultural non-point source pollution. Specifically, the flow of knowledge, technology, talent, and capital during the process of rural three-industry integration overcomes geographic and spatial barriers (Li and Shi, 2024). Talent flow introduces advanced environmental protection concepts and management practices; technology spillovers facilitate the adoption of green technologies to reduce pollution; and capital spillovers provide funding for the construction of agricultural environmental protection facilities, effectively controlling non-point source pollution. On the other hand, rural three-industry integration may also exert a “crowding-out effect” on agricultural non-point source pollution in neighboring areas. As agricultural industries in the local area grow rapidly, they may attract more agricultural factors, concentrating them in the region and increasing production pressure in neighboring areas. To maintain or improve agricultural production, neighboring areas may adopt more extensive production methods, potentially exacerbating non-point source pollution. Based on this, the following hypothesis is proposed:
H4. The impact of rural three-industry integration on agricultural non-point source pollution may have a spatial spillover effect.
Accordingly, a theoretical framework is developed to illustrate how rural three-industry integration and environmental regulation influence agricultural non-point source pollution (see Figure 1).

Figure 1. Theoretical mechanism of rural three-industry integration and environmental regulation on agricultural non-point source pollution.
4 Models and data
This study employs provincial panel data from 2011 to 2022 to test the aforementioned hypotheses. It sequentially applies a two-way fixed effects model to investigate the nonlinear impact of rural three-industry integration on agricultural non-point source pollution, employs a moderation model to evaluate the moderating effects of heterogeneous environmental regulations, and utilizes a spatial Durbin model to analyze the spatial spillover effects of rural three-industry integration on agricultural non-point source pollution.
4.1 Model setting
4.1.1 Fixed effects model
The fixed effects model effectively mitigates endogeneity caused by omitted variables, thereby improving the consistency and asymptotic unbiasedness of estimators (Gunasekara et al., 2014). Given that panel data exhibit both individual and temporal heterogeneity, this study employs a two-way fixed effects model to control for these effects and enhance estimation accuracy. Following the specification of Liu et al. (2024), the model is constructed to analyze the impact of rural three-industry integration on agricultural non-point source pollution, as shown in Equation 1.
In Equation 1,
To test Hypothesis 1—that the relationship between rural three-industry integration and agricultural non-point source pollution follows an inverted U-shape—the squared term of rural three-industry integration (
In Equation 2, if β2 is significantly different from zero, rural three-industry integration exhibits a nonlinear effect on agricultural non-point source pollution, with the turning point given by
4.1.2 Moderating effect model
This study investigates the moderating role of environmental regulation in the relationship between rural three-industry integration and agricultural non-point source pollution by adopting the approach of Haans et al. (2016). Specifically, it incorporates interaction terms between environmental regulation and both the linear and quadratic components of rural three-industry integration into Equation 2, resulting in Equation 3.
In Equation 3,
According to Haans et al. (2016), a moderating variable influences an inverted U-shaped curve through two mechanisms. First, it alters the slope of the curve, making it either steeper or flatter. When β4 > 0, the slope of a U-shaped curve steepens, indicating an accelerated rate of change in the relationship between the explanatory and dependent variables; conversely, for an inverted U-shaped curve, the slope flattens, indicating a decelerated rate of change. When β4 < 0, the U-shaped curve flattens, while the inverted U-shaped curve steepens (see Table 1). Second, the moderating variable shifts the curve’s inflection point: when β1β4−β2β3 > 0, the inflection point shifts rightward; when β1β4−β2β3 < 0, it shifts leftward.
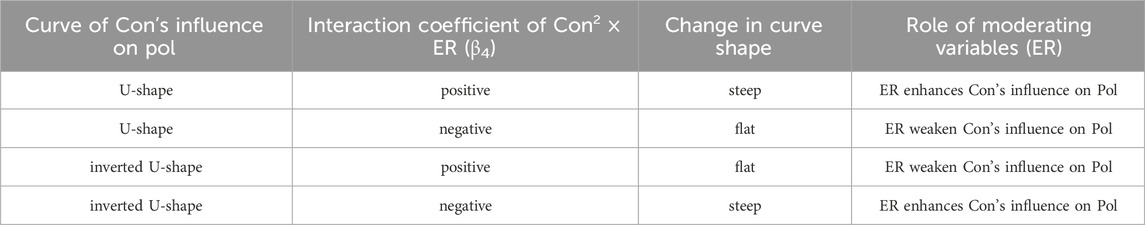
Table 1. Role of moderating variables.
4.1.3 Spatial econometric model
Given the prevalent spatial correlation between rural three-industry integration and agricultural non-point source pollution, ignoring spatial factors may bias econometric estimates. Based on the preceding theoretical analysis, rural three-industry integration in one region can affect agricultural non-point source pollution in neighboring regions via demonstration and crowding-out effects. To test Hypothesis 4—concerning the spatial effect of rural three-industry integration on agricultural non-point source pollution—it is first necessary to assess spatial autocorrelation between these variables. Upon confirming spatial dependence, spatial panel models will be employed for empirical analysis.
This study begins by assessing the spatial correlation of the variables using the global Moran’s I index (Equation 4).
In Equation 4, I denotes the global Moran’s I index, and Wij represents the spatial weight matrix (this study uses the spatial adjacency matrix). Yi and Yj are the values of variable Y in spatial units i and j, respectively, while
Common spatial panel econometric models include the spatial lag model (SLM), spatial error model (SEM), and spatial Durbin model (SDM). The SDM incorporates spatial lag terms for both dependent and independent variables, thereby avoiding misspecification caused by omitted spatial dependencies. As a generalization of both the SLM and SEM, the SDM offers greater flexibility. Given its broader specification and robustness against misspecification, this study employs the SDM to empirically test Hypothesis 4, as specified in Equation 5.
In Equation 5, ρ denotes the spatial autoregressive coefficient, δ represents the coefficients of the spatially lagged variables, and the definitions of the remaining variables remain consistent with those previously provided.
4.2 Variable selection
4.2.1 Dependent variable
Agricultural non-point source pollution intensity (Pol) is defined as the amount of pollution emitted per unit area of agricultural land (tons per hectare). This pollution mainly arises from direct or indirect emissions caused by fertilizer runoff, pesticide runoff, and residual agricultural plastic film. This study employs the methodologies of Kong et al. (2024) and Zhang S. et al. (2024) to calculate Pol, as detailed in Equation 6.
In Equation 6,

Table 2. Sources and calculation methods of agricultural non-point source pollution.
4.2.2 Independent variable
Rural Three-Industry Integration Degree (Con). Drawing on the research of Ge et al. (2022) and ensuring scientific rigor, comprehensiveness, representativeness, and data availability, this study constructs a rural three-industry integration evaluation system based on four dimensions: the extension of the agricultural industrial chain, the expansion of agricultural multifunctionality, the development of agricultural services, and benefit linkage (as shown in Table 3).

Table 3. Evaluation indicators of rural three-industry integration.
Extension of the Agricultural Industrial Chain: The integration of agricultural product production, processing, and distribution is indirectly measured by two indicators: (1) the proportion of agricultural product processing machinery power in total agricultural machinery power and (2) the share of main business income from agricultural product processing in the added value of the primary industry.
Expansion of Agricultural Multifunctionality: This dimension reflects the integration of food production with ecological protection, cultural heritage, tourism, leisure, education, and training. It is indirectly measured by three indicators: (1) the share of the rural labor force engaged in non-agricultural employment, (2) the development of facility agriculture (e.g., greenhouses), and (3) the expansion of leisure agriculture.
Development of Agricultural Services: This is assessed using two indicators: (1) the proportion of the primary industry service in the total output value of the primary industry, and (2) the number of rural financial institution outlets per 10,000 rural residents.
Benefit Linkage: Farmer cooperatives play a crucial role in connecting farmers with upstream and downstream industries. This dimension is measured by the proportion of rural households participating in farmer cooperatives, which reflects the extent of benefit linkage between agricultural producers and related industries.
Following the methodology of Zhou and Han (2025), this study employs the entropy method to calculate the rural three-industry integration level for each provincial-level administrative region. The entropy method objectively determines weights based on the information entropy contained in the indicator data, offering greater impartiality in the weighting process compared to the analytic hierarchy process.
4.2.3 Moderating variables
Building on the theoretical analysis above, environmental regulation may play a critical role in moderating the relationship between rural three-industry integration and agricultural non-point source pollution. Furthermore, different types of environmental regulation operate through distinct mechanisms and exert varying degrees of influence on producers’ behavior, resulting in potential differences in their moderating effects. The empirical analysis categorizes environmental regulation into three types: command-and-control, market-based, and public-voluntary measures. This study examines how each type moderates the relationship between rural three-industry integration and agricultural non-point source pollution.
1. Command-and-control environmental regulation (CER) comprises mandatory government policies and regulations designed to mitigate the adverse effects of human activities on the environment. Following Guo and Li (2022) approach, this study quantifies CER intensity based on the number of provincial-level environmental protection regulations enacted annually, expressed in hundreds.
2. Market-based environmental regulation (MER) leverages market and pricing mechanisms to promote environmental protection. Following Hille and Möbius (2019) approach, this study quantifies MER intensity using the price of chemical fertilizers (10,000 yuan per ton).
3. Public-voluntary environmental regulation (PER) encompasses self-initiated public actions that enhance environmental quality, driven by environmental awareness. Following Zhang W. et al. (2024), this study quantifies PER intensity using the average daily search volume of the keyword “ecological agriculture” by region and year, as recorded in Baidu’s search index.
4.2.4 Control variables
To account for potential confounding factors in the estimation results, the following control variables are included: (1) Rural Economic Development Level (Inc): Measured by per capita disposable income in rural areas. (2) Rural Education Level (Edu): Measured by the average years of education in rural areas. Higher education levels among agricultural producers enhance their capacity to adopt new inputs, technologies, and production methods due to increased receptiveness to innovation and stronger learning abilities. (3) Agricultural Industrial Structure (Astr): Measured by the proportion of crop farming output in the total agricultural output, including forestry, animal husbandry, and fishery. (4) Agricultural Disaster Severity (Disa): Measured by the ratio of disaster-affected area to the total sown crop area. More severe agricultural disasters may encourage producers to increase their use of chemical fertilizers, pesticides, and other inputs to maintain yields and income. (5) Agricultural Infrastructure (Infra): This variable includes rural transportation, water conservancy, electricity, and communication facilities. The study employs rural road mileage, effective irrigation area, rural electricity consumption, and the number of mobile phones per 100 rural households to construct a composite index of agricultural infrastructure development using the entropy weight method. Well-developed infrastructure facilitates the adoption of green agricultural technologies, thereby influencing agricultural non-point source pollution.
4.3 Data sources and descriptive statistics of variables
This study employs panel data from 30 provinces and municipalities in mainland China spanning 2011 to 2022, excluding Hong Kong, Macau, Taiwan, and Tibet due to data unavailability. The dataset is primarily sourced from the China Industrial Statistical Yearbook, China Agricultural Machinery Statistical Yearbook, China Rural Management Statistical Yearbook, China Rural Yearbook, China Statistical Yearbook, China Population and Employment Statistical Yearbook, and National Agricultural Product Cost and Benefit Statistical Yearbook. Additional sources include regional statistical yearbooks, the China Economic Net statistical database, the Zhejiang University Carter Agricultural Database, the Ministry of Agriculture and Rural Affairs website, the Baidu Index platform, and the Peking University Law Database. Missing data are supplemented through interpolation. To adjust for inflation and mitigate the effects of price fluctuations, all price-related data are converted to 2011 constant prices using the Consumer Price Index (CPI). Descriptive statistics of the variables are provided in Table 4.

Table 4. Descriptive statistical results of the variables.
5 Empirical result analysis
5.1 Initial trends in rural three-industry integration and agricultural non-point source pollution
5.1.1 Temporal dynamics of rural three-industry integration and agricultural non-point source pollution
Figure 2 depicts the annual average trends of rural three-industry integration (line chart) and agricultural non-point source pollution intensity (bar chart) from 2011 to 2022 across 30 provincial-level administrative regions in China (excluding Hong Kong, Macau, Taiwan, and Tibet). Over the study period, rural three-industry integration exhibited a generally fluctuating upward trend, with the most rapid growth occurring in 2016. This surge likely reflects the policy guidance of the 2015 Central No. 1 Document, which for the first time explicitly promoted rural three-industry integration, with its benefits concentrated in the following year. Agricultural non-point source pollution intensity displayed an initial increase followed by a gradual decline, peaking in 2015. This decline may be attributed to the 2015 Ministry of Agriculture’s “Implementation Opinions on Fighting the Battle Against Agricultural Non-Point Source Pollution”, which curtailed excessive fertilizer and pesticide use, thereby partially mitigating agricultural non-point source pollution. However, by 2022, the reduction in pollution intensity relative to 2011 levels remained modest. Overall, the asynchronous trends of rural three-industry integration and agricultural non-point source pollution intensity preliminarily suggest a possible nonlinear relationship between the two variables.

Figure 2. Temporal dynamics of rural three-industry integration and agricultural non-point source pollution in China.
5.1.2 Preliminary analysis of the impact of rural three-industry integration on agricultural non-point source pollution
This study adopts the methodology of Chetty et al. (2013) to investigate the relationship between rural three-industry integration and agricultural non-point source pollution through a nonparametric regression approach (see Figure 3). Unlike parametric regression, nonparametric regression does not require a predefined functional form, enabling greater flexibility in capturing potential nonlinear relationships between variables. As shown in Figure 3, the impact of rural three-industry integration on agricultural non-point source pollution approximately follows an inverted U-shaped curve, suggesting that integration initially intensifies pollution before suppressing it, with the turning point occurring at an integration level of about 0.30. However, graphical analysis alone is insufficient to confirm the inverted U-shaped relationship. To substantiate this finding, the study further conducts regression analysis using econometric models.

Figure 3. Nonparametric smoothing scatter slot of rural three-industry integration and agricultural non-point source pollution.
5.2 Fixed effects model regression
As shown in Table 5, when the squared term of rural three-industry integration (Con2) is excluded, the impact of rural three-industry integration (Con) on agricultural non-point source pollution (Pol) is significantly positive at the 1% significance level (see columns (1) and (2)). In Column (3), after incorporating the squared term of rural three-industry integration, the coefficient of the linear term remains significantly positive at the 1% level, while the coefficient of the squared term becomes significantly negative at the same level. This suggests an inverted U-shaped relationship between rural three-industry integration and agricultural non-point source pollution, thereby confirming Hypothesis 1. A U-test was performed on regression (3) using the method proposed by Lind and Mehlum (2010). This test effectively addresses the issue of erroneous extreme value estimates in the model when the relationship between variables is convex and monotonically increasing, which could otherwise lead to an inaccurate estimate of an inverted U-shaped relationship. The U-test identified the turning point at 0.29 (1% significance level), confirming the existence of an inverted U-shaped relationship within the range [0.05, 0.52] for rural three-industry integration, thereby validating Hypothesis 1. Specifically, when the level of rural three-industry integration is below 0.29, it positively affects agricultural non-point source pollution. For every 1% increase in rural three-industry integration, the intensity of agricultural non-point source pollution rises by 0.52%. Once rural three-industry integration surpasses 0.29, its impact becomes negative. For every 1% increase in rural three-industry integration, the intensity of agricultural non-point source pollution decreases by 0.91%. The possible explanation is that, at lower levels of rural three-industry integration, the reduction in non-point source pollution is outweighed by the exacerbating effect due to limited green inputs, technology supply, and imperfect policies and regulations, resulting in an overall increase in non-point source pollution. However, when the level of rural three-industry integration exceeds 0.29, the continued expansion of green inputs, enhanced technology supply, and improved policies and regulations lead to a reduction in non-point source pollution.

Table 5. Baseline regression results.
By 2022, among the sample areas examined in this study (30 provinces and cities in mainland China), only Beijing (0.47), Tianjin (0.31), Shanghai (0.48), Jiangsu (0.32), and Zhejiang (0.32) had rural three-industry integration levels above 0.29. In these regions, further increases in rural three-industry integration contribute to reducing agricultural non-point source pollution. Chongqing (0.28) and Shandong (0.27) are near the 0.29 threshold. In other regions, where the level of rural three-industry integration is significantly below 0.29, an increase in rural three-industry integration would exacerbate agricultural non-point source pollution. This suggests that, in these areas, accelerating the development of rural three-industry integration to surpass the turning point is crucial for reducing agricultural non-point source pollution. Simultaneously, policies and regulations controlling agricultural non-point source pollution must be improved, and green inputs and technology supply should be enhanced to minimize the aggravating effect of rural three-industry integration on agricultural non-point source pollution.
Regarding the effects of control variables on agricultural non-point source pollution, both the level of rural economic development (Inc) and the agricultural industry structure (Astr) positively influence agricultural non-point source pollution, with significance at the 1% and 5% levels, respectively. In contrast, improvements in agricultural infrastructure (Infra) negatively affect agricultural non-point source pollution, with significance at the 1% level.
5.3 Robustness test
To verify the robustness of the conclusion that rural three-industry integration has an inverted U-shaped effect on agricultural non-point source pollution, we employ four approaches: modifying the dependent variable, narrowing the time window, removing outliers, and applying two-stage least squares (2SLS) estimation.
5.3.1 Modifying the dependent variable
Following Jiang et al. (2021), we apply the United Nations Human Development Index (HDI) weighting method to quantify agricultural non-point source pollution. This measure is calculated using the average application rates of fertilizers, pesticides, and agricultural films per hectare of farmland. The results in Column (1) of Table 6 confirm the persistence of an inverted U-shaped relationship between rural three-industry integration and agricultural non-point source pollution.

Table 6. Robustness test results.
5.3.2 Narrowing the time window
The COVID-19 pandemic, which emerged at the end of 2019, had a profound impact on both Chinese society and the world. To isolate the effects of external major events on agricultural production, we excluded the samples from 2019 onward and re-estimated the model. The results presented in Column (2) of Table 6 continue to show that the effect of rural three-industry integration on agricultural non-point source pollution follows an inverted U-shape.
5.3.3 Removing outliers
A bilateral 1% trimming is applied to all variables, and the regression results are reported in Column (3) of Table 6. The coefficient of the linear term for rural three-industry integration is significantly positive at the 1% level, while the coefficient of the squared term is significantly negative at the 1% level, further reinforcing the robustness of the baseline regression results.
5.3.4 Applying two-stage least squares (2SLS) estimation
Considering the potential bidirectional causality between rural three-industry integration and agricultural non-point source pollution, we adopt the methodology of Lai et al. (2023) and use the lagged values of rural three-industry integration and its squared term as instrumental variables for two-stage least squares (2SLS) estimation. The results are presented in Column (4) of Table 6. The Kleibergen-Paap rk LM statistic is significant at the 1% level, and the Cragg-Donald Wald F statistic is 164.99, which exceeds the critical value of 7.03 from the Stock-Yogo weak instrument test, indicating no issues with under-identification or weak instruments. Since the number of instrumental variables matches the number of endogenous explanatory variables, the model is exactly identified, thus avoiding over-identification issues. After addressing the endogeneity problem, the inverted U-shaped relationship between rural three-industry integration and agricultural non-point source pollution remains robust.
In summary, the conclusion that rural three-industry integration impacts agricultural non-point source pollution in an inverted U-shape remains robust.
5.4 The moderating effect of environmental regulation
The previous theoretical analysis suggests that environmental regulation may moderate the impact of rural three-industry integration on agricultural non-point source pollution (H2), with the moderating effects varying across different types of environmental regulation (H3). To test H2 and H3, we employ Model (3) (as detailed in Section 4; Subsection 1). To mitigate multicollinearity and enhance the reliability of the empirical results, we center the variables for rural three-industry integration (Con) and the three types of environmental regulation (Ger, Mer, Per). Columns (1)–(3) in Table 7 present the regression results for the moderating effects of command-and-control environmental regulation (Ger), market-based environmental regulation (Mer), and public-voluntary environmental regulation (Per). The results indicate that the coefficient for the linear term of rural three-industry integration is positive, while the coefficient for the squared term is negative, both significant at the 1% level. This suggests that, after accounting for the moderating effects of environmental regulation, the relationship between rural three-industry integration and agricultural non-point source pollution follows an inverted U-shape. The following analysis explores the influence of environmental regulation on the shape and turning point of this inverted U-shaped curve.

Table 7. Moderating effect analysis.
5.4.1 The influence of environmental regulation on the shape of the inverted U-Shaped curve
As shown in Table 7, the interaction terms between the three types of environmental regulation and the linear term of rural three-industry integration (Con × Ger, Con × Mer, Con × Per) have significant negative coefficients at the 1% level, whereas their interaction terms with the squared term of rural three-industry integration (Con2 × Ger, Con2 × Mer, Con2 × Per) have significant positive coefficients at the same significance level. This finding suggests that all three types of environmental regulation flatten the inverted U-shaped relationship, thereby mitigating the impact of rural three-industry integration on agricultural non-point source pollution and confirming Hypothesis 2. One possible explanation is that, at low levels of rural three-industry integration, constraints related to green inputs, technological advancements, and insufficient policy and regulatory frameworks hinder pollution reduction. As a result, the pollution-intensifying effects of three-industry integration surpass its pollution-mitigating effects, leading to a net increase in non-point source pollution. However, environmental regulations reduce pollution by limiting the use of fertilizers, pesticides, and other chemicals through educational initiatives, regulatory mandates, and incentive mechanisms, thereby curbing the pollution-increasing impact of three-industry integration. As rural three-industry integration deepens and policy frameworks improve, the marginal effect of environmental regulation on reducing non-point source pollution gradually diminishes.
5.4.2 The influence of environmental regulation on the inflection point of the inverted U-Shaped curve
Based on Haans et al. (2016), the criterion for determining the direction of the turning point movement in an inverted U-shaped curve is expressed as
Since command-and-control environmental regulation shifts the turning point of the inverted U-shaped curve to the right, whereas market-based and public-voluntary regulations shift it to the left, regions with rural three-industry integration levels below 0.29—where integration exacerbates non-point source pollution—should prioritize market-based and public-voluntary regulations when formulating environmental policies. This strategy enhances their role in shifting the turning point leftward, thereby shortening the pollution-intensifying phase of rural three-industry integration and accelerating its transition to the pollution-mitigating stage. Furthermore, as all three types of environmental regulation reduce the impact of rural three-industry integration on agricultural non-point source pollution, regulatory measures should be emphasized at lower integration levels to maximize their pollution-moderating effects. However, once integration surpasses 0.29, regulatory interventions should be gradually reduced to allow the pollution-mitigating benefits of rural three-industry integration to fully materialize.
5.5 Analysis of spatial measurement results
The theoretical analysis suggests that rural three-industry integration may generate spatial spillover effects on agricultural non-point source pollution (H4). To test this hypothesis, we apply Models (4) and (5), as described in Section 4, Subsection 1.
5.5.1 Analysis of spatial correlation results
As presented in Table 8, during the observation period (2011–2022), the global Moran’s I index for both rural three-industry integration and agricultural non-point source pollution in the sample regions remained positive and was statistically significant at the 1% level. This result confirms a significant positive spatial correlation between rural three-industry integration and agricultural non-point source pollution.

Table 8. Results of global Moran’s I.
5.5.2 Analysis of spatial panel test results
Table 9 presents the results of the spatial econometric model selection, indicating that the two-way fixed effects spatial Durbin model (SDM) is the most appropriate choice. First, the Lagrange Multiplier (LM) test was conducted to examine the presence of spatial effects. The results reveal significant spatial correlation in the panel data, with both spatial error and spatial lag effects, justifying the application of a spatial econometric model for further analysis. Next, the Likelihood Ratio (LR) and Wald tests were performed to assess whether the SDM simplifies into a spatial error model (SEM) or a spatial lag model (SLM). The results, significant at the 1% level, confirm that the SDM remains valid and should be employed for analysis. Finally, the Hausman test was used to determine whether a random effects or fixed effects model should be applied. The results favor the fixed effects model. Therefore, this study adopts the individual and time-fixed SDM for analysis. To ensure estimate consistency, the Lee & Yu transformation is applied (Lee and Yu, 2010).

Table 9. Results of the LM, LR, Wald, and Hausman statistical tests.
5.5.3 Analysis of spatial durbin model regression results
Table 10 presents the regression results of the spatial Durbin model. The spatial autocorrelation coefficient (ρ) is 0.22 and is significant at the 1% level, indicating strong spatial spillover effects of agricultural non-point source pollution. Specifically, an increase in agricultural non-point source pollution in one region leads to a corresponding rise in neighboring regions. As shown in column (1), after accounting for spatial correlation, the relationship between rural three-industry integration and agricultural non-point source pollution remains inverted U-shaped, confirming Hypothesis 4. Since ρ is significant and nonzero, the spatial matrix regression coefficients cannot directly capture the spatial spillover effects between variables (LeSage and Pace, 2009). To further examine these effects, partial derivatives are employed to decompose the model’s variables into direct, indirect, and total effects, as reported in columns (2)–(4). The direct effect measures the impact of rural three-industry integration on local agricultural non-point source pollution, while the indirect effect represents its spillover impact on neighboring regions. The total effect is the sum of the direct and indirect effects.

Table 10. Regression results of SDM model.
The direct, indirect, and total effects of rural three-industry integration (Con) and its squared term are all significant at the 1% level. The direct effect values for the linear and squared terms of rural three-industry integration are 0.45 and −0.77, respectively, while the indirect effect values are 0.70 and −1.41. These results demonstrate that rural three-industry integration has significant spatial spillover effects on agricultural non-point source pollution and follows an inverted U-shape, further supporting Hypothesis 4. At low levels of rural three-industry integration, advancements in neighboring regions may create market shocks, prompting local producers to adjust their production methods (Ye et al., 2023), which initially increases agricultural non-point source pollution. However, as integration advances in neighboring regions, agricultural production, services, and product processing become more interconnected, leading to larger production scales and higher farmer incomes (Peng et al., 2024). Observing the benefits in neighboring regions, local producers are likely to adopt similar practices. Nevertheless, delays in infrastructure development and technological adoption may cause local regions to continue relying on traditional production methods, temporarily exacerbating agricultural non-point source pollution. Over time, as rural three-industry integration deepens and technological barriers break down, coupled with technological innovations and capital inflows from neighboring regions, local agricultural producers will reduce their dependence on traditional methods. They will increasingly adopt green agricultural technologies, refine agricultural management practices, and implement enhanced environmental protection measures. Consequently, the development of rural three-industry integration in neighboring regions will more effectively mitigate agricultural non-point source pollution locally. The finding that rural three-industry integration exerts significant spatial spillover effects on agricultural non-point source pollution suggests that, in promoting three-industry integration and mitigating agricultural non-point source pollution, neighboring regions should strengthen cooperation and implement joint measures. Policies should aim to eliminate regional market barriers, facilitate the flow of capital, technology, and human resources, and promote interregional learning.
6 Conclusions and policy implications
Existing studies have extensively analyzed the impact of rural three-industry integration on agricultural carbon emissions and green agricultural production. In contrast, research on its impact on agricultural non-point source pollution remains scarce, particularly with respect to its underlying mechanisms, potential spatial spillover effects, and the roles of different types of environmental regulation, which have yet to receive adequate scholarly attention. Using panel data from 30 provinces and cities in China (excluding Hong Kong, Macao, Taiwan, and Tibet) from 2011 to 2022, this study empirically investigates the influence of rural three-industry integration on agricultural non-point source pollution and its spatial spillover effects. Furthermore, it explores how different types of environmental regulation—command-and-control, market-based, and public-voluntary—moderate this relationship.
6.1 Conclusions
The results demonstrate that:
First, the relationship between rural three-industry integration and agricultural non-point source pollution follows an inverted U-shape, with a turning point at an integration level of 0.29. Specifically, when the integration level is below 0.29, its progression aggravates non-point source pollution. However, beyond this threshold, further integration alleviates pollution. This conclusion remains robust following a series of sensitivity tests. By 2022, only five of the 30 sampled provinces and cities—Beijing (0.47), Tianjin (0.31), Shanghai (0.48), Jiangsu (0.32), and Zhejiang (0.32)—had surpassed the threshold, suggesting that further integration in these regions contributes to pollution reduction. Meanwhile, Chongqing (0.28) and Shandong (0.27) are approaching the turning point. In other regions, where integration levels remain significantly below 0.29, rural three-industry integration continues to intensify agricultural non-point source pollution.
Second, command-and-control, market-based, and public-voluntary environmental regulations all mitigate the impact of rural three-industry integration on agricultural non-point source pollution, flattening the inverted U-shaped curve. However, their moderating effects vary. Market-based and public-voluntary regulations shift the turning point leftward, reducing the duration of pollution intensification and accelerating the transition to pollution reduction. In contrast, command-and-control regulation shifts the turning point rightward, extending the period of pollution intensification and postponing the transition to pollution reduction.
Third, rural three-industry integration demonstrates a significant spatial correlation with agricultural non-point source pollution. Specifically, it follows an inverted U-shaped pattern locally and produces a similar spatial spillover effect in neighboring regions.
6.2 Policy implications
Based on the above findings, the following policy recommendations are proposed.
First, policies promoting rural three-industry integration should be strengthened, particularly in regions where integration levels remain significantly below 0.29. These areas should be guided toward the right side of the inverted U-shaped curve, shifting from exacerbating to mitigating agricultural non-point source pollution. To achieve this, the government should prioritize these regions in policy formulation and implementation. Targeted support should include increased investment in infrastructure—such as rural roads, logistics centers, and digital technology—to accelerate integration. Additionally, fiscal incentives, including tax reductions, subsidies, credit support, and talent attraction policies, should be introduced to encourage capital inflows into rural three-industry sectors. Furthermore, efforts should actively support the development of agricultural service industries, agricultural product processing, storage and distribution, rural leisure tourism, and innovative agricultural business models, such as farmer cooperatives, “enterprise + farmer” partnerships, and land trusteeships.
Second, in most regions of China—excluding Beijing, Tianjin, Shanghai, Jiangsu, and Zhejiang—rural three-industry integration remains relatively low (below 0.29), meaning these areas are still in the phase where integration exacerbates non-point source pollution. To shorten this phase and accelerate the transition to pollution reduction, these regions should prioritize market-based and public-voluntary environmental regulations when formulating and implementing environmental policies. This recommendation is based on the finding that market-based and public-voluntary regulations shift the turning point of the inverted U-shaped curve leftward, whereas command-and-control regulations shift it rightward. To achieve this goal, policies such as credit and financial support, tax incentives, and other measures should be effectively implemented to promote the research, development, and supply of green inputs and technologies, thereby lowering their costs. The certification of agricultural products under the “three certifications and one geographical indication” framework should be widely promoted, alongside strengthened regulatory oversight and public awareness initiatives to enhance the value of green agricultural products. These measures will encourage agricultural producers to adopt sustainable production practices and mitigate non-point source pollution. Additionally, education and training programs for agricultural producers should be expanded to enhance their environmental awareness and capacity for sustainable farming.
Third, in advancing rural three-industry integration and mitigating agricultural non-point source pollution, it is crucial to strengthen cooperation between neighboring regions and fully exploit their spatial spillover effects. Regarding industrial integration, neighboring regions should capitalize on their respective advantages to extend and complement regional industrial chains. This can be accomplished through joint initiatives such as establishing agricultural industrial parks, agricultural product processing hubs, shared logistics networks, and regional e-commerce platforms, thereby facilitating resource and technology sharing while fostering regionally distinctive brands. Additionally, collaboration can support the development of specialized industrial clusters and the creation of cross-regional agricultural tourism routes. To improve coordination, joint meeting mechanisms, cooperation agreements, and unified regional development strategies should be implemented to prevent policy conflicts. In terms of pollution control, neighboring regions should establish regional environmental cooperation platforms that integrate cross-regional environmental monitoring and pollution prevention systems, enabling efficient data sharing on agricultural non-point source pollution. Cross-regional ecological compensation and green incentive policies should be adopted to ensure the coordinated enforcement of agricultural environmental protection measures. Moreover, governments and industry associations should take the lead in establishing cross-regional green agricultural technology cooperation platforms. These platforms can facilitate resource sharing, technology transfer, and knowledge exchange through initiatives such as green technology training, forums, technology promotion, and personnel exchange programs.
Data availability statement
The original contributions presented in the study are included in the article/supplementary material, further inquiries can be directed to the corresponding author.
Author contributions
GH: Conceptualization, Formal Analysis, Methodology, Software, Supervision, Writing – review and editing. QN: Data curation, Validation, Visualization, Writing – original draft.
Funding
The author(s) declare that no financial support was received for the research and/or publication of this article.
Conflict of interest
The authors declare that the research was conducted in the absence of any commercial or financial relationships that could be construed as a potential conflict of interest.
Generative AI statement
The author(s) declare that no Generative AI was used in the creation of this manuscript.
Any alternative text (alt text) provided alongside figures in this article has been generated by Frontiers with the support of artificial intelligence and reasonable efforts have been made to ensure accuracy, including review by the authors wherever possible. If you identify any issues, please contact us.
Publisher’s note
All claims expressed in this article are solely those of the authors and do not necessarily represent those of their affiliated organizations, or those of the publisher, the editors and the reviewers. Any product that may be evaluated in this article, or claim that may be made by its manufacturer, is not guaranteed or endorsed by the publisher.
References
Buttel, F. H. (2003). Internalizing the societal costs of agricultural production. Plant Physiol. 133, 1656–1665. doi:10.1104/pp.103.030312
Cammarata, M., Scuderi, A., Timpanaro, G., and Cascone, G. (2024). Factors influencing farmers’ intention to participate in the voluntary carbon market: an extended theory of planned behavior. J. Environ. Manag. 369, 122367. doi:10.1016/j.jenvman.2024.122367
Cao, L., and Yang, C. (2025). Rural industry integration, environment governance synergy and rural residents’ income. Ecol. Econ. 41, 128–135. Available online at: https://kns.cnki.net/KCMS/detail/detail.aspx?dbcode=CJFQ&dbname=CJFDLAST2025&filename=STJJ202502015.
Chen, X., and Cheng, C. (2018). The route of three industries integration under the strategy of rural revitalization: logical inevitability and empirical judge. Issues Agric. Econ., 91–100. doi:10.13246/j.cnki.iae.2018.11.009
Chen, S., Zhong, Z., and Lu, H. (2023). Impact of agricultural production outsourcing service and land fragmentation on agricultural non-point source pollution in China: evidence from Jiangxi province. Front. Environ. Sci. 10, 1079709. doi:10.3389/fenvs.2022.1079709
Chen, C., Wang, J., Jiang, W., and Xie, A. (2025). Can the integration of agriculture and tourism foster agricultural green development? An empirical analysis based on panel data from 30 provinces in China. Front. Sustain. Food Syst. 9, 1570767. doi:10.3389/fsufs.2025.1570767
Cheng, L., Yan, Y., and Tian, Z. (2024). Study on the multi-dimensional impact of rural industrial integration on ecological environment—Taking the yangtze river economic belt as an example. Agric. Econ. Manag., 105–120. Available online at: https://kns.cnki.net/KCMS/detail/detail.aspx?dbcode=CJFQ&dbname=CJFDLAST2024&filename=NYJG202404009.
Chetty, R., Friedman, J. N., and Saez, E. (2013). Using differences in knowledge across neighborhoods to uncover the impacts of the EITC on earnings. Am. Econ. Rev. 103, 2683–2721. doi:10.1257/aer.103.7.2683
Gao, X., Li, B., Jiang, S., and Nie, Y. (2021). Can increasing scale efficiency curb agricultural nonpoint source pollution? Int. J. Environ. Res. Public Health 18, 8798. doi:10.3390/ijerph18168798
Gao, Q., Sun, M., and Chen, L. (2024). The impact of digital inclusive finance on agricultural economic resilience. Finance Res. Lett. 66, 105679. doi:10.1016/j.frl.2024.105679
Ge, J., Wang, M., and Tang, Y. (2022). Rural industrial integration, consumption of urban and rural residents and urban-rural income gap: can both efficiency and fairness be achieved? China Rural. Econ., 50–66. Available online at: https://kns.cnki.net/KCMS/detail/detail.aspx?dbcode=CJFQ&dbname=CJFDLAST2022&filename=ZNJJ202203004.
Gunasekara, F. I., Richardson, K., Carter, K., and Blakely, T. (2014). Fixed effects analysis of repeated measures data. Int. J. Epidemiol. 43, 264–269. doi:10.1093/ije/dyt221
Guo, J. (2025). Challenges and solutions for controlling agricultural non-point source pollution in China. Agric. Econ., 24–26. Available online at: https://kns.cnki.net/KCMS/detail/detail.aspx?dbcode=CJFQ&dbname=CJFDLAST2025&filename=NYJJ202503008.
Guo, H., and Li, S. (2022). Environmental regulation, spatial effect and agricultural green development. Res. Dev. Manag. 34, 54–67. doi:10.13581/j.cnki.rdm.20210715
Guo, Z., Chen, X., and Zhang, Y. (2022). Impact of environmental regulation perception on farmers’ agricultural green production technology adoption: a new perspective of social capital. Technol. Soc. 71, 102085. doi:10.1016/j.techsoc.2022.102085
Haans, R. F. J., Pieters, C., and He, Z.-L. (2016). Thinking about U: theorizing and testing U- and inverted U-shaped relationships in strategy research. Strategic Manag. J. 37, 1177–1195. doi:10.1002/smj.2399
He, Y., Liu, Y., and Fang, X. (2025). How urban–rural interactions promote sustainable rural development: evidence from the chang–zhu–tan urban agglomeration, China. Geogr. Sustain. 6, 100338. doi:10.1016/j.geosus.2025.100338
Hille, E., and Möbius, P. (2019). Do energy prices affect employment? Decomposed international evidence. J. Environ. Econ. Manag. 96, 1–21. doi:10.1016/j.jeem.2019.04.002
Hu, Y., Yu, H., and Chen, Q. (2023). Digitalization driving high-quality converged development of rural primary, secondary, and tertiary industries: mechanisms, effects, and paths. Sustainability 15, 11708. doi:10.3390/su151511708
Huang, Y.-Z., Lee, Y.-Y., and Fan, C. (2025). Innovative fertilization strategies for in-situ pollution control and carbon negativity enhancement in agriculture. Agric. Water Manag. 307, 109270. doi:10.1016/j.agwat.2024.109270
Jiang, S., Zhou, J., and Qiu, S. (2021). Can appropriate scale operation restrain agricultural non-point source pollution? —empirical study based on dynamic threshold panel model. Agric. Technol. Econ., 33–48. doi:10.13246/j.cnki.jae.2021.07.003
Karp, D. R., and Gaulding, C. L. (1995). Motivational underpinnings of Command-and-Control, market-based, and voluntarist environmental policies. Hum. Relat. 48, 439–465. doi:10.1177/001872679504800501
Kong, F., Jiang, D., and Xu, C. (2024). Impacts of agricultural eco-efficiency on urban-rural income gap in economically developed areas: a case study of Zhejiang Province. J. China Agric. Univ. 29, 307–322. doi:10.11841/j.issn.1007-4333.2024.09.26
Lai, Y., Yang, H., Qiu, F., Dang, Z., and Luo, Y. (2023). Can rural industrial integration alleviate agricultural non-point source pollution? Evidence from rural China. Agriculture 13, 1389. doi:10.3390/agriculture13071389
Lee, L., and Yu, J. (2010). Estimation of spatial autoregressive panel data models with fixed effects. J. Econ. 154, 165–185. doi:10.1016/j.jeconom.2009.08.001
LeSage, J., and Pace, R. K. (2009). Introduction to spatial econometrics. New York: Chapman and Hall/CRC. doi:10.1201/9781420064254
Li, K., and Shi, L. (2024). Effects of rural industrial convergence on agricultural carbon emissions: mechanism path and spatial spillover effect analysis. Chin. J. Agric. Resour. Regional Plan. 45, 1–14. doi:10.7621/cjarrp.1005-9121.20240401
Li, Y., Chen, J., and Chen, C. (2017). On the evaluation index system of agriculture convergence development and its application to beijing. Sci. Technol. Manag. Res. 37, 55–63. doi:10.3969/j.issn.1000-7695.2017.04.010
Li, L., Yang, K., and Yang, J. (2018). The efficiency evaluation of the convergence development of agriculture, second industry and third industry in rural area of China. Chin. J. Agric. Resour. Regional Plan. 39, 78–85. doi:10.7621/cjarrp.1005-9121.20181013
Li, M., Wang, J., Zhao, P., Chen, K., and Wu, L. (2020). Factors affecting the willingness of agricultural green production from the perspective of farmers’ perceptions. Sci. Total Environ. 738, 140289. doi:10.1016/j.scitotenv.2020.140289
Li, Q., Wang, J., Wu, J., and Zhai, Q. (2023). The dual impacts of specialized agricultural services on pesticide application intensity: evidence from China. Pest Manag. Sci. 79, 76–87. doi:10.1002/ps.7174
Li, Z., Yan, H., and Liu, X. (2023). Evaluation of china’s rural industrial integration development level, regional differences, and development direction. Sustainability 15, 2479. doi:10.3390/su15032479
Lind, J. T., and Mehlum, H. (2010). With or without U? The appropriate test for a U-Shaped relationship. Oxf. Bull. Econ. Statistics 72, 109–118. doi:10.1111/j.1468-0084.2009.00569.x
Liu, Y., Zhang, M., Cao, Q., Wang, E., and Zou, B. (2023). Can integration of agriculture and tourism promote rural green development? empirical evidence from 152 cities in China. Agriculture 13, 405. doi:10.3390/agriculture13020405
Liu, L., Zhang, L., Li, B., Wang, Y., and Wang, M. (2024). Can financial agglomeration curb carbon emissions reduction from agricultural sector in China? Analyzing the role of industrial structure and digital finance. J. Clean. Prod. 440, 140862. doi:10.1016/j.jclepro.2024.140862
Lu, Y., Wang, C., Yang, R., Sun, M., Zhang, L., Zhang, Y., et al. (2023). Research on the progress of agricultural non-point source pollution management in China: a review. Sustainability 15, 13308. doi:10.3390/su151813308
Lu, Y., Yin, M., Tian, Y., and Huang, L. (2025). Nonlinear impact mechanism of rural industrial integration on agricultural carbon emissions. East China Econ. Manag., 1–12. doi:10.19629/j.cnki.34-1014/f.240528021
Luo, M., and Wei, B. (2022). Environmental effects of rural three-industry integration. Rural. Econ., 57–66. Available online at: https://kns.cnki.net/KCMS/detail/detail.aspx?dbcode=CJFQ&dbname=CJFDLAST2023&filename=NCJJ202212007.
Ma, J., Gao, H., Cheng, C., Fang, Z., Zhou, Q., and Zhou, H. (2023). What influences the behavior of farmers’ participation in agricultural nonpoint source pollution control? Evidence from a farmer survey in Huai’an, China. Agric. Water Manag. 281, 108248. doi:10.1016/j.agwat.2023.108248
Meng, F., Chen, H., Yu, Z., Xiao, W., and Tan, Y. (2022). What drives farmers to participate in rural environmental governance? Evidence from villages in sandu town, eastern China. Sustainability 14, 3394. doi:10.3390/su14063394
Min, M., Li, H., Ma, T., and Miao, C. (2023). Will agricultural land scale management aggravate non-point source pollution? – chaohu Lake basin, China as a case study. Appl. Geogr. 158, 103056. doi:10.1016/j.apgeog.2023.103056
Niu, Z., Yi, F., and Chen, C. (2022). Agricultural insurance and agricultural fertilizer non-point source pollution: evidence from China’s policy-based agricultural insurance pilot. Sustainability 14, 2800. doi:10.3390/su14052800
Nuruzzaman, M., Bahar, M. M., and Naidu, R. (2025). Diffuse soil pollution from agriculture: impacts and remediation. Sci. Total Environ. 962, 178398. doi:10.1016/j.scitotenv.2025.178398
Pan, D., and Tang, J. (2021). The effects of heterogeneous environmental regulations on water pollution control: Quasi-natural experimental evidence from China. Sci. Total Environ. 751, 141550. doi:10.1016/j.scitotenv.2020.141550
Peng, H., Yang, F., and Yue, O. (2024). How rural industry revitalization affects farmers’ incomes in China. Sustainability 16, 9182. doi:10.3390/su16219182
Ren, S., Li, X., Yuan, B., Li, D., and Chen, X. (2018). The effects of three types of environmental regulation on eco-efficiency: a cross-region analysis in China. J. Clean. Prod. 173, 245–255. doi:10.1016/j.jclepro.2016.08.113
Rong, J., Guo, Q., Chen, S., and Hao, J. (2025). Does carbon emission trading policy improve agricultural energy transition? Evidence from China. Econ. Analysis Policy 87, 1670–1689. doi:10.1016/j.eap.2025.07.032
Shang, J., Ji, X., and Chen, X. (2020). Study on the impact of China’s urbanization on agricultural ecological effi-ciency:Based on panel data of 13 major grain-producing regions in China from 2009 to 2018. zgstnyxb 28, 1265–1276. doi:10.13930/j.cnki.cjea.200135
Shi, H., and Yi, M. (2020). Environmental regulation, non-agricultural employment, and agricultural non-point source pollution: evidence from fertilizer application. Rural. Econ., 127–136. Available online at: https://kns.cnki.net/KCMS/detail/detail.aspx?dbcode=CJFQ&dbname=CJFDLAST2020&filename=NCJJ202007017.
Tao, Y., Liu, J., Guan, X., Chen, H., Ren, X., Wang, S., et al. (2020). Estimation of potential agricultural non-point source pollution for baiyangdian basin, China, under different environment protection policies. PLoS ONE 15, e0239006. doi:10.1371/journal.pone.0239006
Tchorzewska, K. B. (2024). A lost opportunity? Environmental investment tax incentive and energy efficient technologies. Environ. Resour. Econ. 87, 3301–3333. doi:10.1007/s10640-024-00916-4
Tian, C., Li, L., and Liao, B. (2024). Can integration of rural primary, secondary and tertiary industries promote agricultural green development? A case study of 579 counties in China's yangtze river economic belt. J. Nat. Resour. 39, 601–619. doi:10.31497/zrzyxb.20240307
Wang, J., Zhou, F., and Xie, A. (2022). The impact of integrated development of agriculture and tourism on rural ecological environment quality. Wirel. Commun. Mob. Comput. 2022, 1–11. doi:10.1155/2022/6113324
Wang, H., Liu, C., Xiong, L., and Wang, F. (2023). The spatial spillover effect and impact paths of agricultural industry agglomeration on agricultural non-point source pollution: a case study in yangtze river Delta, China. J. Clean. Prod. 401, 136600. doi:10.1016/j.jclepro.2023.136600
Wang, R., Shi, J., Hao, D., and Liu, W. (2023). Spatial–temporal characteristics and driving mechanisms of rural industrial integration in China. Agriculture 13, 747. doi:10.3390/agriculture13040747
Wang, Y., Huang, H., Liu, J., Ren, J., Gao, T., and Chen, X. (2023). Rural industrial integration’s impact on agriculture GTFP growth: influence mechanism and empirical test using China as an example. Int. J. Environ. Res. Public Health 20, 3860. doi:10.3390/ijerph20053860
Wang, J., Peng, L., Chen, J., and Deng, X. (2024). Impact of rural industrial integration on farmers’ income: evidence from agricultural counties in China. J. Asian Econ. 93, 101761. doi:10.1016/j.asieco.2024.101761
Wen, G., Yang, L., Zhang, X., Zhou, Y., Zhou, H., and Hu, X. (2025). The impact of environmental regulation on farmland non-point source pollution: evidence from the Dongting Lake plain, China. Sustainability 17, 328. doi:10.3390/su17010328
Winsten, J. R. (2009). Improving the cost-effectiveness of agricultural pollution control: the use of performance-based incentives. J. Soil Water Conservation 64, 2. doi:10.2489/jswc.64.3.88A
Xie, C., Kuang, Y., Wen, H., and Wu, X. (2025). Agricultural agglomeration or industrial integration: how does agricultural insurance bolster agricultural resilience in China? Front. Sustain. Food Syst. 9, 1531287. doi:10.3389/fsufs.2025.1531287
Xu, C., and Xue, L. (2019). Agricultural industry agglomeration and agricultural non-point source pollution—A perspective based on spatial heterogeneity. Finance Econ., 82–96. Available online at: https://kns.cnki.net/KCMS/detail/detail.aspx?dbcode=CJFQ&dbname=CJFDLAST2019&filename=CJKX201908008.
Xu, L., Jiang, J., Lu, M., and Du, J. (2023). Spatial-temporal evolution characteristics of agricultural intensive management and its influence on agricultural non-point source pollution in China. Sustainability 15, 371. doi:10.3390/su15010371
Yang, C., Zeng, H., and Zhang, Y. (2022). Are socialized services of agricultural green production conducive to the reduction in fertilizer input? Empirical evidence from rural China. Int. J. Environ. Res. Public Health 19, 14856. doi:10.3390/ijerph192214856
Ye, F., Qin, S., Nisar, N., Zhang, Q., Tong, T., and Wang, L. (2023). Does rural industrial integration improve agricultural productivity? Implications for sustainable food production. Front. Sustain. Food Syst. 7, 1191024. doi:10.3389/fsufs.2023.1191024
You, Z., Hou, G., and Wang, M. (2024). Heterogeneous relations among environmental regulation, technological innovation, and environmental pollution. Heliyon 10, e28196. doi:10.1016/j.heliyon.2024.e28196
Zhang, Y., and Liu, Y. (2024). The impact of rural industrial integration on agricultural carbon emissions evidence from China provinces data. Sustainability 16, 680. doi:10.3390/su16020680
Zhang, W., Gao, P., Chen, Z., and Qiu, H. (2023). Preventing agricultural non-point source pollution in China: the effect of environmental regulation with digitization. Int. J. Environ. Res. Public Health 20, 4396. doi:10.3390/ijerph20054396
Zhang, S., Luo, Y., and Zhang, P. (2024). Economic driving characteristics of agricultural non-point source pollution and prevention suggestions: a case study from Shandong Province in China. Front. Environ. Sci. 12, 1352412. doi:10.3389/fenvs.2024.1352412
Zhang, W., Jing, Q., and Lu, J. (2024). The influence of public environmental concern on the rural living environment in China. Front. Sustain. Food Syst. 8, 1496017. doi:10.3389/fsufs.2024.1496017
Zhang, W., Liang, S., Wu, W., Zhuang, H., and He, Q. (2025). Willingness to perform environmentally friendly practices in rural areas: evidence from environmental regulation in agriculture. Front. Environ. Sci. 13, 1502291. doi:10.3389/fenvs.2025.1502291
Zhao, W., Luo, X., and Tang, L. (2025). The effect of rural land inward and rural industrial integration transfer on agricultural green productivity. J. Nat. Resour. 40, 692–711. doi:10.31497/zrzyxb.20250308
Zhao, Y., Feng, Y., Shen, J., and He, Y. (2025). Can market-oriented environmental regulation achieve synergistic reduction of atmospheric pollution and carbon emissions? Evidence from China’s carbon emissions trading policy. Clean. Environ. Syst. 18, 100299. doi:10.1016/j.cesys.2025.100299
Zhou, X., and Han, M. (2025). Addressing global challenges: how does the integration of rural industries in China enhance agricultural resilience? PLOS ONE 20, e0327796. doi:10.1371/journal.pone.0327796
Zhu, H., Fang, H., Hua, F., Shao, W., and Cai, P. (2024). The impact of environmental regulations on the upgrading of the industrial structure: evidence from China. Heliyon 10, e27091. doi:10.1016/j.heliyon.2024.e27091
Keywords: rural three-industry integration, agricultural non-point source pollution, spatial effect, command-and-control environmental regulation, market-based environmental regulation, public-voluntary environmental regulation
Citation: He G and Nong Q (2025) The nonlinear impact of rural three-industry integration on agricultural non-point source pollution: its spatial effects and the moderating effect of environmental regulations. Front. Environ. Sci. 13:1633601. doi: 10.3389/fenvs.2025.1633601
Received: 22 May 2025; Accepted: 05 September 2025;
Published: 17 September 2025.
Edited by:
Wei Shui, Fuzhou University, ChinaReviewed by:
Fida Hussain Nausherwani, Henan Agricultural University, ChinaYanrong Lu, Beijing Normal University, China
Copyright © 2025 He and Nong. This is an open-access article distributed under the terms of the Creative Commons Attribution License (CC BY). The use, distribution or reproduction in other forums is permitted, provided the original author(s) and the copyright owner(s) are credited and that the original publication in this journal is cited, in accordance with accepted academic practice. No use, distribution or reproduction is permitted which does not comply with these terms.
*Correspondence: Guoping He, aGVzeTExMTdAc2luYS5jbg==