 Chenyang Liu
- College of Science, Shihezi University, Shihezi, China
China confronts challenges of inefficient cultivated land utilization and ecological pressures amid rapid urbanization. Coordinated development of cultivated land use eco-efficiency (CLUEE) and new-type urbanization (NTU) is essential for high-quality growth. As a rapidly urbanizing major grain-producing province, Henan is confronted with a serious imbalance in the development of CLUEE and NTU.Existing research lacks comprehensive spatiotemporal analysis of their coupling coordination relationship at fine scales, limiting precise policy formulation. This study quantifies CLUEE and NTU dynamics in Henan using integrated super-SBM and entropy-weighted models, elucidates coupling coordination mechanisms, and proposes spatially differentiated governance strategies. Key findings demonstrate that: (1) The CLUEE in Henan Province rose significantly from 0.09 in 2002 to 0.47 in 2022. At the county scale, there is a transition from point-like diffusion centered on Zhengzhou to continuous expansion, and low-efficiency clusters persist in the western mountainous areas. The overall NTU rose from 0.15 to 0.32, spatially, it presents high-value corridors along the traffic axis and a gradient descent zone centered on Zhengzhou. (2) Overall, the coupling coordination degree has increased from 0.31 to 0.59. At the municipal scale, Hebi leads the province, while Shangqiu is slightly out of balance. The high-value areas in counties are spreading from single-core to T-shaped corridors. (3) The driving factors show temporal and spatial heterogeneity: County-level disposable income dominates globally, while local fiscal budgets and the degree of terrain roughness shape regional interactions. The inhibitory effects on per capita cultivated land area and fiscal revenue have intensified. Agricultural mechanization has shifted from inhibition to promotion, highlighting the path differentiation between intensive development in northeast region and ecological constraints in southwest region of Henan Province. These findings reveal that the co-evolution of CLUEE and NTU in Henan Province operates through a complex synergy of resources, technology, and policy, characterized by spatially heterogeneous, non-linear interactions among multiple factors. This study underscores the significance of the county-level research, which enables local governments to implement more targeted policy regulation.
1 Introduction
Cultivated land, as a strategic resource critical for maintaining human survival and civilizational continuity, represents a dual foundational pillar for both food security and ecological sustainability within territorial spatial systems (Kuang et al., 2020). Against the backdrop of persistent global population growth and the evolution of dietary structure, escalating demands for agricultural products necessitate enhanced requirements for both quantitative preservation and productivity optimization of cultivated land resources. Contemporary urbanization processes have precipitated relentless spatial expansion of urban built-up areas through boundary proliferation. This urban territorial acquisition, achieved through the encroachment on peripheral high-quality cultivated land, has exacerbated landscape fragmentation and environmental contamination, thereby diminishing agricultural productivity (Wang et al., 2024). Such spatial transformations impose dual pressures of “quantitative attrition and qualitative degradation” on finite cultivated land reserves. Notably, World Cities Report 2022 projects that the global urbanization will escalate from 56% in 2021 to 68% in 2050. Concurrently, the Global Report on Food Crises 2023 documents 258 million people experiencing acute food insecurity. These intersecting challenges underscore the imperative for spatial planners to reconcile ecological conservation of cultivated land with sustainable urban growth within the framework of global sustainable development agenda.
The conceptualization of cultivated land use eco-efficiency (CLUEE) evolved from the “eco-efficiency” paradigm initially articulated by Schaltegger and Sturm (1990), who established a dynamic analytical matrix that evaluates the relationship between economic value generation and environmental externalities (Schaltegger and Sturm, 1990). Within urban-rural land use systems, CLUEE quantifies the utilization effectiveness of cultivated land through an optimization model that minimizes environmental perturbations while maximizing agricultural economic outputs and grain yields. This is achieved through systematic reconfiguration of production factors encompassing land, labor, and agrochemical inputs (Fan et al., 2024). The paradigm emphasizes achieving synergetic optimization between socioeconomic benefits and ecological preservation through technological innovation and resource reallocation. Its theoretical essence resides in maintaining equilibrium within the tripartite interaction system of “resource allocation-economic productivity-ecological integrity” (Zhang et al., 2024), presenting a crucial analytical lens for sustainable land use. Methodologically, scholars employ analytical tools including the DEA model (Jingxin et al., 2022), the SBM model (Cecchini et al., 2018), the super-efficiency SBM model (Cao et al., 2022), the stochastic Frontiers production function (Zuo et al., 2013), and the comprehensive evaluation model (Chen and Pei, 2025) to calculate the CLUEE.
The conventional urbanization paradigm has historically overlooked the fundamental principles of ecological efficiency, predominantly prioritizing “spatial expansion” and “economic increment” through extensive spatial proliferation models, while neglecting the criticality of human-nature symbiosis in sustainable development. Aligned with the national strategy for comprehensive socioeconomic green transition, China’s new-type urbanization (NTU) framework positions human-centered development as its core, advocating coordinated advancement across demographic distribution, economic activities, social structures, and ecological systems (Zhang and Xing, 2023). Promoting the flow of factors between urban and rural areas through spatial reconstruction, industrial upgrading and institutional innovation is an important practical path for SDG 11 (Sustainable Cities and Communities) and SDG12 (Responsible Consumption and Production). NTU assessments typically utilize multidimensional indicator systems through comprehensive evaluation methodologies (Lin and Zhu, 2021; Chen et al., 2023a; Shao and Wang, 2023).
Academic research has gradually focused on interpreting the interactive mechanism between the NTU and CLUEE. Koroso et al. demonstrated through Ethiopian case studies that inefficient utilization of reclaimed agricultural parcels within urban peripheries exacerbates disordered metropolitan sprawl and landscape fragmentation (Koroso et al., 2021). Xiao et al. proposed prioritizing land use efficiency over urbanization processes in ecologically fragile regions due to multifactorial constraints (Xiao et al., 2022). Zhao et al. identified phased transitions in cultivated land eco-efficiency under NTU, characterized by “improvement -imbalance-optimization” cycles (Zhao et al., 2018). Hou et al. revealed urbanization’s multidimensional impacts on land use efficiency through input-output configuration alterations, manifesting as aggregation effects, constraint effects, driving forces, and feedback mechanisms with temporal phase differentiation (Hou et al., 2019). Geographically, existing research predominantly operates at provincial and municipal administrative scales. Existing studies have analyzed the cultivated land utilization efficiency of Henan Province from 1999 to 2008 at the provincial scale and found that while the cultivated land utilization efficiency has increased year by year, it has been significantly affected by regional economic development (Zhou, 2011). Qiu et al. measured the efficiency of cultivated land utilization at both the national and provincial scales and found that the efficiency of cultivated land utilization across the country rose slowly from 2009 to 2019. Among them, the average efficiency of cultivated land utilization in 11 provinces ranked among the top in production (Qiu et al., 2023). In the research on new urbanization, Cheng et al. found from the study at the municipal scale that industrial agglomeration had a significant promoting effect on the new urbanization of the Pearl River Delta urban agglomeration from 2006 to 2018 (Cheng et al., 2023). Lin et al. discovered that new urbanization has a significant energy-saving effect (Lin and Zhu, 2021). Feng et al. analyzed the coordination degree between CLUEE and NTU at the municipal scale along the Yangtze River Economic Belt (Feng et al., 2023b).
The coupling relationship between CLUEE and NTU constitutes a core nexus in urban-rural integration and ecological civilization construction, forming a dynamic mutual feedback mechanism through factor mobility, technological innovation, and policy regulation. Their interactive dynamics exert a profound impact on the optimal allocation of regional resources and high-quality development. The driving effects of CLUEE on NTU are manifested in three dimensions: firstly, efficient agricultural production releases surplus rural labor, thereby providing human resource support for population urbanization; secondly, enhanced agricultural economic output supplies material foundations and market impetus for urbanization, with increased farmers’ income driving consumption upgrading to facilitate the optimization of urban industrial structures; thirdly, improved ecological efficiency of cultivated land mitigates environmental pressures in the process of urbanization, laying a solid foundation for ecological urbanization. Conversely, NTU feeds back to the improvement of CLUEE through the agglomeration of technology, capital, and policy guidance: urbanization promotes the transformation of agricultural production towards intensification and ecologicalization, while governments implement environmental regulations and ecological compensation mechanisms to restrict extensive cultivated land use, incentivize green production, and facilitate the exploration of multi-functional values of cultivated land. Although urbanization may temporarily squeeze the space of cultivated land—such as the loss of high-quality arable land due to the expansion of construction land—factor reorganization and policy intervention can optimize the structure of cultivated land use, achieving a balance between efficiency and protection, which provides theoretical support for coordinating urbanization expansion and cultivated land protection as well as promoting green transformation.
In summary, regarding CLUEE assessment, input-output analysis has emerged as the predominant approach. However, conventional Data Envelopment Analysis exhibits a significant limitation: it fails to discriminate effectively between Decision-Making Units exhibiting efficiency scores exceeding unity. Consequently, the super-efficiency model has been widely adopted in the extant literature. This study employs the Super-SBM model incorporating undesirable outputs. This methodological choice offers two key advantages: (1) it effectively distinguishes performance differences among efficient DMUs. (2) It explicitly integrates undesirable outputs into the efficiency calculation, thereby providing a more environmentally sustainable measurement of CLUEE. For NTU measurement, the comprehensive assessment method has become the established standard within the field due to its capacity to holistically capture development characteristics. Accordingly, this study aligns with the prevailing scholarly consensus and adopts this comprehensive assessment framework for NTU measurement.
In addition, current scholarship remains insufficient in elucidating the spatiotemporal evolutionary patterns and multidimensional driving mechanisms underlying the coordinated development between CLUEE and NTU at a more refined county-level scale. As the grassroots units of national governance, conducting county -scale research can not only clarify the overall driving characteristics of key influencing factors but also reveal their spatial heterogeneity effects. This can support the proposal of more precise policy suggestions and help local governments promote the coordinated development of CLUEE and NTU more effectively. Moreover, there is a lack of research on analyzing the mechanism of influence factors from a multi-scale perspective and exploring the nonlinear interaction effects of multi-dimensional driving factors, which is difficult to support the design of differentiated policies.
As China’s paramount wheat production base and a megaregion with over 100 million registered inhabitants, Henan province’s dual identity as a strategic agricultural base and demographic megaregion renders its CLUEE-NTU coupling coordination study both paradigmatic and imperative. This study adopts Henan’s county-level administrative units as analytical units, employing integrated methodologies including the Super-SBM model and entropy-weighted comprehensive evaluation model to quantify CLUEE and NTU levels. Constructing a coupled and coordinated analysis framework which can examine the driving effects of influencing factors and spatial heterogeneity at both provincial and county-level scales, and proposes targeted governance strategies. This methodological approach establishes an empirical foundation for synergistic advancement of CLUEE and NTU, ultimately supporting regional high-quality development.
2 Materials and methods
2.1 Study area description
Henan Province is located in the eastern part of central China (110°21′∼116°39′ E, 31°23′∼36°22′ N). Its administrative framework comprises 158 administered county-level unit. The terrain transitions from elevated western highlands to lower eastern plains, with the Nanyang Basin occupying the southwestern region and the Huang-Huai-Hai Plain dominating the central-eastern areas (Figure 1). Encompassing a total administrative area of 167,000 km2, this province sustains a stable cultivated land reserve exceeding 7.33 million hectares. In 2023, the cultivated land area accounted for 45.33% of the province’s total land area, and the total grain output reached 66,245,000 tons, firmly ranking as the second largest grain-producing province in the country. It is an important force in ensuring national food security. Concurrently, Henan’s county-level jurisdictions have emerged as focal areas for advancing NTU. Since 2000, the permanent urban resident population in Henan Province has continued to increase. In 2023, the permanent resident population was 98.15 million, and the urbanization rate reached 58.08% (Dong et al., 2025).
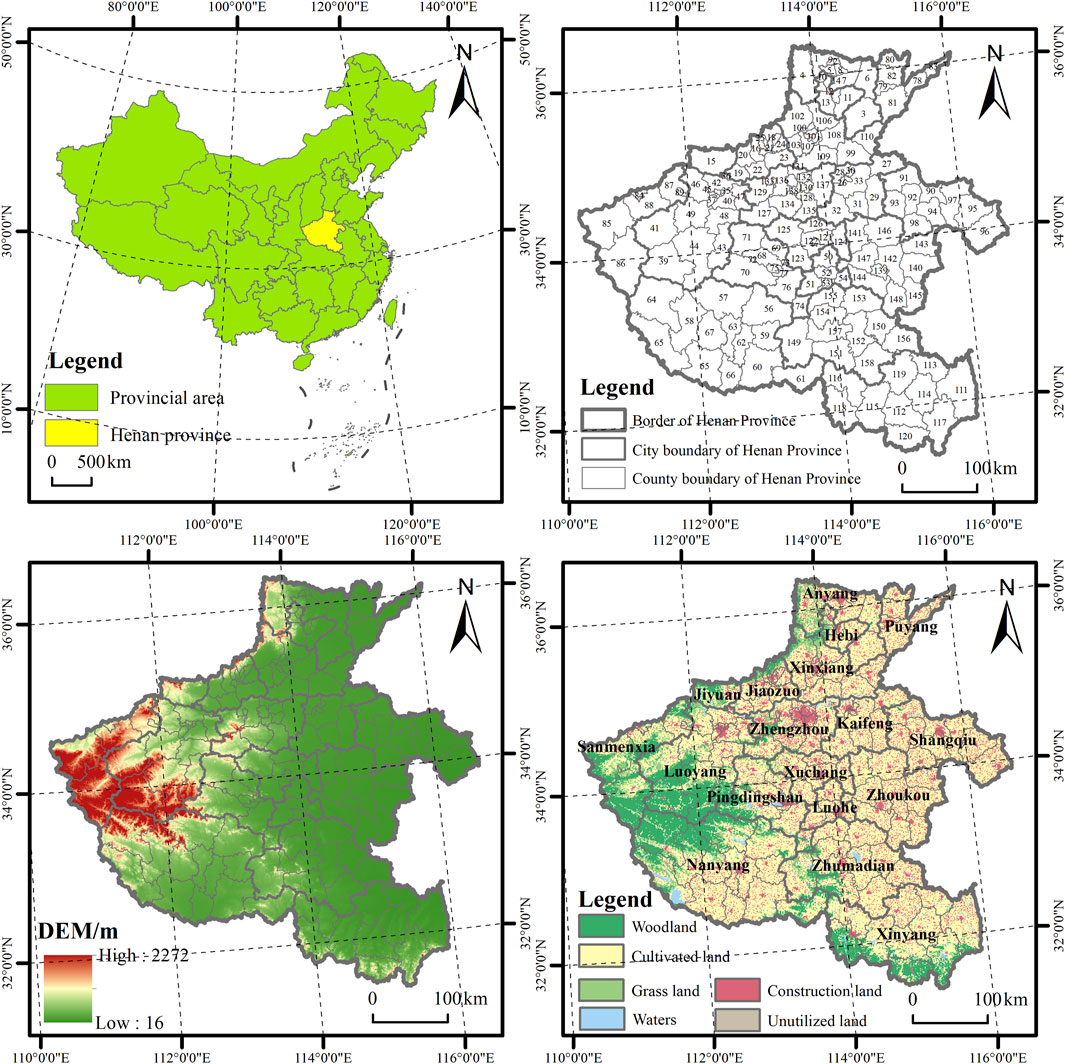
Figure 1. Schematic diagram of the research area. Note: 1 Anyang, 2 Beiguan, 3 Huaxian, 4 Linzhou, 5 Longan, 6 Neihuang, 7 Tangyin, 8 Wenfeng, 9 Yindu, 10 Heshan, 11 Xunxian, 12 Qibin, 13 Qixian, 14 Shancheng, 15 Jiyuan, 16 Boai, 17 Jiefang, 18 Macun, 19 Mengzhou, 20 Qinyang, 21 Shanqu, 22 Wenxian, 23 Wuzhi, 24 Xiuwu, 25 Zhongzhan, 26 Gulou, 27 Lankao, 28 Longting, 29 Qixian, 30 Shunhe, 31 Tongxu, 32 Weishi, 33 Xiangfu, 34 Yuwangtai, 35 Chanhe, 36 Jili, 37 Jianxi, 38 Laocheng, 39 Luanchuan, 40 Luolong, 41 Luoning, 42 Mengjin, 43 Ruyang, 44 Songxian, 45 Xigong, 46 Xinan, 47 Yanshi, 48 Yichuan, 49 Yiyang, 50 Linying, 51 Wuyang, 52 Yancheng, 53 Yuanhui, 54 Zhaoling, 55 Dengzhou, 56 Fangcheng, 57 Nanzhao, 58 Neixiang, 59 Sheqi, 60 Tanghe, 61 Tongbai, 62 Wancheng, 63 Wolong, 64 Xixia, 65 Xichuan, 66 Xinye, 67 Zhenping, 68 Baofeng, 69 Jiaxian, 70 Lushan, 71 Ruzhou, 72 Shilong, 73 Weidong, 74 Wugang, 75 Xinhua, 76 Yexian, 77 Zhanhe, 78 Fanxian, 79 Hualong, 80 Nanle, 81 Puyang, 82 Qingfeng, 83 Taiqian, 84 Hubin, 85 Lingbao, 86 Lushi, 87 Mianchi, 88 Xiazhou, 89 Yima, 90 Liangyuan, 91 Minquan, 92 Ningling, 93 Suixian, 94 Suiyang, 95 Xiayi, 96 Yongcheng, 97 Yucheng, 98 Zhecheng, 99 Fengqiu, 100 Fengquan, 101 Hongqi, 102 Huixian, 103 Huojia, 104 Muye, 105 Weibin, 106 Weihui, 107 Xinxiang, 108 Yanjin, 109 Yuanyang, 110 Changyuan, 111 Gushi, 112 Guangshan, 113 Huaibin, 114 Huangchuan, 115 Luoshan, 116 Pingqiao, 117 Shangcheng, 118 Shihe, 119 Xixian, 120 Xinxian, 121 Jianan, 122 Weidu, 123 Xiangcheng, 124 Yanling, 125 Yuzhou, 126 Changge, 127 Dengfeng, 128 Erqi, 129 Gongyi, 130 Guancheng, 131 Huiji, 132 Jinshui, 133 Shangjie, 134 Xinmi, 135 Xinzheng, 136 Xingyang, 137 Zhongmou, 138 Zhongyuan, 139 Chuanhui, 140 Dancheng, 141 Fugou, 142 Huaiyang, 143 Luyi, 144 Shangshui, 145 Shenqiu, 146 Taikang, 147 Xihua, 148 Xiangcheng, 149 Biyang, 150 Pingyu, 151 Queshan, 152 Runan, 153 Shangcai, 154 Suiping, 155 Xiping, 156 Xincai, 157 Yicheng, 158 Zhengyang.
However, compared with the national average, the inefficient ecological utilization of cultivated land and the rapid urbanization process have made the conflicts in Henan Province more prominent. In 2022, the amount of chemical fertilizer applied per 1,000 ha of cultivated land in Henan Province was 0.1,100 tons per 1,000 ha, which was 1.47 times the national average. The usage of pesticides was 92,000 tons, accounting for 7.7% of the national total value. In the same year, the urbanization rate in Henan Province was 57.07%, significantly lower than the national average of 65.22%, and was notably different from the urbanization rates of 74.4% in eastern regions such as Jiangsu Province and 73.4% in Zhejiang Province. However, the growth rate was 1.01%, higher than the national average growth rate of 0.77%. Spatially, the Zhengzhou metropolitan core exhibits metropolitan primacy, while southeastern agricultural zones confront dual challenges of fragmented cultivated landscapes and agro-ecological degradation. Urban-rural factor mobility mechanisms remain underdeveloped, with structural deficiencies such as rural financial and human capital shortages persisting despite incremental urban-to-rural resource flows driven by agricultural scaling. Elucidating the spatiotemporal coupling mechanisms between CLUEE and NTU constitutes a pivotal scientific inquiry for optimizing human-land system coordination in major grain-producing regions and advancing integrated urban-rural sustainable development.
2.2 Research methods
2.2.1 Indicator selection and measurement of CLUEE
2.2.1.1 Indicator selection
Based on the connotation of CLUEE and referring to existing research, this study constructs a scientific, comprehensive and operable evaluation index system from three dimensions of “input–desirable output-undesirable output”. At the input level, three types of resources, namely, land, labor and capital, are selected, covering a total of six indicators: the sown area of crops, the number of employees in the primary industry, the converted pure amount of chemical fertilizer, the input amount of pesticides, the input amount of agricultural films, and the total power of agricultural machinery. The desirable outputs contain three indicators: grain output, total agricultural output value, and disposable income of rural residents. The undesirable outputs are represented by two indicators: carbon emissions and non-point source pollution. The specific indicators are shown in Table 1.
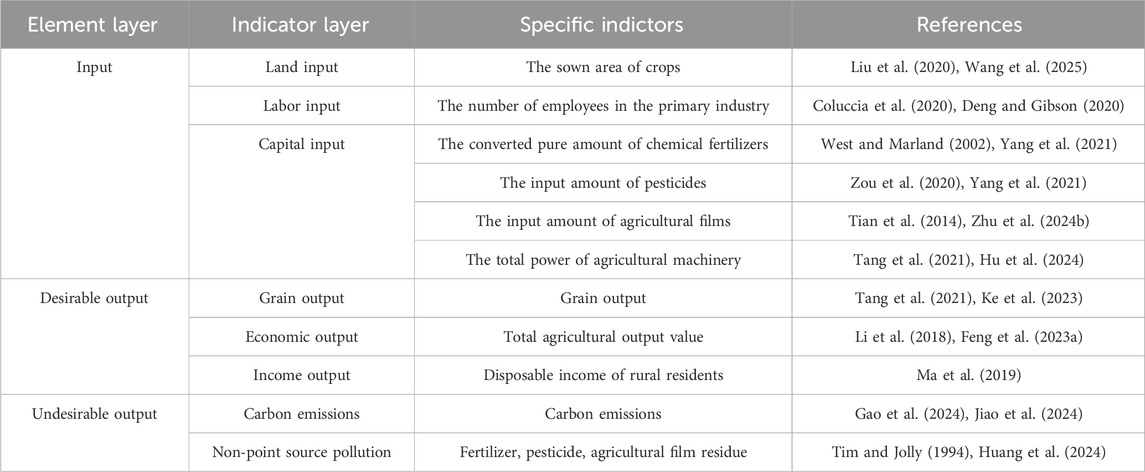
Table 1. The indicator system for evaluating CLUEE.
The calculation formula for carbon emissions during the utilization of cultivated land is E = ΣEi = Σ(Gi × δi), where Ei represents the carbon emission of the i-th carbon source, Gi and δi are respectively the amounts of each carbon source and their carbon emission coefficients. The coefficients are respectively 0.8956 kg/kg for chemical fertilizer, 4.3941 kg/kg for pesticide, 5.18 kg/kg for agricultural film, 0.18 kg/kW for agricultural machinery, 266.48 kg/hm2 for irrigation, and 312.60 kg/km2 for ploughing (Zhu and Huo, 2022).
Non-point source pollution should be considered from three aspects: chemical fertilizers, pesticides and agricultural films. The calculation formula for the residues of chemical fertilizers, pesticides and agricultural films is: Nitrogen loss of chemical fertilizers = (nitrogen content of compound fertilizers + nitrogen fertilizer application amount) × Nitrogen loss coefficient. The loss of phosphorus from chemical fertilizers = (the phosphorus content of compound fertilizers + the amount of phosphorus fertilizer used) × phosphorus loss coefficient; Pesticide loss = pesticide usage amount × pesticide loss coefficient; The residual amount of agricultural film = the amount of agricultural used film × the residual coefficient of agricultural film. The relevant coefficients refer to the “Manual of Fertilizer Loss, Pesticide Loss and Plastic Film Residue Coefficients of the First National Pollution Census”. Based on the natural conditions of Henan Province, the pollution coefficients of cultivated land are finally determined as follows: fertilizer is 0.84%, pesticide is 0.0827%, and agricultural film is 23.25% (Wang et al., 2023a).
2.2.1.2 Super-efficiency SBM model
The super-efficiency SBM model is an improvement of the traditional DEA model. After Andersen et al. proposed the concept of super-efficiency (Andersen and Petersen, 1993), Tone integrated relaxation variables and unintended output indicators to construct the super-efficiency SBM model (Tone, 2002). It corrects the radial deviation of the traditional DEA through relaxation variables, incorporates undesirable outputs to comprehensively evaluate the efficiency, breaks through the limitation that the traditional model cannot distinguish the efficiency value of the effective decision-making unit greater than 1. This model is widely applied in fields such as ecological efficiency, providing a more accurate multi-dimensional analysis tool for the performance evaluation of resources and the environment. The specific calculation formula is as follows (Equation 1):
In the formula: ρ represents the evaluation value of ULUEE; n represents the number of county-level units; m,
2.2.2 Index system and measurement method of NTU
China’s “National New-Type Urbanization Plan (2014–2020)” has established a new-type urbanization strategy with humanistic care and green development as the core concepts, aiming to foster a five-in-one development framework encompassing population, land, economy, society, and ecological construction, and to guide urban development toward higher quality, efficiency, equity, and sustainability (Yuan et al., 2025). Anchored in the essence of NTU, this study develops an index system across five dimensions: population urbanization, spatial urbanization, economic urbanization, social urbanization, and ecological urbanization. Drawing on prior studies and aligning with Henan province’s circumstances, 12 specific indicators within the five NTU dimensions were ultimately chosen (Table 2): Population urbanization emphasizes the core level of population concentration in towns and cities as well as the quality of employment structure transformation during the urbanization process (Wang and Fang, 2025). Therefore, choose the urbanization rate of the resident population and the proportion of employment in secondary and tertiary industries as indicator. Spatial urbanization takes into account the absolute scale of urban expansion and the relative proportion of urbanization space, as well as the assessment of land use intensification (Feng et al., 2022). Therefore, the indicators selected include the built-up area, its proportion, and urban population density. Economic urbanization should reflect the level of regional economic development and the endogenous driving force of economic urbanization (Liu et al., 2025). Therefore, per capita GDP and per capita retail sales of consumer goods are taken as research indicators. Social urbanization focuses on the accessibility of public services, including the allocation of medical and educational resources as well as the wellbeing of the people (Wang et al., 2017). Therefore choose the number of health institution beds and full-time teachers per 10,000 people as well as urban residents’ per capita disposable income as a measure. Ecological urbanization mainly takes into account the quality of the atmospheric environment and the degree of intensive development of land resources, reflecting the demand for sustainable development (Kraemer and Kabisch, 2021). PM2.5 concentration and the area of construction land consumed per unit of GDP are chosen as the measurement criteria.
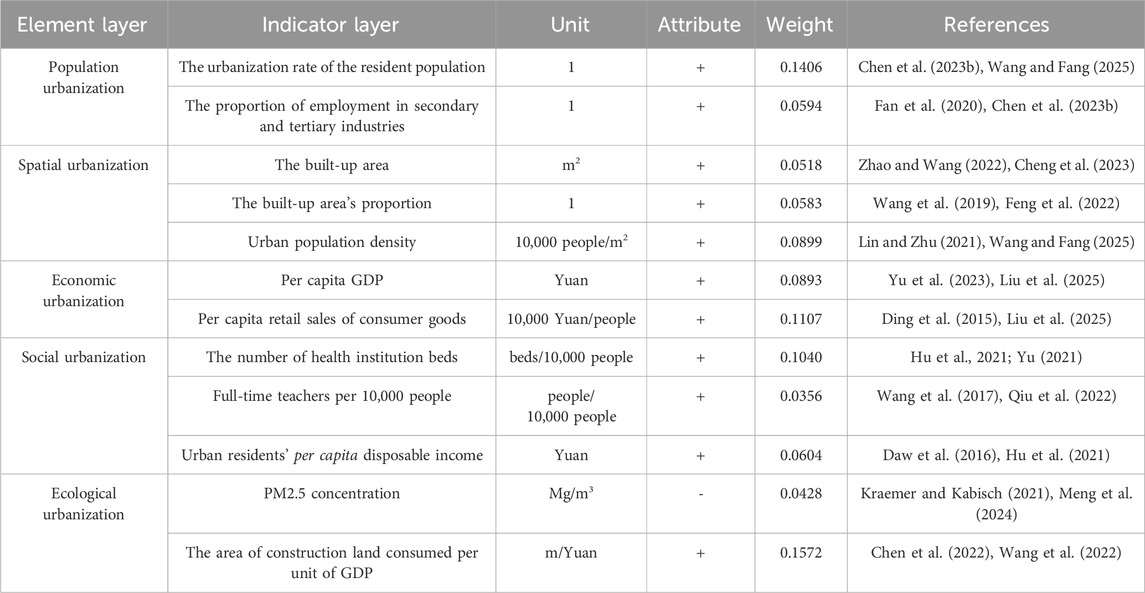
Table 2. The indicator system for evaluating NTU.
This study employs the entropy weight method, which dynamically allocates weight coefficients by quantifying each indicator’s information entropy contribution. This approach effectively mitigates evaluation result biases induced by human subjectivity (Li and Li, 2025). The computational procedure adheres to the following protocol (Li and Li, 2025):
1. Data standardization
For positive indicator (Equation 2):
For negative indicator (Equation 3):
2. Calculate the information entropy of each index (Equations 4, 5)
3. Determine the weights of each indicator (Equation 6)
4. Finally, based on the calculated weight values, a comprehensive evaluation is conducted for each index (Equations 7, 8).
In the formula:
2.2.3 Coupling coordination degree model
The coupling coordination degree model can measure the interaction relationship between the CLUEE and NTU. The formula of the coupling coordination degree model is as follows (Equations 9-11) (Xu et al., 2025):
In the formula:
2.2.4 Spatial autocorrelation model
The Global Moran’s I can reflect the spatial aggregation characteristics of the overall coupling coordination degree of Henan Province. The calculation formula is as follows (Equation 12) (Zhu et al., 2024a):
In the formula:
The spatial aggregation phenomenon in the local area is further analyzed by using clustering and outlier analysis (Anselin Local Moran’s I), and the formula is as follows (Equation 13):
In the formula:
2.2.5 Regional differences
The Theil index is a classic tool for measuring income distribution differences and has also been extended and applied in the field of regional unbalanced development research. Its core value lies in analyzing the overall differences into two dimensions, intra-group differences and inter-group differences, providing key methodological support for analyzing the regional unbalanced development mechanism. The formula is as follows (Equations 14, 15):
In the formula:
2.2.6 Driving mechanism analysis
The coupling coordination degree between CLUEE and NTU is influenced by multidimensional factors. This study selects nine indicators from three categories: natural geographical conditions, agricultural production conditions, and socioeconomic development levels. The selection of indicators across three categories is grounded in their theoretical relevance to influencing the CLUEE-NTU coupling coordination. Natural geographical conditions are measured by altitude, terrain undulation and per capita cultivated land area, mainly taking into account the factors that affect land use suitability, agricultural accessibility and resource endowment pressure. Agricultural production conditions include the power of agricultural machinery per unit area, multiple cropping index, and fiscal expenditure on agriculture, forestry and water conservancy. Among them, the multiple cropping index affects the yield per mu of grain and is an important agricultural production factor for the output efficiency of cultivated land. The power of agricultural machinery and the fiscal expenditure on agriculture, forestry and water conservancy are important components of agricultural production conditions, reflecting key operational capabilities and institutional support mechanisms. Socioeconomic development levels, measured by county-level per capita disposable income, nighttime light index, and local general public budget revenue, capture regional economic vitality, spatial development intensity, and fiscal governance capacity, collectively shaping the broader developmental context for land-use efficiency. The specific indicators are shown in Table 3.

Table 3. Selection of influencing factors.
The geographic detector model, a statistical tool based on spatial heterogeneity decomposition, systematically reveals spatial differentiation patterns and driving mechanisms through four modules: factor detection, interaction detection, risk zone identification, and ecological process analysis. This study applies factor detection to assess the regional-scale influence intensity of determinants on coupling coordination, and interaction detection to examine combined effects between paired factors. The analytical framework follows these formal expressions (Equation 16):
In the formula: h = 1, …, j represents the stratified number of each influencing factor;
In this study, the geographically weighted regression model (GWR) was employed to establish local regression equations at each point within the study area, and the intensity and direction of the influencing factors at the local scale were analyzed. The formula is as follows (Equation 17):
In the formula:
2.3 Data sources
The statistical data of this study mainly come from the Henan Statistical Yearbook (2002–2022), and are supplemented with relevant data from the statistical yearbooks of each city (2002–2022) and the government bulletins of each city in Henan Province. The missing values are estimated and supplemented by methods such as interpolation. The GIS data is the annual land cover data of China with a resolution of 30 m from 1985 to 2023 (Yang and Huang, 2021), processed by ArcMap10.8. Elevation data were selected from the Center for Resources and Environmental Sciences and Data Center, Chinese Academy of Sciences (https://www.resdc.cn/). Relief data from China relief degrees km grid data set (https://geodoi.ac.cn/WebCn/doi.aspx?Id=887) (Zhen et al., 2018), Night lights index data from China lights at night long time series data set (2000–2020), and the data for 2022 is missing. In this study, the data from 2020 is used as an approximate substitute (Chen et al., 2021b) (https://www.geodoi.ac.cn/doi.aspx?DOI=10.3974/geodb.2022.06.01.V1). PM2.5 data to choose the high resolution quality PM2.5 data set (2000–2023) (Wei and Li, 2023) (https://data.tpdc.ac.cn/zh-hans/data/6168e75d-93ab-4e4a-b7ff-33152e49d0bf). Based on the above data, this study determined to conduct the analysis at an interval of 4 years from 2002 to 2022. It was finally determined to conduct the research based on the data of the 6 years 2002, 2006, 2010, 2014, 2018 and 2022.
3 Results
3.1 The spatiotemporal evolution of CLUEE and NTU
3.1.1 Analysis of CLUEE
From 2002 to 2022, there was a significant increase in CLUEE across Henan province, rising from 0.09 in 2002 to 0.47 in 2022, which corresponds to an average annual growth rate of 95.06% (Figure 2a). Among them, the northern and southern parts of Henan Province remained consistently above the provincial average, while the rest of the regions fluctuated. The eastern part of Henan Province was significantly lower than the average.
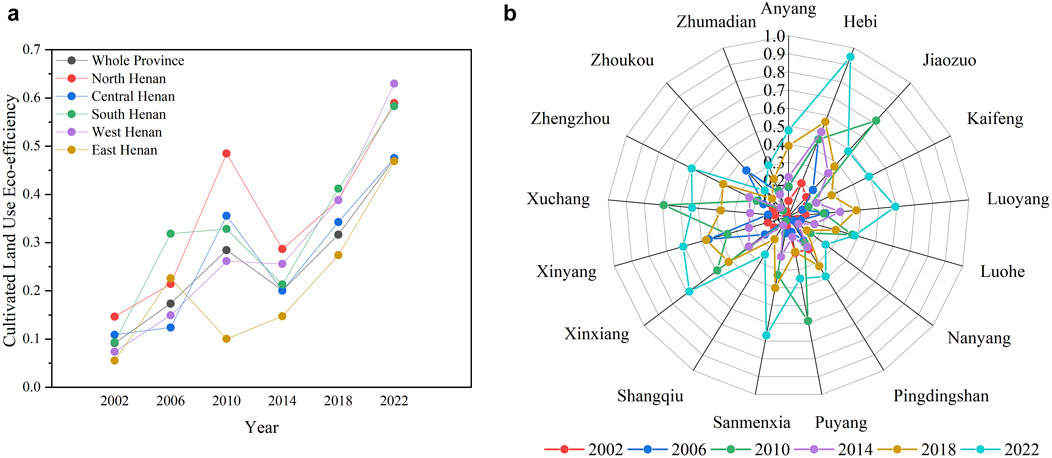
Figure 2. The temporal evolution of CULEE at provincial and municipal scales. (a) The temporal evolution of CLUEE of Henan; (b) The temporal evolution of CLUEE in cities of Henan
In terms of the changes in CLUEE across different cities within the province1, most cities in Henan province demonstrated a consistent annual upward trend in CLUEE (Figure 2b). Among them, the peak CLUEE in Jiaozuo City, Puyang City, and Xuchang City was recorded in 2010, while Zhoukou City reached its highest CLUEE in 2006. Among the 17 cities surveyed in this study, Hebi City exhibited the highest CLUEE, surpassing 0.95 in 2022. Regarding the growth rate, Hebi City ranked first with an average annual growth rate of 98.49%. This achievement can be attributed to the synergistic effects of institutional innovation and technological empowerment. However, Puyang City had a relatively low average annual growth rate of only 90.34%, which might be due to the prominent conflict between ecological protection and agricultural land utilization. This city is extensively covered by wetlands and grasslands, with wetlands accounting for approximately 20% of the province’s total wetland area, and the delineation of ecological red lines has constrained the space for intensification, thereby indirectly impacting the improvement of CLUEE. Ecological Conservation Redlines structurally constrain cultivated land eco-efficiency within designated areas. Stringent restrictions on chemical inputs and high-water-consumption irrigation undermine intensive production, potentially reducing short-term yield per unit area. Concurrently, incorporating cropland into ECRs for ecological restoration fragments remaining farmland, impeding large-scale mechanization, diminishing economies of scale, and raising management costs. These mechanisms hinder maximizing agricultural output per resource-environmental unit a core eco-efficiency objective representing a deliberate trade-off for higher-order ecosystem services and long-term regional ecological sustainability.
The distribution characteristics of CLUEE at the county scale are hierarchically displayed (Figure 3). The spatial pattern of CLUEE in Henan province from 2002 to 2022 shows significant differentiation and dynamic evolution. In 2022, the high-value areas were mainly concentrated in the central plains of Henan Province, the Yellow River Basin in northern Henan, and Xin County, Guangshan County and Puyang County in southern Henan.
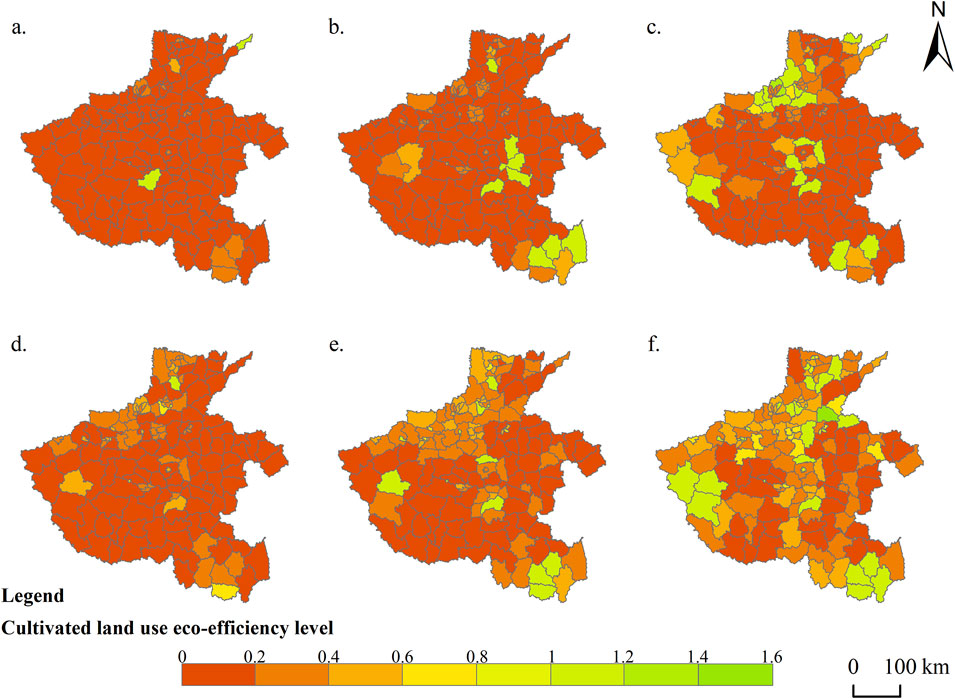
Figure 3. Spatiotemporal evolution of CULEE at county scale.
From the perspective of temporal changes, from 2002 to 2014, the high-efficiency area expanded from a point-like distribution to the surrounding areas of Zhengzhou and the Huanghuai Plain, while the scope of the low-efficiency area gradually narrowed but the spatial lock-in effect was significant. After 2014, with the strengthening of ecological protection policies and technological progress, the trend of contigualization of high-efficiency zones has intensified, and the high-efficiency zones in the central Henan Plain and the Huanghuai Plain have shown a trend of interconnection. Some counties in Xinyang, southern Henan Province, have achieved a significant increase in CLUEE from 0.3 to over 1 through the transformation of characteristic ecological agriculture. However, the mountainous areas in western Henan have seen limited improvement due to natural conditions and remain low-value depressions. Overall, the spatial differentiation of CLUEE presents a “core-periphery” structure, and the regio0nal balance is gradually improving driven by policies and technologies. However, the differences in natural endowments remain the key bottleneck restricting the transformation of low-value areas. This stems from natural endowment disparities fundamentally constraining energy and material transformation in cultivated land use, which dictates regional photosynthetic productivity and resource-environmental carrying capacity. These inherent limitations cap ecologically achievable efficiency ceilings, forcing regions toward unequal output under equal inputs or elevated ecological trade-offs for production stability—ultimately restricting cross-regional efficiency gains.
3.1.2 Analysis of NTU
During the research period, the NTU level of the entire Henan Province continued to rise, from 0.15 in 2002 to 0.32 in 2022, with an average annual growth rate of 91.00% (Figure 4). All regions showed an increasing trend consistent with the provincial average. Among them, except for northern Henan, the rest of the regions were all higher than the provincial average. This growth trajectory can be segmented into three distinct phases based on varying growth rates. Between 2002 and 2006, the NTU level grew slowly, with an average annual growth rate of 22.51%. During this initial phase, the urbanization policy framework and infrastructure support systems were still in their nascent stages of development. The capacity to absorb the rural labor force into urban areas was relatively limited. In conjunction with the low efficiency of resource allocation under conventional development paradigms, these factors resulted in insufficient momentum to elevate the NTU level. From 2006 to 2018, the NTU level entered a phase of accelerated growth, achieving an average annual growth rate of 71.27%. This substantial increase can be attributed to robust policy initiatives promoting the coordinated development of industrialization, urbanization, and agricultural modernization. These efforts led to a rapid expansion of the urban economy, generating a significant number of non-agricultural employment opportunities and facilitating the swift transfer of rural labor to urban centers. Between 2018 and 2022, the growth of the NTU level decelerated, with an average annual growth rate of 28.63%. As urbanization progressed and the economic base expanded, the marginal growth effect diminished. Additionally, intensifying resource and environmental constraints, the growing conflict between ecological preservation and urban sprawl, and the heightened demand for intensive land use collectively constrained the traditional extensive development model.
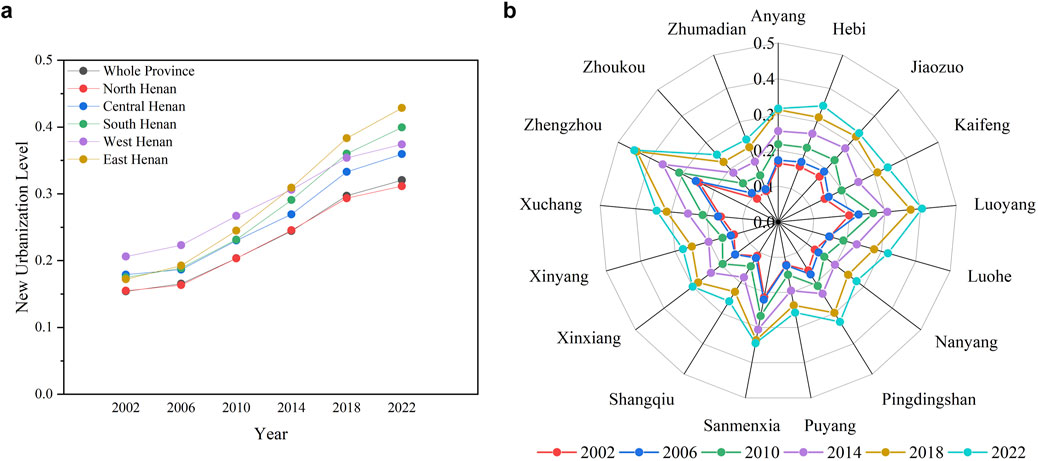
Figure 4. The temporal evolution of NTU at provincial and municipal scales. (a) The temporal evolution of NTU of Henan. (b) The temporal evolution of NTU in cities of Henan.
From the perspective of municipal regions, the NTU of all cities in the province have shown a consistent upward trend. Among the six time points analyzed in this study, Zhumadian City exhibits the lowest NTU. This is primarily due to the high proportion of traditional agriculture in the local economy and the lack of substantial support from competitive industries and specialized economic sectors. Consequently, its average annual NTU level is only 0.16. In contrast, Zhengzhou City displays the highest NTU level, reaching a peak of 0.45 in 2022 and maintaining an average annual level of 0.34. However, the average annual growth rate of the NTU level in Zhengzhou City is 91.95%. Sanmenxia City, on the other hand, has the lowest average annual growth rate of the NTU level at 89.86%. Sanmenxia’s chronically low urbanization growth stems from structural constraints: severe mountainous terrain, depleted resource industries, population decline.
The NTU level in Henan province exhibits marked spatial differentiation. In 2022, high-value clusters were primarily located in the Zhengzhou-centered metropolitan region and the central plains of Henan, covering cities like Zhengzhou, Luoyang, and Xuchang. Leveraging the economic influence of the provincial capital, transportation hub advantages, and industrial agglomeration effects, these areas constitute contiguous high-value core zones. Low-value clusters were mainly found in counties along the Funiu Mountains in western Henan and the Taihang Mountains in northern Henan, such as Anyang County and Neihuang County. Most of these areas’ urbanization levels remained at a “relatively low” tier. Hindered by topography, weak industrial foundations, and population outflow, their urbanization was inadequate, showing a peripheral characteristic.
From 2002 to 2022, the high-value areas of urbanization in Henan province presented an evolution trend of “core strengthening-peripheral diffusion” (Figure 5). In 2002, the high-value areas were only sporadically distributed in the main urban areas of Zhengzhou and Luoyang. By 2010, under the promotion of the Zhengzhou-Kaifeng integration policy, the peripheral areas such as Kaifeng and Xinzheng gradually integrated into high-value clusters. After 2014, the implementation of the Central Plains Urban Agglomeration planning has prompted the high-value areas to expand in a gradient manner along the Beijing-Guangzhou and Longhai transportation axes towards Xuchang, Jiaozuo and other directions. The low-value areas have undergone a process of “scale reduction-local leap”. The vast majority of counties have achieved a leap from the “lowest level” to the “lower level” driven by agricultural industrialization and labor economy, but the spatial lock-in effect is still significant. The overall manifestation is the dynamic evolution characteristics of “multi-pole synergy and gradient equilibrium”.
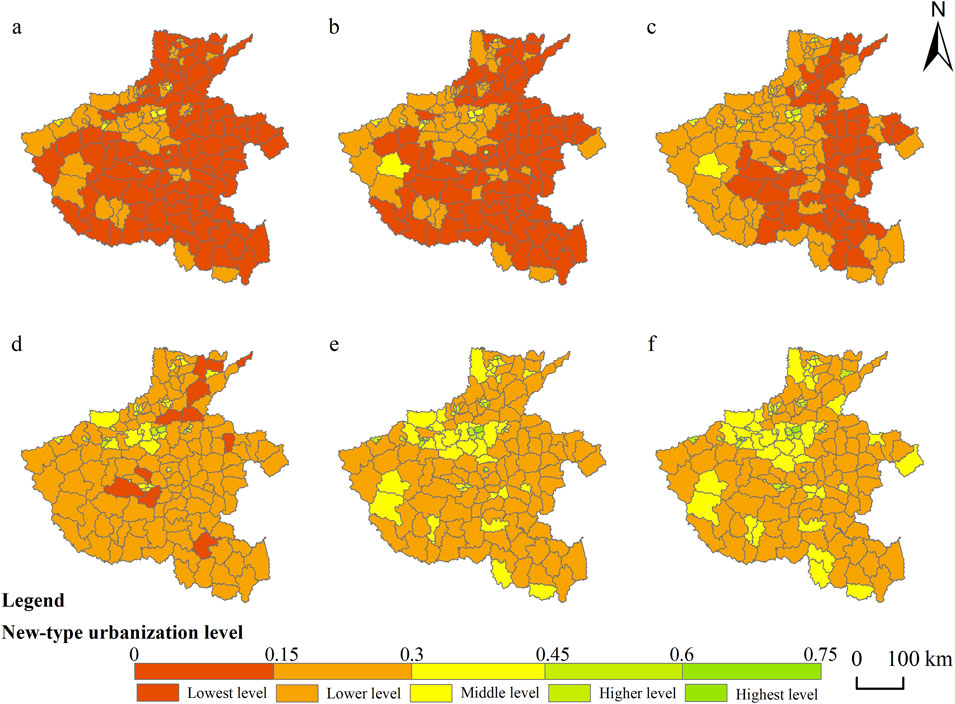
Figure 5. Spatiotemporal evolution of NTU at county scale. (a) 2002. (b) 2006. (c) 2010. (d) 2014. (e) 2018. (f) 2022.
3.2 Coupling coordination characteristics of CLUEE and NTU
3.2.1 Overall characteristics
From a provincial perspective, from 2002 to 2022, the average annual coupling degree between CLUEE and NTU has continuously increased from 0.31 to 0.59 (Figure 6). All regions tend to be coordinated, among which the coordination status of southern Henan is better than that of other regions, and the coupling coordination degree of regional divisions is higher than the overall coordination degree of the entire province. According to the growth rate, it is divided into three stages. The rapid growth period from 2002 to 2010, with an average annual growth rate of 74.28%. During this stage, NTU was in its infancy. The demand for cultivated land resources was mainly incremental expansion, and the disturbance to the cultivated land ecosystem was relatively small. The two formed a preliminary coordination in resource allocation and space utilization, promoting a rapid increase in the coupling degree. During the growth stagnation period from 2010 to 2014, the average annual growth rate was 20.95%. With the acceleration of NTU, the contradiction between urban space expansion and cultivated land protection became prominent. The rapid advancement of urbanization led to a reduction in the quantity and quality of cultivated land, and the improvement of CLUEE was hindered due to the increased resource pressure. During the period of rapid growth from 2014 to 2022, the average annual growth rate was 76.33%. Thanks to the transformation of development concepts and policy optimization, NTU has shifted towards connotative development, paying more attention to quality improvement and ecological protection. The two have formed a virtuous interaction in resource conservation, ecological protection and functional complementarity. The coordination mechanism has been continuously improved, promoting a significant increase in the coupling degree and achieving the coordinated development of CLUEE and NTU at a higher level.
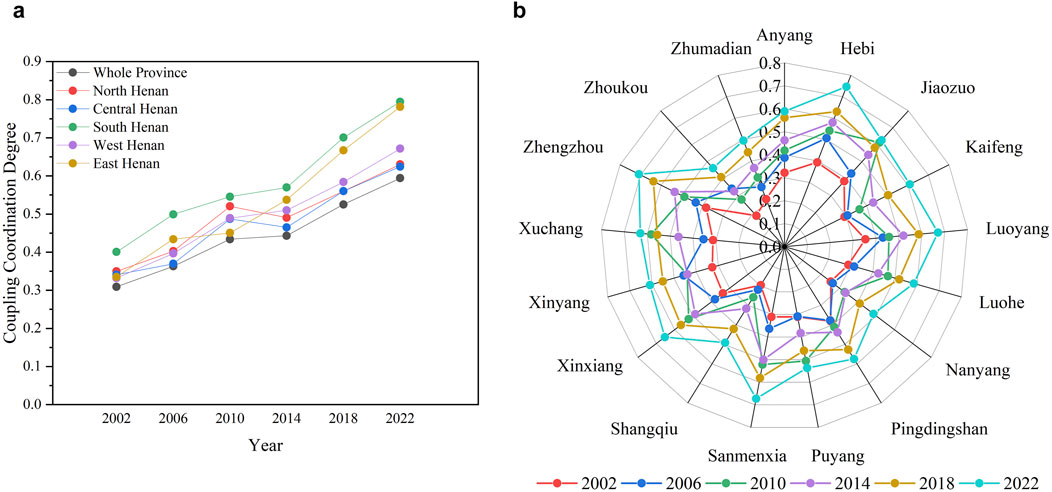
Figure 6. The temporal evolution of coupling coordination degree level at provincial and municipal scales. (a) The temporal evolution of coupling coordination degree level of Henan. (b) The temporal evolution of coupling coordination degree level in cities of Henan.
The coupling coordination degree of each city in Henan Province shows significant differences, and the differentiation between core cities and peripheral areas is obvious. From 2002 to 2022, the coupling coordination degree of Hebi City was at the highest level in the province, with an average annual level of 0.57. As a national ecological garden city in 2017, Hebi adheres to the concept of “ecological priority and integration of industry and city”, and the degree of mutual influence between the NTU level and cultivated land utilization is significantly higher than that of other cities. As the polar core of regional development, Zhengzhou City has a coupling and coordination degree at the second. The interaction efficiency and balance of its economic, social and environmental systems are significantly better than those of other cities, demonstrating the synergy effect of high-intensity resource integration and policy-driven. Cities with a relatively strong industrial foundation such as Luoyang and Jiaozuo follow. The degree of coordination remains within the transitional range from discoordination to coordination, supported by the optimization of industrial structure and technological innovation. Four cities, namely, Shangqiu City, Zhoukou City, Nanyang City and Zhumadian City, are within the range of mild discoordination. The lowest is Shangqiu City, with an average annual coupling coordination degree of only 0.32.
The spatial distribution of the coupling coordination degree in Henan province was analyzed at the county scale (Figure 7). In 2022, the coupling coordination degree of CLUEE and NTU in Henan province exhibited marked spatial imbalance. High-quality coordinated and above-level agglomeration areas (0.8–1.0) were primarily clustered in the Zhengzhou Metropolitan Area and the core region of the central Henan Plain, encompassing cities such as Zhengzhou, Xuchang, and Jiaozuo. These regions demonstrated exceptional levels of cultivated land intensive utilization and urbanization coordinated development, as evidenced by the adoption of eco-friendly agricultural technologies, efficient urban-rural factor flows, and the policy-guided optimization of composite systems. In contrast, areas with near-disharmony and below (0–0.3) were predominantly located in the Funiu Mountain region of western Henan, the Dabie Mountain hinterland of southern Henan, and the eastern Henan Yellow River Floodplain fringe. Owing to fragmented terrain, ecological vulnerability, and lagging urbanization, these areas contended with extensive cultivated land utilization and urban-rural system disconnect, resulting in prolonged low-lying coupling coordination degrees.
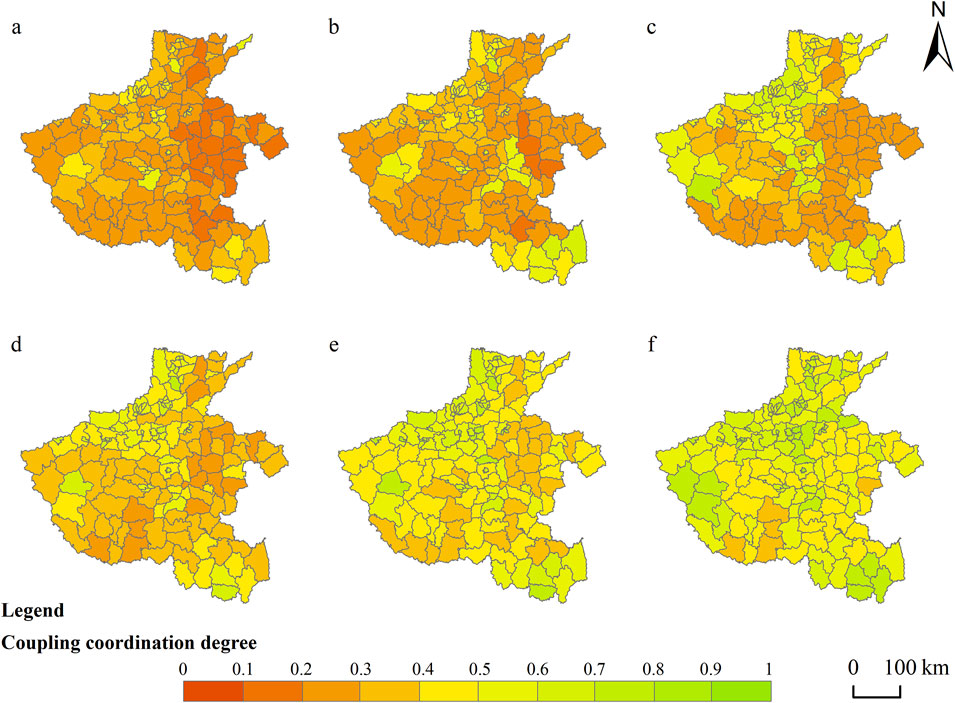
Figure 7. Spatiotemporal evolution of coupling coordination degree at county scale. (a) 2002. (b) 2006. (c) 2010. (d) 2014. (e) 2018. (f) 2022.
From 2002 to 2022, the spatial pattern of the coupling coordination degree revealed evolution characteristics of “core polarization-axis extension-local transition”. Between 2002 and 2010, the high-value area was largely confined to a single core in Zhengzhou, while the low-value area encompassed over 60% of the province’s counties. After 2010, the implementation of the Central Plains Economic Zone strategy facilitated the expansion of high-value areas along the Beijing-Guangzhou and Longhai development axes towards secondary central cities like Xuchang and Luoyang, forming a “T-shaped” highly coordinated corridor. Since 2018, peripheral cities in northern Henan, such as Hebi, and in southern Henan, such as Xinyang, have seen their coordination levels rise from low to medium through the construction of ecological agricultural demonstration zones and industry-city integration pilot projects. However, in the western Henan mountainous areas and some traditional agricultural regions, low-value lock-in effects remained pronounced due to path dependence and ecological constraints, with the regional differentiation pattern persisting. Overall, the coordination degree evolution displayed strong spatial coupling with NTU policy orientation, transportation network expansion, and ecological red line control.
3.2.2 Regional differences
Table 4 presents the Theil index of the coupling coordination degree of CLUEE and NTU in Henan province. Overall, both the overall difference and the intra-group difference in the province show a downward trend, indicating further coordination between cultivated land utilization and urbanization. Although from 2002 to 2006, the overall difference increased from 0.055 to a peak of 0.060, and the intra-group difference rose from 0.031 to a peak of 0.040, both continued to decline afterward until 2022, with the overall difference dropping to 0.026 and the intra-group difference to 0.017, both decreasing by approximately 50%.
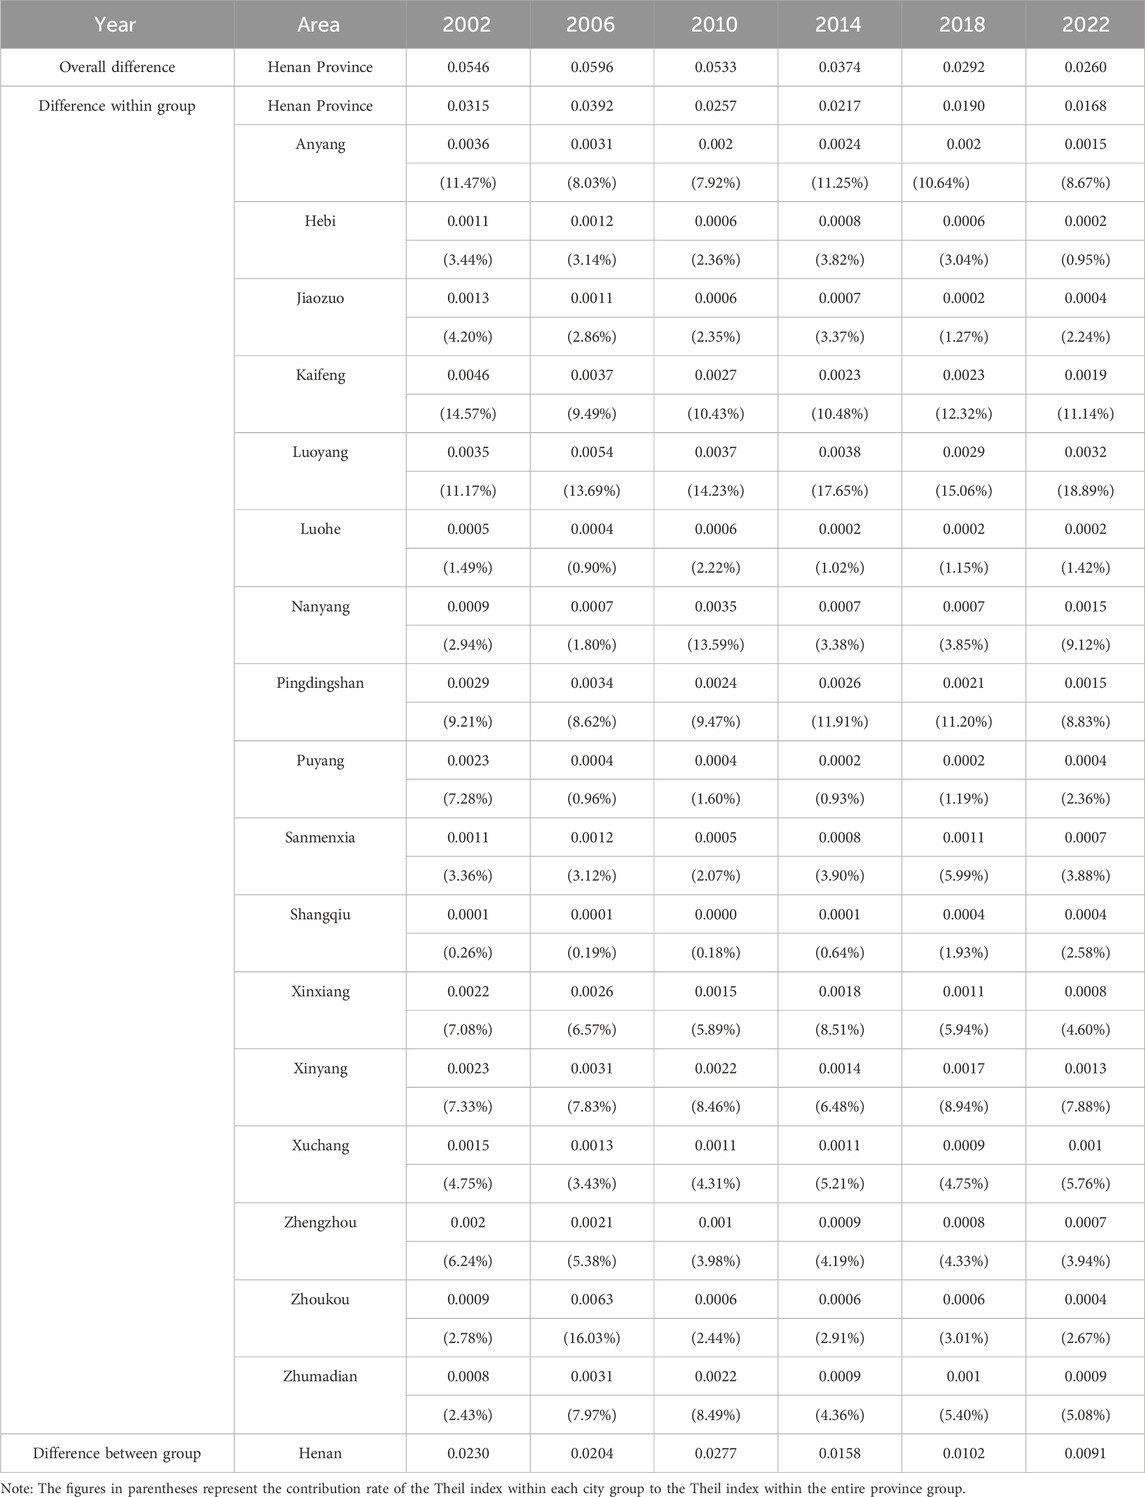
Table 4. The Theil index of coupling coordination degree of CLUEE and NTU in Henan.
There are significant spatial differences in the intra-group differences of the coupling coordination degree of CLUEE and NTU across cities in Henan Province. In Luoyang City, the contribution rate of differences rose from 11.17% in 2002 to 18.89% in 2022, making it a typical area with increasing internal differences within the province. The main issue arises from the coordination dilemma between industrial transformation and ecological protection. In 2006, Zhoukou City’s differential contribution rate suddenly jumped to 16.03%, but later gradually fell back to 2.67%, reflecting adaptive policy adjustments after a short-term shock. In contrast, Zhengzhou City’s differential contribution rate dropped from 6.24% to 3.94%, and that of medium and small-sized cities such as Hebi and Luohe remained below 5% for a long time. This indicates that the enhanced synergy effect of core cities and the intensive development of specialized industries have effectively alleviated internal imbalances. Shangqiu City had the lowest intra-group difference, remaining stable below 0.0004, with a contribution of less than 3%. As a transportation hub located at the junction of Henan, Shandong, Jiangsu, and Anhui provinces, the coupling of cultivated land utilization and urbanization in each county and district of Shangqiu City is highly consistent, and regional development is relatively balanced. Although overall differences have narrowed, contradictions still exist between development path dependence and ecological economy in some local areas, causing significant fluctuations in the contribution rate of the coupling degree.
3.2.3 Spatial autocorrelations
The Moran’s I index of the coupling coordination degree of CLUEE and NTU in Henan province was calculated using ArcGIS 10.6. The results were all greater than 0, indicating a clustering pattern. Additionally, they were significant at the 1% significance level, indicating that the coupling coordination degree of the two shows a significant positive spatial correlation (Table 5). From 2002 to 2014, the spatial agglomeration degree of the two continued to increase. Since then, with the decrease of Moran’s I, it indicates that the spatial agglomeration degree has decreased.
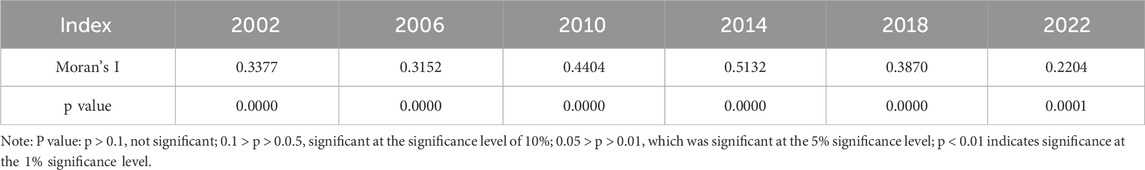
Table 5. The Moran’I of coupling coordination degree of CLUEE and NTU in Henan.
From the county-level scale, the coupling and coordination degree of CLUEE and NTU in Henan Province based on Anselin Local Moran’s I was analyzed. Its spatial agglomeration pattern shows the phased characteristics of “core polarization - peripheral heterogeneity” (Figure 8). In 2002, high-high agglomeration zones were scattered in Zhengzhou’s main urban area and some regions north of the Yellow River, while low-low agglomeration areas were concentrated in eastern Henan’s vast plain area, reflecting the early-stage effects of provincial capital polarization and ecological constraints. By 2018, the high-high agglomeration zone expanded along the Beijing-Guangzhou and Longhai axes to secondary cities like Xuchang and Jiaozuo, forming an “inverted L-shaped” high-value corridor. Although the low-low agglomeration area’s scope shrank, it remained locked in eastern Henan’s plain region and also expanded in southwestern Henan. In 2022, high-high agglomeration areas started contracting towards the Zhengzhou Metropolitan Area, and the low-low agglomeration areas in southwestern and eastern Henan also showed a shrinking trend.
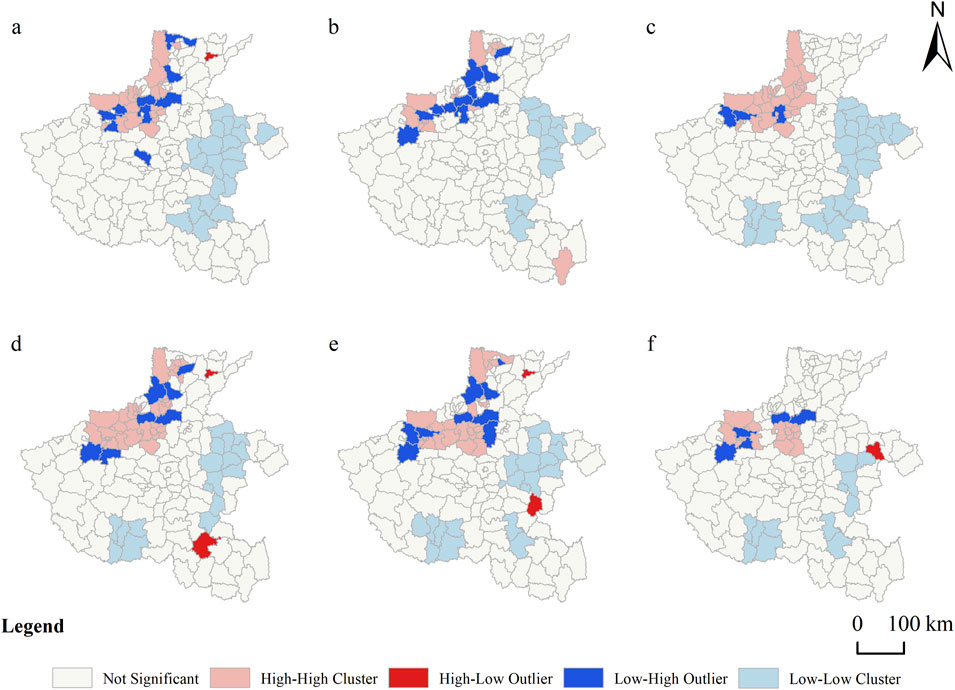
Figure 8. County-level agglomeration distribution map of coupling coordination degree of CLUEE and NTU in Henan. (a) 2002. (b) 2006. (c) 2010. (d) 2014. (e) 2018. (f) 2022.
3.3 Multi-scale influence mechanism of CLUEE and NTU
3.3.1 Global scale analysis
Geographical detectors were used to analyze nine influencing factors of CLUEE and NTU, with a focus on single-factor and interaction detection results.
3.3.1.1 Single-factor detection
Except for the agricultural machinery power per unit area, which failed the significance test, local general public budget revenue was significant at the 5% level in 2006 and 2010. Other factors had P-values below 0.01, showing robust significance (Table 6). Based on q value analysis, the county-level per capita disposable income had the strongest influence, peaking at 0.62 in 2014. Its core impact stems from driving urban-rural factor flows and consumption upgrading. High disposable income enhances farmers’ capacity to adopt eco-friendly technologies and drives urban service industry expansion via consumption, promoting industry-city integration. Per capita cultivated land area’s influence reflects resource endowment’s “scale effect”, while the nighttime light index directly maps economic activity intensity to coordination degree. Industrialization and service industry clustering promote spatial matching of cultivated land utilization and urbanization through technology spillover and employment absorption. Except for agricultural machinery power per unit area, local general public budget revenue had the weakest influence. Elevation, terrain ruggedness, and multiple cropping index had q-values below 0.2, showing significantly weaker effects than other factors.

Table 6. Single-factor detection of influencing factors of CLUEE and NTU in Henan.
From 2002 to 2022, the influencing factors exhibited marked interannual fluctuations. The dominant factor, per capita disposable income, peaked at 0.6188 in 2014, then declined to 0.4384 in 2022. Per capita cultivated land area and nighttime light index reached peak q-values from 2014 to 2018, indicating diminishing resource intensification and economic activity effects on coordination degree during the 14th Five-Year Plan period. Local general public budget revenue’s overall influence was relatively weak, with only a brief significant increase in 2022, revealing insufficient fiscal input targeting and sustainability. Terrain and natural factors had generally low and highly fluctuating q-values, reflecting the gradual weakening of topographic constraints in plain areas.
3.3.1.2 Interactive detection
An interaction detection and analysis of the nine influencing factors was conducted (Figure 9). With the exception of the agricultural machinery power per unit area, which did not pass the significance test, the interaction intensity of the remaining factors exhibited clear patterns. The local general public budget revenue demonstrates nonlinear enhancement characteristics, and the average interaction intensity between this factor and others is 2.8 times that of single-factor effects. Due to its inherently strong effect, the county-level per capita disposable income showed no significant change after interaction. Notably, in 2002, 2018, and 2022, the interaction effect intensity of this factor slightly decreased.

Figure 9. Interactive detection of influencing factors for CLUEE and NTU in Henan. (a) 2002. (b) 2006. (c) 2010. (d) 2014. (e) 2018. (f) 2022.
In the temporal dimension, the evolution of interaction-dominant factor combinations reveals a ternary driving logic of “institution-technology-resource”: In 2002, the dominant interaction was between the county-level per capita disposable income and local general public budget revenue, reflecting an initial “investment-driven” growth model. In 2006, compared to the previous year, the influence of various factors decreased, with the strongest interaction shifting to the multiple cropping index and county-level per capita disposable income, indicating a slight increase in natural resource influence. In 2010, the interaction between the nighttime light index and the multiple cropping index peaked, reflecting the trend of synergy between economic and natural factors during the coupling and coordination process. In 2014, the combined effect of the county-level per capita disposable income and local general public budget revenue once again became dominant, with urban economy influence surpassing that of natural factors. By 2022, the synergy between the fiscal expenditure on agriculture, forestry, and water conservancy and the multiple cropping index was the strongest. These phased shifts essentially result from the dynamic adaptation of regional development policies to resource and environmental carrying capacity.
3.3.2 Local scale analysis
The geographically weighted regression model was used to analyze each factor affecting the coupling coordination degree of CLUEE and NTU in Henan Province (Table 7). The adjusted R2 was all greater than 0.5, and the fitting effect was good. The conditional index is distributed within the range of −136.8879 to 354.5083, verifying the reliability of the factor detection results. The regression coefficients of each explanatory variable all show significant spatial non-stationarity, and their action directions and intensities present differentiated patterns with different geographical units. When compared with the OLS model, both the R2 and Adj-R2 of the GWR model are significantly larger, indicating that using GWR for regional scale analysis is more credible.
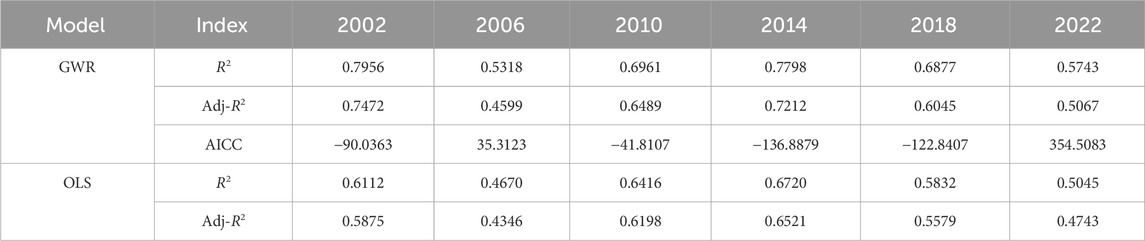
Table 7. GWR model parameters.
The GWR regression coefficients were visualized via ArcGIS 10.6, and the spatial changes in the GWR regression coefficients of nine influencing factors at the county scale in 2002 and 2022 were compared (Figures 10, 11).
1. Elevation: The impact of elevation on the coupling coordination of CLUEE and NTU strengthened significantly from 2002 to 2022. The average regression coefficient per county rose about 4.7 times, from −0.09 to 0.33, reflecting intensified topographical constraints. Spatially, in 2002, from the northwest to the southeast of Henan Province, there was a transformation from a strong inhibitory effect to a strong promoting effect, among which the strongest promoting area was concentrated in Zhoukou City. By 2022, this shifted to a strong inhibitory and promotional gradient from southwest to northeast, forming a band-like pattern. This differentiation reflects the dynamic interplay between natural constraints and human interventions.
2. Terrain ruggedness: It induces systemic optimization through spatial constraints, mandating compact urban layouts and vertically stratified agricultural configurations that suppress inefficient sprawl while enhancing ecological efficiency via gradient-based resource layering, thereby achieving land intensification. The influence of terrain undulation on coupling coordination showed a polarizing trend of “strengthening negative effects and weakening positive effects” from 2002 to 2022. The average regression coefficient per county dropped the most among the nine factors, from 0.21 to −0.34. Specifically, in 2002, a strong promotion-strong inhibition spatial divide existed from west to east, with western Henan’s mountainous areas most positively affected. By 2022, the distribution shifted to a south-north strong promotion-strong inhibition pattern, where northern plains faced the strongest inhibition, while southern Henan’s hilly areas were mildly positively driven.
3. Per capita cultivated land area: From 2002 to 2022, per capita cultivated land area consistently dampened system coordination. Larger per capita cultivated area promotes extensive land management, diminishing marginal ecological returns per input unit and disincentivizing intensive practices vital for ecological efficiency. Simultaneously, abundant land availability reduces compact urbanization imperatives, dispersing populations and economic activities while weakening industrial agglomeration economies. Spatially, negative inhibition intensity weakened, and spatial polarization diminished. In 2002, southern Henan’s hilly areas were the strongest negative inhibition zones, with Xinxiang City in northern Henan the weakest, forming a roughly ring-shaped inhibitory gradient. By 2022, centered on Zhoukou and Zhumadian Cities, western negative impacts gradually intensified.
4. Agricultural machinery power per unit area: Although the total dynamic effect of agricultural machinery per plot did not pass the significance test, its spatial intensity shifts revealed a pattern. The distribution evolved from a weak enhancement-strong inhibition northwest-southeast gradient in 2002 to a strong promotion-weak inhibition northeast-southwest pattern in 2022, with positively increasing effect intensity.
5. Multiple cropping index: In 2002, the positive impact zone of the multiple cropping index was significantly larger than the negative impact area. Central Henan Province, with Xuchang City as the core, initially experienced a positive impact that gradually transitioned into a negative impact as it spread outward. However, by 2022, the entire province exhibited a negative driving effect, with the negative impact becoming more pronounced. This shift from net positive to pervasive negative influence stems from diminishing ecological returns from intensified cultivation, whereby prolonged multi-cropping progressively degraded soil structure, depleted groundwater, and increased agrochemical dependency, thereby undermining the ecological foundation for synergistic CLUEE-NTU coordination. The consistently strongest negative impact north of the Yellow River reflects regionally entrenched agricultural overexploitation exceeding local ecological thresholds, while the southward attenuation corresponds to greater non-agricultural diversification reducing cropland pressure.
6. Fiscal expenditure on agriculture, forestry, and water conservancy: From 2002 to 2022, the trend of expenditure on agriculture, forestry, and water conservancy affairs was similar to the overall intensity change of the multiple cropping index, but spatial variations differed. In 2002, Henan province showed a transition from negative to positive impact from west to east, with the strongest positive impact observed in Xinyang City, Puyang City, and Shangqiu City. With the demarcation of ecological red lines and the implementation of farmland-to-forest programs, by 2022, only the western mountainous regions of the province exhibited a weak positive impact, while the rest of the regions showed a gradually strengthening negative trend from west to east. Funds were prioritized for soil and water conservation and forest and grassland restoration. The crowdfunding effect of ecological protection expenditures intensified the competition for funds between urbanization and agricultural development, thereby restricting the optimal allocation and functional coordination of industrial elements between urban and rural areas.
7. County-level per capita disposable income: From 2002 to 2022, per capita disposable income in counties was the factor with a positive driving effect among all influencing factors in this study, although the intensity of the effect weakened. Over time, the marginal effect of income on the system coordination degree gradually diminished. Spatially, in 2002, the intensity of influence showed a gradual weakening trend from southeast to northwest. By 2022, the trend reversed, showing a gradual weakening from northwest to southeast.
8. Nighttime light index: It’s positive impact area progressively contracted from 2002 to 2022. Initially radiating weakening positive effects from cores like Puyang and Xinxiang, it shifted to negative impacts province-wide by 2022, with promotion intensity diminishing southeast-northwest. This reversal stems from early-stage urbanization initially boosting CLUEE-NTU coordination through agricultural intensification near cities, whereas prolonged light exposure later disrupted ecological cycles and fragmented peri-urban farmland. The spatial gradient reflects advanced southeastern regions surpassing an urbanization threshold where light pollution and land competition degraded synergy, while northwestern areas showed transitional development with declining marginal coordination returns from lighting expansion.
9. Local general public budget revenue: Local general public budget revenue continues to exhibit a negative weakening effect. Local fiscal revenue prioritization of short-term urban-industrial expansion accelerates peri-urban farmland conversion while diverting resources from agricultural ecological modernization. This fiscal-driven development creates spatial competition through urban sprawl, fragmenting agricultural landscapes and eroding the ecological integrity underpinning CLUEE. Numerically, the influence intensity of this factor does not change significantly. However, spatially, it gradually strengthened from the mountainous area in western Henan to the periphery in 2002. In 2022, it gradually strengthened from the hilly area in southern Henan to the north. In 2022, it gradually strengthened from the hilly area in southern Henan to the north.
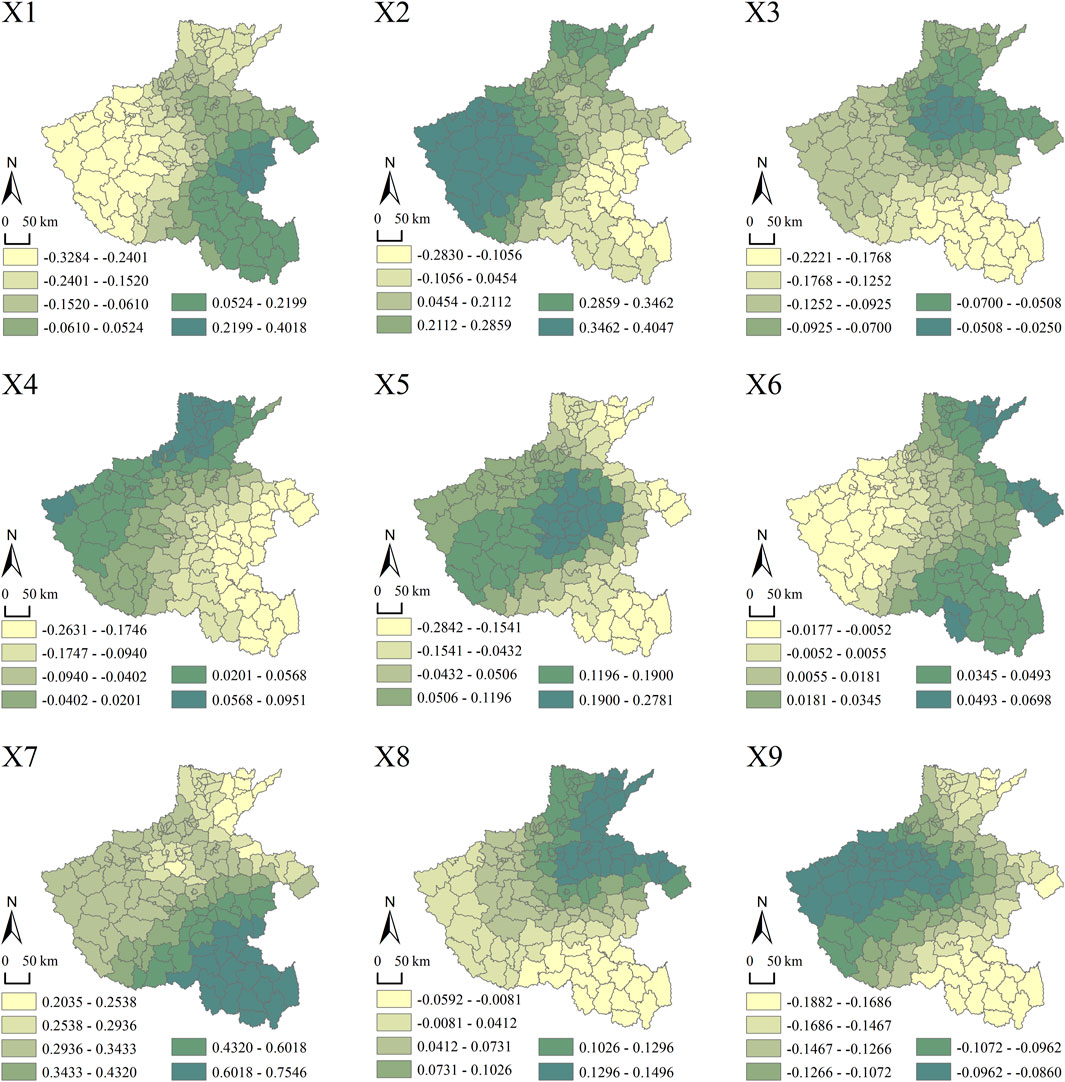
Figure 10. Regression coefficients of GWR model in Henan in 2002.
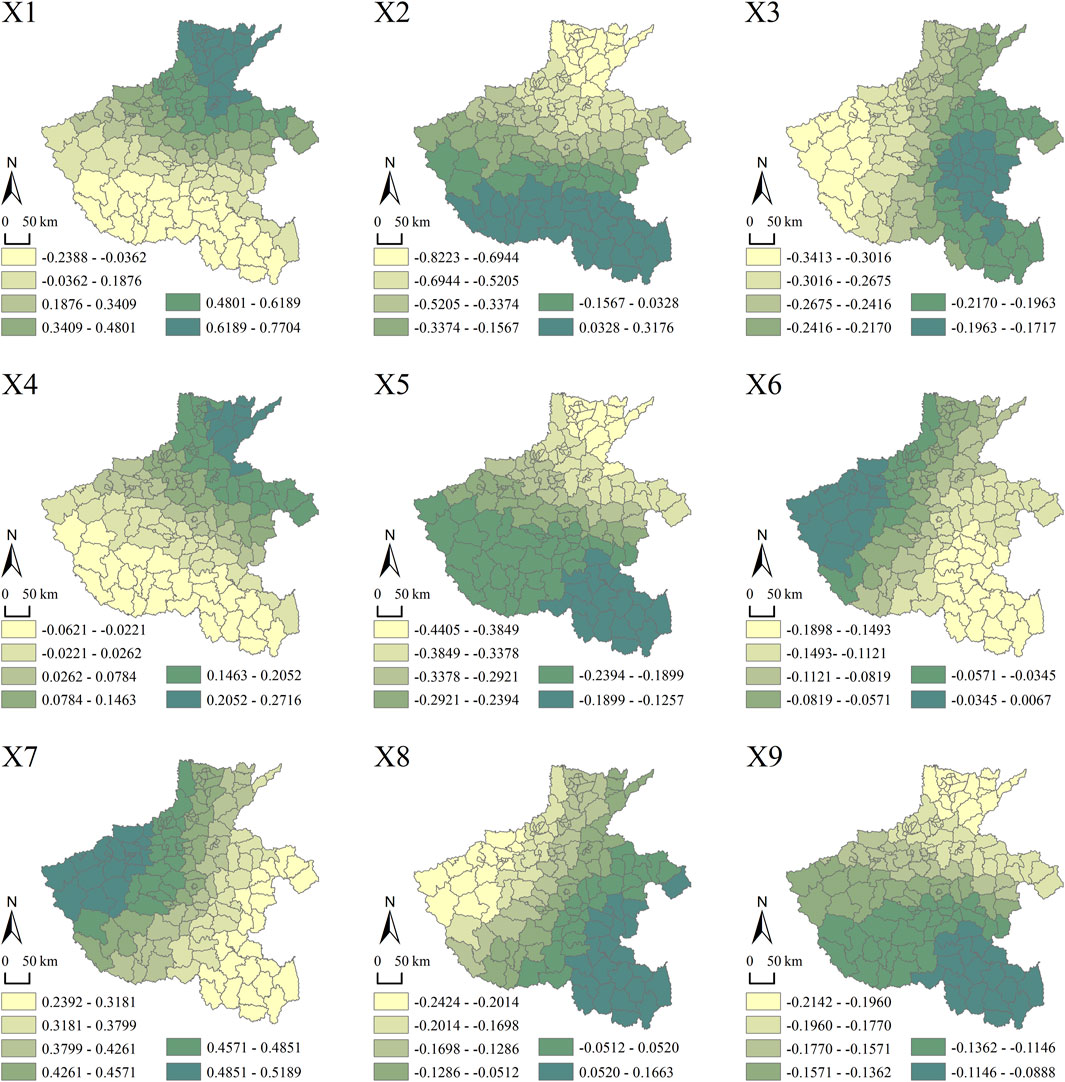
Figure 11. Regression coefficients of GWR model in Henan in 2022.
4 Discussion
4.1 Coupling mechanism of CLUEE and NTU
As the core dimension of the regional human-earth system evolution, CLUEE and NTU in Henan province exhibit a dynamic and coordinated coupling relationship. From 2002 to 2022, their interaction experienced a phased leap from “initial coordination-development stagnation-benign mutual feedback”. The coupling coordination degree rose from 0.31 to 0.59, with the spatial pattern shifting from unipolar agglomeration to multi-polar synergy. CLUEE offers sustainable support for urbanization by optimally allocating resources and enhancing ecological functions, whereas NTU feeds back to the intensive use of cultivated land through factor flow and technological innovation (Hou et al., 2019). Constrained by resources, technological empowerment and institutional adjustment lead to a nonlinear feedback mechanism between the two, jointly shaping an “efficiency driving urbanization quality improvement-urbanization stimulating efficiency upgrading” spiral upward path. The coupling relationship between NTU and CLUEE is a pivotal issue in integrated urban-rural development and ecological civilization construction. NTU focuses on people-oriented, eco-friendly and sustainable development, while CLUEE aims for the coordinated optimization of economic, social and ecological benefits in agricultural production. Through factor flow, technological innovation and policy regulation, the two form a dynamic interaction (Azam, 2019). This coupling relationship not only reflects the optimal allocation of urban and rural resource elements but also significantly impacts regional high-quality development.
Revealing their interaction mechanism can offer theoretical support for balancing urbanization expansion and cultivated land protection, as well as promoting green transformation. The improvement of CLUEE drives NTU development via multiple pathways. Firstly, efficient agricultural production releases surplus rural labor, providing human resources for population urbanization. It reduces the labor-intensive operation’s reliance on labor force, prompting farmers to migrate to towns and cities, and accelerating population urbanization. Secondly, the increase in CLUEE boosts agricultural economic output. Through higher grain production and agricultural output value, it offers material guarantees for urbanization. Meanwhile, the rise in farmers’ income drives consumption upgrading and creates market conditions for optimizing the urban industrial structure. Moreover, the improvement of cultivated land ecological efficiency reduces non-point source pollution and carbon emissions, alleviating environmental pressure during urbanization and laying the foundation for ecological urbanization. NTU nurtures CLUEE improvement by aggregating technological, capital and policy elements. On the one hand, technological innovation and capital investment brought by urbanization promote the shift of agricultural production modes towards intensification and ecologicalization. On the other hand, during urbanization, governments restrict extensive cultivated land use and encourage green production through environmental regulations and ecological compensation mechanisms. Furthermore, the social effects of urbanization and industrial upgrading promote the exploration of the multi-functional value of cultivated land. However, urban construction and industry have occupied a large amount of cultivated land, and the large-scale use of chemical fertilizers, although it can increase grain production, will also have side effects on the environment, seriously affecting the ecological environment and the efficiency of cultivated land utilization (Wang and Zhang, 2013). But through factor reorganization and policy intervention, the cultivated land utilization structure can be optimized to achieve a balance between efficiency and protection.
In the existing research on the coupling coordination degree of CLUEE and NTU, it is basically shown that the levels of CLUEE and NTU and the coupling coordination degree of the two have been continuously increasing, and the growth rates vary among different provinces (Yang et al., 2021). This feature was also demonstrated in Wei et al.’s research on Hunan Province, China (Wei et al., 2023), and it also showed an imbalance in spatial distribution. The findings of this study are in line with the above. In China’s rapid economic and social development, the coordination degree between CLUEE and NTU has been continuously improving and shows the characteristics of spatial heterogeneity. In the future, it is still necessary to continuously optimize policy measures to promote the coordinated development of the two.
4.2 Driving mechanism of influencing factors of CLUEE and NTU
On a global scale, the driving mechanism of the coupling coordination degree of CLUEE and NTU in Henan province was analyzed. The county-level per capita disposable income emerged as the core dominant factor, followed by the per capita cultivated land area and the nighttime light index. Factors such as local general public budget revenue, elevation, and multiple cropping index played relatively weak roles. The county-level per capita disposable income drives the flow of factors between urban and rural areas and promotes the integration of industry and city. Meanwhile, if the intensity of the effect of natural factors is significantly weak, it reflects the characteristic of weakened terrain constraints in plain areas. The temporal evolution shows that the dominant factors present phased fluctuation characteristics: the driving effect of county-level per capita disposable income has decreased since 2014, the promoting effect of per capita cultivated land and nighttime light index has slowed down during the “14th Five-Year Plan” period, and the weakening of the volatility of terrain factors further confirms the transformation trend of the human-land system from natural constraints to social and economic dominance. However, the coupled and coordinated development of CLUEE and NTU is not only affected by a single factor, but also by the interaction of multiple factors. The average interaction intensity between local general public budget revenue and various factors reached 2.8 times that of the single-factor effect, showing a significant nonlinear enhancement effect. However, the intensity of county-level per capita disposable income after interaction did not increase significantly and even decreased in some years. In terms of timing, the combination of interaction dominant factors showed phased leaps: In 2002, the investment-driven model of county-level per capita disposable income-local general public budget revenue was dominant; In 2006, the multiple cropping index-resources of county-level per capita disposable income in county areas became the main driving force; The 2010 nighttime light index-multiple cropping index reveals that economic and natural factors are turning towards synergy. In 2014, the county-level per capita disposable incomes-local general public budget revenue once again dominated. By 2022, the fiscal expenditure on agriculture, forestry, and water conservancy-the multiple cropping index is the core. The evolution of this ternary driving logic of “system-technology-resources” is essentially a manifestation of the dynamic adaptation between regional development policies and the carrying capacity of resources and the environment.
At the local scale, the effects of different factors vary. From 2002 to 2022, the county-level per capita disposable income continued to be positively driven, but the driving intensity showed a decreasing trend. The per capita cultivated land area and local general public budget revenue show inhibitory effects, and the inhibitory intensities have both increased. The elevation and agricultural machinery power per unit area show the transformation characteristics from inhibitory effect to promoting effect. The area of the promoting effect area keeps expanding, and the promoting intensity also gradually increases. The other four factors mainly show an evolution from a promoting effect to an inhibitory effect. Among them, the multiple cropping index has evolved from a dominant promoting effect at the beginning to a pure inhibitory effect. The negative evolution effects of terrain ruggedness, expenditure on fiscal expenditure on agriculture, forestry, and water conservancy, and nighttime light index are also very significant.
From the spatial transfer perspective, the factor effects at the local scale were analyzed, and the intensity distribution of the effects of some factors showed similarities. In 2002, the terrain ruggedness, the agricultural machinery power per unit area, and the local general public budget revenue all showed a trend of weakened promoting effect and strengthened inhibitory effect from the west to the east of Henan province, which might be related to the traditional agricultural dominance model in the east. In 2022, the spatial correlation of each factor became more obvious: both the elevation and the agricultural machinery power per unit area showed a trend of decreasing coefficients from northeast to southwest, reflecting the reconstruction of the differentiated human-land relationship between the construction of high-standard farmland in the Northeast Plain and the ecological migration in the mountainous areas of southwest China. The terrain ruggedness, the multiple cropping index and the local general public budget revenue have been exerting increasingly stronger inhibitory effects from south to north. Expenditures on fiscal expenditure on agriculture, forestry, and water conservancy and county-level per capita disposable income show a weakening trend in intensity from west to east.
Existing studies have also shown that the utilization efficiency of cultivated land is strongly influenced by social and economic conditions (Yang et al., 2021). In the CLUEE study on the karst areas in southwest China, the land replanting index and average altitude mainly showed inhibitory effects (Zhang et al., 2024), which is the same as the conclusion of this study. This reflects that the same influencing factor may also show similar degrees of influence in different regions. However, in Wang et al.’s study, the number of laborers per unit of cultivated land and the proportion of agricultural input were important positive driving factors for cultivated land utilization efficiency (Yang et al., 2021), which might be due to the fact that this study did not consider the coupling coordination of urbanization. Regarding the influencing factors of NTU, in the research of Gu et al., the degree of urbanization is mainly affected by economic factors, especially the land economy. Local public budget revenue has become the main driving factor, but a large part of this revenue comes from land sales, which is unfavorable for the long-term coordination between CLUEE and NTU (Gu et al., 2017).
The influence mechanism functions through a synergistic interplay of natural constraints, economic drivers, and policy interventions that dynamically reconfigure system coordination across spatiotemporal scales (Figure 12). Foundational natural geographical factors impose spatially structured land-use patterns that enforce compact urbanization and stratified agriculture while suppressing inefficient sprawl, yet exhibit intensifying topographic constraints that diverge regionally-initially concentrating development in western highlands while progressively limiting northern plains. Concurrently, agricultural inputs trigger self-reinforcing feedbacks: expanded per capita cultivated area diminishes ecological returns through extensive management, while multi-cropping transitions from initial gains to systemic inefficiency as soil depletion and water overexploitation erode ecological foundations, culminating in province-wide negative coordination effects. Economic-fiscal dimensions further modulate outcomes via nonlinear pathways: urbanization thresholds shift from synergistic agglomeration to ecological disintegration through light pollution and farmland fragmentation, while fiscal prioritization of urban expansion accelerates agricultural conversion and crowds out ecological investments, despite diminishing returns from disposable income. Policy instruments like ecological redlines attempt corrective redistribution but inadvertently intensify urban-agricultural competition. Crucially, short-term economic gains progressively erode long-term coordination by exceeding regenerative capacities, while regional divergence manifests through asymmetric adaptation. The system behavior thus reflects competing optimization paradigms: geographical systems regulating through equilibrium-seeking terrain adaptations, socioeconomic systems driven by efficiency-maximizing intensification, and policy frameworks mediating through redistributive interventions. Their complex alignment across temporal scales and spatial gradients ultimately generates the observed band-like inhibition-promotion patterns, wherein synergy dominates where environmental limits accommodate economic diversification, while conflict arises where intensive resource demands outpace ecological regeneration capacities. This integrated mechanism underscores the non-stationary interplay between endogenous human activities and exogenous environmental forcings in shaping sustainable landscape evolution.
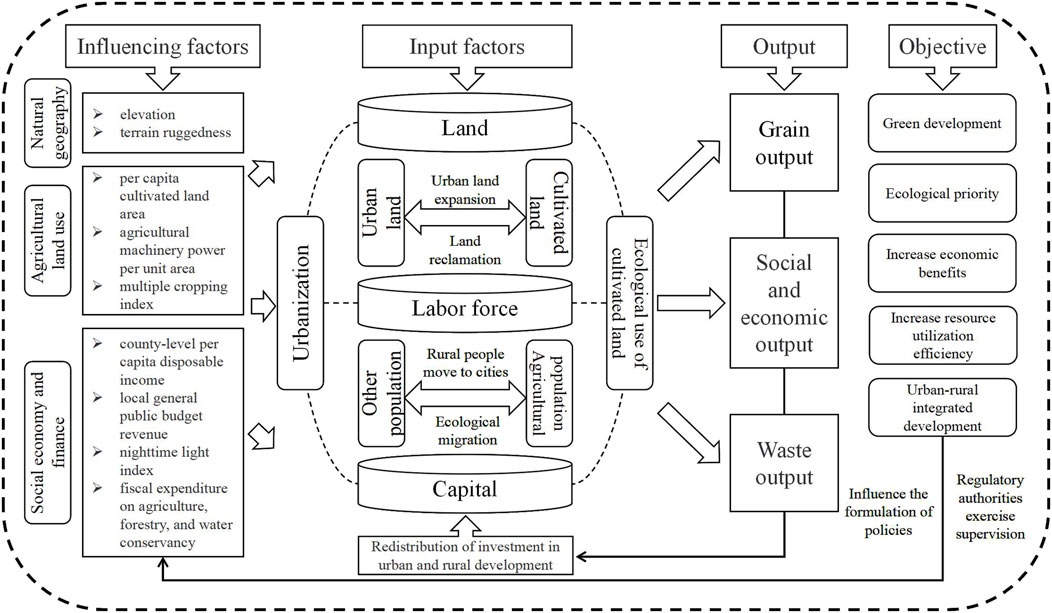
Figure 12. Driving mechanism of the coupling coordination development of CLUEE and NTU.
4.3 Policy recommendations
In central-eastern and northeastern regions with higher CLUEE, efforts must prioritize synergistic enhancement of farmland quality and ecological conservation. Strict implementation of controls against non-agricultural conversion and non-grain production use of cultivated land is essential, enforcing the joint party-government accountability system with lifelong responsibility to ensure total farmland and permanent basic farmland stability at nationally mandated targets. Promotion of eco-agricultural technologies and high-standard farmland construction should be integrated into the Yellow River Ecological Belt’s comprehensive governance framework to consolidate its strategic role as a “national granary”. Concurrently, in western and southern low-CLUEE regions, ecological protection and restoration projects should be prioritized through rigorous ecological conservation redline delineation, farmland-to-forest or grassland conversion, and mine rehabilitation. Development of distinctive eco-agriculture should be permitted, supported by policy instruments such as point-based land allocation and composite land use to facilitate rural tertiary industry integration, thereby optimizing synergy between cultivated land’s ecological functions and economic productivity.
Central-northern regions with advanced NTU should pursue innovation-driven intensive development by elevating Zhengzhou’s national central city status through decongestion of non-core urban functions and reduced development intensity. Accelerated integration of Zhengzhou-Kaifeng-Xuchou via rail-based metropolitan development must prioritize allocation of new construction land quotas for industrial collaboration, scientific innovation platforms, and shared public services, while advancing land-saving technologies and three-dimensional development models. Conversely, remaining low-NTU areas require county-centered urbanization, supporting Yongcheng and Dengzhou’s evolution into medium-sized cities while cultivating key population-center towns. Deepening of county-level administrative reforms should expand infrastructure and public service coverage, with the “Everyone with a Certificate, Skillful Henan” program enhancing rural migrants’ employability to ensure equitable access to urban public services.
Highly coordinated central-western-northeastern regions should establish a dual “urban-rural integration and ecological security” support system, piloting construction land quota-pooling mechanisms within Zhengzhou Metropolitan Area to revitalize approved-but-idle land while exploring “land use rights and ecological product value” transfer models. Comprehensive territorial consolidation must optimize agricultural-ecological-urban spatial ratios, developing 15-min community living circles and smart resilient cities. For less-coordinated southwestern areas, an “ecological compensation and characteristic revitalization” policy framework should designate special revitalization zones, integrating historical-cultural resources with ecological assets for cultural tourism development. Strengthened fiscal transfers and ecological compensation must support integrated urban-rural waste management systems, with point-based land allocation securing rural industrial land to resolve conflicts between ecological preservation and lagging urbanization.
4.4 Shortcomings and future prospects
This study is based on county-level data from Henan province between 2002 and 2022. Although it reflects the coupling dynamics of regional CLUEE and NTU, the relatively short time span makes it difficult to capture long-term fluctuation patterns. In the future, the research period can be extended. By combining long -term remote sensing data with statistical yearbook data, the understanding of the long-term coupled and coordinated evolution of CLUEE and NTU can be deepened. Furthermore, the research area focuses on Henan province, whose high plain proportion and resource constraints differ significantly from mountainous and coastal areas, limiting the conclusion’s universality. In the future, multi-scale national comparisons can be conducted to identify heterogeneous driving mechanisms across different geographical units and provide a scientific basis for differentiated policy design. In terms of driving mechanism analysis, existing studies have revealed the influence factor intensity and spatial non-stationarity using geographic detectors and GWR models, but the analysis of nonlinear relationships remains insufficient. In the future, machine learning methods like random forest models can be introduced to analyze complex variable relationships through feature importance ranking and partial dependency plots. Additionally, combining the system dynamics model to simulate the coupling coordination degree evolution path under scenarios like policy intervention and climate change can quantify the long-term effects of different regulatory strategies and enhance decision-making’s forward-looking nature.
5 Conclusion
Henan Province witnessed significant improvement in CLUEE from 0.09 to 0.47, while NTU exhibited inverted U-shaped growth from 0.15 to 0.32. Spatially, CLUEE transitioned from point-like dispersion to contiguous expansion, culminating in 2022 with high-value agglomerations in the Zhengzhou metropolitan area and low-value clusters in western Henan’s mountainous regions, whereas NTU displayed pronounced polarization. The coupling coordination degree between CLUEE and NTU ascended in an N-shaped trajectory from 0.31 to 0.59, spatially evolving toward a T-shaped corridor with residual low-value pockets in the southwest. For the driving factors of coupling coordination degree,at the provincial scale, county-level per capita disposable income dominates as socio-economic forces supersede weakening natural constraints. At the county scale, significant spatiotemporal differentiation emerges: inhibitory effects on per capita cultivated land and local fiscal revenue intensify, while elevation and agricultural machinery power shift from suppression to promotion—changes most pronounced on the Northeast Plain but attenuated in southwestern mountains. Spatially, terrain ruggedness and cropping index exhibit strengthening south-north inhibitory gradients, whereas fiscal expenditure-disposable income synergy weakens west-east, reflecting divergent regional intensification and ecological adaptation pathways. Policy recommendations for enhancing CLUEE-NTU coupling coordination focus on spatially differentiated interventions: In high-CLUEE regions, synergistic farmland quality-ecological conservation is prioritized through strict non-agriculturalization or non-grainization controls, lifelong accountability systems, and integration of eco-agricultural technologies with Yellow River Belt governance. Low-CLUEE areas emphasize ecological restoration via redline delineation, farmland conversion, and eco-agriculture development supported by flexible land policies. Advanced-NTU zones pursue innovation-driven intensification through metropolitan rail-integration, core-area decongestion, and land-saving technologies, while low-NTU regions advance county-centered urbanization with administrative reforms and skills certification. Highly coordinated areas establish dual urban-rural or ecological security systems via land quota-pooling and value-transfer mechanisms, whereas less-coordinated zones implement ecological compensation, cultural revitalization, and targeted land allocation to resolve ecology-urbanization conflicts, ultimately harmonizing regional pathways.
Data availability statement
The statistical data from Henan statistical yearbook (2002-2022), is available at https://data.cnki.net/. The GIS data for 1985-2023 annual China 30 meters resolution land cover data, is available at https://essd.copernicus.org/articles/13/3907/2021/. The elevation data is sourced from the Center for Resources and Environmental Sciences and Data Center of the Chinese Academy of Sciences can be found at https://www.resdc.cn/. Terrain data from China degree of km grid terrain data set is accessible at https://geodoi.ac.cn/WebCn/doi.aspx?Id=887. The night lights index data from China lighting at night long time series data set (2000-2020), is available at https://www.geodoi.ac.cn/doi.aspx?DOI=10.3974/geodb.2022.06.01.V1). The PM2.5 data selection high resolution quality PM2.5 data set (2000-2023), can be found at https://data.tpdc.ac.cn/zh-hans/data/6168e75d-93ab-4e4a-b7ff-33152e49d0bf.
Author contributions
CL: Writing – review and editing, Writing – original draft.
Funding
The author(s) declare that no financial support was received for the research and/or publication of this article.
Conflict of interest
The author declares that the research was conducted in the absence of any commercial or financial relationships that could be construed as a potential conflict of interest.
Generative AI statement
The author(s) declare that no Generative AI was used in the creation of this manuscript.
Any alternative text (alt text) provided alongside figures in this article has been generated by Frontiers with the support of artificial intelligence and reasonable efforts have been made to ensure accuracy, including review by the authors wherever possible. If you identify any issues, please contact us.
Publisher’s note
All claims expressed in this article are solely those of the authors and do not necessarily represent those of their affiliated organizations, or those of the publisher, the editors and the reviewers. Any product that may be evaluated in this article, or claim that may be made by its manufacturer, is not guaranteed or endorsed by the publisher.
Footnotes
1In 1986, Jiyuan County was briefly under the jurisdiction of Jiaozuo City. It was not until 2005 that it was officially established as a county-level city directly under the provincial government. In view of its historical connection with Jiaozuo City, this study still incorporates the data of Jiyuan City into the statistical framework of Jiaozuo City for overall calculation.
References
Andersen, P., and Petersen, N. C. (1993). A procedure for ranking efficient units in data envelopment analysis. Manag. Sci. 39 (10), 1261–1264. doi:10.1287/mnsc.39.10.1261
Azam, M. (2019). Accounting for growing urban-rural welfare gaps in India. World Dev. 122, 410–432. doi:10.1016/j.worlddev.2019.06.004
Cao, W., Zhou, W., Wu, T., Wang, X. C., and Xu, J. H. (2022). Spatial-temporal characteristics of cultivated land use eco-efficiency under carbon constraints and its relationship with landscape pattern dynamics. Ecol. Indic. 141, 109140. doi:10.1016/j.ecolind.2022.109140
Cecchini, L., Venanzi, S., Pierri, A., and Chiorri, M. (2018). Environmental efficiency analysis and estimation of CO2 abatement costs in dairy cattle farms in Umbria (Italy): a SBM-DEA model with undesirable output. J. Clean. Prod. 197, 895–907. doi:10.1016/j.jclepro.2018.06.165
Chen, S., and Pei, B. (2025). Spatial-temporal variations of cultivated land compensation and its compensation mechanism in mainland China. Environ. Impact Assess. Rev. 110, 107712. doi:10.1016/j.eiar.2024.107712
Chen, Y., Li, Z., Li, P., Zhang, Z., and Zhang, Y. (2021a). Identification of coupling and influencing factors between urbanization and ecosystem services in Guanzhong, China. Sustainability 13 (19), 10637. doi:10.3390/su131910637
Chen, Z., Yu, B., Yang, C., Zhou, Y., Yao, S., Qian, X., et al. (2021b). An extended time series (2000–2018) of global NPP-VIIRS-like nighttime light data from a cross-sensor calibration. Earth Syst. Sci. Data 13 (3), 889–906. doi:10.5194/essd-13-889-2021
Chen, Y., Li, Z., Li, P., Zhang, Y., Liu, H., and Pan, J. (2022). Impacts and projections of land use and demographic changes on ecosystem services: a case study in the Guanzhong region, China. Sustainability 14 (5), 3003. doi:10.3390/su14053003
Chen, C., Gao, Y. J., and Qin, Y. D. (2023a). A causal relationship between the new-type urbanization and energy consumption in China: a panel VAR approach. Sustainability 15 (14), 11117. doi:10.3390/su151411117
Chen, W., Wang, G., Xu, N., Ji, M., and Zeng, J. (2023b). Promoting or inhibiting? New-type urbanization and urban carbon emissions efficiency in China. Cities 140, 104429. doi:10.1016/j.cities.2023.104429
Cheng, Z., Li, X., and Zhang, Q. (2023). Can new-type urbanization promote the green intensive use of land? J. Environ. Manag. 342, 118150. doi:10.1016/j.jenvman.2023.118150
Coluccia, B., Valente, D., Fusco, G., De Leo, F., and Porrini, D. (2020). Assessing agricultural eco-efficiency in Italian Regions. Ecol. Indic. 116, 106483. doi:10.1016/j.ecolind.2020.106483
Daw, T. M., Hicks, C. C., Brown, K., Chaigneau, T., Januchowski-Hartley, F. A., Cheung, W. W. L., et al. (2016). Elasticity in ecosystem services: exploring the variable relationship between ecosystems and human well-being. Ecol. Soc. 21 (2), art11. doi:10.5751/ES-08173-210211
Deng, X., and Gibson, J. (2020). Sustainable land use management for improving land eco-efficiency: a case study of Hebei, China. Ann. Operations Res. 290 (1), 265–277. doi:10.1007/s10479-018-2874-3
Ding, C., Niu, Y., and Lichtenberg, E. (2014). Spending preferences of local officials with off-budget land revenues of Chinese cities. China Econ. Rev. 31, 265–276. doi:10.1016/j.chieco.2014.10.001
Ding, L., Zhao, W., Huang, Y., Cheng, S., and Liu, C. (2015). Research on the coupling coordination relationship between urbanization and the air environment: a case study of the area of Wuhan. Atmosphere 6 (10), 1539–1558. doi:10.3390/atmos6101539
Dong, X., Xu, K., Li, W., Tian, Q., Fan, Q., Fang, S., et al. (2025). Spatiotemporal evolution and influencing mechanism of urbanization and ecological environmental quality between 2000 and 2020 in Henan Province, China. Remote Sens. Appl. Soc. Environ. 37, 101492. doi:10.1016/j.rsase.2025.101492
Fan, W., Wang, H., Liu, Y., and Liu, H. (2020). Spatio-temporal variation of the coupling relationship between urbanization and air quality: a case study of Shandong Province. J. Clean. Prod. 272, 122812. doi:10.1016/j.jclepro.2020.122812
Fan, Y. T., Ning, W. J., Liang, X. Y., Wang, L. Z., Lv, L. G., Li, Y., et al. (2024). Spatial-temporal characteristics and influencing factors of eco-efficiency of cultivated land use in the Yangtze River Delta region. Land 13 (2), 219. doi:10.3390/land13020219
Feng, Y., Liu, Y., and Yuan, H. (2022). The spatial threshold effect and its regional boundary of new-type urbanization on energy efficiency. Energy Policy 164, 112866. doi:10.1016/j.enpol.2022.112866
Feng, L., Lei, G. P., and Nie, Y. (2023a). Exploring the eco-efficiency of cultivated land utilization and its influencing factors in black soil region of Northeast China under the goal of reducing non-point pollution and net carbon emission. Environ. EARTH Sci. 82 (4), 94. doi:10.1007/s12665-023-10770-0
Feng, X. J., Gao, J., Sriboonjit, J., Wang, Z. M., Liu, J. X., and Sriboonchitta, S. (2023b). The impact of urbanization on cultivated land use efficiency in the Yangtze River Economic Belt in China. Agriculture-Basel 13 (3), 666. doi:10.3390/agriculture13030666
Gao, L., Zhao, G., Liang, L., and Chen, B. (2024). Achieving higher eco-efficiency for three staple food crops with ecosystem services based on regional heterogeneity in China. Sci. Total Environ. 948, 174942. doi:10.1016/j.scitotenv.2024.174942
Gu, C. L., Hu, L. Q., and Cook, I. G. (2017). China’s urbanization in 1949-2015: processes and driving forces. Chin. Geogr. Sci. 27 (6), 847–859. doi:10.1007/s11769-017-0911-9
Hou, X., Liu, J., Zhang, D., Zhao, M., and Xia, C. (2019). Impact of urbanization on the eco-efficiency of cultivated land utilization: a case study on the Yangtze River Economic Belt, China. J. Clean. Prod. 238, 117916. doi:10.1016/j.jclepro.2019.117916
Hu, Z., Yang, X., Yang, J., Yuan, J., and Zhang, Z. (2021). Linking landscape pattern, ecosystem service value, and human well-being in Xishuangbanna, southwest China: insights from a coupling coordination model. Glob. Ecol. Conservation 27, e01583. doi:10.1016/j.gecco.2021.e01583
Hu, X., Lin, X., Wen, G., Zhou, Y., Zhou, H., Lin, S., et al. (2024). The impact of cultivated land fragmentation on farmers’ ecological efficiency of cultivated land use based on the moderating and mediating effects of the cultivated land management scale. Land 13 (10), 1628. doi:10.3390/land13101628
Huang, K. P., Tang, W., and Zhou, F. M. (2024). Agricultural productive services and ecological efficiency of cultivated land use: evidence from Hunan province, China. Pol. J. Environ. Stud. 33 (5), 5127–5140. doi:10.15244/pjoes/182907
Jiao, X. Y., Ma, J. T., Liu, G. X., Li, Y. C., Li, C. G., and Wang, X. (2024). Spatial-temporal evolution and influencing factors of the eco-efficiency of cultivated land-use in the Beijing-Tianjin-Hebei region in the context of food security. Front. Sustain. Food Syst. 8, 1462031. doi:10.3389/fsufs.2024.1462031
Jingxin, G., Jinbo, S., and Lufang, W. (2022). A new methodology to measure the urban construction land-use efficiency based on the two-stage DEA model. Land Use Policy 112, 105799. doi:10.1016/j.landusepol.2021.105799
Ke, N., Zhang, X., Lu, X., Kuang, B., and Jiang, B. (2022). Regional disparities and influencing factors of eco-efficiency of arable land utilization in China. Land 11 (2), 257. doi:10.3390/land11020257
Ke, X. L., Zhang, Y., and Zhou, T. (2023). Spatio-temporal characteristics and typical patterns of eco-efficiency of cultivated land use in the Yangtze River Economic Belt, China. J. Geogr. Sci. 33 (2), 357–372. doi:10.1007/s11442-023-2086-x
Koroso, N. H., Lengoiboni, M., and Zevenbergen, J. A. (2021). Urbanization and urban land use efficiency: evidence from regional and Addis Ababa satellite cities, Ethiopia. Habitat Int. 117, 102437. doi:10.1016/j.habitatint.2021.102437
Kraemer, R., and Kabisch, N. (2021). Parks in context: advancing citywide spatial quality assessments of urban green spaces using fine-scaled indicators. Ecol. Soc. 26 (2), art45. doi:10.5751/ES-12485-260245
Kuang, B., Lu, X., Zhou, M., and Chen, D. (2020). Provincial cultivated land use efficiency in China: empirical analysis based on the SBM-DEA model with carbon emissions considered. Technol. Forecast. Soc. Change 151, 119874. doi:10.1016/j.techfore.2019.119874
Li, P. J., and Li, T. H. (2025). Spatiotemporal analysis of ecosystem services and the impact of new-type urbanization: a case study of Chengdu, China. Ecol. Indic. 171, 113191. doi:10.1016/j.ecolind.2025.113191
Li, N., Jiang, Y., Mu, H., and Yu, Z. (2018). Efficiency evaluation and improvement potential for the Chinese agricultural sector at the provincial level based on data envelopment analysis (DEA). Energy 164, 1145–1160. doi:10.1016/j.energy.2018.08.150
Li, D., Cao, L., Zhou, Z., Zhao, K., Du, Z., and Han, K. (2022). Coupling coordination degree and driving factors of new-type urbanization and low-carbon development in the Yangtze River Delta: based on nighttime light data. Environ. Sci. Pollut. Res. 29 (54), 81636–81657. doi:10.1007/s11356-022-21400-w
Li, Z., Ye, W., Jiang, H., Song, H., and Zheng, C. (2023). Impact of the eco-efficiency of food production on the water–land–food system coordination in China: a discussion of the moderation effect of environmental regulation. Sci. Total Environ. 857, 159641. doi:10.1016/j.scitotenv.2022.159641
Lin, B., and Zhu, J. (2021). Impact of China’s new-type urbanization on energy intensity: a city-level analysis. Energy Econ. 99, 105292. doi:10.1016/j.eneco.2021.105292
Liu, Y., Zou, L., and Wang, Y. (2020). Spatial-temporal characteristics and influencing factors of agricultural eco-efficiency in China in recent 40 years. Land Use Policy 97, 104794. doi:10.1016/j.landusepol.2020.104794
Liu, W., Hao, D., and Xu, R. (2025). Will new-type urbanization enhance sustainable potential of rural water resources in China? − Based on an improved water poverty framework. Agric. Water Manag. 307, 109256. doi:10.1016/j.agwat.2024.109256
Ma, O. Z., Guangyu, W., Guibin, W., Liguo, W., Baozhang, C., Feng, M., et al. (2019). Technical efficiency analysis of the conversion of cropland to forestland program in Jiangxi, Shaanxi, and Sichuan. Int. J. Sustain. Dev. World Ecol. 26 (6), 535–546. doi:10.1080/13504509.2019.1620379
Meng, Y., Hao, Z., and Shang, S. (2024). Analysis of the equalization effect of basic public services in new-type urbanization-A case study of county regions in Guizhou, China. Heliyon 10 (21), e39922. doi:10.1016/j.heliyon.2024.e39922
Qiu, J., Yu, D., and Huang, T. (2022). Influential paths of ecosystem services on human well-being in the context of the sustainable development goals. Sci. Total Environ. 852, 158443. doi:10.1016/j.scitotenv.2022.158443
Qiu, G. J., Xing, X. A., Cong, G. Q., and Yang, X. Y. (2023). Measuring the cultivated land use efficiency in China: a super efficiency MinDS model approach. Int. J. Environ. Res. Public Health 20 (1), 583. doi:10.3390/ijerph20010583
Schaltegger, S., and Sturm, A. (1990). Ökologische Rationalität. Ansatzpunkte zur Ausgestaltung von ökologieorientierten Managementinstrumenten. Die Unternehm. 4, 273–290.
Shao, J., and Wang, L. (2023). Can new-type urbanization improve the green total factor energy efficiency? Evidence from China. Energy 262, 125499. doi:10.1016/j.energy.2022.125499
Shi, K., Yu, B., Zhou, Y., Chen, Y., Yang, C., Chen, Z., et al. (2019). Spatiotemporal variations of CO2 emissions and their impact factors in China: a comparative analysis between the provincial and prefectural levels. Appl. Energy 233-234, 170–181. doi:10.1016/j.apenergy.2018.10.050
Shi, L., Cai, Z., Ding, X., Di, R., and Xiao, Q. (2020). What factors affect the level of green urbanization in the Yellow River Basin in the context of new-type urbanization? Sustainability 12 (6), 2488. doi:10.3390/su12062488
Song, S., Yu, H., Zhang, Q., Zhang, L., Zhong, Q., and Zhang, G. (2023). Functional regionalization of land resources considering eco-efficiency in Nanjing Metropolitan Area, China. Ecol. Indic. 155, 110964. doi:10.1016/j.ecolind.2023.110964
Tang, Y., Lu, X., Yi, J., Wang, H., Zhang, X., and Zheng, W. (2021). Evaluating the spatial spillover effect of farmland use transition on grain production – an empirical study in Hubei Province, China. Ecol. Indic. 125, 107478. doi:10.1016/j.ecolind.2021.107478
Tian, Y., Zhang, J.-b., and He, Y.-y. (2014). Research on spatial-temporal characteristics and driving factor of agricultural carbon emissions in China. J. Integr. Agric. 13 (6), 1393–1403. doi:10.1016/S2095-3119(13)60624-3
Tim, U. S., and Jolly, R. (1994). Evaluating agricultural nonpoint-source pollution using integrated geographic information systems and hydrologic/water quality model. J. Environ. Qual. 23 (1), 25–35. doi:10.2134/jeq1994.00472425002300010006x
Tone, K. (2002). A slacks-based measure of super-efficiency in data envelopment analysis. Eur. J. Operational Res. 143 (1), 32–41. doi:10.1016/S0377-2217(01)00324-1
Vigani, M., Khafagy, A., and Berry, R. (2024). Public spending for agricultural risk management: land use, regional welfare and intra-subsidy substitution. Food Policy 123, 102603. doi:10.1016/j.foodpol.2024.102603
Wang, K., and Fang, C. (2025). Revealing the synergy between carbon reduction and pollution control in the process of new-type urbanization: evidence from China’s five major urban agglomerations. Sustain. Cities Soc. 120, 106154. doi:10.1016/j.scs.2025.106154
Wang, K. Y., and Zhang, P. Y. (2013). “The research on impact factors and characteristic of cultivated land resources use efficiency---take Henan province, China as a case study,” in International conference on agricultural and natural resources engineering (ICANRE), (Amsterdam: Elsevier Science Bv), 2.
Wang, C.-Y., Zhou, T.-J., Lin, Z., and Jin, N. (2015). Future Earth activities in China: towards a national sustainable development. Adv. Clim. Change Res. 6 (2), 84–91. doi:10.1016/j.accre.2015.09.008
Wang, X., Dong, X., Liu, H., Wei, H., Fan, W., Lu, N., et al. (2017). Linking land use change, ecosystem services and human well-being: a case study of the Manas River Basin of Xinjiang, China. Ecosyst. Serv. 27, 113–123. doi:10.1016/j.ecoser.2017.08.013
Wang, Z., Sun, Y., and Wang, B. (2019). How does the new-type urbanisation affect CO2 emissions in China? An empirical analysis from the perspective of technological progress. Energy Econ. 80, 917–927. doi:10.1016/j.eneco.2019.02.017
Wang, K., Wang, W., Zha, N., Feng, Y., Qiu, C., Zhang, Y., et al. (2022). Spatially heterogeneity response of critical ecosystem service capacity to address regional development risks to rapid urbanization: the case of Beijing-Tianjin-Hebei urban agglomeration in China. Sustainability 14 (12), 7198. doi:10.3390/su14127198
Wang, J., Su, D., Wu, Q., Li, G., and Cao, Y. (2023a). Study on eco-efficiency of cultivated land utilization based on the improvement of ecosystem services and emergy analysis. Sci. Total Environ. 882, 163489. doi:10.1016/j.scitotenv.2023.163489
Wang, Z. J., Yang, H., Hu, Y. M., Peng, Y. P., Liu, L., Su, S. Q., et al. (2023b). Multifunctional trade-off/synergy relationship of cultivated land in Guangdong: a long time series analysis from 2010 to 2030. Ecol. Indic. 154, 110700. doi:10.1016/j.ecolind.2023.110700
Wang, H., Zhang, D., Zhang, X., Gao, C., Wang, Z., and Wu, J. (2024). Does settlement land expansion necessarily induce the decrease of cultivated land? Differences in national scale and local counties of China. J. Environ. Manag. 358, 120948. doi:10.1016/j.jenvman.2024.120948
Wang, G., Zhao, M., Zhao, B., Liu, X., and Wang, Y. (2025). Reshaping agriculture eco-efficiency in China: from Greenhouse gas perspective. Ecol. Indic. 172, 113268. doi:10.1016/j.ecolind.2025.113268
Wei, J., and Li, Z. (2023). ChinaHighPM2.5: high-resolution and high-quality ground-level PM2.5 dataset for China (2000-2022). doi:10.5281/zenodo.3539349
Wei, X., Liu, L. M., Yuan, C. C., and Xia, Z. Y. (2023). Determining urban-rural coordinated development in major grain-producing areas based on urbanization and cultivated land use efficiency coordination level: a case study in Hunan Province, China. Front. Environ. Sci. 10, 1091898. doi:10.3389/fenvs.2022.1091898
West, T. O., and Marland, G. (2002). A synthesis of carbon sequestration, carbon emissions, and net carbon flux in agriculture: comparing tillage practices in the United States. Agric. Ecosyst. Environ. 91 (1), 217–232. doi:10.1016/S0167-8809(01)00233-X
Xiao, Y., Zhong, J. L., Zhang, Q. F., Xiang, X., and Huang, H. (2022). Exploring the coupling coordination and key factors between urbanization and land use efficiency in ecologically sensitive areas: a case study of the Loess Plateau, China. Sustain. Cities Soc. 86, 104148. doi:10.1016/j.scs.2022.104148
Xie, W. H., Jin, W. F., Chen, K. R., Wu, J. L., and Zhou, C. S. (2019). Land use transition and its influencing factors in poverty-stricken mountainous areas of Sangzhi county, China. Sustainability 11 (18), 4915. doi:10.3390/su11184915
Xu, W. T., Jin, J. L., Zhang, J. Y., Yuan, S. S., Liu, Y. L., Guan, T. S., et al. (2025). Coupling coordination degree, interaction relationship and driving mechanism of water resources carrying capacity of Beijing-Tianjin-Hebei urban agglomeration in China. J. Clean. Prod. 504, 145433. doi:10.1016/j.jclepro.2025.145433
Yang, J., and Huang, X. (2021). The 30 m annual land cover dataset and its dynamics in China from 1990 to 2019. Earth Syst. Sci. Data 13 (8), 3907–3925. doi:10.5194/essd-13-3907-2021
Yang, B., Wang, Z., Zou, L., Zou, L., and Zhang, H. (2021). Exploring the eco-efficiency of cultivated land utilization and its influencing factors in China’s Yangtze River Economic Belt, 2001–2018. J. Environ. Manag. 294, 112939. doi:10.1016/j.jenvman.2021.112939
Yin, Y., Hou, X., Liu, J., Zhou, X., and Zhang, D. (2022). Detection and attribution of changes in cultivated land use ecological efficiency: a case study on Yangtze River Economic Belt, China. Ecol. Indic. 137, 108753. doi:10.1016/j.ecolind.2022.108753
Yu, B. (2021). Ecological effects of new-type urbanization in China. Renew. Sustain. Energy Rev. 135, 110239. doi:10.1016/j.rser.2020.110239
Yu, Q., Sun, Z., Shen, J., Xu, X., Han, Q., and Zhu, M. (2023). The nonlinear effect of new urbanization on water pollutant emissions: empirical analysis based on the panel threshold model. J. Environ. Manag. 345, 118564. doi:10.1016/j.jenvman.2023.118564
Yuan, C., Zhang, B., Xu, J., Lyu, D., Liu, J., Hu, Z., et al. (2025). Impact of new-type urbanization pilot policy on public service provision: evidence from China. Cities 161, 105853. doi:10.1016/j.cities.2025.105853
Zhang, G. H., and Xing, L. (2023). Research on tourism economic effect under the threshold of new-type urbanization in coastal cities of China: from the perspective of development economics. OCEAN and Coast. Manag. 239, 106587. doi:10.1016/j.ocecoaman.2023.106587
Zhang, X., Zhao, M., Wang, X., and Han, R. (2022). Regional differences of farmers’ willingness to grow grain and its influencing factors in Shandong province under the background of new-type urbanization. Agriculture 12 (8), 1259. doi:10.3390/agriculture12081259
Zhang, J. Y., Zhang, P., Liu, Y. Y., Lu, S. S., and Wu, G. Y. (2024). An analysis of the spatiotemporal evolution and driving force of cultivated land green utilization in karst region of southwest China. J. Clean. Prod. 434, 140002. doi:10.1016/j.jclepro.2023.140002
Zhao, C., and Wang, B. (2022). How does new-type urbanization affect air pollution? Empirical evidence based on spatial spillover effect and spatial Durbin model. Environ. Int. 165, 107304. doi:10.1016/j.envint.2022.107304
Zhao, Z., Bai, Y. P., Wang, G. F., Chen, J. C., Yu, J. L., and Liu, W. (2018). Land eco-efficiency for new-type urbanization in the Beijing-Tianjin-Hebei Region. Technol. Forecast. Soc. Change 137, 19–26. doi:10.1016/j.techfore.2018.09.031
Zhen, Y., Zhiming, F., and Yanzhao, Y. (2018). Relief degree of land surface dataset of China (1 km). J. Global Change Data Discover 2, 151–155. doi:10.3974/geodp.2018.02.04
Zhou, Z. M. (2011). “Study on cultivated land resources use efficiency in Henan,” in International conference on energy, environment and sustainable development (ICEESD 2011), (Stafa-Zurich: Trans Tech Publications Ltd), 2921–2924.
Zhu, Y., and Huo, C. (2022). The impact of agricultural production efficiency on agricultural carbon emissions in China. Energies 15 (12), 4464. doi:10.3390/en15124464
Zhu, M. F., Yu, X. X., Chen, K., Tan, H., and Yuan, J. J. (2024a). Spatiotemporal characteristics and driving factors of chemical oxygen demand emissions in China’s wastewater: an analysis based on spatial autocorrelation and geodetector. Ecol. Indic. 166, 112308. doi:10.1016/j.ecolind.2024.112308
Zhu, Y., Zhang, Y., Ma, L., Yu, L., and Wu, L. (2024b). Simulating the dynamics of cultivated land use in the farming regions of China: a social-economic-ecological system perspective. J. Clean. Prod. 478, 143907. doi:10.1016/j.jclepro.2024.143907
Zou, L., Liu, Y., Wang, Y., and Hu, X. (2020). Assessment and analysis of agricultural non-point source pollution loads in China: 1978–2017. J. Environ. Manag. 263, 110400. doi:10.1016/j.jenvman.2020.110400
Keywords: cultivated land use eco-efficiency, new-type urbanization, coupling coordinated development, driving mechanism, China
Citation: Liu C (2025) Spatiotemporal evolution and influencing factors of coordinated development between cultivated land use eco-efficiency and new-type urbanization: insights from Henan Province, China. Front. Environ. Sci. 13:1633927. doi: 10.3389/fenvs.2025.1633927
Received: 28 May 2025; Accepted: 25 August 2025;
Published: 18 September 2025.
Edited by:
Chong Jiang, Guangdong Academy of Science (CAS), ChinaReviewed by:
Xiaoxiao Wang, China University of Geosciences (Beijing) Energy Institute, ChinaShiqi Tian, Huaian Academy of Nanjing Agricultural University, China
Copyright © 2025 Liu. This is an open-access article distributed under the terms of the Creative Commons Attribution License (CC BY). The use, distribution or reproduction in other forums is permitted, provided the original author(s) and the copyright owner(s) are credited and that the original publication in this journal is cited, in accordance with accepted academic practice. No use, distribution or reproduction is permitted which does not comply with these terms.
*Correspondence: Chenyang Liu, MjAyMjEwMTgxODFAc3R1LnNoenUuZWR1LmNu