 Rosa Tiimuma Cambinda
 Haojie Liu
 Bernd Lennartz
- Faculty of Agricultural, Civil and Environmental Sciences, University of Rostock, Rostock, Germany
Peatland carbon loss occurs via gaseous emissions and substantial aquatic fluxes of dissolved organic carbon (DOC) during peat mineralisation and degradation. While DOC mobilisation is known to be influenced by hydrological and microbial processes, the role of pore-scale structure, particularly pore-size class, remains underexplored. We hypothesised that DOC concentration is influenced by pore size, with finer pores yielding higher concentrations. Using topsoil and subsoil samples from a degraded fen peatland (average soil organic matter content: 34 wt% and 57 wt%, respectively), we extracted pore water at - 60 hPa (macropores) and - 600 hPa (mesopores). The degraded topsoil exhibited significantly higher DOC concentrations than the subsoil, with levels 1.7 times greater at - 60 hPa and 2.2 times higher at - 600 hPa. No significant difference in DOC concentrations was observed between macropores and mesopores in the subsoil domain; however, higher DOC concentrations were evident in mesopores (107.63 mg L-1) relative to macropores (85.46 mg L-1) in the topsoil domain. Our results demonstrate that DOC concentration from degraded fen peat soils are closely linked to pore structure, particularly pore-size class, bulk density, and total porosity. Elevated DOC concentrations and variability in degraded topsoil are also associated with heterogeneity in the quality of soil organic matter, with mesopores serving as key hotspots for DOC concentration due to their role in organic matter transformation and microbial activity. These findings highlight the necessity of integrating pore-scale physical properties into peatland restoration strategies to effectively mitigate persistent waterborne DOC export.
1 Introduction
Carbon loss from peatlands involves both gaseous emissions and a significant contribution from the water-bound fraction, specifically dissolved organic carbon (DOC) (Limpens et al., 2008). Water-bound C loss accounts for 15%–50% of the total GHG emissions (Evans et al., 2016). The export of DOC from drained peatlands can alter the functioning of downstream aquatic ecosystems (Freeman et al., 2001) by influencing productivity, biogeochemical cycles, and the attenuation of solar radiation (Pastor et al., 2003).
The export rate of DOC varies for different land management conditions, with natural peatlands releasing lower DOC fluxes relative to degraded peatlands. Rosset et al. (2022) reported that degraded peatland catchments leach significantly higher DOC fluxes (mean of 30.7 ± 23.1 g C m−2 yr−1) than those from natural peatlands (5 ± 19.3 g C m−2 yr−1). Peatland drainage creates an oxic environment, accelerating the mineralisation of organic matter. DOC export from rewetted peatlands shows variable trends. Rewetting can initially decrease DOC export (Liu et al., 2019), although some studies report an initial increase, with fluxes generally declining over time (Kane et al., 2019). As a restoration practice, rewetting can mitigate DOC loss but often maintains elevated concentrations comparable to drained conditions (Liu et al., 2019).
The peat soil structure undergoes significant changes due to land management practices, which can alter hydrological regimes and impact biogeochemical cycling (Rezanezhad et al., 2016; Chen et al., 2024; Deng et al., 2025). Peat degradation reduces the proportion of large pores by breaking down plant debris into smaller fragments (Weber et al., 2017). This results in a lower hydraulic conductivity, SOM content and increases the proportion of finer pores (Rezanezhad et al., 2010; Wallor et al., 2018; Wang et al., 2021). Gosch et al. (2019) demonstrated that the pore size distribution in fen peat is strongly controlled by the degree of degradation, with highly decomposed peat exhibiting a greater proportion of finer pores. Compared to degraded peat, undecomposed peat with large active porosity sequesters up to 95% of its saturated water content to drainage (Jurasinski et al., 2020); however, the most degraded peat samples yield less than 10% of their water to drainage (Rezanezhad et al., 2016). When peatlands are drained, water retained in the soil is held by capillary forces, which are inversely proportional to pore diameter (Hillel, 1998; Walczak et al., 2002). Thus, water in smaller pores is retained at higher tensions and only drains when the matric potential becomes sufficiently negative to overcome these capillary forces. As a result, larger pores drain first under the influence of gravity, while water remains in finer pores for longer periods (Tassinari et al., 2022). The dominance of relatively finer pores (micropores and mesopores) in organic soils means that a significant proportion of water is retained at high tensions, contributing to longer residence times in the soil matrix (Walczak et al., 2002; Tassinari et al., 2022).
Microbial communities in peat soils tend to favour finer pores due to the longer residence time of water and solutes, which provides stable conditions for microbial colonisation and activity (McCarter et al., 2020). Due to reduced advective flow, microbes within these site are less prone to washout, thereby maintaining prolonged access to substrates, including dissolved organic matter (DOM) (McCarter et al., 2020). This observation suggests that finer pores may act as hotspots for DOM production and accumulation (Stutter et al., 2007), with DOC representing a key component of DOM and the most widely quantified fraction in peatland studies due to its significant role in hydrologic carbon losses (Evans et al., 2005; Schwalm and Zeitz, 2015).
In this study, we aim to investigate the impact of peat pore structure on DOC concentration, given that the role of pore size class on water-bound carbon accumulation in degraded peat soil is an understudied topic (McCarter et al., 2020). We hypothesised that DOC enrichment in degraded peat soils is strongly influenced by pore-size class, with elevated DOC concentrations in finer pores. To test this hypothesis, we conducted a porewater extraction experiment on degraded fen peat soil. We collected core samples from topsoil and subsoil depths, applied full saturation (rewetting) and sequential drainage at two pressure heads: -60 hPa (macropores, >30 μm) and −600 hPa (mesopores, 3–30 μm), respectively. We quantified the following physical properties from the soil samples: bulk density (BD), soil organic matter (SOM) content, total porosity, macroporosity, and mesoporosity. Porewater extracted from macropores and mesopores was analysed for DOC concentrations. The specific objectives of this study were to: 1) assess the differences in DOC concentrations between macropores and mesopores. 2) and investigate how DOC variability correlates with physical properties (BD, SOM, porosity) and differs between degraded topsoil and less degraded subsoil.
2 Methods and materials
2.1 Study site and soil collection
The study site (54° 0′22.10″N, 12° 6′59.76″E) is a fen peatland and located in the low-lying grasslands of Pölchow, Mecklenburg-Western Pomerania, Germany. The dominant vegetation contributing to fen peat formation includes sedge (Cyperaceae), alder (Alnus), and undecomposed wood (Wang et al., 2021). Historically, this landscape underwent its first drainage intervention in the 13th century. For several centuries, the site was subject to continued drainage, which gradually transformed the peatland and led to topsoil degradation, while the deeper subsoil layers remain comparatively less affected (Wang et al., 2021). Since the second half of the 20th century, the site has been used as grassland for hay production (Gosch et al., 2018) and is not currently undergoing active ecological restoration.
Undisturbed soil cores (7.2 cm diameter, 6.12 cm height) were sampled from a 10 m × 10 m plot using a randomised sampling approach. A total of 29 sampling points were selected within the plot. At each sampling point, two cores were collected. The topsoil core was extracted first at 10–20 cm followed by the subsoil core from the same vertical profile at 60–70 cm in depth (Supplementary Figure S1). To extract the core, a 50 cm × 40 cm area was excavated at each sampling point. A knife was then used to carefully extract the core to preserve structural integrity. This sampling campaign yielded a total of 58 independent cores (29 cores collected per depth), representing two soil distinct degradation stages [graded according to von Post (1922)]: a degraded top- (H10) and less degraded subsoil (H4).
2.2 Soil core saturation and pore water extraction
The pore water extraction procedure involved two main steps: peat soil saturation followed by pore water extraction using the suction plate system. To saturate the soil, deionised water was incrementally added every 24 h for 4 days to saturate the soil cores, ensuring uniform moisture distribution throughout the process. Although deionised water has been shown to cause pore structure changes and reduce Ks in bog peat due to pore constriction (Kettridge and Binley, 2010), Gosch et al. (2018) observed no such effects in degraded fen peat from Pölchow. Their results suggest that, for this peat type, low salinity conditions do not significantly alter pore structure or hydraulic conductivity.
After saturation, the soil cores were transferred to the suction plates and subjected to two pressure heads: - 60 hPa for 4 days followed by - 600 hPa for another 4 days. Filter paper was placed on the suction plates, and the cores were positioned upright with their bottom side resting on the plates. Porewater samples were collected after each suction period and the core weights were recorded accordingly to calculate bulk density and total porosity.
The suction plate system, illustrated in Supplementary Figure S2, consisted of eight circular borosilicate glass suction plates (EcoTech Bonn; diameter: 7.5 cm; 10-μm membrane filter; PTFE tubing) arranged within a container box. Tubes from the suction plates were connected to a vacuum system with dual functions: (1) directing pore water from the plates to collection bottles and (2) maintaining a constant pressure.
Previous (Okruszko, 1993; Walczak et al., 2002) studies defined the boundary value between macropores and mesopores as 30 μm and between mesopores and micropores as 0.2 μm. In this study, we used a pore size classification following Tassinari et al. (2022) which included macropores (equivalent pore diameter >30 µm), mesopores (equivalent pore diameter 3–30 µm) and micropores (equivalent pore diameter 0.2–3 µm). Thus, the applied tensions of - 60 hPa and - 600 hPa were estimated to correspond to pore radii of approximately 30 μm and 3 μm, respectively. A detailed explanation of this subsection can be found in the Supplementary Material (Supplementary Section S1).
2.3 Lab analysis
The soil cores were dried at 105°C to constant weight for determining dry bulk density. The loss on ignition (LOI) method was employed to estimate soil organic matter (SOM) content. Dried samples were burned at 550°C for 4 hours, following EN 13039:2011 guidelines. Porewater was collected and stored at 4° prior analysis when not measured immediately. Porewater samples were filtered using pre-washed regenerated cellulose syringe filters (0.45 µm pore size; Rotilabo® mini-tip, Carl Roth GmbH + Co. KG, Schoemperlenstraße 3–5, D-76185 Karlsruhe, Germany). DOC was measured with the AJ Multi 2100S (Analytik Jena, Germany). The instrument determines dissolved inorganic carbon (DIC, acidification with 10% phosphoric acid followed by CO2 detection via infrared spectroscopy) and total dissolved carbon (TDC, catalytic high-temperature combustion at 850°C using a platinum catalyst). DOC was calculated as the difference between TDC and DIC. Thus, each soil core produced two pore water samples drained at - 60 and - 600 hPa, respectively. For each soil core, SOM content, BD, macroporosity, mesoporosity and total porosity were determined.
2.4 Statistical analysis
Descriptive statistics were calculated for the physical properties and DOC concentrations. Box plots of the DOC concentrations were generated to depict distribution differences across pressure heads and soil depths. Paired Wilcoxon tests were performed to assess the significant differences in DOC concentrations between - 60 hPa and - 600 hPa within topsoil and subsoil groups, while Wilcoxon rank-sum tests compared DOC concentrations between topsoil and subsoil at each pressure head. To further investigate structural differences between pore groups, paired Wilcoxon tests were used to test for significant differences between macroporosity and mesoporosity within topsoil and subsoil samples.
To examine the relationship between SOM content and DOC concentrations at - 600 hPa, a Pearson correlation analysis was performed. All statistical analyses and graphical illustrations were processed in R language. The statistical tests were implemented using the stats package, while the box plots and regression plots were generated using the ggplot2 package.
3 Results
The physical properties and DOC pore water concentrations are summarised in Table 1, for a full descriptive statistic of the variables, see Supplementary Table S1. The mean SOM values were 33.3% ± 9.5% and 57.5% (±19.9%) for the top- and subsoils, respectively (mean ± standard deviation). The median total porosity in the topsoil (0.74 cm3 cm–3) is significantly lower compared to that in the subsoils (0.85 cm3 cm–3; p < 0.01). The median BD of the topsoil (0.54 g cm–3) was significantly higher than that of the subsoil (0.22 g cm–3; p < 0.0001).

Table 1. Summary statistics (mean ± standard deviation) for DOC concentrations, soil organic matter (SOM), porosity, and bulk density in topsoil (10–20 cm) and subsoil (60–70 cm). Alphabetical superscripts indicate statistical significance across depths for each variable: values sharing the same letter are not significantly different, whereas different letters indicate significant differences (p < 0.05). Pairwise comparisons of pressure-related variables within each depth (i.e., - 60 vs. - 600 hPa DOC and Φ_macro vs. Φ_meso) are highlighted in bold, indicating significant difference. For a full summary of variables and correlations, see Supplementary Table S1.
In the topsoil, Φ_macro (macroporosity) was significantly higher (0.146 ± 0.049 cm3 cm–3) than Φ_meso (mesoporosity) (0.054 ± 0.060 cm3 cm–3; p < 0.01; Supplementary Figure S5c). Similarly, in the subsoil, macroporosity was significantly higher than mesoporosity (p < 0.001; Supplementary Figure S5d). No significant difference was observed in macroporosity between topsoil and subsoil (independent t-test, p = 0.467), while mesoporosity differed significantly between depths, with higher values in the subsoil (Mann-Whitney U test, p < 0.01; Supplementary Figure S5c and S5d).
At a pressure head of P– 60 hPa, the average DOC porewater concentration in the topsoil was 85.5 mg L-1 (±43.9 mg L-1), significantly higher than that in the subsoils, which averaged 49.7 ± 30.0 mg L-1. Similarly, at P– 600 hPa, the DOC concentration in the topsoil was 107.6 ± 43.7 mg L-1, significantly higher than that in the subsoils (48.7 ± 28.4 mg L-1).
The paired Wilcoxon test revealed a significant difference in the median of DOC concentration extracted at P– 60 hPa and P– 600 hPa pressure heads in the topsoil horizon (p < 0.001; Figure 1A). In contrast, the subsoils showed no significant difference in DOC concentration between porewater extracted at the two pressure heads.
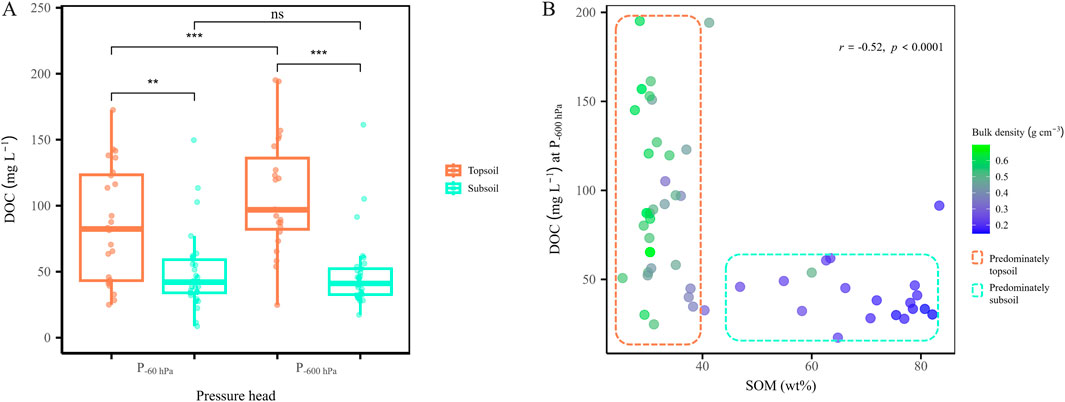
Figure 1. The pore water dissolved organic carbon (DOC) concentrations in extracted at - 60 hPa (macro pores) and - 600 hPa (mid-sized pores). The asterisk denotes a significant difference in DOC concentrations between the two groups (***p < 0.001; **p < 0.01), while “ns” indicates no significant difference (A). Relationship between DOC concentration at - 600 hPa and SOM content (r = - 0.52; p < 0.0001). Observation points are colour-coded by bulk density, serving as a proxy degradation state of peat soil (B).
4 Discussion
4.1 Peat physical structure and degradation patterns
The physical properties, namely, SOM content, macroporosity, total porosity and BD observations align with findings from previous studies conducted on samples from the same study site (Liu and Lennartz, 2015; Gosch et al., 2018; Wang et al., 2021). Bulk density is widely recognised as an indicator of peat degradation and decomposition (Liu and Lennartz, 2019). In our study, a negative linear correlation was observed between SOM content and bulk density for both topsoil (r = - 0.75; p < 0.0001) and subsoil (r = - 0.88; p < 0.0001; Supplementary Figure S3; Supplementary Table S2). Previous studies reported that natural peatlands exhibit macropores formed by plant debris, which, in turn, facilitate water flow and solute transport (Quinton et al., 2008; Liu and Lennartz, 2019). However, as peatland degradation advances, the breakdown of parent material into fine particles decreases SOM content. The peat matrix becomes increasingly compacted, leading to an increase in BD and a corresponding decrease in total porosity. We observed a similar trend where bulk density was negatively correlated with total porosity (r = - 0.90; Supplementary Table S1). This trend was highly pronounced in the degraded topsoil (0.75 ± 0.04 cm3 cm–3) relative to subsoil (0.81 ± 0.10 cm3 cm–3). Additionally, Liu and Lennartz (2019) pointed out that in degraded peatlands, secondary macropores (e.g., root channels) can maintain relatively stable porosity. Wang et al. (2021) and Liu and Lennartz (2019) observed that macroporosity decreased with increasing bulk density from 0.01 g cm-3 to approximately 0.2 g cm-3, after which it remained nearly constant. This trend is consistent with the findings of the present study (Figure 2).
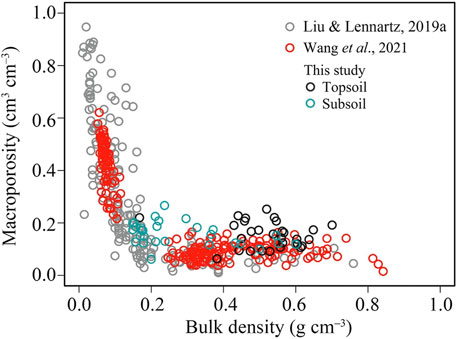
Figure 2. The relationship between bulk density and macroporosity. The grey cycles represent values from Liu and Lennartz (2019) and the red data points were derived from Wang et al. (2021).
The transition to lower bulk density with increasing depth along with higher SOM content (22.48 wt% - 83.36 wt%), reflects degradation processes consistent with prior studies. Notably, fen peat degradation decreases with depth (Liu et al., 2016). Generally, peatlands exhibit a decline in pore size distribution and pore connectivity with increasing depth due to organic matter decomposition (McCarter et al., 2020). However, in Mecklenburg-Western Pomerania, this pattern is reversed, where historical drainage and intensive agricultural practices led to topsoil degradation, and less adverse degradation is observed in the subsoil domain leading to a site-specific “inverted profile” of fen peatlands (Kleimeier et al., 2014; Liu and Lennartz, 2015).
4.2 DOC concentrations across depth and pore size domains
Our results showed that porewater DOC concentrations were significantly elevated in the topsoil relative to the subsoil depth irrespective of pressure (Figure 1A). From a depth perspective, this distinction was more evident in the topsoil, where DOC concentrations extracted from mesopores (-60 hPa to - 600 hPa) were significantly higher than those from macropores (0 hPa to - 60 hPa), despite mesopores accounting for only 5.37% of the total porosity compared to 15.3% for macropores (Supplementary Figure S5a and S5c). This suggests that there may be a greater DOC concentration per unit pore volume from mesopores. In contrast, no significant differences in DOC concentration were observed in the subsoil, suggesting that DOC accumulation in macro- and mesopore regions is less pronounced in deep, less degraded peat layers. Despite the suction experiment’s pressure limitation (up to −750 hPa) preventing drainage from micropores, their significance to DOC accumulation cannot be excluded. Based on the porosity measurements, microporosity accounts for approximately 70% of the pore volume in both top- and subsoil depth. Previous studies (Walczak et al., 2002; Tassinari et al., 2022) reported that micropores dominate pore volume in peat soils and can retain water for extended periods (>30 days; (Tassinari et al., 2022). These conditions are likely to promote microbial colonisation and by extension, DOC accumulation. Considering our results, it is clear that DOC concentration in micropores may likely be significantly greater relative to the meso- and macropores pore classes and warrants further research.
Bulk density had a pronounced to moderate correlation with DOC concentrations extracted from macropore (r = 0.44) and mesopore (r = 0.57; Supplementary Table S1) regions, respectively. This observation is supported by Liu et al.’s (2019) findings, who reported that greater bulk density in peat samples was related to higher DOC pore water concentrations. In addition, the degraded topsoil domain showed elevated and relatively more variable DOC concentrations at greater bulk density (SOM <40 wt%) under both pressure heads (Figure 1B; Supplementary Figure S4). In contrast, DOC concentrations were lower and less variable (ranging between 30 and 80 mg L-1) at a lower bulk density (SOM >40 wt%) in the subsoil domain. Two plausible mechanisms may explain this observation. First, during drainage and peat mineralisation, organic carbon compounds accumulate in the topsoils through chemical binding with both amorphous and crystalline ferric compounds (Zak et al., 2018). Under saturated conditions, the reduction of ferric to ferrous iron leads to the release of organic carbon previously adsorbed onto iron hydroxides, thereby increasing DOC concentrations in the topsoils (Selle et al., 2019). Second, the topsoil contains a greater proportion of labile carbohydrates, likely due to continuous inputs of fresh plant litter. These labile compounds contribute to the elevated DOC concentrations observed in the topsoil (Liu et al., 2019).
4.3 Role of finer pores in DOC accumulation and restoration implications
In our study, micropores and mesopores together constitute approximately 78% of the total porosity in both topsoil and subsoil. This dominance of finer pores is a key factor in water retention within the soil matrix, as these pores hold water at high tensions and contribute to longer residence times. Longer residence times in finer pores have been shown to facilitate localised microhabitats favourable for microbial life. As a result, finer pores can likely act as hotspots for DOC accumulation. In line with these findings, it is plausible that the elevated DOC concentrations extracted from the mesopores in the topsoil region in our study are at least attributable to microbial transformation of organic matter microbial activity and breakdown of Fe3+-organic matter complexes within mesopores (Figure 3) (Zak and Gelbrecht, 2007).
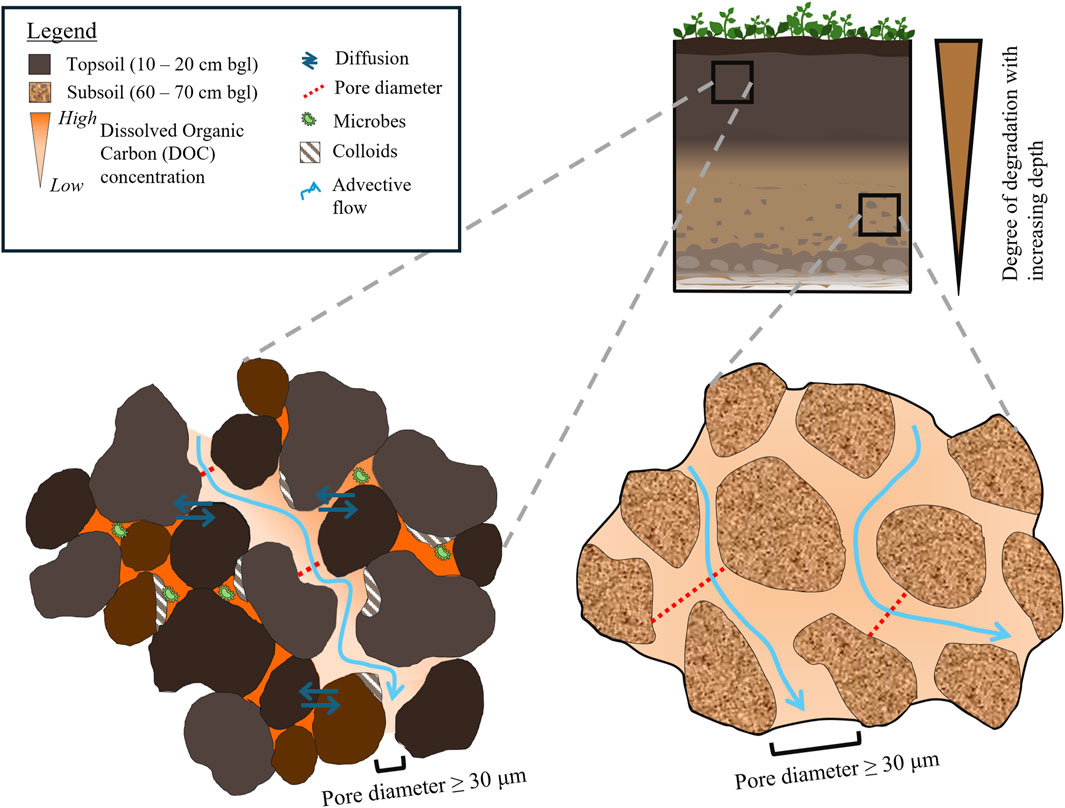
Figure 3. Conceptual representation of peat within the topsoil and subsoil domains. elevated DOC concentrations in relatively finer, closed pores (higher concentrations, shown in dark orange) and lower concentrations in larger, more connected pores (lower concentrations, shown in lighter orange colour). The distribution of DOC concentration is proportional to the degree of decomposition and hydro-biogeochemical processes in degraded fen peatland. “bgl” refers to “below ground level.
Therefore, our study reveals that the pronounced DOC variability observed (50–200 mg L-1) in samples of lower SOM but higher bulk density (Figure 1B) and specifically the high DOC concentrations extracted at mesoporosity (-600 hPa) in the topsoil compared to subsoil (Table 1; Figures 1A,B), illustrate that DOC accumulation is strongly associated with the physical pore structure particularly pore size class, with mesopores (-600 hPa) serving as hotspots for DOC concentration in degraded fen peat soils.
Liu et al. (2019) and Zak and Gelbrecht (2007) reported that even after restoration, highly degraded peat can still exhibit elevated DOC in porewater. In reference to our results, given the correlation observed between DOC accumulation and mesopores in degraded topsoil, restoration strategies such as rewetting should not only target reduction of carbon emissions but also consider their effects on water-bound carbon export. While topsoil removal has been suggested as a measure to reduce nutrient export risk of adjacent aquatic systems (Zak and Gelbrecht, 2007; Emsens et al., 2015; Zak et al., 2018), it seems an inappropriate method at the scale of current rewetting projects.
5 Conclusion
Our results demonstrate that DOC concentration from degraded fen peat soils is closely associated with pore structure, as characterised by its physical properties (e.g., bulk density, porosity). Higher pressure (-600 hPa), targeting mesopores, yielded greater DOC concentrations than lower pressure (-60 hPa) extraction, suggesting that DOC enrichment is greater in finer pore regions. From a depth perspective, DOC concentration and variability in degraded topsoil were significantly greater compared to subsoil and this observation correlated with an increased bulk density and a reduction in soil organic matter content. The physical properties reflect the ‘inverted profile’ of degradation unique to fen peatlands in Mecklenburg-Western Pomerania, where land-use and historical drainage led to a more compacted upper layer overlying a relatively undecomposed subsoil. Overall, findings highlight that DOC concentration in degraded fen peatlands is strongly influenced by pore size class and showcase the necessity for future research and peatland restoration strategies to account not only for physical properties (i.e., bulk density and SOM content) but also for pore-size distribution as critical factors when identifying DOC hotspots in drained peatlands. Although macropores generally exhibit lower DOC concentrations, their larger pore volume and connectivity likely contribute more substantially to overall DOC flux.
Data availability statement
The original contributions presented in the study are included in the article/Supplementary Material, further inquiries can be directed to the corresponding author.
Author contributions
RC: Visualization, Formal Analysis, Writing – original draft, Data curation, Resources, Conceptualization, Writing – review and editing, Investigation, Methodology. HL: Methodology, Conceptualization, Writing – review and editing, Formal Analysis. BL: Conceptualization, Writing – review and editing, Funding acquisition, Supervision.
Funding
The author(s) declare that financial support was received for the research and/or publication of this article. This study was conducted within the framework of the Research Training Group Baltic TRANSCOAST funded by the DFG (Deutsche Forschungsgemeinschaft) under grant number GRK 2000 (https://www.baltic-transcoast.uni-rostock.de). We acknowledge financial support by the DFG and the University of Rostock within the funding programme Open Access Publishing.
Acknowledgments
We thank Ms. Evelyn Bolzmann, Ms. Hilal Höfer and Dr. Stefan Köhler for their skilled technical assistance.
Conflict of interest
The authors declare that the research was conducted in the absence of any commercial or financial relationships that could be construed as a potential conflict of interest.
Generative AI statement
The author(s) declare that no Generative AI was used in the creation of this manuscript.
Publisher’s note
All claims expressed in this article are solely those of the authors and do not necessarily represent those of their affiliated organizations, or those of the publisher, the editors and the reviewers. Any product that may be evaluated in this article, or claim that may be made by its manufacturer, is not guaranteed or endorsed by the publisher.
Supplementary material
The Supplementary Material for this article can be found online at: https://www.frontiersin.org/articles/10.3389/fenvs.2025.1634070/full#supplementary-material
References
Chen, C., Lemke, N., Loft, L., and Matzdorf, B. (2024). Transformation of peatland management toward climate targets in Europe. Ecosyst. Health Sustain. 10, 239. doi:10.34133/ehs.0239
Deng, Y., Boodoo, K. S., Knorr, K.-H., and Glatzel, S. (2025). Assessing the impact of land use on peat degradation in bogs in the enns valley, Austria. Soil Use Manag. 41, e70013. doi:10.1111/sum.70013
Emsens, W.-J., Aggenbach, C. J., Smolders, A. J., and van Diggelen, R. (2015). Topsoil removal in degraded rich fens: can we force an ecosystem reset? Ecol. Eng. 77, 225–232. doi:10.1016/j.ecoleng.2015.01.029
Evans, C. D., Monteith, D. T., and Cooper, D. M. (2005). Long-term increases in surface water dissolved organic carbon: observations, possible causes and environmental impacts. Environ. Pollut. 137, 55–71. doi:10.1016/j.envpol.2004.12.031
Evans, C. D., Renou-Wilson, F., and Strack, M. (2016). The role of waterborne carbon in the greenhouse gas balance of drained and re-wetted peatlands. Aquat. Sci. 78, 573–590. doi:10.1007/s00027-015-0447-y
Freeman, C., Evans, C. D., Monteith, D. T., Reynolds, B., and Fenner, N. (2001). Export of organic carbon from peat soils. Nature 412, 785. doi:10.1038/35090628
Gosch, L., Janssen, M., and Lennartz, B. (2018). Impact of the water salinity on the hydraulic conductivity of fen peat. Hydrol. Process. 32, 1214–1222. doi:10.1002/hyp.11478
Gosch, L., Townsend, H., Kreuzburg, M., Janssen, M., Rezanezhad, F., and Lennartz, B. (2019). Sulfate mobility in fen peat and its impact on the release of solutes. Front. Environ. Sci. 7, 7–2019. doi:10.3389/fenvs.2019.00189
Jurasinski, G., Ahmad, S., Anadon-Rosell, A., Berendt, J., Beyer, F., Bill, R., et al. (2020). From understanding to sustainable use of peatlands: the WETSCAPES approach. Soil Syst. 4, 14. doi:10.3390/soilsystems4010014
Kane, E. S., Veverica, T. J., Tfaily, M. M., Lilleskov, E. A., Meingast, K. M., Kolka, R. K., et al. (2019). Reduction-oxidation potential and dissolved organic matter composition in northern peat soil: interactive controls of water table position and plant functional groups. J. Geophys. Res. Biogeosciences 124, 3600–3617. doi:10.1029/2019JG005339
Kettridge, N., and Binley, A. (2010). Evaluating the effect of using artificial pore water on the quality of laboratory hydraulic conductivity measurements of peat. Hydrol. Process. 24, 2629–2640. doi:10.1002/hyp.7693
Kleimeier, C., Karsten, U., and Lennartz, B. (2014). Suitability of degraded peat for constructed wetlands — hydraulic properties and nutrient flushing. Geoderma 228-229, 25–32. doi:10.1016/j.geoderma.2013.12.026
Limpens, J., Berendse, F., Blodau, C., Canadell, J. G., Freeman, C., Holden, J., et al. (2008). Peatlands and the carbon cycle: from local processes to global implications – a synthesis. Biogeosciences 5, 1475–1491. doi:10.5194/bg-5-1475-2008
Liu, H., Janssen, M., and Lennartz, B. (2016). Changes in flow and transport patterns in fen peat following soil degradation. Eur. J. Soil Sci. 67, 763–772. doi:10.1111/ejss.12380
Liu, H., and Lennartz, B. (2015). Visualization of flow pathways in degraded peat soils using titanium dioxide. Soil Sci. Soc. Am. J. 79, 757–765. doi:10.2136/sssaj2014.04.0153
Liu, H., and Lennartz, B. (2019). Hydraulic properties of peat soils along a bulk density gradient-A Meta study. Hydrol. Process. 33, 101–114. doi:10.1002/hyp.13314
Liu, H., Zak, D., Rezanezhad, F., and Lennartz, B. (2019). Soil degradation determines release of nitrous oxide and dissolved organic carbon from peatlands. Environ. Res. Lett. 14, 094009. doi:10.1088/1748-9326/ab3947
McCarter, C., Rezanezhad, F., Quinton, W. L., Gharedaghloo, B., Lennartz, B., Price, J., et al. (2020). Pore-scale controls on hydrological and geochemical processes in peat: implications on interacting processes. Earth-Science Rev. 207, 103227. doi:10.1016/j.earscirev.2020.103227
Okruszko, H. (1993). Transformation of fen-peat soils under the impact of draining. Zesz. Probl. Postępów Nauk. Rol. 406, 3–73.
Pastor, J., Solin, J., Bridgham, S., Updegraff, K., Harth, C., Weishampel, P., et al. (2003). Global warming and the export of dissolved organic carbon from boreal peatlands. Oikos 100, 380–386. doi:10.1034/j.1600-0706.2003.11774.x
Quinton, W. L., Hayashi, M., and Carey, S. K. (2008). Peat hydraulic conductivity in cold regions and its relation to pore size and geometry. Hydrol. Process. 22, 2829–2837. doi:10.1002/hyp.7027
Rezanezhad, F., Price, J. S., Quinton, W. L., Lennartz, B., Milojevic, T., and van Cappellen, P. (2016). Structure of peat soils and implications for water storage, flow and solute transport: a review update for geochemists. Chem. Geol. 429, 75–84. doi:10.1016/j.chemgeo.2016.03.010
Rezanezhad, F., Quinton, W. L., Price, J. S., Elliot, T. R., Elrick, D., and Shook, K. R. (2010). Influence of pore size and geometry on peat unsaturated hydraulic conductivity computed from 3D computed tomography image analysis. Hydrol. Process. 24, 2983–2994. doi:10.1002/hyp.7709
Rosset, T., Binet, S., Rigal, F., and Gandois, L. (2022). Peatland dissolved organic carbon export to surface waters: global significance and effects of anthropogenic disturbance. Geophys. Res. Lett. 49, e2021GL096616. doi:10.1029/2021GL096616
Schwalm, M., and Zeitz, J. (2015). Concentrations of dissolved organic carbon in peat soils as influenced by land use and site characteristics — a lysimeter study. CATENA 127, 72–79. doi:10.1016/j.catena.2014.12.007
Selle, B., Knorr, K.-H., and Lischeid, G. (2019). Mobilisation and transport of dissolved organic carbon and iron in peat catchments-insights from the lehstenbach stream in Germany using generalised additive models. Hydrol. Process. 33, 3213–3225. doi:10.1002/hyp.13552
Stutter, M. I., Lumsdon, D. G., and Thoss, V. (2007). Physico-chemical and biological controls on dissolved organic matter in peat aggregate columns. Eur. J. Soil Sci. 58, 646–657. doi:10.1111/j.1365-2389.2006.00851.x
Tassinari, D., Soares, P. G. S., Costa, C. R., Barral, U. M., Horák-Terra, I., Silva, A. C., et al. (2022). Water retention and pore size distribution in organic soils from tropical Mountain peatlands under forest and grassland. Mires Peat 28, 12. doi:10.19189/MaP.2022.OMB.StA.2374
von Post, L. (1922). Sveriges geologiska undersöknings torvinvenstering och några av dess hittills vaanna resultant. Sven. Mosskulturfören. Tidskr. 36, 1.
Walczak, R., Rovdan, E., and Witkowska-Walczak, B. (2002). Water retention characteristics of peat and sand mixtures. Int. Agrophysics 16, 161–165.
Wallor, E., Rosskopf, N., and Zeitz, J. (2018). Hydraulic properties of drained and cultivated fen soils part I - horizon-based evaluation of Van genuchten parameters considering the state of moorsh-forming process. Geoderma 313, 69–81. doi:10.1016/j.geoderma.2017.10.026
Wang, M., Liu, H., and Lennartz, B. (2021). Small-scale spatial variability of hydro-physical properties of natural and degraded peat soils. Geoderma 399, 115123. doi:10.1016/j.geoderma.2021.115123
Weber, T. K. D., Iden, S. C., and Durner, W. (2017). A pore-size classification for peat bogs derived from unsaturated hydraulic properties. Hydrology Earth Syst. Sci. 21, 6185–6200. doi:10.5194/hess-21-6185-2017
Zak, D., and Gelbrecht, J. (2007). The mobilisation of phosphorus, organic carbon and ammonium in the initial stage of fen rewetting (A case study from NE Germany). Biogeochemistry 85, 141–151. doi:10.1007/s10533-007-9122-2
Keywords: peatland, dissolved organic carbon, macropore, mesopore, bulk density, rewetting
Citation: Cambinda RT, Liu H and Lennartz B (2025) The pore-class dependent concentration of DOC in degraded fen peat soils. Front. Environ. Sci. 13:1634070. doi: 10.3389/fenvs.2025.1634070
Received: 23 May 2025; Accepted: 11 July 2025;
Published: 24 July 2025.
Edited by:
Valerie Pot, INRA Centre Versailles-Grignon, FranceReviewed by:
Mingzhi Lu, Northeast Normal University, ChinaMariano Santiago Iseas, University of Buenos Aires, Argentina
Copyright © 2025 Cambinda, Liu and Lennartz. This is an open-access article distributed under the terms of the Creative Commons Attribution License (CC BY). The use, distribution or reproduction in other forums is permitted, provided the original author(s) and the copyright owner(s) are credited and that the original publication in this journal is cited, in accordance with accepted academic practice. No use, distribution or reproduction is permitted which does not comply with these terms.
*Correspondence: Rosa Tiimuma Cambinda, cm9zYS5jYW1iaW5kYUB1bmktcm9zdG9jay5kZQ==, dGlpbXVtYUBvdXRsb29rLmNvbQ==