 Mona S. Ramadan
 Aqil Tariq
 Hazem Ghassan Abdo
 Naeema Al Hosani1
- 1Geography and Urban Sustainability Department, College of Humanities & Social Sciences, UAE University, Al Ain, United Arab Emirates
- 2Department of Wildlife, Fisheries and Aquaculture, College of Forest Resources, Mississippi State University, Starkville, MS, United States
- 3National Institute of Oceanography and Applied Geophysics (OGS), Udine, Italy
Urban expansion and land cover changes significantly influence land surface temperature (LST), especially in arid environments. This study investigates spatial and temporal patterns of land cover and LST across Abu Dhabi, UAE, for the benchmark years 2017, 2020, and 2024, using Sentinel-2 imagery and MODIS thermal data via Google Earth Engine (GEE). Four dominant land cover classes were mapped: bare desert, urban areas, vegetation, and water bodies. Between 2017 and 2024, bare desert coverage declined from 92.8% to 90.9%, while urban land grew from 3.0% to 4.5%, vegetation increased from 3.3% to 4.1%, and water decreased from 0.9% to 0.5%. Thermal analysis based on MODIS summer composites revealed that 2020 was the hottest year, with an average LST of 53.14 °C , higher than 2017 (52.40 °C) despite COVID-19 mobility restrictions, likely due to extreme heat and atmospheric conditions. These values reflect emirate-wide averages, aggregated across all land cover types. By 2024, average LST declined to 48.76 °C, coinciding with expanded vegetation and milder summer temperatures. The observed 3.6 °C reduction may reflect both climatic moderation and land cover transformations. LST comparisons across land cover types showed a consistent thermal hierarchy: bare desert exhibited the highest surface temperatures, followed by urban areas, vegetation, and water bodies. These results highlight the cooling role of green infrastructure in hyper-arid cities. The findings contribute to Sustainable Development Goals (SDGs) 11, 13, and 15 by providing geospatial insights for sustainable land management and urban climate resilience.
1 Introduction
Land cover land cover transformations in arid urban areas carry significant environmental and socio-economic consequences. As cities expand into desert terrains, they disrupt natural surface energy balances, potentially intensifying or even reversing the urban heat island (UHI) phenomenon (Al Blooshi et al., 2020). Globally, converting natural landscapes into built environments typically raises urban temperatures due to heat retention by impervious surfaces (Vujovic et al., 2021). However, in hot desert cities like those across the Arabian Peninsula, an inverted UHI pattern may emerge during the day, with urban centers appearing cooler than the adjacent barren lands. This reversal is driven by factors such as urban irrigation, vegetation presence, and higher thermal inertia in cities, all of which moderate daytime heat, unlike the rapidly heating, sparsely vegetated desert soil.
Understanding these dynamics is crucial for advancing sustainable urban development aligned with global climate objectives. Changes in land cover directly impact land surface temperature (LST), as different surface materials and vegetation types exhibit distinct thermal characteristics and evapotranspiration rates, leading to varied surface heating. Past research consistently shows that barren or minimally vegetated areas reach the highest daytime LSTs, followed by urban spaces, with vegetated zones and water bodies being the coolest. For example, (El Kenawy et al., 2019), noted that in an Egyptian desert setting, bare land exhibited mean LSTs exceeding 42 °C hotter than urban zones and significantly hotter than irrigated fields or water surfaces. High-density built-up regions tend to be warmer than vegetated ones due to lower reflectivity and reduced cooling via evapotranspiration (Ramadan M. et al., 2024). However, urban green spaces and water bodies can effectively alleviate such heating, especially in extreme arid climates where landscaped cities may become thermal oases amid scorching deserts (Ramadan et al., 2025).
Cities like Abu Dhabi often exhibit this daytime inverted UHI effect (Lazzarini et al., 2013). reported that in Abu Dhabi, central urban areas were 5–6 K cooler than the surrounding desert during summer days, although this flipped at night when urban zones became 2–3 K warmer. The daytime cooling is attributed to irrigated green areas, shading from structures, and coastal breezes, in contrast to the intense heat absorption by dry sand in the desert. Yet, as cities expand and more built-up zones emerge alongside new green areas, these temperature patterns may shift (Taiema and Ramadan, 2021). Thus, ongoing Land Cover and LST monitoring is essential to determine whether urban growth is easing or worsening heat stress.
Satellite remote sensing offers an efficient approach to track Land Cover changes and LST variations across large regions. High-resolution imagery from platforms like Sentinel-2 allows precise land cover classification, while thermal data from sensors like MODIS and Landsat TIRS provide valuable surface temperature readings. Google Earth Engine (GEE) streamlines the processing of these extensive datasets, enabling fast and scalable multi-temporal analyses for researchers and planners (Gorelick et al., 2017). Leveraging GEE’s cloud-based processing and satellite archives supports robust assessments of land change impacts on the environment at scale.
The year 2020 presented a unique context with the COVID-19 pandemic, which temporarily curtailed traffic and industrial activities due to lockdowns. In the UAE, this led to enhanced air quality and a decrease in UHI intensity during lockdown months (Alqasemi et al., 2021). Reported an approximate 19% reduction in urban–rural LST differences between April and June 2020 compared to 2019, attributing this to lower anthropogenic heat and emissions. However, the impact on overall LST in arid environments remains complex, as reduced human activity coincided with one of the hottest years globally (Tewari and Srivastava, 2023). The net effect on Abu Dhabi’s LST during this period remains an open question.
Investigating Abu Dhabi’s land cover and thermal dynamics contributes directly to several Sustainable Development Goals. SDG 11 (Sustainable Cities and Communities) emphasizes the need for urban areas to be safe, resilient, and climate-adaptive, particularly through strategies like urban greening. SDG 13 (Climate Action) underscores preparing for extreme climate events, while SDG 15 (Life on Land) supports sustainable land cover and combating desertification. This study aims to provide evidence-based insights to guide climate adaptation and urban planning in rapidly evolving desert environments.
Despite increasing attention to Land Cover and UHI research in the Arabian Gulf, recent high-resolution analyses for the broader Abu Dhabi Emirate remain limited. Many past studies relied on older Landsat datasets or focused narrowly on urban cores without linking them to broader land cover dynamics (Sultan et al., 2024). This research addresses that gap by offering a comprehensive assessment of Land Cover and LST changes in Abu Dhabi from 2017 to 2024. Through advanced Earth observation combining Sentinel-2 imagery and MODIS thermal data processed via GEE. We evaluate changes at multiple time intervals. The key objectives are: (1) to classify major Land Cover types in Abu Dhabi for the years 2017, 2020, and 2024, assessing spatial shifts and area changes; (2) to analyze temporal variations in land surface temperature during this period; and (3) to explore how changes in land cover, such as urban sprawl or increased vegetation, influence LST patterns. This work seeks to shed light on how development and land management practices affect environmental conditions in arid cities.
This study offers several methodological and contextual contributions. First, it applies a multi-year analysis of Land Cover and LST interactions across three benchmark years (2017, 2020, 2024), with a special focus on the anomalous dynamics of the 2020 pandemic year. Second, the study combines high-resolution Sentinel-2 Land Cover classifications with MODIS-derived LST data using Google Earth Engine, while addressing spatial scale mismatches through aggregation and sensitivity testing. Third, it explores the inverse relationship between NDVI and LST as a thermal mitigation indicator and evaluates Surface Urban Heat Island Intensity (SUHII) across different urban zones. Together, these elements provide a reproducible, scalable framework for urban climate monitoring and land-based adaptation planning in arid regions, with implications for SDG-aligned policymaking in the Gulf context.
2 Study area
Abu Dhabi Emirate, the largest of the seven emirates in the United Arab Emirates, spans approximately 66,300 km2 accounting for nearly 87% of the country’s total land area. Situated within the hyper-arid zone of the Arabian Peninsula, it stretches between latitudes 22.5°–26.1° N and longitudes 51°–56.3° E. The region experiences an extremely arid climate, marked by scorching summer temperatures ranging from 40 °C to 50 °C during the day, mild winters, and minimal annual rainfall (typically less than 100 mm) (Wehbe et al., 2017).
The emirate’s landscape is diverse, comprising expansive desert areas including sand dunes and sabkha (salt flats), scattered agricultural zones and oases like the Liwa Oasis in the south, rapidly growing urban centers along the coastline (notably the Abu Dhabi metropolitan area), and ecologically important coastal zones featuring mangroves and shallow gulf waters (Ramadan M. S. et al., 2024). The study area, illustrated in Figure 1, covers the entire emirate. As of 2020, Abu Dhabi had an estimated population of 3.4 million, primarily concentrated in the city of Abu Dhabi and the Al Ain region in the east. In contrast, the vast Al Dhafra region to the south and west remains sparsely inhabited. This stark contrast between densely developed urban/coastal regions and surrounding desert landscapes highlights the significance of environmental transitions.
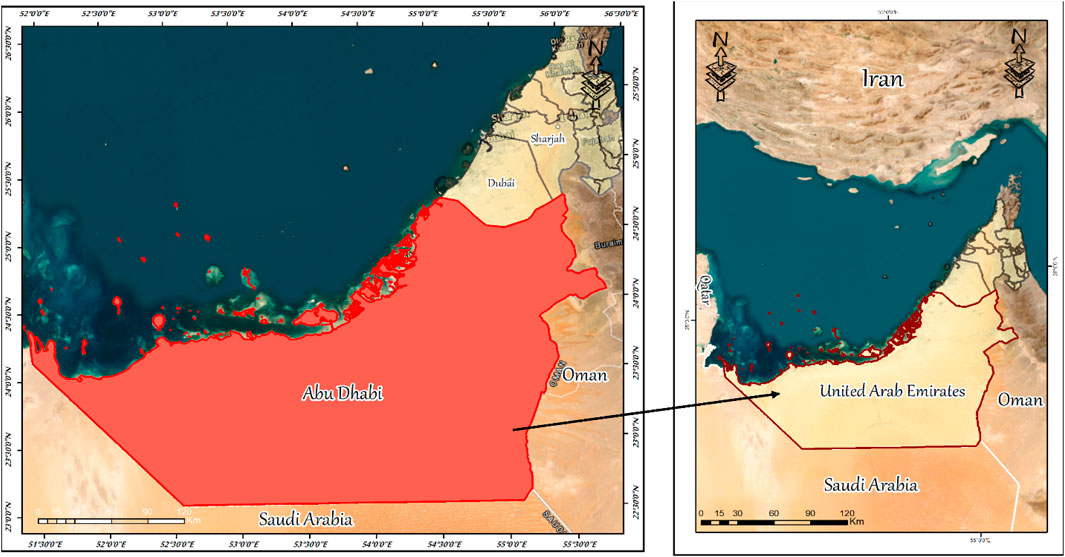
Figure 1. Location of the study area.
Urban greenery such as parks and roadside vegetation as well as large-scale afforestation projects in desert areas have become integral to Abu Dhabi’s land cover planning. These initiatives, along with substantial urban, industrial, agricultural, and infrastructure development in recent decades, have significantly reshaped the emirate’s terrain. Understanding how these transformations affect land cover and land surface temperature is essential for effective resource management and the promotion of sustainable urban growth across the emirate.
3 Materials and methods
To clearly illustrate the methodological approach employed in this study, Figure 2 presents a schematic workflow. This diagram encapsulates the complete sequence of steps ranging from the selection and preprocessing of satellite imagery to classification, LST extraction, and the final analytical procedures conducted within the Google Earth Engine platform.
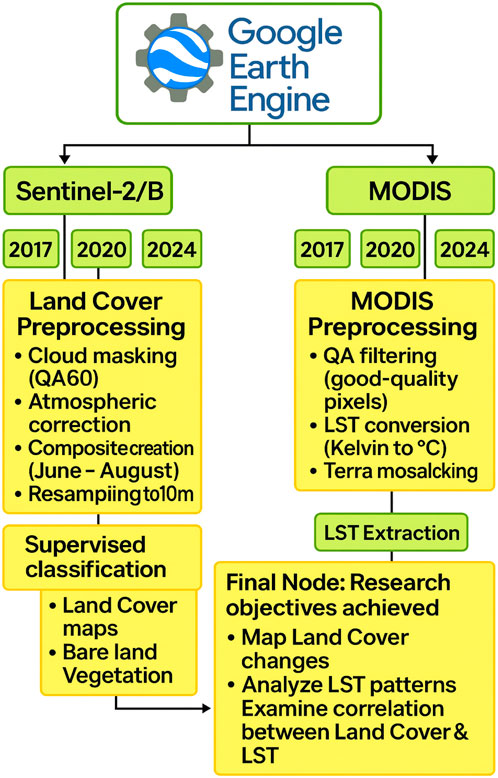
Figure 2. Schematic representation of the methodological workflow for the spatiotemporal analysis of land cover and land surface temperature in Abu Dhabi, utilizing Sentinel-2 and MODIS datasets within Google Earth Engine (GEE).
3.1 Data collection
Multi-temporal datasets were sourced from two primary satellite systems (outlined in Table 1): Sentinel-2 for optical land cover classification and MODIS Terra for thermal infrared measurements. All datasets were accessed and processed via Google Earth Engine (Gorelick et al., 2017). Operated by the European Space Agency (ESA), Sentinel-2A and 2B provide multispectral imagery at 10–20 m spatial resolution across visible, near-infrared (NIR), and shortwave infrared (SWIR) bands. Level-2A surface reflectance data, already atmospherically corrected using the Sen2Cor processor, were utilized for this study (Phiri et al., 2020). Cloud-free or minimally cloudy composite images from Sentinel-2 were selected for the years 2017, 2020, and 2024, focused around the summer months (June to August) to capture peak seasonal heating and vegetation growth. Within GEE, imagery was filtered by acquisition date and cloud coverage (using QA60 masks), and median composites were generated per year to minimize cloud interference. All relevant Sentinel-2 spectral bands were used, including visible bands (Blue, Green, Red at 10 m), NIR (10 m), SWIR (20 m), and red-edge bands (20 m), aiding in the differentiation of vegetation and built-up areas (see Table 1 for details). These composites were resampled to a unified 10 m resolution for classification purposes.
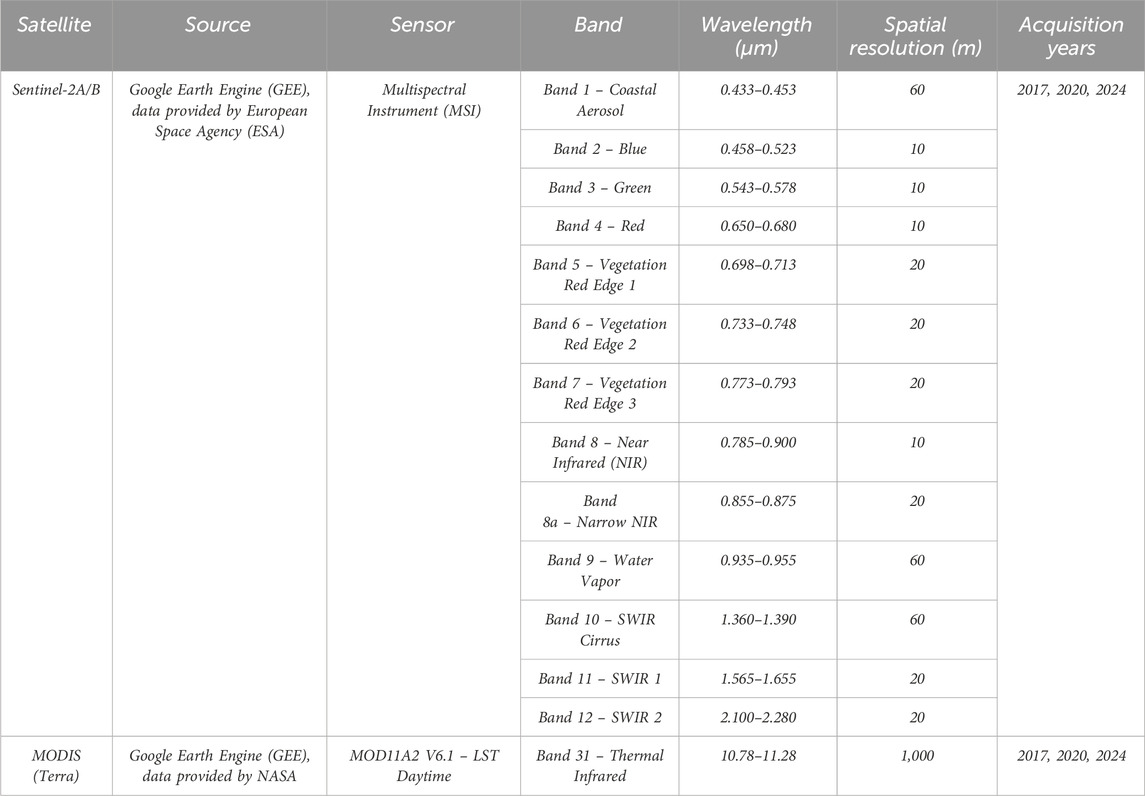
Table 1. Technical and spectral specifications of the satellites used.
For surface temperature analysis, we utilized MODIS Land Surface Temperature (LST) data from the Terra satellite, specifically the MOD11A2 Version 6.1 product, which offers 8-day composite daytime LST measurements at a 1 km spatial resolution. The Terra platform has a nominal overpass time of approximately 10:30 a.m. local time. We chose Terra only to maintain temporal consistency across years and avoid potential mismatches from combining Terra and Aqua. The 8-day composites were retrieved via Google Earth Engine (GEE) for June and August of 2017, 2020, and 2024, representing peak summer conditions in the study area. We applied the provided quality assurance (QA) flags to exclude cloudy or low-quality pixels, ensuring that only reliable LST observations were included. Although MODIS spatial resolution is coarser than Sentinel-2, it remains sufficient to detect large-scale thermal patterns between built-up and desert environments, which aligns with the study’s focus on macro-scale trends across the emirate.
3.2 Preprocessing steps
All satellite datasets were appropriately transformed into top-of-atmosphere reflectance (for Sentinel-2) or brightness temperature (for MODIS), as required. Atmospheric correction for Sentinel-2 imagery was carried out using the Sen2Cor algorithm within the Google Earth Engine (GEE) environment. To support land cover classification, indices such as the Normalized Difference Vegetation Index (NDVI) and the Normalized Difference Water Index (NDWI) were computed. NDVI, derived using the formula:
was employed to detect vegetated regions due to its high responsiveness to chlorophyll levels and vegetation density (Xue and Su, 2017). Meanwhile, NDWI, calculated as:
Served to identify water bodies and evaluate surface moisture, given its efficiency in differentiating water from other land cover types. MODIS LST data, initially in Kelvin, were converted to degrees Celsius. All datasets were harmonized to a unified coordinate reference system (WGS84/UTM Zone 40N), ensuring consistent pixel alignment. A land-sea mask was also implemented to limit the analysis to terrestrial zones within the emirate, with coastal waters explicitly classified as “Water.”
3.3 Land cover classification
To represent Abu Dhabi’s landscape accurately, we categorized the land into four key Land Cover types: (1) Bare land/Desert–including sand dunes, exposed soil, rocky terrain, and uncultivated salt flats (sabkha), (2) Urban/Built-up–covering cities, infrastructure, roads, and industrial zones, (3) Vegetation–consisting of areas with substantial plant coverage such as farms, landscaped zones, forests, grassy patches, and mangroves, and (4) Water bodies–encompassing both coastal seawater and any inland water sources, such as reservoirs. These categories were selected to capture the major land cover types that exhibit distinct thermal properties. Classification was carried out using a supervised machine learning approach based on Sentinel-2 composite images.
Training data for each category were compiled using a combination of expert field knowledge, high-resolution imagery from Google Earth, and supplementary land cover datasets provided by local authorities. For each land cover class, approximately 100–150 labeled polygons were collected, ensuring representation across various locations in the emirate. For example, urban areas were sampled from both central Abu Dhabi and surrounding towns, while vegetation was sampled from diverse agricultural and green areas. Each class demonstrated clear spectral patterns: urban zones typically reflected strongly in visible and SWIR bands (due to concrete and structures) but had low vegetation index values; vegetation was distinguishable by high NDVI and pronounced red-edge responses; water showed very low reflectance and strong NDWI signals; and bare desert areas reflected heavily in the red and SWIR spectrum but had weak NIR and NDVI values. These spectral differences supported reliable classification outcomes.
Using the compiled training samples, classification was performed on the GEE platform utilizing a Random Forest (RF) algorithm, known for its effectiveness in arid region Land Cover mapping (Belgiu and Drăguţ, 2016; Sultan et al., 2024). The Random Forest classifier was implemented with 100 trees and a maximum depth of 25. The feature set included Sentinel-2 bands 2 (Blue), 3 (Green), 4 (Red), 8 (NIR), 11 (SWIR 1), and 12 (SWIR 2), as well as two indices: NDVI and NDBI, enhancing discrimination between vegetation and built-up areas. A 70/30 training-to-validation split was used, with independent training datasets generated separately for each study year (2017, 2020, and 2024) to ensure model adaptability to changing land dynamics.
The model was initially trained using the 2017 composite and then applied to classify the other 2 years. The assumption was that the spectral traits of land cover types remained relatively stable; however, to ensure year-specific accuracy, we did not reuse the same training set across years. Instead, we refined the classifications for 2020 and 2024 by generating independent, additional training samples for each respective year, especially targeting areas with new urban development or recent vegetation growth. This hybrid approach ensured consistency across years while avoiding data leakage. The final outputs consisted of high-resolution (10 m) land cover maps for each of the 3 years. A 3 x 3 mode filter was used post-classification to reduce isolated pixel-level noise and misclassifications.
3.4 Accuracy evaluation
To ensure classification reliability, accuracy was measured through confusion matrices and independent validation samples. For each year, a stratified random set of 200 points was manually validated using high-resolution imagery. All maps achieved overall accuracy above 88% (see Table 2). Specifically, the 2017 map achieved 88.8% accuracy (Kappa 0.85), while the 2024 classification reached 93.5% (Kappa 0.91), reflecting improvements in both training data and image quality.
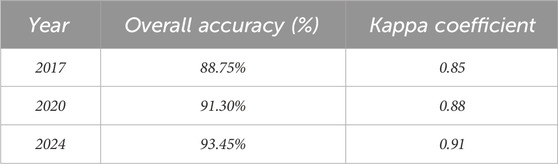
Table 2. Accuracy assessment of land cover classification for 2017, 2020, and 2024.
Per-class classification performance was evaluated and confirmed to be consistent with standard expectations in arid-region Land Cover mapping. The most common classification errors were between Vegetation and Bare land in transitional areas (e.g., sparse shrubs being misclassified), and between Urban and Bare land at urban edges. Water bodies, due to their unique spectral features, were classified with nearly 100% user’s accuracy. These performance metrics align well with other remote sensing applications in arid environments (Stehman and Foody, 2019), confirming the validity of the maps for further analysis.
3.5 Land surface temperature retrieval
To assess surface temperature patterns within the study region, we utilized thermal imagery from the MODIS Terra satellite. Two approaches were initially considered: (1) relying on the standard MODIS LST product, which applies a generalized split-window algorithm with preset coefficients; and (2) a custom implementation of the split-window method. After evaluation, we selected the validated MOD11A2 Land Surface Temperature (LST) dataset available on Google Earth Engine (GEE), which is pre-processed for atmospheric correction and surface emissivity using well-established calibration parameters (Wan, 2014; Wan, 2014). This product provides 8-day composites of daytime LST at a spatial resolution of 1 km, with overpass times around 10:30 a.m. local time.
For each benchmark year (2017, 2020, and 2024), we focused on the summer months (June through August) to capture peak thermal conditions. The average daytime LST was calculated by aggregating the MOD11A2 images within this period, and we additionally computed the maximum summer temperature per pixel to assess extreme heat conditions. This seasonal averaging approach helped reduce short-term variability while highlighting meaningful spatial heat distribution patterns.
To mitigate atmospheric interference such as cloud cover or dust, we applied MODIS-provided quality assurance (QA) bitmasks to filter out low-confidence pixels. Only clear-sky observations were retained, ensuring the reliability of the derived thermal patterns. Fortunately, Abu Dhabi typically experiences minimal cloud coverage in the summer, so most pixels passed the QA filtering process. Spatial inspection of the resulting LST maps showed high consistency and realistic thermal gradients across the study area.
For further validation, MODIS-derived LST from the 2017 dataset was compared with coinciding temperature outputs from Landsat-8’s Thermal Infrared Sensor (TIRS), using a basic radiative transfer model over selected zones. Results showed strong agreement, with average deviations within ±2 °C, supporting the suitability of MODIS for broader-scale thermal analysis in arid environments. We note that this validation was indicative only; detailed statistical metrics (e.g., R2, MAE) were beyond the present scope but are recommended for future research.
To reconcile the spatial resolution mismatch between MODIS LST (1 km) and Sentinel-2 Land Cover maps (10 m), the classified land cover data were aggregated using a majority voting scheme. Each 1 km MODIS pixel was assigned the dominant land cover class present within its extent. This resampling approach ensured spatial alignment for subsequent LST–Land Cover overlay analysis.
To address potential aggregation bias and the Modifiable Areal Unit Problem (MAUP), a sensitivity test was conducted by excluding pixels where no single land cover class exceeded 60% coverage. The resulting changes in average LST values across land cover types were minimal (typically <2%), indicating the robustness of the spatial integration process.
Once validated and aligned, the MODIS LST data were used to examine how surface temperatures varied across land cover types. Using the Land Cover classification results, we extracted the mean and standard deviation of LST for each land class and each year. This enabled us to monitor how urban, vegetated, bare land, and water areas responded thermally over time (see Table 5), identifying possible warming or cooling trends and linking them to land management dynamics.
3.6 Data integration and analysis
With both Land Cover and LST datasets properly aligned, a comprehensive analysis was conducted. The first step involved evaluating land cover changes between 2017 and 2024 by calculating the net area variation for each class and visualizing spatial transformation patterns. This was achieved through a cross-tabulation of land cover classifications over the years and mapping where shifts occurred. Key areas of interest included the spread of urbanization commonly marked by desert land being converted into built environments and greening initiatives where previously barren land was transformed into vegetated zones through farming or landscaping efforts.
We then focused on the spatial distribution of surface temperature (see Figure 5). Thermal patterns were reviewed qualitatively by pinpointing heat-intensive and cooler zones, and quantitatively by summarizing the range of LST values (Table 6). To understand how specific land cover types correlate with temperature levels, we overlaid the classified LAND COVER boundaries onto LST maps. This enabled both visual interpretation and statistical assessment of thermal behavior across different land types (Al-Ruzouq et al., 2022). For instance, urban regions were anticipated to appear cooler than adjacent desert areas during the day, and this assumption was verified across the temporal dataset.
Subsequently, we examined temperature changes over the years. A core objective was to determine whether average LST had increased or decreased between 2017 and 2024, considering the backdrop of climate change and local land development. Since 2020 was an atypical year impacted by pandemic lockdowns and unprecedented global temperatures, it was separately analyzed to identify anomalies. We plotted average LST values across the emirate for each year and also segmented the results by land cover type using data from Table 5 to identify trends over time.
The final stage assessed the interaction between land cover transitions and thermal shifts. We explored whether newly urbanized zones experienced temperature rises or declines and whether areas that became vegetated contributed to localized cooling. To approximate the Surface Urban Heat Island Intensity (SUHII), we calculated the difference in average LST between urban zones and adjacent bare land using concentric buffer zones as a rural reference. Buffer distances were set incrementally around urban clusters, but the analysis is presented here as an indicative comparison rather than a fully parameterized statistical design. This provided a consistent benchmark for evaluating relative thermal behavior across cities. Results suggested a persistent daytime urban cooling pattern across most urban clusters, potentially influenced by irrigation practices, surface reflectivity, and organized landscaping schemes.
Furthermore, a comparative evaluation of vegetation cover (NDVI) and land surface temperature (LST) across the study years revealed a consistent negative spatial association. Areas with higher vegetation density especially agricultural lands and green urban spaces tended to exhibit cooler surface temperatures compared to neighboring barren regions. This observed trend aligns with the widely recognized cooling function of vegetation in arid environments, where plant cover promotes evapotranspiration and moderates surface heating.
All data processing tasks and analyses were performed within the Google Earth Engine platform, with supplemental geographic visualization completed using local GIS tools. Although detailed statistical modeling and meteorological normalization were beyond the present study’s scope, the spatial overlays between NDVI and LST consistently illustrated an inverse relationship across the emirate. These qualitative patterns underscore the importance of vegetation in heat mitigation and highlight the potential of land cover planning as a climate adaptation strategy in hyper-arid urban regions.
3.7 Comparative advantage of GEE over traditional GIS platforms
This study highlights the distinct advantages of using Google Earth Engine (GEE) over conventional GIS platforms for large-scale environmental analysis. GEE’s cloud-based processing capabilities offer remarkable scalability, enabling users to work with multi-temporal satellite imagery and extensive geographic datasets without the constraints of local computing power (Amani et al., 2020). Unlike desktop-based tools like ArcGIS or QGIS which require manual data downloads, storage, and processing GEE streamlines workflows through code-driven automation, real-time access to global data archives, and built-in functions for classification, visualization, and time-series analysis. This makes it particularly well-suited for longitudinal and region-wide studies, such as monitoring urban expansion or assessing climate adaptation. However, GEE’s reliance on internet access and coding proficiency may limit its accessibility for some users. Addressing this gap through hybrid toolkits or targeted training programs could broaden its utility across institutional and geographic contexts.
4 Results and discussion
4.1 Land cover dynamics (2017–2024)
4.1.1 Overall land cover composition
km2 (92.8%) of the emirate’s land area (Table 3). By 2024, this had slightly declined to 60,300 km2 (90.9%), signifying a gradual shift of barren land into alternative uses. The built-up urban footprint increased significantly during this period from about 2,000 km2 (3.0%) in 2017 to nearly 3,000 km2 (4.5%) in 2024. This reflects a 50% expansion in urban areas over 7 years, largely fueled by ongoing construction, housing developments, and industrial expansion. Vegetation also showed a positive trend, growing from roughly 2,200 km2 (3.3%) in 2017 to 2,700 km2 (4.1%) in 2024. This increase stems from agricultural growth in oasis regions and enhanced landscaping projects, such as park development, roadside greenery, and mangrove restoration (Aljaddani et al., 2022). Water bodies, including coastal waters and artificial ponds, declined slightly from 600 km2 (0.9%) in 2017 to 300 km2 (0.5%) in 2024. This reduction may be attributed to coastal reclamation and changes in man-made water retention areas. The total land area assessed was consistently around 66,300 km2 across all years, confirming the stability of mapping procedures.
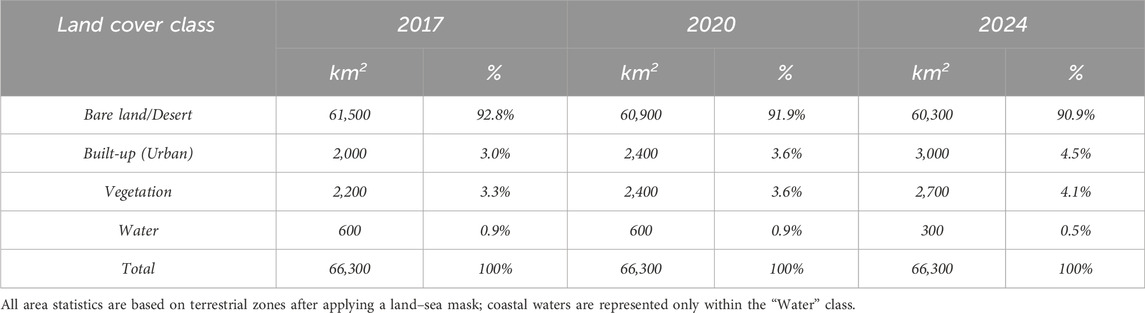
Table 3. Land cover class areas in Abu Dhabi for 2017, 2020, and 2024. (Areas in square kilometers and percentage of total land area, approx).
These findings highlight a mild yet noticeable transition from barren terrain to areas influenced by human activities. Combined, urban and vegetated zones grew from 6.3% in 2017 to 8.6% in 2024 of the emirate’s area over the studied timeframe. While desert still dominates, the expansion of human-managed land is evident. Similar conclusions were reached in national studies (Sultan et al., 2024), which observed that although desert areas still cover the majority of the UAE, developed and green zones have expanded significantly due to construction and environmental initiatives. Abu Dhabi’s development trajectory mirrors broader national trends toward urbanization and ecological enhancement.
4.1.2 Spatial patterns of transformation
The land cover maps for 2017, 2020, and 2024 (Figure 3) show clear patterns of urban and vegetative expansion. Urban development is mainly concentrated in the northeastern coastal corridor around Abu Dhabi city and near Al Ain in the east, with additional clusters along major transport routes. Vegetative growth appears near oases (notably Liwa in the south), farms in Al Ain, and as green patches in urban areas (e.g., city parks and shoreline mangroves). Desert regions still occupy most of the map in all years. By visually comparing the maps, it is clear that urban zones have pushed further into former desert edges, particularly around the Abu Dhabi metropolitan area. Al Ain also exhibits outward expansion. Vegetation has increased in density and distribution, notably through more intensive farming in Al Ain and the appearance of new plantations in western desert regions. Coastal waters appear broadly stable in extent on the maps, though the statistics indicate a net reduction by 2024, likely linked to coastal reclamation and changes in man-made water retention areas.
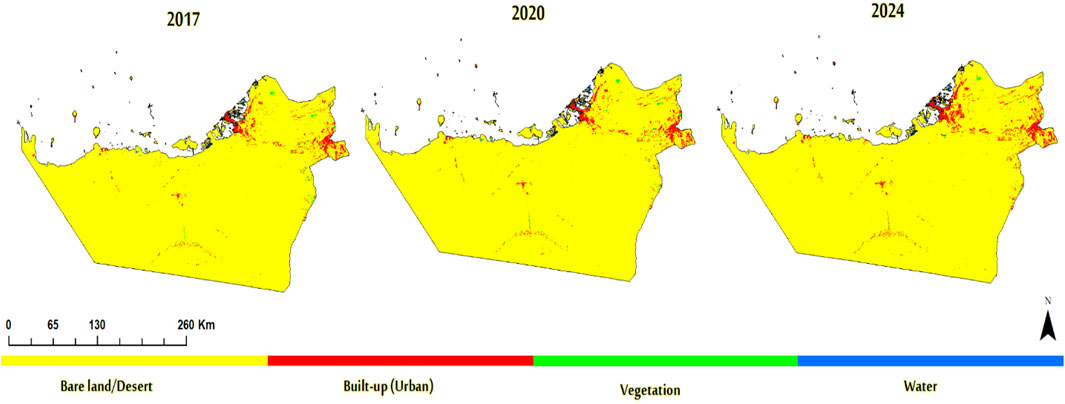
Figure 3. Land cover change in Abu Dhabi for 2017, 2020, and 2024.
4.1.3 Quantifying transitions (2017–2024)
Table 4 and Figure 4 present the detailed land cover transitions between the key intervals. Between 2017 and 2020, urban zones grew by around 400 km2 (an annual average of +133.3 km2), with this gain mainly resulting from a reduction in barren land (−600 km2 over 3 years). Vegetated areas also expanded by approximately 200 km2 (+66.7 km2 per year), again largely from desert conversion. Water zones remained stable during this period (0 km2 net change). Between 2020 and 2024, urban expansion accelerated, averaging +150 km2 annually (a total of +600 km2 over 4 years), while vegetation increased by roughly +75 km2 per year (+300 km2 overall). The rate of desert reduction slowed to about −150 km2 annually (−600 km2 in total). Meanwhile, water bodies declined more sharply, losing around −300 km2 overall (−75 km2 per year), likely linked to land reclamation projects and reductions in artificial ponds. These figures suggest that development activity picked up pace after a temporary slowdown in 2020, possibly tied to the pandemic, with growth surging again as construction and agricultural initiatives resumed.
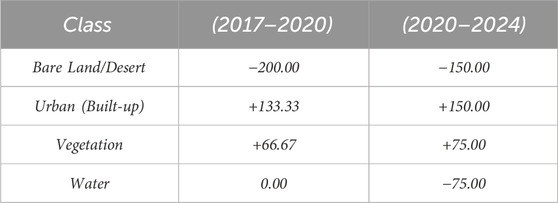
Table 4. Annual change (km2/year) in land cover classes.
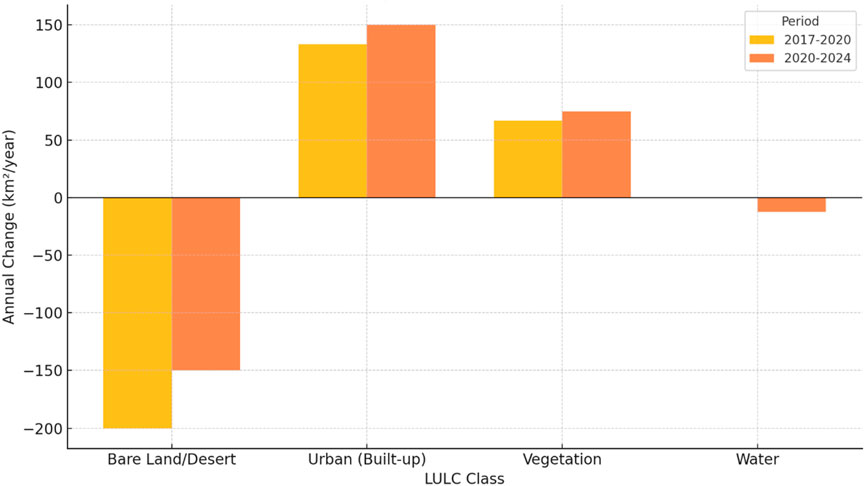
Figure 4. Annual change in land cover classes in Abu Dhabi for the periods 2017–2020 and 2020–2024.
4.1.4 Reliability of change detection
Classification accuracy, detailed in Table 2, provides further confidence in the observed land cover shifts. Kappa values ranging from 0.85 to 0.91 reflect strong consistency with reference data. Importantly, the classification methodology was applied uniformly across all years, minimizing potential inconsistencies. Therefore, even if minor underestimations exist (e.g., sparse vegetation misclassified), the observed trends are likely genuine. Field checks further confirmed the emergence of new farms, expanded irrigation schemes, and urban extensions, reinforcing confidence in the accuracy of mapped changes.
In summary, between 2017 and 2024, Abu Dhabi experienced steady land transformation marked by a 1,200 km2 reduction in barren desert, alongside significant urban expansion of about 1,000 km2 and vegetation gains of roughly 500 km2, while water bodies declined by around 300 km2. These developments continue a long-term pattern seen across the UAE, driven by investment in infrastructure, greening projects, and coastal reclamation. The observed changes are directly relevant to global sustainability goals, particularly SDG 11 (sustainable cities) and SDG 15 (land ecosystem conservation).
4.2 Land surface temperature patterns
4.2.1 Overall distribution of LST
The spatial distribution of surface temperature across Abu Dhabi presents a vivid thermal landscape. As depicted in Figure 5, the hottest zones correspond to the interior desert regions, particularly areas far from the sea’s moderating influence. The Rub’ al Khali (Empty Quarter) in the emirate’s southwest consistently exhibits the highest land surface temperatures (LST), often surpassing 55 °C during midday in summer. Conversely, urban environments and green areas stand out as noticeably cooler. The Abu Dhabi metropolitan area, situated along the coast, forms a visible cluster of pixels with lower LST compared to adjacent desert zones. Similar cooling effects are observed in Al Ain and in large cultivated zones, with many appearing in blue-green tones indicating lower temperatures compared to the orange-red shades of the hot desert. Coastal mangroves and water bodies are the coolest zones, often remaining under 40 °C, thanks to evaporative cooling and the thermal inertia of water. While coastal moderation likely contributes to lower LST in shoreline cities (e.g., Abu Dhabi Island), we note that inland urban clusters (e.g., Al Ain) also exhibit a relative daytime cool signal compared to surrounding desert, suggesting that urban form and greening play a role beyond coastal effects.
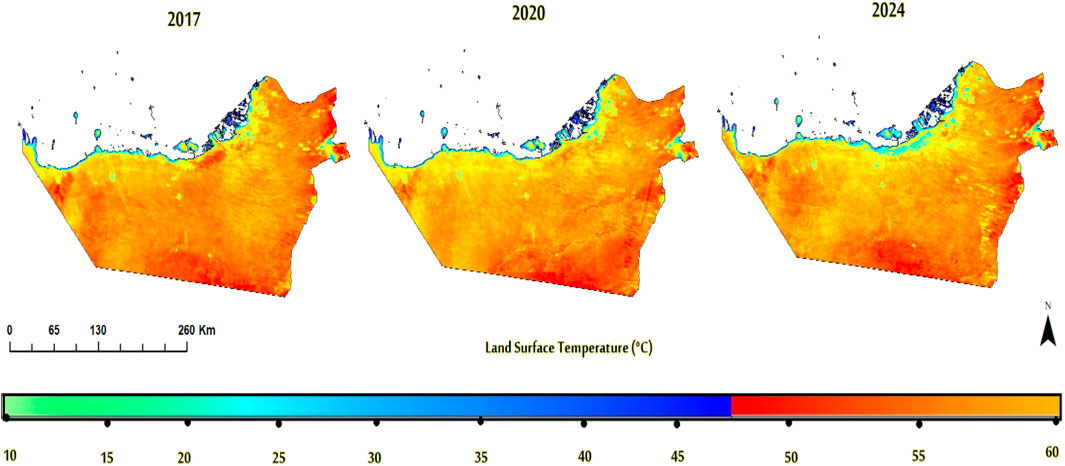
Figure 5. Spatial/temporal distribution of LST in Abu Dhabi for 2017, 2020, and 2024.
These patterns illustrate an atypical form of urban-rural thermal behavior. Rather than conventional urban heat islands (UHIs), a daytime “cool island” effect emerges urban areas are cooler than the surrounding desert. This thermal inversion is significant. Based on Table 5 and Figure 6, in 2017, the average LST for barren land was around 50.2 °C (±2.1), while urban zones averaged 42.1 °C (±3.0), resulting in an 8 °C difference. Vegetated regions were even cooler, averaging 36.5 °C (±3.5), nearly 14 °C lower than the desert. Water surfaces registered the lowest LST, at approximately 33.2 °C roughly 17 °C cooler than bare land. These disparities align with earlier research; for example, (El Kenawy et al., 2019), reported desert areas in Egypt being 5 °C–8 °C hotter than developed or vegetated sites, and (Lazzarini et al., 2013) observed downtown Abu Dhabi as 5 K cooler than adjacent desert suburbs. Our findings suggest even greater temperature differences, likely influenced by factors such as urban landscaping, building materials, high-albedo surfaces, and shading from infrastructure.
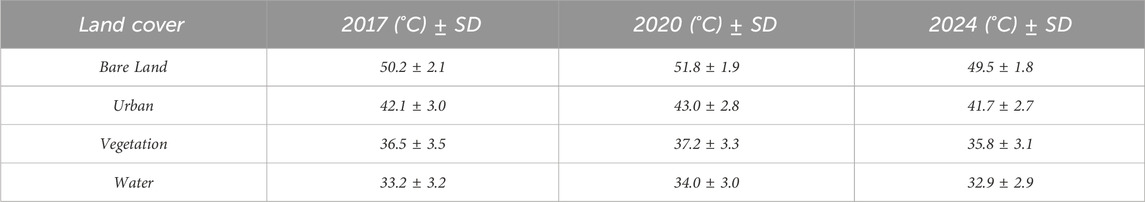
Table 5. Temporal changes in mean LST (°C) for different land cover classes in abu dhabi.
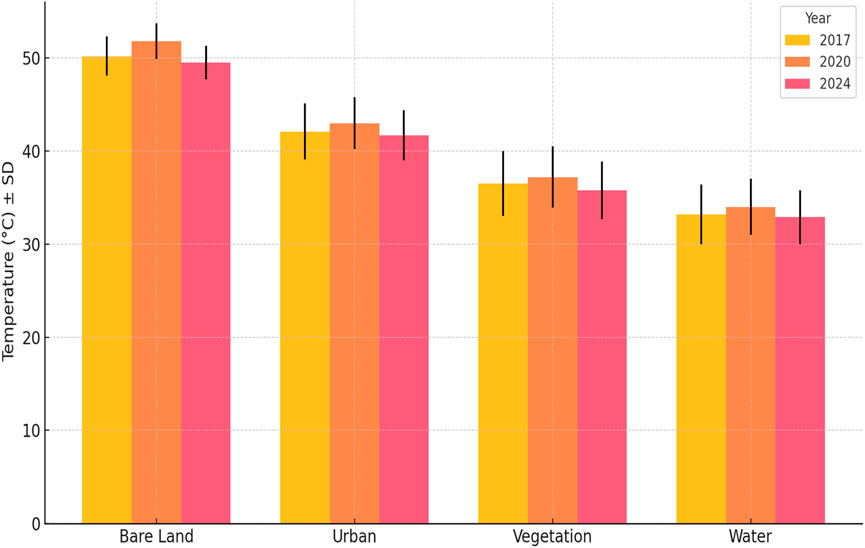
Figure 6. Mean land surface temperature and standard deviation by land cover class in Abu Dhabi for 2017, 2020, and 2024.
4.2.2 Temporal trends in surface temperature
The year 2020 emerges as the hottest in our temporal dataset. According to Table 6, the emirate’s average LST in 2020 reached 53.14 °C, with maximum values peaking at 57.5 °C. This surpasses the 2017 mean of 52.40 °C and reflects the influence of an intense summer season and broader global warming patterns. Notably, this increase occurred despite reduced anthropogenic activity due to COVID-19 lockdowns, underscoring the role of natural climatic forces. Reports from that period confirm record-breaking air temperatures in parts of the UAE, including 51.8 °C in Al Dhafra (June 2020) (Alqasemi et al., 2021). Our thermal imagery captures this anomaly clearly, emphasizing how extreme weather events can dominate short-term heat signatures.
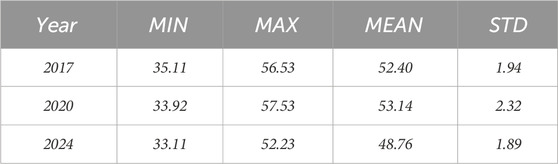
Table 6. Statistics of the different ranges of LST (°C).
By 2024, the average LST had declined significantly to 48.76 °C a reduction of approximately 3.6 °C compared to 2017. This cooling may reflect milder seasonal conditions, increased green cover, or a combination of both. With desert area decreasing by over 1,200 km2 between 2017 and 2024, and cooler land types expanding in its place, part of this temperature drop is likely land-use driven. Additional contributing factors could include differences in wind patterns, humidity, or cloud cover in 2024. While longer-term climate data would be needed to fully separate land cover impacts from weather variability, the correlation is strong enough to suggest that vegetation and urban expansion played a cooling role.
This consistent pattern temperature rising in 2020 and falling by 2024 across all classes supports the view that 2020 was an outlier due to climatic extremes, and that the subsequent cooling likely reflects a mix of environmental shifts and milder summer conditions. Interestingly, the standard deviation in LST also decreased across classes from 2017 to 2024 (e.g., bare land SD dropped from 2.1 to 1.8), indicating more thermal homogeneity within each class, possibly due to increased land cover consistency or redistribution of class boundaries into more climatically moderate zones.
4.2.3 Urban cool island effects and UHI dynamics
Our findings affirm that cities in Abu Dhabi function as daytime cool zones compared to the surrounding desert. However, this does not negate the occurrence of urban heat islands at night, when materials in built environments retain and slowly release heat. It is important to note that all results presented here are daytime-specific, and therefore nocturnal UHI dynamics and humidity effects are not captured in this analysis. While our study focuses on daytime satellite-based surface temperatures where contrasts are most visible, other investigations (Alqasemi et al., 2021) noted that UHI effects were less intense at night during 2020, likely due to decreased pollution and reduced human activity.
Interestingly, in our data, the urban cool effect slightly increased in 2020, despite expectations of lower anthropogenic heat. One might assume that less traffic and industrial activity would reduce city temperatures further. However, reduced irrigation and fewer operations of water features during lockdown might have offset cooling. Additionally, extreme ambient heat likely overwhelmed the minor decline in waste heat from human sources. Thus, cities still got hotter overall, but the desert surroundings heated up even more, maintaining or even widening the contrast.
By 2024, with normal urban activity resumed and vegetation expanded, the daytime cool island effect persisted. The mean LST gap between urban and desert zones was still close to 7.8 °C. This suggests that urbanization, in this context, is not exacerbating surface heat during the day. In fact, the replacement of bare, heat-intense sand with structured and often irrigated surfaces has helped moderate local temperatures. Still, for a full understanding of urban thermal comfort, night-time conditions and humidity levels would need to be considered alongside daytime surface temperature. While this pattern is partly shaped by site-specific factors such as coastal moderation, the persistence of a cool signal in inland cities like Al Ain supports the conclusion that urban form and greening contribute to daytime cooling beyond shoreline effects.
4.3 Impact of COVID-19 in 2020 on land cover and LST
The year 2020 stands out as a unique interval within the study period, offering a potential lens into how a global disruption like the COVID-19 pandemic may have influenced land cover and surface temperature patterns. In terms of land cover, the trends did not shift dramatically during 2020. Both urban and vegetated areas continued their expansion, albeit at slightly reduced annual rates compared to the period that followed (see Table 4). This suggests that the early impacts of the pandemic, particularly on construction and agriculture, may have momentarily slowed land transformation efforts. For instance, urban growth from 2017 to 2020 averaged around 133 km2 per year, whereas between 2020 and 2024, this figure rose to 150 km2 annually. Similarly, vegetation expanded at 66.7 km2 per year pre-2020, and 75 km2 per year afterward. These differences point to possible delays in development projects during 2020, with acceleration occurring post-pandemic. Nevertheless, the overall direction of change remained consistent, and any slowdown due to COVID-19 was modest and short-lived.
The more notable environmental effects of the pandemic particularly on-air quality and thermal dynamics were likely most pronounced during the strict lockdown period in early 2020 (April–May). While our analysis focuses on aggregated LST data for the summer months (June–August), which followed the relaxation of most movement restrictions, some residual thermal effects may still be detectable (Alqasemi et al., 2021). reported significant reductions in nitrogen dioxide (NO2) and aerosol concentrations over urban areas in the UAE during the lockdown, along with a roughly 19% decline in Surface Urban Heat Island Intensity (SUHII), defined as the temperature differential between urban and surrounding non-urban zones.
Interestingly, our dataset for summer 2020 shows that urban areas were approximately 8.8 °C cooler than surrounding land types (Table 5), a slightly larger contrast than in 2017, where the difference was 8.1 °C. While this observation appears counter to Alqasemi’s findings, the divergence is likely due to differences in spatial resolution, land cover definitions, and temporal windows. Our analysis captures broader seasonal averages across the entire emirate, whereas their study focused on more localized conditions during peak lockdown months. Additionally, the use of MODIS 1 km LST may smooth finer-scale thermal contrasts observed in higher-resolution data.
Closer inspection of the 2020 LST maps (Figure 5) reveals that some zones such as smaller settlements and farming areas registered slightly elevated temperatures compared to previous years. One plausible explanation is that reduced field activity or labor disruptions during lockdowns led to less frequent irrigation, resulting in plant stress or surface drying. As a result, these vegetated patches may have retained more heat. Conversely, major cities like Abu Dhabi probably maintained core services, including irrigation of green spaces, which helped preserve their relative coolness. Moreover, 2020 was characterized by exceptionally high solar radiation and ambient air temperatures (Tewari and Srivastava, 2023), which likely exerted a stronger influence on LST patterns than short-term emission reductions.
Thus, despite reduced human activity in early 2020, the summer months recorded the highest surface temperatures across the study period. This underscores the complex interplay between anthropogenic and natural drivers of urban thermal behavior. From the perspective of climate policy and adaptation (SDG 13), this finding highlights the need for sustained, long-term mitigation strategies such as expanding vegetative cover and improving land surface design, rather than relying on transient reductions in activity levels to influence urban heat patterns.
4.4 Relationship between land cover and LST
Our comprehensive analysis highlights a strong link between different land cover types and their corresponding surface temperatures, aligning with established theories and prior research. Vegetation notably exhibits a cooling influence, with higher NDVI values consistently associated with lower LST across all observed years (Yu et al., 2025). Between 2017 and 2024, an expansion in vegetated areas coincided with a modest overall temperature reduction counteracting the expected effects of global warming. For instance, newly cultivated farms in the western desert appear 5 °C–10 °C cooler than adjacent barren sand in the 2024 LST imagery. This directly illustrates how efforts under SDG 15 (Life on Land), such as combating desertification through planting, can help mitigate extreme heat locally, thereby supporting SDG 13 (Climate Action).
Urban zones in Abu Dhabi also generally exhibit cooler temperatures than surrounding bare land, a phenomenon extensively examined in our study. This trend is somewhat specific to the local context, as urban areas in temperate or tropical climates usually present higher temperatures than their vegetated counterparts (i.e., a positive Urban Heat Island effect). Here, however, an “urban cool island” forms due to the transition from sand to constructed surfaces and greenery. Most classified urban pixels combine structures, paved areas, landscaped vegetation, and trees. These contribute to a moderate surface reflectivity (many buildings have light-colored exteriors), some degree of evapotranspiration (due to irrigated landscaping), and proximity to coastal breezes all factors contributing to reduced LST (Al-Ruzouq et al., 2022). Still, variability exists within urban zones; dense city centers with high-rises are generally warmer than suburban neighborhoods with abundant gardens (Chakraborty and Lee, 2019). Our 1 km resolution LST data cannot fully capture such micro-variations, but higher-resolution imagery (e.g., Landsat’s 100 m TIR data) would likely reveal this urban thermal pattern where green spaces like parks and golf courses are the coolest, and dense commercial areas slightly warmer, though still cooler than deserts.
The desert or bare land category itself is heterogeneous, comprising sand dunes, rocky outcrops, and salt flats each with distinct thermal characteristics (e.g., moist sabkhas vs dry dunes). The 2 °C standard deviation in desert LST reflects this diversity. Nonetheless, deserts remain the warmest Land Cover type and the main source of regional heat. As desert coverage declines, regional temperatures are expected to decrease. Our findings support that a 1.8% reduction in desert area was associated with a 3.6 °C drop in area-weighted average LST from 2017 to 2024 though interannual climate variability also played a role.
Water bodies, though limited in coverage, are effective at cooling. Coastal waters around Abu Dhabi Island lower shoreline temperatures during the day, visible as an LST gradient from coast to inland. Artificial inland water features, like ponds on farms, also provide minor local cooling, although Abu Dhabi lacks large lakes.
These patterns offer practical insights, expanding vegetative cover via urban forests, agricultural initiatives, or green corridors is one of the most viable approaches to lowering surface temperatures and addressing extreme climate conditions. This strategy aligns with SDG 11 (sustainable cities). Urban planning should prioritize green infrastructure in new developments; otherwise, construction without greenery risks creating urban heat islands as intense as, or worse than, the desert. Fortunately, Abu Dhabi has historically incorporated greening measures, as reflected in its inverted UHI effect. Sustaining and enhancing these actions such as planting drought-resistant trees and maintaining park irrigation even in crises like pandemics will be crucial as the city grows. In contrast, developments without vegetation (e.g., large paved areas) should be avoided or mitigated with shading and reflective materials to prevent additional heat accumulation.
Finally, LST dynamics have implications for human heat stress. Although surface and air temperatures are distinct, cooler surfaces typically foster cooler surrounding air and greater thermal comfort, particularly during the day. Urban greenery contributes to shading and evaporative cooling at street level, enhancing comfort beyond what satellite LST measurements reveal. Therefore, lower urban surface temperatures likely translate into more livable conditions compared to desert areas even accounting for urban humidity. This links directly to SDG 11.7, which emphasizes access to safe, inclusive public spaces such as shaded parks in Abu Dhabi that offer essential refuge from extreme heat.
5 Sustainable Development Goals (SDGs) and implications
Our study yields several important insights for advancing sustainable development in arid urban environments:
• SDG 11 (Sustainable Cities and Communities): The absence of a daytime Urban Heat Island (UHI) effect despite urban expansion and the presence of localized cooling is a promising outcome (Saxena et al., 2024). It suggests that with thoughtful urban planning that incorporates green spaces and reflective materials, cities in desert climates can grow without exacerbating heat stress. Abu Dhabi serves as a model by prioritizing urban vegetation and efficient irrigation, a cooler microclimate can be achieved. To further align with SDG 11, urban planners should leverage land cover and thermal data to strategically locate new parks or install green roofs particularly in emerging hotspots (e.g., a warm industrial zone seen in the 2024 LST map may benefit from targeted tree planting). Maintaining urban coolness is also essential for public health and overall livability, both central to this SDG.
• SDG 13 (Climate Action): This research provides baseline information for climate adaptation planning. As the Gulf region faces intensifying heat due to climate change, expanding green cover and maintaining water features emerges as a viable mitigation strategy. These nature-based interventions directly support adaptation efforts under SDG 13. In addition, long-term LST monitoring offers a way to assess climate impacts. While the temperature dip in 2024 may reflect short-term variability rather than a sustained trend, continued satellite observation is essential to understand long-term patterns. This data can also help evaluate intervention outcomes (e.g., measuring how much urban LST dropped after planting one million trees). Furthermore, cooler city surfaces can reduce air conditioning use, cutting energy consumption and greenhouse gas emissions supporting climate mitigation goals.
• SDG 15 (Life on Land): Monitoring changes in land cover directly contributes to tracking SDG 15 indicators, such as land degradation neutrality. Abu Dhabi’s slight reduction in natural desert and corresponding increase in managed ecosystems (like farms and plantations) present both opportunities and challenges. While desert habitats may appear lifeless, they support uniquely adapted biodiversity that urban expansion could endanger. On the flip side, increased vegetation can enhance biomass and even attract new species such as migratory birds frequenting newly forested areas (Zhao and Yu, 2025). Sustainable land cover planning should seek to balance development with protection of desert ecosystems. Our maps can help pinpoint untouched versus altered areas, guiding conservation efforts. Moreover, greening initiatives also relate to desertification control under SDG 15 cooler, vegetated areas suggest better soil moisture and stability. However, care must be taken to manage water resources sustainably to prevent groundwater depletion.
this integrated assessment underscores that land cover management is pivotal to environmental sustainability in arid urban contexts. Abu Dhabi exemplifies how urban greening can mitigate heat, while also facing the challenge of managing surrounding hot desert expanses. Large-scale afforestation or other interventions might be required to reduce dust and surface heating. This research demonstrates how remote sensing and SDG frameworks can work together offering a quantitative method for tracking sustainability progress. For example, increases in urban green space can be directly measured as contributions to SDG 11. Our approach, using Sentinel-2 and MODIS data within the Google Earth Engine platform, provides a replicable template. The cloud-based system allows for regular updates (annually or more frequently), and can be adapted to other cities in similar climates to assess their performance in sustainable land cover and climate resilience.
5.1 Policy recommendations for urban planning in arid regions
The results of this study provide actionable recommendations for policymakers, urban planners, and environmental stakeholders operating in arid regions such as Abu Dhabi. The demonstrated link between increased vegetation and lower land surface temperatures (LST) underscores the need to embed green infrastructure into urban development frameworks (Norton et al., 2015). Spatially detailed LST and Land Cover datasets can help identify high-risk heat zones, guiding the implementation of targeted cooling interventions such as tree planting, green roofs, shaded walkways, or high-albedo materials. Regular monitoring of land cover change supports the evaluation of sustainability initiatives and enables data-driven policy formulation (Chakraborty and Lee, 2019). By leveraging these insights, municipal planners can develop adaptive, climate-resilient urban strategies balancing heat mitigation, efficient water use, and improved public health outcomes amidst the dual challenges of climate change and accelerated urban growth in desert environments.
6 Limitations and directions for future research
While this study offers valuable insights, several limitations should be acknowledged. The use of MODIS LST data at a 1 km spatial resolution introduces potential scale mismatches when overlaid with the 10 m Sentinel-2-based LAND COVER classifications. Although majority resampling and mixed pixel exclusion were applied to mitigate the Modifiable Areal Unit Problem (MAUP), finer thermal variations such as temperature gradients between urban blocks or within green corridors may remain unresolved. While we implemented a 60% purity threshold to reduce mixed-pixel bias, we recognize that more stringent thresholds (e.g., 80%–90%) may further reduce aggregation bias, though potentially at the cost of sample size. Future studies could adopt higher-resolution thermal datasets (e.g., Landsat 8/9 TIRS or ECOSTRESS) to better capture intra-urban variability and apply tighter sensitivity thresholds to enhance accuracy.
Additionally, the analysis focused exclusively on daytime LST during the summer months (June–August), which limits insight into nighttime cooling dynamics and full diurnal heat cycles. Incorporating nighttime LST observations and meteorological station data would enable a more complete characterization of urban heat island effects. Moreover, while the land cover classification captured broad landscape patterns, vegetation was grouped into a single class. Disaggregating it into subtypes such as croplands, natural vegetation, and mangroves could better reveal the specific contributions of different vegetation types to surface cooling.
The SUHII analysis was included as an indicative comparison only, and we note that detailed parameterization (e.g., buffer distances, sample counts, confidence intervals) is left for future research. The analysis was conducted using concentric buffers around urban clusters, but detailed reporting of buffer distances, sample sizes, and statistical significance testing was beyond the present scope. Coastal moderation is another potential confounder of observed urban coolness; a stratified distance-to-coast analysis would help disentangle shoreline effects from urban form, but this lies beyond the scope of the present study. Similarly, MODIS–Landsat cross-validation was applied at selected locations and showed agreement within ±2 °C, but full statistical metrics (R2, MAE, scatter plots) were not included and are recommended for future work.
Water availability is another critical, yet unquantified, factor. Vegetation expansion in arid environments often depends on intensive irrigation. Future research should integrate remote sensing with in situ data on irrigation efficiency, water consumption, and evapotranspiration rates to evaluate the sustainability of greening initiatives, particularly in the context of SDG 6 (Clean Water and Sanitation) and SDG 15 (Life on Land).
The temporal design of this study was also limited to three benchmark years (2017, 2020, and 2024), selected for data quality and spacing. Expanding the temporal window to include earlier years where Sentinel-2 or Landsat coverage exists would allow for more robust trend detection and improve understanding of long-term land–climate interactions. Additionally, while the impact of the COVID-19 lockdown on LST was qualitatively noted, a higher-frequency temporal analysis using daily MODIS and station records could better isolate anthropogenic effects during that period.
While causal interpretations were avoided, meteorological variables such as ambient air temperature, humidity, and wind conditions were not explicitly controlled for. Future studies may benefit from incorporating ERA5 or station-based covariates to statistically normalize LST patterns and support stronger attribution analyses.
Finally, predictive modeling could offer valuable foresight into how future land cover scenarios may influence urban climate dynamics. For instance, simulating the impact of converting 5% of desert land into vegetation, or projecting thermal outcomes under different urban growth trajectories, could support climate-resilient planning and policy formulation.
Despite these limitations, the present study provides robust, policy-relevant findings that deepen understanding of land–climate interactions in hyper-arid urban environments and lay the groundwork for future resolution- and variable-sensitive research.
7 Conclusion
This study leveraged satellite-based Earth observation and cloud computing to examine land cover change and the presence of an inverted urban heat island (UHI) effect across Abu Dhabi Emirate between 2017 and 2024. By classifying Sentinel-2 imagery, we tracked the expansion of urban and vegetated areas into the desert. MODIS thermal data enabled us to assess how these land cover changes, alongside broader climatic influences, impacted land surface temperatures (LST). Rapid Yet Controlled Development: Abu Dhabi has continued its trajectory of urbanization and desert greening. Urban areas expanded by roughly 50% over the 7-year period, with a concurrent rise in vegetated land cover. These developments support the emirate’s broader strategic goals and were mapped with high classification accuracy (≥89%). Growth primarily occurred as contiguous extensions of existing urban and agricultural zones, minimizing fragmented sprawl. Daytime Urban Cooling in a Desert Context: In contrast to the conventional UHI effect, built-up and vegetated areas in Abu Dhabi are significantly cooler during the day than surrounding bare desert. Average summer LSTs in urban zones (41 °C–43 °C) were 7 °C–8 °C lower than nearby desert areas (49 °C–52 °C), with vegetated regions showing even stronger cooling (14 °C cooler). This highlights how human-altered landscapes, when designed with greenery and water integration, can substantially reduce extreme surface heating in arid regions.
Climate Extremes and the 2020 Heat Spike: The year 2020 was anomalously hot in terms of LST, despite reductions in traffic and emissions during the COVID-19 lockdown. The highest average surface temperatures were recorded that year, underscoring the dominance of global climate factors. However, the urban cool island effect persisted urban areas remained cooler than the desert, even if all zones warmed overall. A relative cooling of about 3.6 °C was noted by 2024, reinforcing the importance of multi-year analysis to distinguish long-term trends from single-year anomalies.
Land Cover–LST Relationships: The conversion of desert to urban or vegetated land consistently led to localized cooling, helping buffer extreme surface heat. However, sustaining these cooler zones often requires increased water and energy inputs. Spatial LST variations were closely linked to land cover changes; for example, newly vegetated zones emerged as distinct cool spots on thermal maps. Maintaining water bodies and expanding vegetated “oases” appear to be effective heat mitigation strategies.
The findings offer actionable insights relevant to multiple Sustainable Development Goals (SDGs). Urban greening (SDG 11) is shown to directly reduce LST and aid in climate adaptation (SDG 13). Additionally, our approach enables monitoring of land degradation and restoration trends (SDG 15) by tracking desert extent and land cover transitions. Abu Dhabi’s model integrating green infrastructure into urban development offers a scalable framework for sustainable planning in dryland cities, although sustainable water management remains an essential parallel priority. This independent analysis of Abu Dhabi’s land cover and thermal evolution demonstrates the effectiveness of combining Sentinel-2, MODIS, and Google Earth Engine (GEE) for monitoring environmental change. Our results reveal that even in one of the world’s most extreme climates, strategic land cover, particularly urban greening can produce cooler and more livable conditions. However, the persistent threat of surrounding desert heat reinforces the ongoing need for adaptation and careful planning in the face of climate change.
The methodology used here can be expanded to track future developments in Abu Dhabi or adapted for use in other arid urban regions, providing a valuable tool set for data-driven decision-making toward sustainable, climate-resilient urban futures. To build on this foundation, integrating additional datasets such as socio-economic indicators, energy consumption, or public health metrics related to heat exposure can yield a more holistic picture of urban sustainability. Monitoring nighttime LST would also complete the 24-h UHI profile. As satellite technology advances, including the launch of higher-resolution thermal sensors, our capacity to assess and manage urban climates will continue to improve. This study offers a timely and relevant case example of how land cover strategies can shape urban climate resilience informing local policies in the UAE and offering insights to the global community working toward sustainable and livable cities.
Data availability statement
The original contributions presented in the study are included in the article/supplementary material, further inquiries can be directed to the corresponding author.
Author contributions
MR: Project administration, Visualization, Funding acquisition, Formal Analysis, Supervision, Writing – original draft, Validation, Investigation, Data curation, Software, Methodology, Conceptualization, Writing – review and editing, Resources. AT: Writing – review and editing, Conceptualization, Investigation, Data curation, Software. HA: Methodology, Writing – review and editing, Supervision, Project administration, Formal Analysis. NAH: Visualization, Funding acquisition, Writing – review and editing, Resources, Validation.
Funding
The author(s) declare that no financial support was received for the research and/or publication of this article.
Conflict of interest
The authors declare that the research was conducted in the absence of any commercial or financial relationships that could be construed as a potential conflict of interest.
Generative AI statement
The author(s) declare that no Generative AI was used in the creation of this manuscript.
Any alternative text (alt text) provided alongside figures in this article has been generated by Frontiers with the support of artificial intelligence and reasonable efforts have been made to ensure accuracy, including review by the authors wherever possible. If you identify any issues, please contact us.
Publisher’s note
All claims expressed in this article are solely those of the authors and do not necessarily represent those of their affiliated organizations, or those of the publisher, the editors and the reviewers. Any product that may be evaluated in this article, or claim that may be made by its manufacturer, is not guaranteed or endorsed by the publisher.
References
Al Blooshi, L. S., Abuelgasim, A., Nassar, A., and Ksiksi, T. (2020). Impact of desert urbanization on urban heat islands effect. Open J. Geol. 10 (7), 760–770. doi:10.4236/ojg.2020.107034
Al-Ruzouq, R., Shanableh, A., Khalil, M. A., Zeiada, W., Hamad, K., Abu Dabous, S., et al. (2022). Spatial and temporal inversion of land surface temperature along coastal cities in arid regions. Remote Sens. 14 (8), 1893. doi:10.3390/rs14081893
Aljaddani, A. H., Song, X.-P., and Zhu, Z. (2022). Characterizing the patterns and trends of urban growth in saudi Arabia’s 13 capital cities using a landsat time series. Remote Sens. 14 (10), 2382. doi:10.3390/rs14102382
Alqasemi, A. S., Hereher, M. E., Kaplan, G., Al-Quraishi, A. M. F., and Saibi, H. (2021). Impact of COVID-19 lockdown upon the air quality and surface urban heat island intensity over the United Arab Emirates. Sci. Total Environ. 767, 144330. doi:10.1016/j.scitotenv.2020.144330
Amani, M., Ghorbanian, A., Ahmadi, S. A., Kakooei, M., Moghimi, A., Mirmazloumi, S. M., et al. (2020). Google Earth engine cloud computing platform for remote sensing big data applications: a comprehensive review. IEEE J. Sel. Top. Appl. Earth Observations Remote Sens. 13, 5326–5350. doi:10.1109/jstars.2020.3021052
Belgiu, M., and Drăguţ, L. (2016). Random forest in remote sensing: a review of applications and future directions. ISPRS J. Photogrammetry Remote Sens. 114, 24–31. doi:10.1016/j.isprsjprs.2016.01.011
Chakraborty, T., and Lee, X. (2019). A simplified urban-extent algorithm to characterize surface urban heat islands on a global scale and examine vegetation control on their spatiotemporal variability. Int. J. Appl. Earth Observation Geoinformation 74, 269–280. doi:10.1016/j.jag.2018.09.015
El Kenawy, A. M., Hereher, M. E., and Robaa, S. M. (2019). An assessment of the accuracy of MODIS land surface temperature over Egypt using ground-based measurements. Remote Sens. 11 (20), 2369. doi:10.3390/rs11202369
Gorelick, N., Hancher, M., Dixon, M., Ilyushchenko, S., Thau, D., and Moore, R. (2017). Google Earth engine: planetary-Scale geospatial analysis for everyone. Remote Sens. Environ. 202, 18–27. doi:10.1016/j.rse.2017.06.031
Lazzarini, M., Marpu, P. R., and Ghedira, H. (2013). Temperature-land cover interactions: the inversion of urban heat island phenomenon in desert city areas. Remote Sens. Environ. 130, 136–152. doi:10.1016/j.rse.2012.11.007
Norton, B. A., Coutts, A. M., Livesley, S. J., Harris, R. J., Hunter, A. M., and Williams, N. S. (2015). Planning for cooler cities: a framework to prioritise green infrastructure to mitigate high temperatures in urban landscapes. Landsc. Urban Plan. 134, 127–138. doi:10.1016/j.landurbplan.2014.10.018
Phiri, D., Simwanda, M., Salekin, S., Nyirenda, V. R., Murayama, Y., and Ranagalage, M. (2020). Sentinel-2 data for land cover/use mapping: a review. Remote Sens. 12 (14), 2291. doi:10.3390/rs12142291
Ramadan, M. S., Abuelgasim, A., and Al Hosani, N. (2024a). Advancing air quality forecasting in Abu Dhabi, UAE using time series models. Front. Environ. Sci. 12, 1393878. doi:10.3389/fenvs.2024.1393878
Ramadan, M. S., Abuelgasim, A., Almurshidi, A. H., and Al Hosani, N. (2024b). A comprehensive spatiotemporal approach to mapping air quality distribution and prediction in desert region. Urban Clim. 58, 102137. doi:10.1016/j.uclim.2024.102137
Ramadan, M. S., Almurshidi, A. H., Razali, S. F. M., Ramadan, E., Tariq, A., Bridi, R. M., et al. (2025). Spatial decision-making for urban flood vulnerability: a geomatics approach applied to Al-Ain city, UAE. Urban Clim. 59, 102297. doi:10.1016/j.uclim.2025.102297
Saxena, P., Sonwani, S., Juhola, S., and Louis, F. (2024). Editorial: towards 2030: a sustainable cities perspective on achieving sustainable development goal 13 – climate action. Front. Sustain. Cities 6, 1466952. doi:10.3389/frsc.2024.1466952
Stehman, S. V., and Foody, G. M. (2019). Key issues in rigorous accuracy assessment of land cover products. Remote Sens. Environ. 231, 111199. doi:10.1016/j.rse.2019.05.018
Sultan, M., Issa, S., Dahy, B., Saleous, N., and Sami, M. (2024). Fifty years of land use and land cover mapping in the United Arab Emirates: a machine learning approach using landsat satellite data. Front. Earth Sci. 12, 1510510. doi:10.3389/feart.2024.1510510
Taiema, F. S., and Ramadan, M. S. (2021). Monitoring urban growth directions using geomatics techniques, a case study zagazig city-Egypt. Egypt. J. Remote Sens. Space Sci. 24 (3), 1083–1092. doi:10.1016/j.ejrs.2021.10.007
Tewari, A., and Srivastava, N. (2023). Impact of COVID lockdowns on spatio-temporal variability in land surface temperature and vegetation index. Environ. Monit. Assess. 195 (4), 507. doi:10.1007/s10661-023-11119-7
Vujovic, S., Haddad, B., Karaky, H., Sebaibi, N., and Boutouil, M. (2021). Urban heat island: causes, consequences, and mitigation measures with emphasis on reflective and permeable pavements. CivilEng 2 (2), 459–484. doi:10.3390/civileng2020026
Wan, Z. (2014). New refinements and validation of the collection-6 MODIS land-surface temperature/emissivity product. Remote Sens. Environ. 140, 36–45. doi:10.1016/j.rse.2013.08.027
Wehbe, Y., Ghebreyesus, D., Temimi, M., Milewski, A., and Al Mandous, A. (2017). Assessment of the consistency among global precipitation products over the United Arab Emirates. J. Hydrology Regional Stud. 12, 122–135. doi:10.1016/j.ejrh.2017.05.002
Xue, J., and Su, B. (2017). Significant remote sensing vegetation indices: a review of developments and applications. J. Sensors 2017 (1), 1353691–17. doi:10.1155/2017/1353691
Yu, H., Zahidi, I., and Fai, C. M. (2025). Mitigating urban Heat Islands (UHI) through vegetation restoration: insights from mining communities. Glob. Challenges 9, 2400288. doi:10.1002/gch2.202400288
Keywords: land cover, land surface temperature (LST), google earth engine (GEE), urbanheat island (UHI), remote sensing, arid environments, Abu Dhabi, sustainable urban development
Citation: Ramadan MS, Tariq A, Abdo HG and Al Hosani N (2025) GEE-based analysis of spatiotemporal patterns of land cover and LST in an arid urban environment a case study of Abu Dhabi . Front. Environ. Sci. 13:1634243. doi: 10.3389/fenvs.2025.1634243
Received: 23 May 2025; Accepted: 29 September 2025;
Published: 15 October 2025.
Edited by:
Zhuosen Wang, University of Maryland, College Park, United StatesReviewed by:
Maurizio Tiepolo, Polytechnic University of Turin, ItalySubhanil Guha, National Institute of Technology Raipur, India
Jianzhi Liu, Henan University, China
Ery Suhartanto, Universitas Brawijaya Jurusan Teknik Pengairan, Indonesia
Copyright © 2025 Ramadan, Tariq, Abdo and Al Hosani. This is an open-access article distributed under the terms of the Creative Commons Attribution License (CC BY). The use, distribution or reproduction in other forums is permitted, provided the original author(s) and the copyright owner(s) are credited and that the original publication in this journal is cited, in accordance with accepted academic practice. No use, distribution or reproduction is permitted which does not comply with these terms.
*Correspondence: Mona S. Ramadan, bW9uYS5zLnJhbWFkYW5AdWFldS5hYy5hZQ==