 Pin Liu
 Xiang Ji
 Dong Wang3
- 1School of Mechanics and Civil Engineering, China University of Mining and Technology, Xuzhou, Jiangsu, China
- 2School of Environmental Engineering, Xuzhou University of Technology, Xuzhou, Jiangsu, China
- 3Jiangsu Collaborative Innovation Center for Building Energy Saving and Construction Technology, Jiangsu Vocational Institute of Architectural Technology, Xuzhou, Jiangsu, China
- 4College of Architecture Science and Engineering, Yangzhou University, Yangzhou, Jiangsu, China
As a critical spatial carrier for achieving the “dual carbon” strategic goals, measuring carbon emissions and assessing low-carbon development efficiency in urban territorial spaces are of great significance for promoting urban green and low-carbon transitions. This study focuses on urban territorial space as its research object, constructs a carbon accounting system for territorial spaces based on multi-source big data, and innovatively establishes a composite-dimensional low-carbon development efficiency evaluation model. It systematically evaluates the economic-social-ecological low-carbon development efficiency levels of various territorial spatial units and conducts a corresponding low-carbon zoning study. The findings indicate that the territorial space carbon accounting method developed in this study effectively supports the evaluation of composite-dimensional low-carbon development efficiency and provides a scientific methodological foundation for urban low-carbon zoning. The spatial structure of low-carbon development efficiency exhibits significant dimensional heterogeneity, with its characteristics conforming to regional socioeconomic development patterns. This reveals the inherent imbalance in low-carbon development across metropolitan territorial spaces. Based on the low-carbon development efficiency evaluations, territorial spatial units are classified into five types of low-carbon zones, including economically advantaged low-carbon zones, socially advantaged low-carbon zones, ecologically advantaged low-carbon zones, economically-socially advantaged low-carbon zones, and socially-ecologically advantaged low-carbon zones. The findings reveal significant spatial disparities in low-carbon development efficiency across Xuzhou City, necessitating differentiated low-carbon regulation strategies tailored to the carbon emission characteristics of each zone to foster low-carbon development in urban territorial spaces.
1 Introduction
Research data indicate that approximately 70% of global energy consumption and 75% of carbon emissions are concentrated in urban areas (Seto et al., 2014). As the primary spatial carrier of global carbon emissions, low-carbon development in urban territorial spaces has become a critical pathway for China to address climate change and achieve its strategic goals of ‘carbon peaking and carbon neutrality’. Functioning as a pivotal spatial nexus connecting national and local governance, urban territories encompass carbon emission activities spanning both central urban districts and rural township areas. A comprehensive analysis of the spatial characteristics of urban carbon emissions not only addresses the low-carbon governance demands of diverse planning stakeholders but also effectively supports the vertical integration and horizontal coordination of low-carbon strategies within the territorial spatial planning framework (Zhang D. et al., 2023). Low-carbon development efficiency, serving as a core metric for evaluating regional carbon emission performance, directly correlates with the achievement of urban carbon reduction targets and the scientific formulation of low-carbon policies in territorial spatial planning (Wang et al., 2021). Multidimensional factors, including economic development gradients, resource allocation efficiency, and natural baseline conditions, lead to significant spatial heterogeneity in carbon budgets and pronounced imbalance in low-carbon development efficiency from composite-dimensional perspectives. These efficiency disparities necessitate differentiated positioning in low-carbon strategy implementation, as homogeneous governance approaches neglecting spatial heterogeneity may compromise urban low-carbon transition objectives. This study proposes establishing differentiated regulatory mechanisms based on comprehensive assessments of regional low-carbon development efficiency. By deconstructing spatial differentiation patterns of multidimensional efficiency indicators, spatially adaptive carbon reduction strategies can be formulated. This research approach contributes to constructing a more efficient and refined territorial spatial governance system, systematically supporting the realization of the ‘Dual Carbon’ goals.
Carbon accounting in territorial spatial systems constitutes the fundamental basis for subsequent research on low-carbon development efficiency. Current carbon emission accounting frameworks primarily adopt two distinct paradigms, namely, bottom-up and top-down approaches. The former employs activity-level data at the micro-scale (e.g., factories (Jiang et al., 2023), equipment (Wiggins et al., 2021), and products (Deng et al., 2023)) for hierarchical aggregation, offering higher accounting accuracy yet constrained by data collection costs and computational complexity, thus being predominantly applicable to micro-level emission quantification scenarios (Li et al., 2013). The latter utilizes macro-scale statistical data to develop estimation models based on energy consumption and economic activity levels at national (Miller et al., 2019), sectoral (Hasan and Khanam, 2020), or regional (Guan et al., 2012) levels. It benefits from superior data accessibility for macroscopic carbon accounting, albeit with inherent limitations in measurement precision. For instance, existing studies have established an accounting system integrating the correspondence between urban sectoral carbon inventories and land-use-type carbon emissions based on the IPCC Guidelines for National Greenhouse Gas Inventories (Shan et al., 2018a). While this framework achieves quantitative statistics and spatial representation of carbon emission magnitudes, it inadequately characterizes the spatial heterogeneity of carbon emissions (Shi et al., 2012). Furthermore, some scholars have attempted to establish correlations between carbon emissions and geospatial elements (Jiang et al., 2013) and have implemented spatial allocation of emissions through geospatial data (Long et al., 2021). However, the homogenization of allocation entities results in lower accuracy, failing to meet the requirements for refined carbon-emission governance.
Once a carbon accounting framework is established, the next challenge is evaluating low-carbon development efficiency. Scholars have conducted evaluations of low-carbon development efficiency across distinct analytical dimensions. In the economic dimension, studies employing coupling coordination degree models have examined the coupling coordination relationships between industrial carbon emission efficiency and industrial structure optimization (Li and Wang, 2022). Within the social dimension, the Theil index has been applied to measure carbon-emission welfare performance, revealing regional disparities in social benefits derived from carbon emissions across geographical units (Meng and Zhang, 2022). From an ecological perspective, the Super-SBM model has been utilized to construct urban green development efficiency indicators, enabling analysis of spatiotemporal evolution patterns in regional green development efficiency (Qin and Liu, 2022). While these studies have provided substantial ideas and methods for single-dimensional assessments, research on urban low-carbon development efficiency evaluations from multidimensional composite perspectives remains insufficient. Furthermore, constrained by limitations in carbon accounting data precision and evaluation system comprehensiveness, existing low-carbon zoning studies predominantly focus on macro-scales such as the national level (Li et al., 2021; Zhang D. et al., 2023) and regional levels (Zhao et al., 2014; Ma et al., 2022), with urban-scale zoning research being comparatively underdeveloped.
Therefore, this study takes Xuzhou’s urban territorial space as a case study, aiming to advance methodological innovations and practical applications in low-carbon development efficiency through the following innovative research framework. Firstly, we develop a high-precision spatial allocation method for carbon emissions based on geospatial big data systems, significantly improving the accuracy of carbon accounting in territorial spaces. Secondly, this study overcomes the limitations of traditional single-dimensional evaluations by constructing a socio-economic-ecological multidimensional assessment system for low-carbon development efficiency, systematically analyzing the spatial differentiation characteristics and formation mechanisms of multidimensional low-carbon development efficiency. Subsequently, this research develops a multidimensional low-carbon zoning methodology based on efficiency evaluations, enabling low-carbon zoning at the intra-urban county scale. Finally, spatially tailored carbon reduction policies are proposed based on the zoning results, providing scientific support for optimizing the carbon emission patterns of territorial spaces.
2 Materials
2.1 Overview of study area
Xuzhou City is situated in the eastern region of China, within the northern section of the Yangtze River Delta urban agglomeration (Figure 1). Geographically, the city lies at the interface between the Huang-Huai Plain and the Shandong Hills, encompassing diverse landforms of low mountains, hills, plains, and lakes. As a key energy hub in East China, Xuzhou has historically depended on coal resource exploitation, establishing an industrial structure primarily centered on coal mining, thermal power generation, and steel production. The Xuzhou mining district ranks among the largest coal mining regions in eastern China, with substantial coal reserves that have played a crucial role in supporting both regional and national energy demands. However, prolonged coal mining activities have resulted in significant eco-environmental problems, including groundwater depletion, surface subsidence, and ecological degradation. Additionally, coal combustion and the concentration of energy-intensive industries have positioned Xuzhou as one of the cities with the highest carbon emission intensity within the Yangtze River Delta urban agglomeration. As a traditional coal mining and heavy industry hub in East China, Xuzhou exemplifies the challenges and opportunities of low-carbon transitions in resource-dependent cities. However, recent efforts in industrial restructuring, renewable energy adoption, and green manufacturing demonstrate a systematic shift toward sustainable development. As the regional energy base, Xuzhou amplifies its influence by driving low-carbon transitions across the Yangtze River Delta. By promoting green and low-carbon development, it also contributes to sustainable spatial planning, providing empirical evidence for balancing economic growth with emission reduction. As a representative case of China’s industrial cities under the ‘Dual Carbon’ targets, Xuzhou’s policies and practices offer transferable lessons for low-carbon transition in similar regions globally.

Figure 1. Location of Xuzhou City. (a) Location of Xuzhou in Yangtze River Delta; (b) administrative boundary of Xuzhou. Source: authors.
2.2 Data sources
The research data consists of both statistical and spatial data (Table 1). The statistical data includes energy, traffic, industry, agriculture, economy, and population information, primarily sourced from the Xuzhou Statistical Yearbook (2023). The spatial data covers POI data for industrial and commercial service sectors, mobile signaling data, road networks, land use, and administrative boundaries of Xuzhou. Specifically, POI data was obtained via the Gaode Map API; Mobile signaling data came from China Unicom’s “Smart Footprint Platform”; Road data was extracted from OpenStreetMap (OSM); Land use data was derived from Wuhan University’s CLCD (China Land Cover Dataset) database, known for its high accuracy and continuity; Administrative boundaries were acquired from the Ministry of Natural Resources’ Standard Map Service.
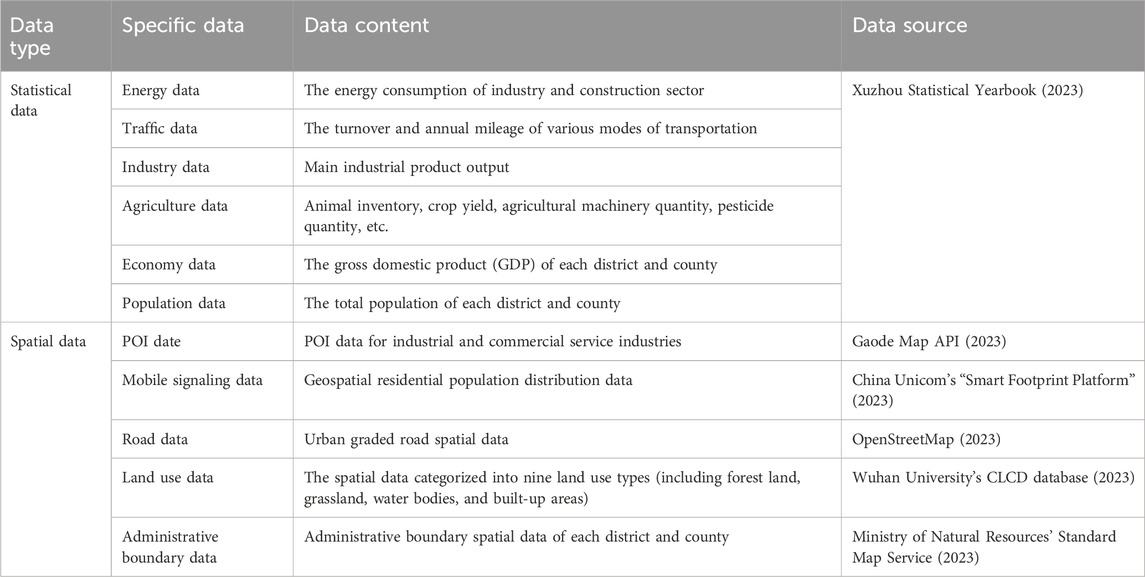
Table 1. Description of research data sources.
2.3 Theoretical basis
The level of low-carbon development varies spatially across urban districts and counties, with its efficiency serves as a crucial indicator for assessing the degree of low-carbon development within urban territorial spaces (Qin and Liu, 2022). Simultaneously with the generation of economic value in a given region, carbon emissions are produced. Carbon emission efficiency serves as a key indicator of the level of low-carbon economic development. Improvements in efficiency signify the achievement of high economic benefits while minimizing carbon emissions. Moreover, within the context of the “dual carbon” goal, carbon emissions associated with regional populations and spatial resources are constrained. Limitations on per capita carbon emissions and carbon emission intensity will allocate differing carbon emission rights and carbon reduction responsibilities across human societies (Wang et al., 2014). Additionally, the negative externalities on the ecological environment resulting from rapid economic and social development exacerbate the mismatch between regional carbon sink capacity and emission levels (Li et al., 2019). From this, it can be seen that carbon emissions, as an unintended byproduct of socio-economic development, exert negative impacts on economic growth, social equity, and the ecological environment. Consequently, low-carbon development should not be viewed solely as the pursuit of sustainability at a specific level, but rather as a comprehensive concept encompassing multiple dimensions—economic, social, and ecological. Building upon this analysis, this article develops a research framework for comprehensive efficiency and establishes a three-dimensional model to evaluate low-carbon development efficiency across economic, social, and ecological dimensions (Figure 2).
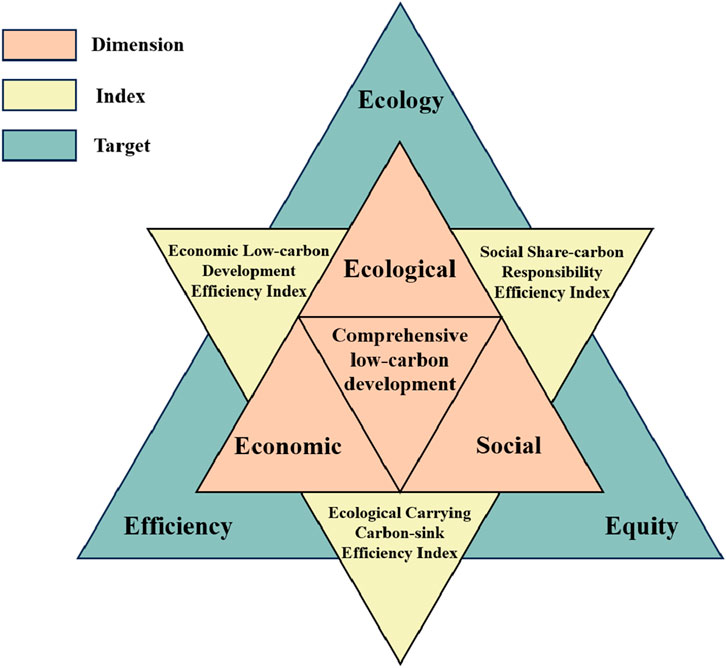
Figure 2. Model diagram of economic-social-ecological low-carbon development efficiency. Source: adapted from Wang et al., 2020.
3 Methods
3.1 Carbon emission calculation method of urban territorial space
3.1.1 Carbon emission calculation method of urban sectors
Building on the IPCC Guidelines for National Greenhouse Gas Inventories, we develop a method to calculate carbon emissions from urban sectors. It estimates emissions by analyzing energy, feedstock, waste, and other resource consumption per sector, using the intensity data of sector-specific activity and relevant emission factors (Lu et al., 2012). The calculation formula is given in Equation 1. Specifically, the method covers six emission sectors, namely, industry (CE), construction (CB), traffic (CT), agriculture (CF), waste (CW), and carbon sink (CA). The city’s total emissions (C) are then obtained by aggregating all sector contributions as shown in Equation 2.
Where
The carbon emissions from the industrial sector originate from energy consumption, feedstock use, and manufacturing processes. Industrial energy emissions are calculated based on annual industrial fuel combustion types and quantities, while process emissions derive from production volumes of key products including cement, steel, and synthetic ammonia (Hu and Man, 2023). Construction sector emissions primarily reflect building energy consumption (electricity, natural gas), estimated through energy use data and corresponding emission factors (Shi et al., 2023). For the traffic sector, emissions are determined by activity intensity and emission factors of various transport modes, with total sector emissions obtained by aggregating all modes’ contributions (Xia et al., 2020). Agricultural emissions mainly come from farm machinery operations, fertilizer applications, and land-use changes, calculated using activity intensity data and specific emission factors (West and Marland, 2002). Waste sector emissions predominantly arise from landfills, wastewater treatment and incineration activities, estimated by analyzing waste categories (organic, recyclable, hazardous) and treatment-specific emission factors (Zhao et al., 2012). Additionally, urban carbon sinks including cropland, forests, grasslands, urban green spaces and water bodies are quantified based on their areas and respective carbon absorption rates (Strohbach and Haase, 2012).
3.1.2 Carbon emission calculation method of urban territorial spaces
3.1.2.1 Establish a “carbon emission-territorial space” correspondence framework
To accurately measure carbon emissions in urban territorial spaces, this study establishes a linkage between urban carbon emission inventories and land use types. First, from a consumption-based perspective, we reorganize the emission sectors outlined in the IPCC Guidelines for National Greenhouse Gas Inventories into six categories, including industry, construction, traffic, agriculture, waste, and carbon sink (Zheng et al., 2021). Next, we select spatial carriers of municipal territories and allocate carbon emission activities from these six sectors to corresponding land use types based on the spatial locations where end-use consumption activities generate emissions (Zhang Z. et al., 2023). Ultimately, we establish a municipal-level “carbon emission-territorial space” correspondence framework (Figure 3).
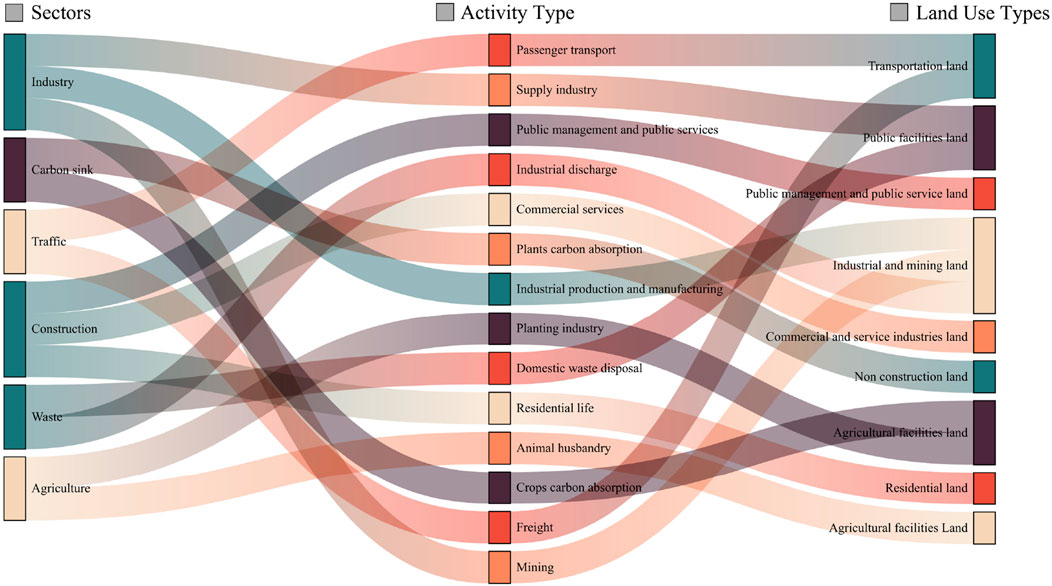
Figure 3. “Carbon emission-territorial space” correspondence framework. Source: authors.
3.1.2.2 Methods for carbon emissions spatialization
To characterize the spatial heterogeneity of carbon emissions generated by human activities and land-use elements, while highlighting the structural patterns of carbon emissions in municipal territorial spaces, this study employs the established “carbon emission-territorial space” correspondence framework. Based on sector-specific emission characteristics, we select appropriate spatial allocation indicators and utilize geospatial big data to design differentiated spatialization methodologies (Table 2). This approach enables the allocation of specific total carbon emission values to individual territorial spatial parcels, ultimately achieving high-precision measurement of carbon emissions of urban territorial spaces.
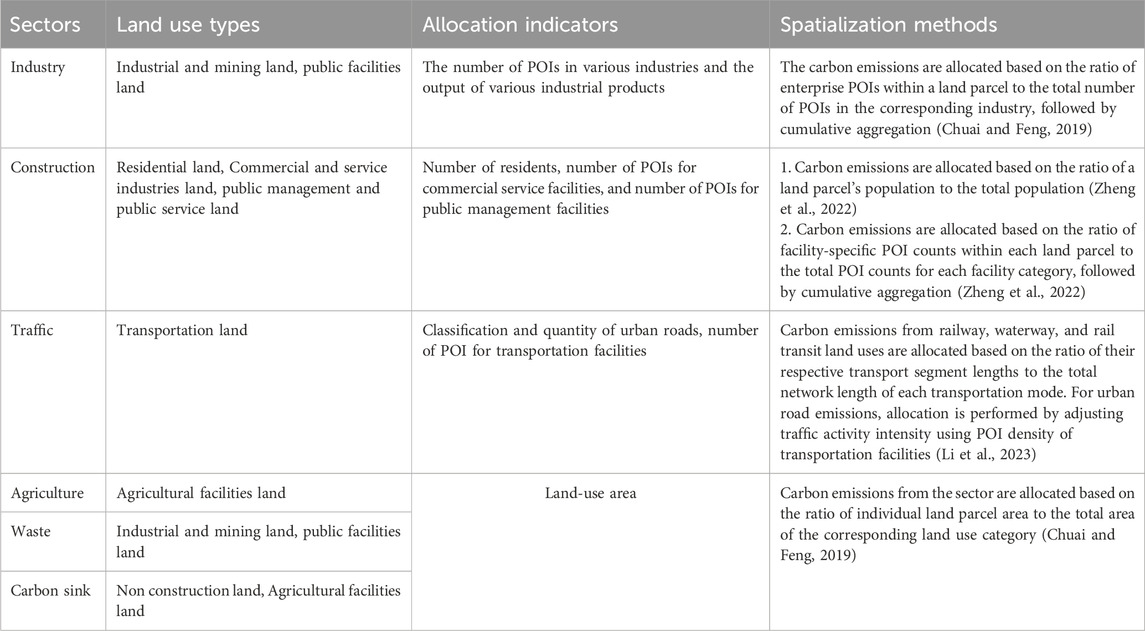
Table 2. Methods for carbon emission spatialization method based on geospatial big data.
3.2 Calculation method for low-carbon development efficiency
3.2.1 Economic low-carbon development Efficiency Index
The Economic Low-carbon Development Efficiency Index (ELDEI) evaluates regional low-carbon development performance at the economic level, indicating relative carbon emission efficiency across urban areas. The index employs two key ratios to quantify economic output per unit of carbon emissions, specifically the ratio of sub-regional GDP to citywide GDP and the ratio of sub-regional carbon emissions to citywide emissions. These metrics collectively assess the low-carbon efficiency of economic development at the spatial unit level (Lu et al., 2012), as shown in Equation 3.
Where
3.2.2 Social shared-carbon responsibility Efficiency Index
The Social Shared-Carbon Responsibility Efficiency Index (SSREI) evaluates regional low-carbon development at the societal level. Building on existing applications in carbon emission rights allocation studies (Wang et al., 2023), this index characterizes the relative levels of per capita carbon emissions and emission density within a region, quantifying the region’s carbon reduction responsibility. The calculation is formalized in Equation 4.
Where
3.2.3 Ecological carrying carbon-sink Efficiency Index
The Ecological Carrying Carbon-sink Efficiency Index (ECCEI) evaluates a region’s low-carbon development at the ecological level. This index, which is widely adopted in studies assessing regional carbon sink capacity and carbon compensation potential (Zhang Z. et al., 2023), characterizes the relative carbon sink carrying capacity across urban spatial units as formalized in Equation 5.
Where
3.2.4 Low-carbon development comprehensive Efficiency Index
To provide an overall assessment of regional low-carbon development levels, this study establishes a Low-carbon Development Comprehensive Efficiency Index to evaluate the regions’ comprehensive efficiency across economic, social, and ecological dimensions (Wang et al., 2014). The calculation formula is given in Equation 6.
Where
3.3 Low-carbon zoning method
The Normalized Revealed Comparative Advantage Index (NRCA) is primarily employed to evaluate competitive advantages in specific industries or products at regional scales. Building on Balassa’s Revealed Comparative Advantage Index (RCA) (Balassa, 1965) and incorporating methodological refinements by Yu et al. (2009), this study adapts the NRCA Index to assess comparative advantages in multi-dimensional low-carbon development efficiency, as formalized in Equation 7. This approach enables scientifically robust identification of regional strengths within low-carbon transition processes.
Where
4 Results
4.1 Carbon emission calculation
4.1.1 Carbon emission calculation of urban sectors
According to the carbon emission calculation method of urban sectors, the total carbon dioxide emissions in Xuzhou City for 2023 are estimated at approximately 92.2701 million tons (Table 3). The industrial sector being the largest contributor (75.1773 million tons, 81.47% of total emissions) (Figure 4), primarily originating from industrial land (48.1135 million tons, 52.14%) and public facility land (27.0638 million tons, 29.33%), reflecting the city’s reliance on traditional energy sources and a production model characterized by high energy consumption. Residential activities generate 8.4906 million tons (9.2% of total emissions), distributed across residential land (2.2925 million tons), rural homesteads (1.5283 million tons), commercial and service industries land (3.0566 million tons), and public management and public service land (1.6132 million tons). Electricity consumption is the primary emissions source of the construction sector, indicating fossil fuel dependence in power generation. The transportation sector emits 8.1415 million tons (8.82%), linked to transportation land, while emissions from agriculture (1.14%) and waste (1.12%) are comparatively minor. Xuzhou City has limited carbon sink capacity, with carbon-absorbing lands such as forests, grasslands, and water bodies collectively absorbing 1.6133 million tons.
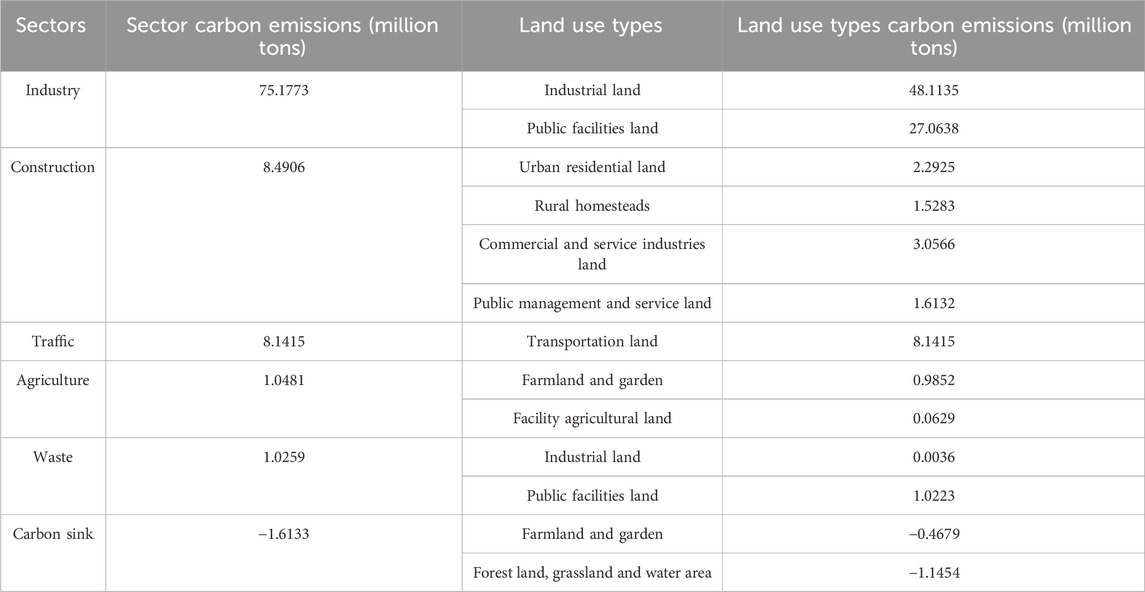
Table 3. Carbon emission calculation results of urban sectors.
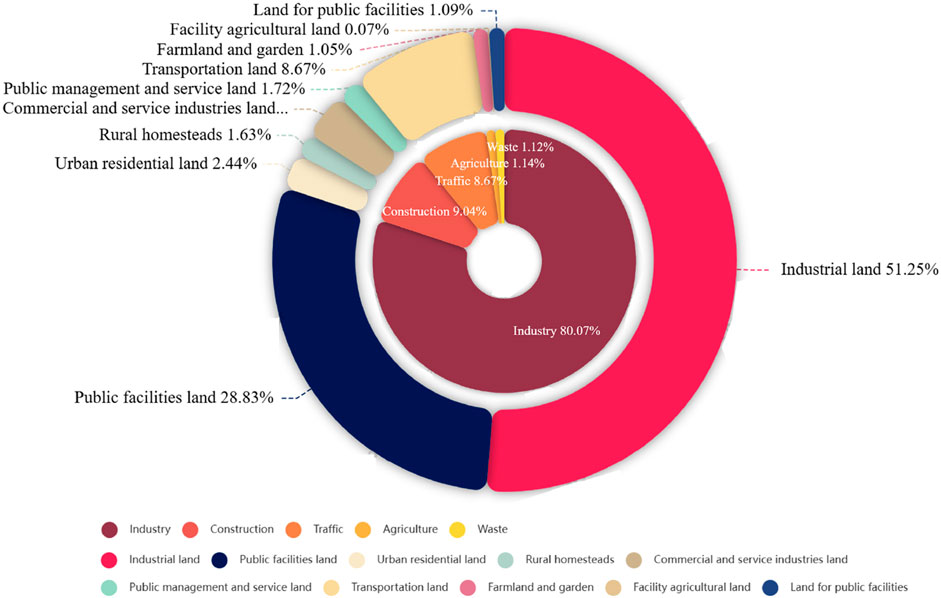
Figure 4. Proportion of carbon emissions by departments and land use. Source: authors.
4.1.2 Carbon emission calculation of urban territorial spaces
Based on the carbon emission calculation method for urban territorial spaces, an appropriate spatial allocation method was employed to distribute carbon emissions from various sectors across specific land-use categories within the city. Utilizing the administrative boundaries data of each district and county, carbon emissions and sink levels for Xuzhou City were compiled (Figure 5). The results indicate that total carbon emissions across counties and districts range from 2.28 to 17.23 million tons (average: 9.39 million tons). Notably, Gulou District and Yunlong District exhibit the lowest emissions, while Suining County and Pizhou County are identified as high-emission zones. Spatial visualization of carbon emissions reveals a distinct pattern characterized by “higher emissions in the east and west, and lower emissions in the center”, with a pronounced low-carbon core in the central urban area. In contrast, Suining County and Pizhou County have developed into high-carbon-emission cores in eastern and central Xuzhou. Regarding carbon sinks, the total sequestration across counties and districts ranges from 3,000 to 320,000 tons (average: 290,000 tons). Gulou District and Quanshan District demonstrate minimal sequestration capacity, whereas Tongshan District and Pizhou County contribute significantly to carbon sinks. The spatial distribution of carbon sinks follows a “low-central, high-peripheral, and concentric” structure. A low carbon-sink core dominates the central urban area, while peripheral counties and districts form a high-value carbon-sink belt, exhibiting a circular spatial trend.
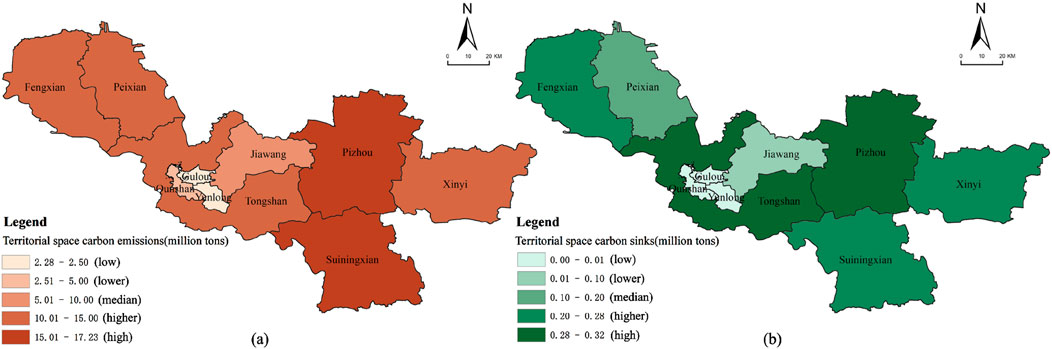
Figure 5. Carbon emissions and sink of district and county units in Xuzhou City. (a) Carbon emissions; (b) carbon sinks. Source: authors.
4.2 Low-carbon development efficiency calculation
4.2.1 Economic low-carbon development efficiency
The Economic Low-Carbon Development Efficiency Index (ELDEI) is employed to assess the low-carbon economic performance of district and county units in Xuzhou City. According to the results presented in Figure 6, the ELDEI values across Xuzhou’s districts and counties range from 0.53 to 3.72. Five districts and counties (50% of the total) exhibit values exceeding 1, with Quanshan District and Yunlong District demonstrating the highest efficiency. In contrast, Suining County and Feng County show the lowest efficiency, with ELDEI values below 1. Beyond these numerical disparities, a distinct “high-central, low-peripheral” spatial structure characterizes the low-carbon economic efficiency. The central urban area forms a high-efficiency core, surrounded by elevated efficiency zones in a semi-enclosed pattern. Moderately efficient areas cluster in the eastern region, while low-efficiency zones dominate the western and southern parts of the city. This spatial variation can be primarily attributed to differences in industrial functional positioning. The central urban area’s high reliance on tertiary industries (e.g., services and technology) minimizes carbon emissions per unit of economic output, enhancing economic low-carbon efficiency. Conversely, peripheral counties depend on traditional energy-intensive industries, resulting in structural disadvantages and lower efficiency.
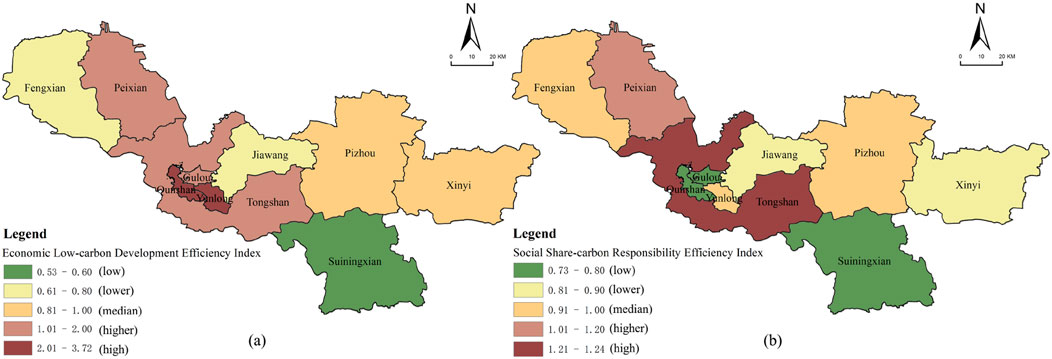
Figure 6. Low-carbon development efficiency of district and county units in Xuzhou City. (a) Economic low-carbon development efficiency; (b) social shared-carbon responsibility efficiency. Source: authors.
4.2.2 Social shared-carbon responsibility efficiency
The Social Shared-Carbon Responsibility Efficiency Index (SSREI) is employed to measure the consumption of territorial carbon resources and the corresponding shared responsibilities for emission reductions. It reflects the relative social low-carbon development levels across districts and counties in Xuzhou City. It can be seen from Figure 6 that the SSREI values range from 0.73 to 1.24 across districts and counties. Only two districts and counties (20% of the total) exceed an SSREI of 1, with Tongshan District and Pei County demonstrating the highest efficiency. In contrast, Suining County and Gulou District exhibit the lowest SSREI values. Beyond the numerical values, the spatial distribution of SSREI follows a distinct “high in the west and north, low in the center and east” structural pattern. High- and higher-efficiency zones cluster in the western and northern regions, while moderate-efficiency areas scatter across the north-central parts. Low- and lower-efficiency regions dominate the central urban area and eastern periphery. This pronounced spatial disparity can be explained by variations in per capita carbon resource consumption and emissions density. Higher consumption and density in the central urban area lead to larger carbon shares, necessitating greater responsibility for emission reductions. Production and living activities in this core zone are associated with elevated carbon costs and constrained emission rights. Conversely, northwestern peripheral districts and counties experience lower carbon demands, enabling relatively higher social low-carbon development levels.
4.2.3 Ecological carrying carbon-sink efficiency
The Ecological Carrying Carbon-Sink Efficiency (ECCEI) is utilized to assess the ecological carbon sink capacity of districts and counties. According to the results presented in Figure 7, the overall ECCEI for districts and counties within Xuzhou City ranges from 0.08 to 1.42. A total of five areas exhibit ECCEI values greater than 1, accounting for 50%, while the remaining five areas have ECCEI values below 1. Specifically, Tongshan District and Feng County demonstrate relatively high levels of ecological carrying carbon-sink efficiency, whereas Quanshan District and Gulou District exhibit relatively low levels. Spatially, the ECCEI exhibits a distinct pattern characterized by “high in the surrounding areas and low in the center.” In detail, high-value and higher-value clusters are predominantly found in the western and eastern edge districts and counties within urban areas, where the ecological carbon sink capacity is notably strong. In contrast, the low-value cluster, centered around Gulou and Quanshan districts, is surrounded by high-efficiency areas. This central area exhibits a critical mismatch between ecological absorption and carbon emissions, resulting in an inefficient level of ecological carbon sink capacity. This spatial pattern can be primarily attributed to the natural ecological basis, which serves as the main body of carbon sink, providing the foundation for the spatial ecological carbon sink capacity. However, the insufficient integrity of the ecological network results in notable disparities in the level of ecological carbon sink capacity across urban territories. Furthermore, the continuous expansion of downtown has led to the encroachment of ecological spaces, thereby disrupting the balance between carbon emissions and carbon absorption.
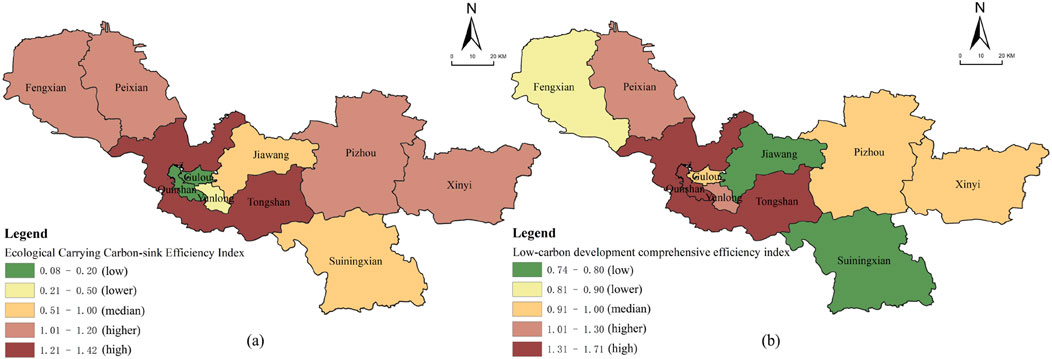
Figure 7. Low-carbon development efficiency of district and county units in Xuzhou City. (a) Ecological carrying carbon-sink efficiency; (b) low-carbon development comprehensive efficiency. Source: authors.
4.2.4 Low-carbon development comprehensive efficiency
The Low-Carbon Development Comprehensive Efficiency reflects the relative level of low-carbon comprehensive development across districts and counties within the city. It can be seen from Figure 7 that the overall low-carbon development comprehensive efficiency among districts and counties in Xuzhou City ranges from 0.74 to 1.71. Notably, Quanshan District and Tongshan District exhibit relatively high levels of low-carbon-development comprehensive efficiency, whereas Suining County and Jiawang District demonstrate comparatively lower levels. Spatially, this efficiency exhibits a distinct spatial structure characterized by a “high-value-strip distribution and low-value dispersed distribution.” To elaborate, high-value and higher-value clusters are concentrated along a north-south strip extending from Pei County to Tongshan District. Meanwhile, the median-value areas are predominantly concentrated in the eastern part of the city. In contrast, regions with low value and lower value are primarily dispersed along the urban fringe districts and counties. This spatial pattern arises primarily because in high-efficiency areas, there is a spatially integrated and proportionally balanced distribution of carbon sources and sinks. This balance is complemented by the generation of substantial socioeconomic value from specific carbon resources, which collectively fosters favorable conditions for low-carbon comprehensive development. Conversely, the spatial configurations of districts and counties with lower efficiency levels are relatively simplistic, lacking integrated and contiguous layouts, with poor coordination between carbon emissions and sinks. Furthermore, economic output in these areas is heavily dependent on high-carbon consumption, which represents the primary obstacle hindering the region’s overall low-carbon development.
4.3 Low-carbon zoning
4.3.1 Classification basis for low-carbon zoning
To clarify the strategic directions for low-carbon development across districts and counties, the NRCA Index values for low-carbon development efficiency are calculated across various dimensions. These values form the basis for spatial zoning, enabling low-carbon zoning within Xuzhou City. Based on the zoning outcomes, differentiated and context-specific low-carbon pathways and strategies are proposed to foster comprehensive green transformation of urban economic and social development.
Research indicates that an NRCA Index value greater than 0 signifies that a spatial unit holds a competitive advantage in low-carbon development within a specific dimension. Conversely, a value of 0 or less indicates a lack of advantage, marking these areas as key targets for future optimization in low-carbon development. Thus, 0 serves as the threshold for all NRCA Indices. Based on the NRCA Indices in economic, social, and ecological dimensions, district and county units can be categorized into five advantage zones, namely, economically advantaged low-carbon zones, socially advantaged low-carbon zones, ecologically advantaged low-carbon zones, economically-socially advantaged low-carbon zones, and socially-ecologically advantaged low-carbon zones (Table 4).
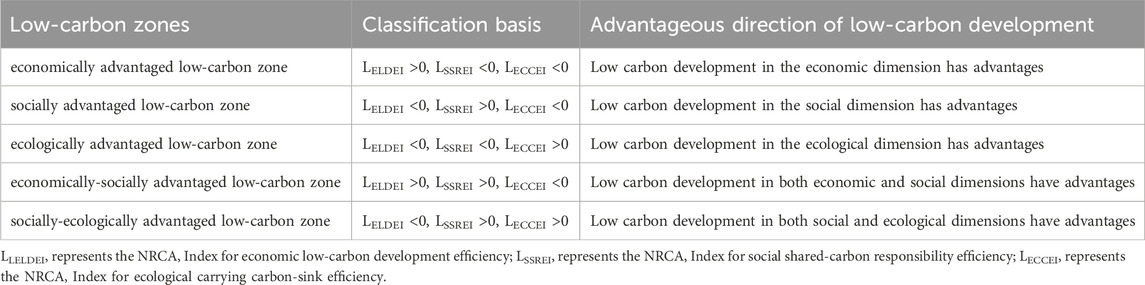
Table 4. Classification basis for low-carbon zoning.
4.3.2 Spatial distribution of low-carbon zones
Based on the low-carbon zoning approach, the results of the zoning analysis for Xuzhou City are illustrated in Figure 8. The economically advantaged low-carbon zone is characterized by high energy utilization efficiency and carbon emission efficiency, reflecting strengths exclusively in the economic dimension of low-carbon development. Two district and county units fall into this category, primarily located within the central urban area of Xuzhou. These units serve as core drivers of the city’s economic growth, where elevated economic output is accompanied by considerable carbon emissions, yet also by high economic returns. Although these zones exhibit superior carbon emission efficiency, they bear significant carbon reduction responsibilities and display relatively limited ecological carrying capacity.
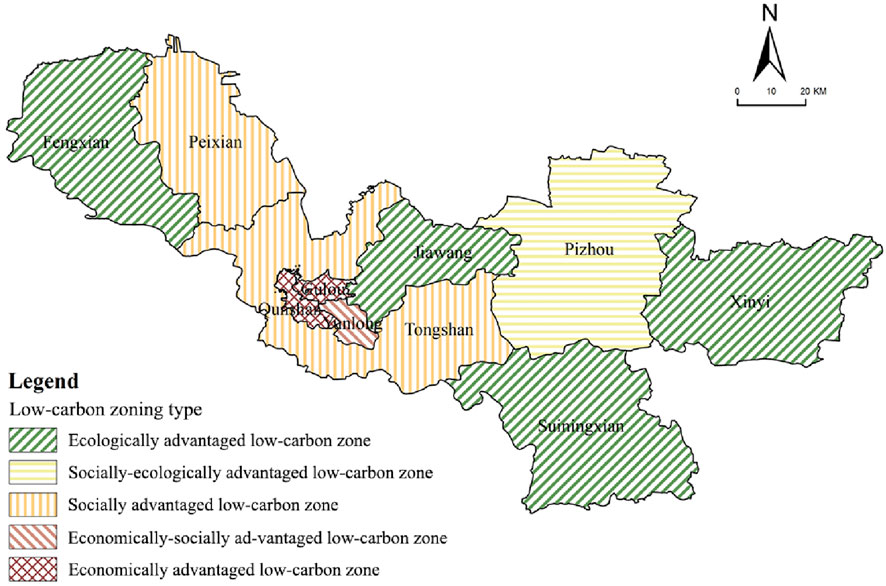
Figure 8. Spatial pattern of low carbon zoning in Xuzhou city. Source: authors.
In contrast, the socially advantaged low-carbon zone demonstrates advantages only in social low-carbon development. These zones are marked by relatively low shared carbon responsibility, moderate pressure for emission reduction, and appropriate carbon emission density. Two district and county units are identified as socially advantaged, mainly distributed across the central and western parts of the city. These areas show lower carbon emission intensity in terms of both population and land use, leading to more generous allocations of carbon emission rights. However, they require further enhancement in economic and ecological aspects of low-carbon development. The ecologically advantaged low-carbon zone exhibits strengths solely in ecological low-carbon development, with notable carbon sequestration benefits and high ecological carrying capacity. Four district and county units are classified into this category, predominantly situated in the northwestern and southeastern periphery of Xuzhou. These regions are endowed with abundant carbon sink resources and maintain relatively low carbon emission levels. Nevertheless, their carbon emission efficiency remains suboptimal, and they are faced with considerable carbon reduction obligations.
Additionally, the economically-socially advantaged low-carbon zone combines advantages in both economic and social dimensions, featuring high carbon emission efficiency and relatively manageable carbon reduction pressure. At present, only Yunlong District is assigned to this zone type. Such areas actively foster low-carbon economic development and benefit from substantial carbon emission rights allocations, though they still need to strengthen their ecological performance. Finally, the socially-ecologically advantaged low-carbon zone possesses dual strengths in social and ecological low-carbon development, characterized by strong ecological carbon sink capacity and relatively low carbon reduction pressure. Currently, only Pizhou County is categorized under this type. It demonstrates a high carbon compensation rate alongside low per-capita and land-based carbon emission intensity, yet economic low-carbon development in this zone requires further improvement.
4.4 Differentiated low-carbon development strategy based on low-carbon zoning
To achieve a dynamic equilibrium between economic development and ecological conservation, it is essential to establish a multidimensional low-carbon synergy system through differentiated zonal strategies. For economically advantaged low-carbon zones, measures should include implementing ecological redline zoning to restrict high-emission projects in sensitive areas, along with promoting investments in afforestation, wetland restoration, and urban green corridors to strengthen carbon sequestration. Governments are advised to introduce carbon tax incentives for industries transitioning to clean energy and enforce standardized carbon footprint disclosures for major enterprises. In socially advantaged low-carbon zones, policymakers should enforce sector-specific carbon caps in key areas such as construction and manufacturing, while subsidizing distributed renewable energy systems—including rooftop solar and community microgrids. These efforts ought to be complemented by public awareness campaigns advocating low-carbon lifestyles and the incorporation of carbon credit mechanisms into urban planning.
Ecologically advantaged low-carbon zones are encouraged to pilot net-zero industrial parks that emphasize closed-loop resource utilization—such as waste-to-energy conversion and agroforestry systems—and to establish regional carbon trading platforms to incentivize emission reductions while funding biodiversity corridor projects. In economically-socially advantaged low-carbon zones, integrated solutions are critical, such as deploying smart grids and sponge city infrastructure to enhance climate resilience, issuing green bonds to support eco-friendly public transportation, and aligning fiscal policies with carbon performance metrics. In socially-ecologically advantaged low-carbon zones, development should focus on circular economy hubs (e.g., industrial recycling clusters and low-impact eco-tourism), with support from R&D tax incentives for advanced technologies such as carbon capture and hydrogen energy. It is also crucial that regional GDP growth targets be realigned with Sustainable Development Goal (SDG)-based decarbonization indicators.
Overall, system-wide coordination is necessary to harmonize carbon management frameworks across all zones, leverage differentiated resilience-building pathways, and ultimately achieve bidirectional optimization of emission structures and ecosystem service functions. Cross-regional ecological compensation mechanisms and AI-enhanced carbon monitoring systems will further help balance developmental disparities and strengthen the city’s integrated low-carbon governance.
4.5 Spatial trade-offs and underlying mechanisms in urban low-carbon development
The spatial distribution of low-carbon zones, as identified by our NRCA-based analysis, reveals a distinct center-periphery pattern that is intrinsically linked to the city’s socioeconomic gradients and land-use configuration. This pattern largely corroborates and extends the foundational research on urban spatial differentiation (Zhao et al., 2014). Specifically, the classification of peripheral counties as ecologically advantaged zones aligns with expectations, given their abundance of carbon sink entities and robust ecological carrying capacity. Conversely, the central urban areas, characterized by a dominant tertiary sector and rationalized industrial structure, logically emerge as economically advantaged zones due to their higher carbon emission economic efficiency (Shan et al., 2018b). However, our findings add a critical nuance that the high economic efficiency in the core comes at the cost of ecological space, as urban expansion encroaches on carbon sinks, creating a tangible trade-off between economic and ecological advantages within the urban system. This observation on the link between spatial form and environmental efficiency is further supported by Yang et al. (2022), who quantified the impact of urban compactness on resource use in Chinese cities.
This observed trade-off resonates with the theoretical framework of land-use conflict in rapidly urbanizing regions (Seto et al., 2011). More importantly, the emergence of socially advantaged zones in central and western districts, marked by lower carbon emission density, suggests that factors like population density and spatial scale are pivotal independent determinants of low-carbon development. This finding partially diverges from studies that primarily correlate low-carbon performance with either economic structure or ecological endowment alone (Strohbach and Haase, 2012; Qin and Liu, 2022). It underscores the value of our multi-dimensional framework in uncovering the complex, and sometimes countervailing, forces at play. This approach is consistent with a multi-dimensional zoning scheme recently applied to the Yangtze River Delta, which identified zones with distinct economic, social, and ecological low-carbon advantages (Fan et al., 2024). Similarly, certain central urban areas exhibit advantages in economy and society, owing to their relatively favorable carbon emission scales and lower per capita and land emissions. The distribution patterns and characteristics of these low-carbon zones share similarities with findings from prior research (Chen et al., 2022).
From a theoretical perspective, the success of the NRCA index in mapping these relative advantages demonstrates the utility of integrating comparative advantage theory from economics into spatial environmental planning. It moves beyond conventional efficiency rankings (Zhang et al., 2015) by providing a relational understanding of a region’s strengths relative to the system as a whole. A key limitation of this zoning approach, however, is its static nature, capturing a snapshot in time. Future research should incorporate temporal dynamics to track the evolution of these advantages and the effectiveness of differentiated policies. This need for a dynamic perspective is echoed in recent work by Zhang et al. (2025), which emphasizes that sustaining long-term advantages requires synergistic advancements in green innovation and ecological resilience, alongside stronger cross-regional coordination. Nevertheless, by explicitly linking zone-specific characteristics to actionable optimization pathways, this study translates the theoretical concept of spatially differentiated governance into a practical tool for policymakers seeking to balance developmental and environmental goals.
5 Conclusion
This study establishes a high-precision spatial allocation method for carbon emissions using geospatial big data, enabling refined estimation of carbon emissions across urban territorial space. An integrated multidimensional evaluation system was further developed to assess socio-economic-ecological efficiency in low-carbon development, through which spatial heterogeneity within the study area was systematically examined. Based on the efficiency assessment results, a multidimensional zoning framework was constructed to support low-carbon spatial planning at the district and county level. The total carbon emissions of Xuzhou City were calculated as 92.27 million tons, with the industrial sector accounting for 81.47% of emissions, underscoring the city’s heavy reliance on traditional energy sources. Industrial land use exhibited the highest emission intensity, while the carbon sink capacity was substantially outweighed by emissions, indicating limited offset potential from ecological resources. Significant spatial heterogeneity was observed in both emissions and sinks, with most spatial units showing a clear mismatch between emission levels and sequestration capability.
The low-carbon development efficiency also displayed notable spatial variation across economic, social, and ecological dimensions, reflecting inherent disparities in regional socio-economic development patterns. Based on the proposed zoning methodology, district and county units were classified into five types of low-carbon advantaged zones. Results reveal that multi-dimensional advantaged zones remain scarce, suggesting that current urban spatial planning has yet to fully integrate coordinated low-carbon development across economic, social, and ecological perspectives. Spatially tailored strategies are therefore necessary to promote a transition from single-dimensional to multi-dimensional low-carbon advantages.
It should be noted that the low-carbon strategy proposed in this study focuses primarily on emission reduction targets, without fully accounting for inter-regional differences in socio-economic conditions and natural resource endowments. This limits its compatibility with the broader objectives of territorial spatial planning. While this research has contributed methodologies for carbon emission accounting, efficiency evaluation, and zoning, future work should explore the underlying factors influencing efficiency disparities. Further integration of low-carbon zoning outcomes with urban functional area planning could help optimize spatial structures and enhance the effectiveness of urban low-carbon governance, ultimately supporting the achievement of high-quality, sustainable urban development.
Data availability statement
The original contributions presented in the study are included in the article/supplementary material, further inquiries can be directed to the corresponding authors.
Author contributions
PL: Methodology, Conceptualization, Project administration, Investigation, Funding acquisition, Supervision, Writing – review and editing, Writing – original draft, Formal Analysis. XJ: Writing – original draft, Writing – review and editing, Data curation, Software, Funding acquisition. DW: Investigation, Resources, Software, Supervision, Data curation, Visualization, Project administration, Writing – review and editing. DJ: Investigation, Writing – review and editing, Project administration, Methodology, Supervision. XH: Validation, Visualization, Funding acquisition, Writing – review and editing, Investigation.
Funding
The author(s) declare that financial support was received for the research and/or publication of this article. This research was funded by the National Key Research and Development Program of China grant number 2018YFD1100200, General Project of Philosophy and Social Science Research in Colleges and Universities of Jiangsu Province” Research on the Construction of Aging Adaptability Residential Environment in Northern Jiangsu Based on Climate Comfort Optimization” grant number 2021SJA1107 and Jiangsu Collaborative Innovation Center for Building Energy Saving and Construct Technology Major Research Fund Program Project Grant No. SJXTZD21051.
Conflict of interest
The authors declare that the research was conducted in the absence of any commercial or financial relationships that could be construed as a potential conflict of interest.
Generative AI statement
The author(s) declare that no Generative AI was used in the creation of this manuscript.
Any alternative text (alt text) provided alongside figures in this article has been generated by Frontiers with the support of artificial intelligence and reasonable efforts have been made to ensure accuracy, including review by the authors wherever possible. If you identify any issues, please contact us.
Publisher’s note
All claims expressed in this article are solely those of the authors and do not necessarily represent those of their affiliated organizations, or those of the publisher, the editors and the reviewers. Any product that may be evaluated in this article, or claim that may be made by its manufacturer, is not guaranteed or endorsed by the publisher.
References
Balassa, B. (1965). Trade liberalisation and “revealed” comparative advantage. Manch. Sch. 33 (2), 99–123. doi:10.1111/j.1467-9957.1965.tb00050.x
Chen, J., Wang, Y., Li, Y., and Zhou, T. (2022). Spatial-temporal characteristics and drivers of the carbon emissions from building operations in the Yangtze river Delta, China. Environ. Sci. Pollut. Res. 30, 90213–90227. doi:10.1007/s11356-022-24570-9
Chuai, X., and Feng, J. (2019). High resolution carbon emissions simulation and spatial heterogeneity analysis based on big data in Nanjing city, China. Sci. Total Environ. 686, 828–837. doi:10.1016/j.scitotenv.2019.05.138
Deng, Z., Liu, J., Luo, B., Yuan, C., Yang, Q., Xiao, L., et al. (2023). AutoPCF: efficient product carbon footprint accounting with large language models. IEEE Trans. Eng. Manag. 70, 1–14. doi:10.1109/TEM.2023.3317873
Fan, Y., Jin, X., Gan, L., Jessup, L. H., Pijanowski, B. C., Lin, J., et al. (2024). Dynamics of spatial associations among multiple land use functions and their driving mechanisms: a case study of the Yangtze river Delta region, China. Environ. Impact Assess. Rev. 105, 106858. doi:10.1016/j.eiar.2022.106858
Guan, D., Liu, Z., Geng, Y., Lindner, S., and Hubacek, K. (2012). The gigatonne gap in China’s carbon dioxide inventory. Environ. Sci.and Technol. 46 (14), 3673–3680. doi:10.1021/es203369k
Hasan, M. M., Khanam, S., Chughtai, S., and Simonetti, B. (2020). A bottom-up approach to estimate economy-wide industrial energy consumption and CO2 emissions in developing countries: the case of Bangladesh. Energy Strategy Rev. 29, 100484. doi:10.1016/j.esr.2020.100484
Hu, Y., and Man, Y. (2023). Energy consumption and carbon emissions forecasting for industrial processes: status, challenges and perspectives. Renew. Sustain. Energy Rev. 182, 113405. doi:10.1016/j.rser.2023.113405
Jiang, Y., He, Y., Mao, Q., Chen, S., and He, D. (2013). City-level greenhouse gas emission inventory from a spatial planning perspective. City Plan. Rev. 37 (4), 50–56. doi:10.16361/j.upf.201304007
Jiang, M., Wang, R., Wood, R., Rasul, K., Zhu, B., and Hertwich, E. (2023). Material and carbon footprints of machinery capital. Environ. Sci. Technol. 57 (52), 21124–21135. doi:10.1021/acs.est.3c06180
Li, Y., Wang, Z., Wang, F., Dong, S., and Li, Z. (2013). A review of assessment methods, influencing factors and process on urban carbon emissions. J. Nat. Resour. 28 (9), 1637–1648. doi:10.11849/zrzyxb.2013.09.018
Li, L., Dong, J., Xu, L., and Zhang, J. f. (2019). Spatial variation of land use carbon budget and carbon compensation zoning in functional areas: a case study of Wuhan urban agglomeration. J. Nat. Resour. 34, 1003–1015. doi:10.31497/zrzyxb.20190508
Li, J., Guo, X., Chuai, X., Xie, F., Yang, F., Gao, R., et al. (2021). Reexamine China’s terrestrial ecosystem carbon balance under land use-type and climate change. Land Use Policy 102, 105275. doi:10.1016/j.landusepol.2020.105275
Li, W., Wang, W., Dong, X., Dong, K., and Jiang, H. (2022). How does industrial structure adjustment reduce CO2 emissions? Spatial and mediation effects analysis for China. Energy Econ. 105, 105704. doi:10.1016/j.eneco.2021.105704
Li, Y., Zhang, Y., Zhang, H., Zhang, Z., Fernandes, L. F. S., Pacheco, F. A. L., et al. (2023). Spatializing transportation carbon emissions based on land use: a case study of Beijing. Land Use Policy 124, 106439. doi:10.1016/j.landusepol.2022.106439
Long, Z., Zhang, Z., Liang, S., Chen, X., Ding, B., Wang, B., et al. (2021). Spatially explicit carbon emissions at the county scale. Resour. Conservation Recycl. 173, 105706. doi:10.1016/j.resconrec.2021.105706
Lu, J., Huang, X., Dai, L., Zhi, C., and Yue, L. (2012). Spatio-temporal scale analysis on the equality of energy consumption carbon emission distribution in China. J. Nat. Resour. 27, 2006–2017. doi:10.11849/zrzyxb.2012.12.002
Ma, L., Xiang, L., Wang, C., Chen, N., and Wang, W. (2022). Spatiotemporal evolution of urban carbon balance and its response to new-type urbanization: a case of the middle reaches of the Yangtze river urban agglomerations, China. J. Clean. Prod. 380, 135122. doi:10.1016/j.jclepro.2022.135122
Meng, F., and Zhang, W. (2022). Evaluating carbon emission efficiency and equality: a study of OECD countries. J. Environ. Manag. 324, 116289. doi:10.1016/j.jenvman.2022.116289
Miller, S. M., Michalak, A. M., Detmers, R. G., Hasekamp, O. P., Bruhwiler, L. M. P., and Schwietzke, S. (2019). China's coal mine methane regulations have not curbed growing emissions. Nat. Commun. 10, 303. doi:10.1038/s41467-018-07891-7
Qin, B., and Liu, J. (2022). Analysis on spatial and temporal evolution and spatial spillover of green development efficiency in the Yangtze river delta: based on super-SBM model and Tobit regression. Ecol. Econ. 38 (1), 64–71. doi:10.13763/j.cnki.jhebnu.ese.2023.01.005
Seto, K. C., Fragkias, M., Güneralp, B., and Reilly, M. K. (2011). A meta-analysis of global urban land expansion. PLoS ONE 6 (8), e23777. doi:10.1371/journal.pone.0023777
Seto, K. C., Dhakal, S., Bigio, A. G., Blanco, H., Dewar, D., Huang, L., et al. (2014). “Human settlements, infrastructure, and spatial planning,” in Climate change 2014: mitigation of climate change. Editor O. Edenhofer (Cambridge University Press), 923–1000. doi:10.1017/CBO9781107415416
Shan, Y., Guan, D., Hubacek, K., Zheng, B., Davis, S. J., Jia, L., et al. (2018a). City-level climate change mitigation in China. Sci. Adv. 4 (6), eaaq0390. doi:10.1126/sciadv.aaq0390
Shan, Y., Guan, D., and Liu, J. (2018b). Spatially explicit carbon emissions at the regional scale. J. Industrial Ecol. 22 (4), 848–863. doi:10.1111/jiec.12692
Shi, H., Mu, X., Zhang, Y., and Lu, M. (2012). Effects of different land use pattern on carbon emission in Guangyuan city of Sichuan province. Bull. Soil Water Conservation 32 (3), 101–106. doi:10.13961/j.cnki.stbctb.2012.03.020
Shi, J., Tang, H., Zhou, Q., Han, L., and Hao, R. (2023). High frequency measurement of carbon emissions based on power big data: a case study of Chinese Qinghai province. Sci. Total Environ. 896, 166075. doi:10.1016/j.scitotenv.2023.166075
Strohbach, M., and Haase, D. (2012). The carbon footprint of urban green space—A life cycle approach. Landsc. Urban Plan. 104 (2), 220–229. doi:10.1016/j.landurbplan.2011.10.013
Wang, Q., Gao, Z., and Ning, J. (2014). Model building discussions on the provincial differences of carbon emissions in China based on fairness for 2010. Resour. Sci. 36, 998–1004. doi:10.11842/chips.2014.05.011
Wang, Z., Feng, C., and Zhang, B. (2020). A comprehensive eco-efficiency model and dynamics of regional eco-efficiency in China. J. Clean. Prod. 267, 122071. doi:10.1016/j.jclepro.2020.122071
Wang, Q., Zhao, Z., Zhou, P., and Zhou, D. (2021). Use-stage life cycle greenhouse gas emissions of the transition to an autonomous vehicle fleet: a system dynamics approach. J. Clean. Prod. 278, 123447. doi:10.1016/j.jclepro.2020.123447
West, T. O., and Marland, G. (2002). Asynthesis of carbon sequestration, carbon emissions, and net carbon flux in agriculture: comparing tillage practices in the United States. Agric. Ecosyst.and Environ. 91 (1–3), 217–232. doi:10.1016/S0167-8809(01)00233-X
Wang, Z., and Du, Y. (2019). Performance of carbon emission in Hunan province based on three-stageSBM model. Nature 13, 23–30. J. Cent. South Univ. For. Technol. (Soc. Sci.)
Wiggins, E., Anderson, B., Brown, M., Campuzano-Jost, P., Chen, G., Crawford, J., et al. (2021). Reconciling assumptions in bottom-up and top-down approaches for estimating aerosol emission rates from wildland fires using observations from firex-aq. Geophys. Res. Lett. 126, e2021JD035692. doi:10.1029/2021JD035692
Xia, C., Xiang, M., Fang, K., Li, Y., Ye, Y., Shi, Z., et al. (2020). Spatial-temporal distribution of carbon emissions by daily travel and its response to urban form: a case study of Hangzhou. China. J. Clean. Prod. 257, 120797. doi:10.1016/j.jclepro.2020.120797
Yang, J., Zhang, M., Duo, L., Xiao, S., and Zhao, Y. (2022). Spatial pattern of land use carbon emissions and carbon balance zoning in jiangxi province. Res. Environ. Sci, 2312–2321. doi:10.13198/i.issn.1001-6929.2022.05.04
Yu, R., Cai, J., and Leung, P. (2009). The normalized revealed comparative advantage index. Ann. Regional Sci. 43 (1), 267–282. doi:10.1007/s00168-008-0213-3
Zhang, D., Zhao, Y., and Wu, J. (2023). Assessment of carbon balance attribution and carbon storage potential in China's terrestrial ecosystem. Resour. Conservation Recycl. 189, 106748. doi:10.1016/j.resconrec.2022.106748
Zhang, N., Kong, F., and Yu, Y. (2015). Total-factor carbon emission performance of fossil fuel power plants in China: a metafrontier non-radial Malmquist index analysis. Energy Econ. 51, 250–258. doi:10.1016/j.eneco.2015.07.002
Zhang, Y., Li, J., and Wang, H. (2025). Synergistic evolution of green innovation and ecological resilience in metropolitan regions: challenges and policy implications. Sustain. Cities Soc. 100, 105123. doi:10.1016/j.scs.2024.105123
Zhang, Z., Hou, Y., and Sun, H. (2023). Calculation of carbon emissions and the difference of low-carbon development efficiency on city territorial space. J. Nat. Resour. 38 (7), 1464–1481. doi:10.31497/zrzyxb.20230606
Zhao, R., Huang, X., and Peng, B. (2012). Research on carbon cycle and carbon balance of Nanjing urban system. Acta Geogr. Sin. 67, 758–770. doi:10.11821/xb201206005
Zhao, R., Zhang, S., Huang, X., Qin, Y., Liu, Y., Ding, M., et al. (2014). Spatial variation of carbon budget and carbon balance zoning of central plains economic region at county-level. Acta Geogr. Sin. 69 (10), 1425–1437. doi:10.11821/dlxb201410003
Zheng, D., Wu, H., Lin, C., and Weng, T. (2021). The formulation of urban carbon reduction unit and integrated planning methodology based on carbon accounting. Urban Plan. Forum 4, 43–50. doi:10.16361/j.upf.202104007
Keywords: carbon emissions, low-carbon development efficiency, low-carbon zoning, urbanterritorial spaces, composite dimension
Citation: Liu P, Ji X, Wang D, Jiang D and Hong X (2025) Zoning of urban territorial spaces: evaluating socio-economic-ecological low-carbon development efficiency in Xuzhou, China. Front. Environ. Sci. 13:1636744. doi: 10.3389/fenvs.2025.1636744
Received: 28 May 2025; Accepted: 25 September 2025;
Published: 09 October 2025.
Edited by:
Maria Alzira Pimenta Dinis, University Fernando Pessoa UFP, PortugalCopyright © 2025 Liu, Ji, Wang, Jiang and Hong. This is an open-access article distributed under the terms of the Creative Commons Attribution License (CC BY). The use, distribution or reproduction in other forums is permitted, provided the original author(s) and the copyright owner(s) are credited and that the original publication in this journal is cited, in accordance with accepted academic practice. No use, distribution or reproduction is permitted which does not comply with these terms.
*Correspondence: Xiang Ji, aml4aWFuZzA2MTVAeWVhaC5uZXQ=; Xiaochun Hong, aG9uZ3hjQHl6dS5lZHUuY24=