 Doaa Sami Khafaga1
 Asifa Iqbal2
 Shahid Mahmood3*Arfan Shahzad3
 Marwa M. Eid4,5Amal Ali Alhussan1
 El-Sayed M. El-Kenawy6,7
- 1Department of Computer Sciences, College of Computer and Information Sciences, Princess Nourah bint Abdulrahman University, Riyadh, Saudi Arabia
- 2School of International Studies, Zhengzhou University, Zhengzhou, China
- 3Malik Firoz Khan Noon Business School, University of Sargodha, Sargodha, Punjab, Pakistan
- 4Faculty of Artificial Intelligence, Delta University for Science and Technology, Mansoura, Egypt
- 5Jadara Research Center, Jadara University, Irbid, Jordan
- 6Department of Communications and Electronics, Delta Higher Institute of Engineering and Technology, Mansoura, Egypt
- 7Applied Science Research Center, Applied Science Private University, Amman, Jordan
Groundwater contamination is a growing concern in water-stressed regions like Sargodha, Punjab, Pakistan. This study aims to assess the physicochemical quality of groundwater using a Water Quality Index (WQI) approach and determine the suitability of groundwater for drinking and irrigation purposes. The samples were collected from a hand pump for 2–3 min to obtain physical results. Thirty groundwater samples were collected from various locations in Sargodha and analyzed for parameters such as pH, total dissolved solids (TDS), sodium (Na), potassium (K), chloride (Cl), calcium (Ca), magnesium (Mg), sulfate (SO4), bicarbonate (HCO3), and nitrate (NO3). The data were obtained through field sampling and tested at the Pakistan Council of Research in Water Resources (PCRWR). The results revealed that TDS, Na, K, and NO3 concentrations in many samples exceeded the permissible limits set by the World Health Organization (WHO). The computed WQI score averaged 84.57, classifying the groundwater as “poor” and generally unsuitable for drinking without treatment, though still usable for irrigation. Results indicate that groundwater pollution contributes to major health challenges, including gastrointestinal, neurological, and chronic diseases. These results highlight the importance of targeted water quality surveillance and public education to prevent potential public health and environmental hazards in the area. These findings provide valuable assistance to policymakers, and environmental agencies to develop more effective interventions to safeguard drinking water for the population in the region.
1 Introduction
Access to safe and potable water is one of the most pressing challenges of the 21st century. Approximately 785 million people still lack access to drinking water that is clean, and dirty water is still the cause of the outbreaks of waterborne diseases, including cholera, dysentery, and typhoid worldwide (Liu and Bridget, 2020). In developing countries, the challenges are even greater, and the rates of both scarcity and contamination are being accelerated by rapid population growth, climate change, and failing water management systems. Groundwater is generally believed to be safer than surface water by natural filtration through rocks and soil, but it is also impacted by anthropogenic intervention and natural geological events. Therefore, monitoring and evaluation of groundwater quality become essential part for sustainable water resources management at the global scale (Kumar et al., 2022; Kouadri et al., 2022). Rehman et al. (2024) utilized combined-parameter method in evaluating qualitative status of the groundwater in Urban South Asia. Results shows that a high percentage of the groundwater samples exceeded WHO guidelines for nitrate, sodium and chloride, which are very harmful to humans. Zhang et al. (2024) used a multicriteria analysis for evaluating water efficiency and environmental pressures in Chinese urban areas that illustrated how the local nature of infrastructure, alongside the sorts of practices of use occurring can locally set targets to determine sustainability outcomes at broader levels over time. Groundwater is the main source of drinking and irrigation supply in Pakistan, particularly in rural and peri-urban areas. There have been a number of studies showing pervasive pollution with high levels of total dissolved solids (TDS), sodium (Na), chloride (Cl), nitrate (NO3), heavy metals, which largely exceed the World Health Organization (WHO) level (Daud et al., 2017; Fida et al., 2023). The problem is further compounded through ineffective regulatory enforcement, unregulated agricultural runoff, industrial discharges and a lack of standardized monitoring systems. In most areas, raw groundwater is directly drunk and is thus associated with a large prevalence of gastro-intestinal and chronic diseases.
In Pakistan, majority of the people don’t have safe and clean drinking water. The situation of the country is deteriorating and everything is crumbling down due to this acute shortage of water as well. Safe drinking water is a major problem in Pakistan which is a potential threat to the human life One of the big issues of the Pakistan is the provision of the safe drinking water which create the big threat for the human life (Naz et al., 2022). For example, research in Rawalpindi, Faisalabad, and Kasur showed the microbial and chemical pollution in a range that makes water inappropriate to human use (Farooq et al., 2008; Nasir et al., 2016; Arshad and Imran, 2017). These results highlight the imperative of local assessments which capture the combined influences of human pressures and the geological on groundwater quality. Punjab province is especially at risk because of its high population density, high-volume agriculture and rapid rate of urbanization. The groundwater contamination in Punjab not only poses a risk to human health, but also jeopardizes food security and agriculture production, since irrigation is largely based on groundwater resources. A number of studies have shown that carbonate and silicate lithology that form the aquifer in central Punjab play a role in controlling the chemistry of groundwater (Ali et al., 2024; Khan et al., 2022). Groundwater is a vital resource for life and livelihood, however, there is a dearth of research focusing on groundwater quality in Sargodha District, which is an important agricultural center of Punjab. The dependence in the region on boreholes and hand pumps as a major source of water makes the situation more susceptible to contamination, especially in the absence of regular monitoring. There are useful insights from national and provincial studies, but these are not comprehensive for targeted district challenges. As such, empirical data at the local levels should therefore be produced for the benefits of both community practitioners and policymakers. In this context, the present study was designed with three specific objectives: (i) to assess the physicochemical status of groundwater in Sargodha District Figures 1, 2 using the Water Quality Index (WQI) approach, (ii) to evaluate its suitability for drinking and irrigation purposes, and (iii) to analyze the influence of local geology on groundwater quality. This study also describes district-level evidence for water of various types, the relationship between level of contamination on the one hand, and on the other, human activities, natural (geogenic) source of the contamination, or both. In the long-term, the results are meant to contribute to sustainable water resources management and public health protection in one of Pakistan’s most water-stressed areas.

Figure 1. Water pollution in Sargodha. Source: Author visit.
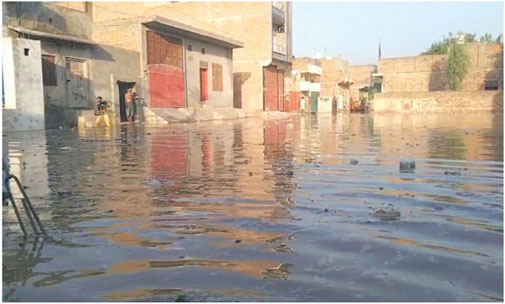
Figure 2. Polluted water in living society Sargodha. Water pollution in Sargodha. Source: Author visit.
1.1 Study area profile
The Sargodha Division is situated in central Punjab, Pakistan and lies between latitude 31.3°–32.6° N and longitude 71.8°–73.4° E. It is comprised of four districts which are Sargodha, Khushab, Mianwali and Bhakkar. The area is located in the fertile plains of the Punjab basin and is primarily dependent on surface as well as groundwater resources for agricultural, livestock and domestic use. The study area has a semi-arid climate with warm to hot summers (45 °C) and mild winters. The annual mean precipitation varies from 300 to 500 mm and concentrated mainly during the monsoon months. The region is lithological controlled by alluvium deposits of silt, clay, and sand that control groundwater replenishment and quality. The aquifer is of the depth from 40 m to 100 m and is mainly accessed by using hand pumps and tube wells. The Sargodha is an urban mixed rural area and its population is over 8 million. Most live-in hinterland communities on untreated groundwater for daily use. These characteristics make Sargodha a suitable model to evaluate water quality risks in the areas where underground water is the main source of water. Profile of the study area has been depicted in Figure 3.

Figure 3. Study area profile.
2 Materials and methods
2.1 Sample collection
The groundwater samples were obtained from the Sargodha city, in the Punjab province of Pakistan, at sixteen different points (Figure 3). The sites were selected using a non-probability purposive sampling approach to cover generalized properties with respect to urban situations and population densities, as well as residential and commercial water usage. A total of 30 ground water samples were collected from the depth of 23–67 m. Samples were collected in 1.5 L plastic bottles, after prewashing them with de-ionized water and rinsing with sample water before collecting the samples. After the pumping of hand pump for 2–3 min to stabilize physical parameters, samples were collected. For nitrate measurement, 100 mL of water was collected in the sterilized bottles and 1 mL of boric acid solution by the sterile syringe was injected through it after to stop the reaction further. All samples were analyzed in Pakistan Council of Research in Water Resources.
2.2 Groundwater analysis
The pH and total dissolved solids (TDS) of the groundwater samples collected (n = 30) were determined with a glass electrode (pH meter, Adwa AD 111) and an electrical conductivity (EC) meter (Adwa AD 330) both were conducted TDS was calculated. A flame photometer (JENWAY PFP7) was used to determine sodium and potassium concentrations. The sulfate content was determined gravimetrically, and the bicarbonate level was obtained by titration. The argentometric titration method was used for determining chloride concentration. Calcium concentration was determined by the standard EDTA titration method (1992), and magnesium concentration was calculated by deriving magnesium content from the hardness (total hardness calcium) using a standard formula. For the determination of nitrate concentration, groundwater samples were preserved with boric acid and analyzed with the cadmium reduction method (HACH-8171) using a spectrophotometer (HACH, Germany). The pH meter (Adwa AD 111) and electrical conductivity (EC) meter (Adwa AD 330) were supplied by Adwa Instruments, Szeged, Hungary. The flame photometer (JENWAY PFP7) was manufactured by Jenway Staffordshire, United Kingdom. The determination of nitrate was carried out in a spectrophotometer (HACH) model with HACH Company, Düsseldorf, Germany. All reagents of chemical analysis in the present study were of analytical grade and obtained from accredited suppliers. For analytical quality control and data verification, all instruments were calibrated as recommended by the manufacturers before use. Method detection limits (MDLs) for each analyte were calculated from the repeated analysis of low-level standards such that the thresholds of detection were below WHO guideline levels.
Sulfate (SO42-) concentration was analyzed by turbidimetric method in APHA standard methods (4500-SO42- E). Here, in this method, the sulfate ions in the sample reacts with barium chloride to give a turbidity which is proportional to the sulfate concentration. The turbidity was determined by the UV–Vis spectrophotometry at 420 nm with a UV–Visible spectrophotometer (HACH, DR 3900 TGK, Germany). Calibration curves were obtained using certified sulfate standards (R2 > 0.99). The analysis’ method detection limits were 0.5 mg/L and precision was validated by performing duplicate analyses (recoveries 95%–102%). Nitrate were determined by the cadmium reduction method (APHA 4500-NO3- E) with a UV–Visible spectrophotometer (HACH DR 3900, Germany). In this process the nitrate is reduced to nitrite by passing the sample through a reduction column (copper-cadmium). The nitrite produced reacts with sulfanilamide and N-(1-naphthyl)-ethylenediamine dihydrochloride to produce a pink azo dye, which was measured at 543 nm. Before analysis, the groundwater samples were preserved using 1 mL of boric acid per 100 mL to inhibit the microbial activity, and stored at 4 °C Calibration was made using potassium nitrate standards in the range 0.1–20 mg/L Analytical quality control comprised method blanks, duplicates and spiked recoveries (90%–104%).
2.3 Analytical quality control
Strict quality control procedures were performed to guarantee the quality of the results. Daily calibration of all equipment was performed according to manufacturer instructions. CRM (High Purity Standards, United States) was analyzed together with the samples for further validation of accuracy, the recovery percentage efficiency for all major ions was observed to be 95%–103%. Calibration curves of the parameters were generated by standard solutions of five concentration levels, and the correlation coefficients (R2) were more than 0.99. The Limit of Detection (LOD) was 0.01 mg/L for nitrate, 0.5 mg/L for sulfate, and below WHO guideline thresholds for other ions. Blank measurements were performed using ultrapure deionized water (Milli-Q system, Millipore, United States), and no significant contamination was detected. Replicate analyses (n = 3) of randomly selected samples showed a relative standard deviation (RSD) below 5%. Spiked recoveries were within 96%–104%, confirming the robustness of the analytical procedures. These validation parameters demonstrate that the reported values are accurate, reproducible, and suitable for hydrogeochemical assessment.
2.4 Water quality index (WQI)
The Water Quality Index (WQI) in this study was calculated using the weighted arithmetic index method (Brown et al., 1972), which is a refinement of the original approach by Horton (1965). While Horton’s method provided the foundational concept, the present study applies updated permissible limits and parameter weights following WHO standards. The classification of water quality was adopted from Brown et al. (1972), adapted to our dataset to define categories such as excellent, good, fair, poor, very poor, and unfit for drinking. Following many studies done after 2017, the WQI methodology is one that has been successfully performed to study and interpret water quality problems (Kumar et al., 2019). Approaches using WQI are well-known and well-accepted methods of determining water quality in the scientific literature, including (Patel et al., 2023), as examples. Which paves the way for an in-depth analysis of various physical, chemical, and biological parameters required to assess the groundwater quality in the Sargodha Division. Studies that highlight the versatility and use of WQI in assessing water quality especially (Gupta et al., 2021). Therefore, WQI is suitable for our study. We will use the WQI methodology to generate a numerical water quality quantifier which can be used for evidence-based decision-making. This will help prioritize actions and resources needed to ensure the sustainable management of water resources and safeguarding of public health in Sargodha Division (Krishan et al., 2023). The water quality index is computed by the following expression as shown in Equations 1–3.
Were, WQI = Water Quality Index.
Qi = Quality rating for the ith parameter.
Wi = Unit weight for the ith parameter.
The quality rating (Qi) is calculated using;
Were, Vi = Observed concentration of parameter i (e.g., mg/L)
Vo = Ideal value (0 for all except pH = 7).
Si = Standard permissible value of parameter i (e.g., mg/L).
The unit weight (Wi) is determined by;
Where, K = Proportionality constant.
Si = WHO standard permissible value for parameter i (mg/L or unitless for pH)
Calculating the WQI of groundwater parameters comprises multiple steps apart from the estimation of quality rating of each parameter using a general formula. A quality score of 0 means there are no pollutants and a quality score in the 0 to 100 range means the level of pollutants is within acceptable standards. But if the score is greater than 100, it means that pollutants are above the acceptable limits (Gungoa, 2016). To calculate the unit weight for all physicochemical parameters using specific formula is another task to do in the following step. These unitary weights are used to normalize parameters that exist in different dimensions and scales on a common scale (Bora and Goswami, 2017).
3 Results and discussions
The summary statistics for the groundwater quality parameters are shown in Table 1. Mean total dissolved solids (TDS) also had a high mean of 630.9 mg/L, with all samples exceeding the WHO permissible limit of 500 mg/L, and up to 990 mg/L (Table 1). Nevertheless, all the samples were below the Pakistani limit of 1,000 mg/L set for drinking water. The pH levels ranged from 7.4 to 8.4 were neutral to slightly alkaline condition, were well within the WHO recommended range of 6.5–8.5 for drinking water quality. The concentrations of sodium (Na) and chloride (Cl) in the groundwater of Sargodha were highly variable, from 104 to 508 mg/L for Na and from 46 to 763 mg/L for Cl. Results: About 50% of samples exceeded WHO acceptable limits of sodium and chloride concentration (Table 1). The average concentrations of Na and Cl were also above WHO recommended values of 200 mg/L and 250 mg/L respectively. This indicates that a common fact is probably responsible for the higher concentration of these two ions in the groundwater of study area. Natural sources of these two ions include halite dissolution, water rock interactions, saline seeps and minor inputs from the atmosphere. Calcium concentrations displayed high variability (36–116 mg/L), there were 45.9% of monitored wells exceeding the WHO reference limit (75 mg/L) (Table 1). The same was found for magnesium, which had concentrations varying from 58.45 to 215.94 mg/L and averaged 141.3 mg/L, while one in three samples had a Mg greater than Ca concentration. This indicates the interaction of the groundwater with dolomitic rocks and clays. Since clays and limestone dominate the subsurface geology, these lithic layers are probably the major source of Mg in groundwater.

Table 1. Physico-chemicals parameters determined in groundwater of Sargodha Punjab Pakistan.
Magnesium (Mg) was the only ion that showed high concentrations in all groundwater samples, whereas concentrations of Ca and K ranged between 8 and 16 mg/L and concentrations of HCO3 and Cl ranged from 100 to 480 mg/L and 100–340 mg/L, respectively (Cole et al., 2004). Infiltration of sewage into the groundwater could be argued to be responsible for increasing TDS content. The higher magnitude of Mg compared to Ca concentrations among all the samples may also suggest groundwater interactions with locally occurring dolomitic rocks as well as contamination originating from the surrounding sewage point sources in the study area (Srivastava and Pandey, 2012). All measured samples (n = 30) contained bicarbonate (HCO3) in concentrations between 100 and 430 mg/L (average: 272 mg/L). Generally, the levels of sulfate (SO4) ranged between 100 and 304 mg/L with an average concentration of 190.5 mg/L, and all esteemed groundwater samples were within the permissible limit of 250 mg/L established by the WHO for drinking water in most cases (Table 1), except for five samples. In some (Srivastava and Pandey, 2012) of samples, the higher concentrations of SO4 can be ascribed to industrial waste and domestic sewage discharge. The nitrate (NO3) concentrations ranged between 5 and 18 mg/L with an average value of 12.6 mg/L, and all samples, except twelve, stayed within the permissible limit for drinking water defined by WHO (2011). Sulfate SO4 was determined using the turbidimetric method in accordance with APHA standard methods (4500-SO42−E) with a UV Visible spectrophotometer. NO3 was analyzed using the cadmium reduction method (APHA 4500-NO3- E) with the same spectrophotometer setup. Calibration was carried out using certified reference standards, and method detection limits were established prior to sample analysis. Analytical quality control included the use of laboratory blanks, duplicate samples, and spiked samples, ensuring recovery rates within ±5% and precision (RSD) below 5%. All sample containers were prewashed with deionized water, rinsed with sample water before collection, and stored at 4 °C until analysis. This indicates either limited nitrate production in aquifers or the presence of nitrate-reducing bacteria that are actively keeping nitrate at bay in the groundwater. Human activity in urbanized areas including road salt application, industrial effluents, leachate from regional landfills, and wastewater from private and municipal septic systems often result in heightened sodium (Na) and chloride (Cl) concentrations contained in the groundwater. Some of these excesses may also come from agricultural chemicals (Buttle and Labadia, 1999).
4 Geochemical facies analysis
The hydrogeochemical characteristics of the groundwater samples were analyzed applying Piper, Durov and Gibbs diagrams that are powerful tools for interpretation of the chemical composition of ground water and quantification of the dominant geochemical processes (Piper, 1944; Gibbs, 1970).
These diagrams have been widely used in the current hydrogeochemical research and are still the classical method for facies interpretation (Krishan et al., 2023; Ali et al., 2024). Although some authors have suggested modern graphical styles and methodological improvements to enhance clarity (Hoaghia et al., 2021; Marandi and Shand, 2018), the traditional plotting style employed in this manuscript leads to scientifically sound and comparable outcomes. Therefore, the figures in this paper adopt the above utilized one but maintain consistence with regional and international hadrochemical analysis.
4.1 Piper diagram
Figure 4, shows the presence of two principal water types; (Ca–Mg–HCO3) bicarbonate–alkaline earth and (Na–Cl) These Ca–Mg–HCO3 waters are characteristic of young recharge in contact with carbonate lithologies (dissolution of calcite/dolomite) and are only slightly anthropogenically modified. Samples plotting near the Na–Cl corner are indicative of higher salinity and mineralization, typical of evaporite dissolution, higher residence times, cation exchange (Na+from clays being released and Ca 2+/Mg 2+ being taken up), and anthropogenic impact from irrigation return flow and domestic wastewater. Combined positions indicate evolutionary transition between these.

Figure 4. Piper diagram.
4.2 Durov diagram
The Durov projection supports the Piper facies and emphasizes ion-exchange contributions in samples trended towards higher Na+ for the same alkalinity, suggesting the exchange of Ca2+/Mg2+ for Na+ on aquifer surfaces. The two aforementioned points as well as the other points that tend towards the Cl−–SO42- end, combined with high TDS, are indicative of contributions from fertilizer residues, sewer leakage or evaporative concentration in irrigated tracts. See Figure 5, the clustering suggests spatially varying impact by the agricultural activity and local wastewater pollution on top of a lithological control.

Figure 5. Durov diagram.
4.3 Gibbs diagram
Figure 6 indicates that the majority of samples are characterized in the rock water interaction dominance field, supporting that carbonate/silicate weathering governs base flow chemistry. A minor part migrates towards the evaporation–crystallization field, where they are explained by semi-arid conditions, shallow water tables in the impact of irrigation and solute accumulation by return flow. The trend towards higher Na/(Na + Ca) and Cl/(Cl + HCO3) ratios with increasing TDS and the positive association with high TDS additionally indicates the influence of evaporative concentration and secondary processes (i.e., ion exchange and anthropogenic loading) as significant modifiers of the natural signal.

Figure 6. Gibbs diagram.
4.4 Correlation analysis
Relationship between water quality variables was investigated using a correlation matrix. There are very strong positive correlations between TDS and Na (r = 0.79), Cl and Na (r = 0.75) and Mg and hardness (r = 0.81), which may indicate common anthropogenic or geogenic sources (such as rock dissolution, sewage contamination). Figure 7 gave the correlation matrix of groundwater matrix.

Figure 7. Correlation matrix of ground water parameters.
4.5 Principal component analysis (PCA)
The PCA transformed the dataset into three principal components (PCs) explaining 84% of total variance of the groundwater chemistry of Sargodha (Figure 8). PC1 (52.4% variance) presented marked positive loadings for TDS, Na, K, and Cl. This factor mainly represents mineral dissolution and salinity induced processes, such as halite dissolution and cation exchange of clay minerals with ground water. The closer relationship of Na with Cl indicates that both geogenic processes (e.g., rock-water interaction) and anthropogenic activities, e.g., the use of saline groundwater for irrigation and wastewater infiltration. The second component (PC2, 21.7% variance) was mostly characterized by nitrate and sulfate, and associated with agriculture runoff and domestic sewage inputs. High NO3− concentrations in multiple samples suggest nitrogen fertilizer leaching, whereas SO42- can arise from both fertilizers and wastewater. This part reinforces the contribution of anthropogenic activities in spatial distribution of groundwater quality in Sargodha, especially in regions where there is excessive use of groundwater for agriculture. PC3 (9.9% of the variance) was dominated by high loading of Ca and Mg, which indicated carbonate and dolomitic lithologies in the aquifer system. These correlations show that dissolution of calcite and dolomite minerals is a geogenic control to groundwater chemistry as per the geological settings of the Punjab plains.

Figure 8. PCA of ground water parameters.
The combined above three factors show that the groundwater characteristics in Sargodha are largely controlled both by natural (carbonate weathering, minerals dissolution, ion exchange) and anthropogenic (fertilizer leaching, wastewater intrusion, and irrigation return flow) processes. Equivalent PCA interpretations have been found (Nasir et al., 2016; Rehman et al., 2024) in other parts of Pakistan and South Asia whereby Na–Cl enrichment and nitrate contamination were attributed to mix geogenic–anthropogenic sources. Therefore, the PCA not only confirms the correlation results, but also gives a good separation of the pollution sources and represents a powerful diagnostic method for groundwater management.
4.6 Comparative analysis
Levels of Na, Cl, and nitrate in general are comparable to or higher than the studies related to groundwater in Rawalpindi (Farooq et al., 2008), Faisalabad (Nasir et al., 2016) and Kasur (Arshad and Imran, 2017) as were reported in the case of contaminated groundwater. This is consistent with the results of Daud et al. (2017), who found that groundwater contamination in Pakistan was associated with untreated wastewater and agrochemical wash off. This cross-validation increases the confidence of our results, and underscores the necessity of local monitoring plans of groundwater quality.
4.7 Water quality index
WQI is employed to analyze groundwater quality in the Sargodha division. By representing water quality with a single item on a numeric scale, it streamlines conditional criteria for exposure assessment by condensing the concentrations of multiple parameters into one value for a given sample. The method generates a consolidated index across multifarious water quality parameters and offers a holistic interpretation of groundwater quality for various usages like drinking, irrigation and industrial (Rana and Ganguly, 2020). The First step for calculating groundwater’s WQI is to estimate each parameter’s quality rating using the formula

Table 2. Water quality index of collected groundwater samples from Sargodha Pakistan.
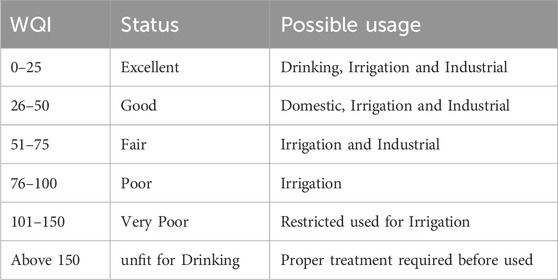
Table 3. WQI range, status and possible usage of the water sample (Brown et al., 1972).
The WQI of 84.57 found for the overall index reflects the categorization of the groundwater quality as poor (76–100). TDS, Na, K, and NO3 were major factors that controlled the high WQI value. pH, HCO3 and SO4 being within the WHO ranges had minimal impact on the index due to the variations observed. The computed values from the weighted arithmetic index of the WQI reveals that, the groundwater of the study area is unsuitable for drinking purpose but suitable for agricultural practices.
5 Conclusion
The present research evaluated groundwater quality in five tehsils of Sargodha district by which physical-chemical analysis, correlation analysis, multivariate statistics and WQI calculations were carried out. In TDS, Na and Cl were highly positively correlated, while Mg and hardness showed a high correlation, indicating a common geogenic source including the mineral dissolutive and sewage intrusion. These relationships indicate that natural lithological processes and anthropogenic sources play significant roles in controlling the hydrochemistry of the region together. Principal Component Analysis also confirmed these observations as three main components were derived which explained 84% of the variability. The PC1 described selenic object with higher TDS, Na, K and Cl, which was mainly governed by mineral weathering and cation exchange. PC2 was anthropogenically influenced and was characterized by high loadings of nitrate and sulfate, particularly due to fertilizer applications and wastewater penetration. PC3 was dominated by Ca and Mg, which was in accordance with carbonate and dolomitic lithology in the deeper part of the aquifer system. Altogether, PCA analysis indicated the joint influence of lithology and anthropogenic activities in controlling groundwater quality. Most of the samples were classified as “poor” (average WQI: 84.57), indicating that the water is not suitable for drinking without previous treatment, but it can still be used for irrigation. High TDS, Na, K, and NO3 were the main reasons for the bad quality of the water. These results are consistent with other studies carried out in Punjab and other South Asian aquifers, suggesting the requirement of rigorous monitoring. In general, the findings suggest that the groundwater pollution occurs in Sargodha due to both natural (carbonate weathering, mineral dissolution, ion exchange) and anthropogenic (fertilizer percolation, sewage seepage, irrigation return flows) processes. The consequences are more serious for public health, because non-treated groundwater is still the main source of drinking water for rural and peri-urban populations. Thus, sub regional groundwater management techniques, better monitoring methods, and social awareness programs are critically needed to reduce the risk of contamination in the area and ensure sustainable use of water resources in the area. Graphical conclusion has been shown in Figure 9.

Figure 9. Graphical conclusion.
5.1 Policy recommendation
The results from this study highlight the necessity of region-specific, integrated approaches to control groundwater contamination in Sargodha. Pakistan has, however, developed various policy frameworks in order to regulate water quality including the National Water Policy (2018) the Punjab Drinking Water Policy (2007) and Pakistan Environmental Protection Act (PEPA) 1997, however, the deployment of such policies is restricted in Pakistan due to a variety of institutional and administrative bottlenecks. Among them fractured governance between the federal, provincial, and municipal governments, and among water, sanitation, and public health authorities; inadequate budgets and weak enforcement capacity at the district level. To fill this implementation gap, there is an urgent need to improve capacity of local water monitoring systems. Creating tehsil-level water quality monitoring centers within the PCWR could potentially enable on-going testing, data transparency and interventions in a timelier manner. Better co-ordination between departments, most notably health, environment and local government will be vital in ensuring that the management of water, fits within a wider public health and environmental rationale. Additionally, raising public awareness plays a key role in moderating behavior. This knowledge can help empower local communities to not only educate them in terms of hazards from untreated ground water, but to also promote household level filtration technologies and water conservation efforts, which all can reduce exposure to contaminated water sources. At the policy level, there is also a need for amending groundwater extraction regulations to make it mandatory for providing quality-based conditions for granting a license for digging borewells. That would be an important step towards reducing over-exploitation of groundwater and the degradation of water quality. Another important area is agriculture, because agricultural runoff is a proven source of nitrate and sulfate contamination of drinking water sources, water quality policies should encourage and train farmers to adopt more sustainable farming practices that minimize chemical usage. In conclusion, investment in small-scale water treatment infrastructure and sanitation systems, which are particularly needed in poorly-served rural communities, is necessary for the public health to be enjoyed by all population segments.
5.2 Limitations and future directions
Although the study was conducted in several tehsils of Sargodha District including both urban and rural settings, but it is also constrained by the number of NH3 sampling sites (30 points) which may possibly not have covered micro-level spatial gradient. The study was also limited to physicochemical parameters, thus microbiological contaminants and heavy metals such as arsenic and lead were left out. Species specific dose-response models for hazard quotients with chronic daily intake models were also not developed given the full-scale of the health risk assessment was not conducted for this study. Future research work ought to take into account seasonality, larger sample sizes, microbiological and heavy metal analysis and sophisticated modeling methods for better understanding of the groundwater quality and its health impacts. A detailed health impact assessment is important to correctly measure the health risks associated with eating and drinking contaminated water.
Data availability statement
The raw data supporting the conclusions of this article will be made available by the authors, without undue reservation.
Author contributions
DK: Writing – original draft, Conceptualization, Methodology. AI: Writing – review and editing, Project administration, Methodology, Conceptualization. SM: Writing – review and editing, Visualization, Writing – original draft, Formal Analysis. AS: Project administration, Writing – review and editing, Formal Analysis, Investigation. ME: Software, Data curation, Writing – review and editing, Validation. AA: Visualization, Methodology, Writing – original draft, Resources. E-SE-K: Investigation, Supervision, Funding acquisition, Resources, Visualization, Project administration, Writing – review and editing.
Funding
The author(s) declare that financial support was received for the research and/or publication of this article. This paper was funded by Princess Nourah bint Abdulrahman University Researchers Supporting Project number (PNURSP2025R754).
Acknowledgments
Princess Nourah bint Abdulrahman University Researchers Supporting Project number (PNURSP2025R754), Princess Nourah bint Abdulrahman University, Riyadh, Saudi Arabia.
Conflict of interest
The authors declare that the research was conducted in the absence of any commercial or financial relationships that could be construed as a potential conflict of interest.
Generative AI statement
The author(s) declare that no Generative AI was used in the creation of this manuscript.
Any alternative text (alt text) provided alongside figures in this article has been generated by Frontiers with the support of artificial intelligence and reasonable efforts have been made to ensure accuracy, including review by the authors wherever possible. If you identify any issues, please contact us.
Publisher’s note
All claims expressed in this article are solely those of the authors and do not necessarily represent those of their affiliated organizations, or those of the publisher, the editors and the reviewers. Any product that may be evaluated in this article, or claim that may be made by its manufacturer, is not guaranteed or endorsed by the publisher.
References
Ali, A., Ullah, Z., Ismaeel, N., Rashid, A., Khalid, W., Inayat Ullah Khan, M., et al. (2024). Integrated approach to hydrogeochemical assessment of groundwater quality in major industrial zone of Punjab, Pakistan. Environ. Sci. Pollut. Res. 31, 34396–34414. doi:10.1007/s11356-024-33402-x
Arshad, N., and Imran, S. (2017). Assessment of arsenic, fluoride, bacteria, and other contaminants in drinking water sources for rural communities of kasur and other districts in Punjab, Pakistan. Environ. Sci. Pollut. Res. 24, 2449–2463. doi:10.1007/s11356-016-7948-7
Bora, M., and Goswami, D. C. (2017). Water quality assessment in terms of water quality index (WQI): case study of the kolong river, Assam, India. Appl. Water Sci. 7 (6), 3125–3135. doi:10.1007/s13201-016-0451-y
Brown, R. M., McClelland, N. I., Deininger, R. A., and O’Connor, M. F. (1972). “A water quality Index—Crashing the psychological barrier,” in Indicators of environmental quality (Springer), 173–182. doi:10.1007/978-1-4684-2856-8_15
Buttle, J. M., and Labadia, C. F. (1999). Deicing salt accumulation and loss in highway snowbanks. J. Environ. Qual. 28, 155–164. doi:10.2134/jeq1999.00472425002800010018x
Cole, A. A., Smecker-Hane, T., Tolstoy, E., Bosler, T., and Gallagher, J. (2004). The effects of age on red giant metallicities derived from the near-infrared Ca II triplet. Mon. Notices R. Astronomical Soc. 347 (2), 367–379. doi:10.1111/j.1365-2966.2004.07223.x
Daud, M., Nafees, M., Ali, S., Rizwan, M., Bajwa, R. A., Shakoor, M. B., et al. (2017). Drinking water quality status and contamination in Pakistan. BioMed Res. Int. 2017 (1), 1–18. doi:10.1155/2017/7908183
Farooq, S., Hashmi, I., Qazi, I. A., Qaiser, S., and Rasheed, S. (2008). Monitoring of coliforms and chlorine residual in water distribution network of rawalpindi, Pakistan. Environ. Monit. Assess. 140, 339–347. doi:10.1007/s10661-007-9872-2
Fida, M., Li, P., Wang, Y., Alam, S. K., and Nsabimana, A. (2023). Water contamination and human health risks in Pakistan: a review. Expo. Health 15 (3), 619–639. doi:10.1007/s12403-022-00512-1
Gibbs, R. J. (1970). Mechanisms controlling world water chemistry. Science 170 (3962), 1088–1090. doi:10.1126/science.170.3962.1088
Gungoa, V. (2016). Use of water quality indices for water quality assessment in small island state: a case study in the northern aquifer of Mauritius. Am. Sci. Res. J. Eng. Technol. Sci. (ASRJETS) 00-00.
Gupta, S., Wang, W., Hayek, S. S., Chan, L., Mathews, K. S., Melamed, M. L., et al. (2021). Association between early treatment with tocilizumab and mortality among critically ill patients with COVID-19. JAMA Intern. Med. 181 (1), 41–51. doi:10.1001/jamainternmed.2020.6252
Hoaghia, M. A., Moldovan, A., Kovacs, E., Mirea, I. C., Kenesz, M., Brad, T., et al. (2021). Water quality and hydrogeochemical characteristics of some karst water sources in apuseni Mountains, Romania. Water 13 (6), 857. doi:10.3390/w13060857
Horton, R. K. (1965). An index number system for rating water quality. J. Water Pollut. Control Fed. 37, 300–306.
Khan, R. U., Hamayun, M., Altaf, A. A., Kausar, S., Razzaq, Z., and Javaid, T. (2022). Assessment and removal of heavy metals and other ions from the industrial wastewater of faisalabad, Pakistan. Processes 10 (11), 2165. doi:10.3390/pr10112165
Kouadri, S., Pande, C. B., Panneerselvam, B., Moharir, K. N., and Elbeltagi, A. (2022). Prediction of irrigation groundwater quality parameters using ANN, LSTM, and MLR models. Environ. Sci. Pollut. Res. 29, 21067–21091. doi:10.1007/s11356-021-17084-3
Krishan, G., Kumar, M., Rao, M. S., Garg, R., Yadav, B. K., Kansal, M., et al. (2023). Integrated approach for the investigation of groundwater quality through hydrochemistry and water quality index (WQI). Urban Clim. 47, 101383. doi:10.1016/j.uclim.2022.101383
Kumar, R., Singh, S., and Sharma, R. C. (2019). Application of WQI for assessment of water quality of high altitude Lake dodi tal, garhwal himalaya, India. Sustain. Water Resour. Manag. 5, 1033–1042. doi:10.1007/s40899-018-0281-1
Kumar, R., Qureshi, M., Vishwakarma, D. K., Al-Ansari, N., Kuriqi, A., Elbeltagi, A., et al. (2022). A review on emerging water contaminants and the application of sustainable removal technologies. Case Stud. Chem. Environ. Eng. 6, 100219. doi:10.1016/j.cscee.2022.100219
Liu, J., and Bridget, R. (2020). Food-energy-water nexus for multi-scale sustainable development. Resour. Conservation Recycl. 154 (C).
Marandi, A., and Shand, P. (2018). Groundwater chemistry and the gibbs diagram. Appl. Geochem. 97, 209–212. doi:10.1016/j.apgeochem.2018.07.009
Nasir, A., Nasir, M. S., Shauket, I., Anwar, S., and Ayub, I. (2016). Impact of samanduri drain on water resources of faisalabad. Adv. Environ. Biol. 10 (1), 155–160.
Naz, S., Mansouri, B., Chatha, A. M. M., Ullah, Q., Abadeen, Z. U., Khan, M. Z., et al. (2022). Water quality and health risk assessment of trace elements in surface water at punjnad headworks, Punjab, Pakistan. Environ. Sci. Pollut. Res. 29 (40), 61457–61469. doi:10.1007/s11356-022-20210-4
Patel, P. S., Pandya, D. M., and Shah, M. (2023). A systematic and comparative study of water quality index (WQI) for groundwater quality analysis and assessment. Environ. Sci. Pollut. Res. 30 (19), 54303–54323. doi:10.1007/s11356-023-25936-3
Piper, A. M. (1944). A graphic procedure in the geochemical interpretation of water-analyses. Eos, Trans. Am. Geophys. Union 25 (6), 914–928.
Rana, R., and Ganguly, R. (2020). Water quality indices: challenges and Applications—An overview. Arabian J. Geosciences 13 (22), 1190. doi:10.1007/s12517-020-06135-7
Rehman, S. U., Abro, R., Xu, X., Imran, M., and Anjum, M. N. (2024). Quantifying groundwater quality and associated health risk in an urban setting of south Asia using a multi-parameter assessment framework. Environ. Sci. Pollut. Res.
Srivastava, R. K., and Pandey, D. (2012). Physico-chemical and microbiological quality evaluation of groundwater for human domestic consumption in adjoining area of omti nallah, jabalpur (MP), India. Int. J. Environ. Sci. 3 (3), 1089–1096. doi:10.6088/ijes.2012030133017
Keywords: Groundwater, water quality index, health risk, physicochemical Parameters, water Contamination
Citation: Khafaga DS, Iqbal A, Mahmood S, Shahzad A, Eid MM, Alhussan AA and El-Kenawy E-SM (2025) Evaluating groundwater quality through contaminant analysis and water quality index: a case study of Sargodha, Punjab, Pakistan. Front. Environ. Sci. 13:1636843. doi: 10.3389/fenvs.2025.1636843
Received: 28 May 2025; Accepted: 22 September 2025;
Published: 03 October 2025.
Edited by:
Ilunga Kamika, University of South Africa, South AfricaReviewed by:
Halil Ibrahim Burgan, Akdeniz University, TürkiyeKapil Ghosh, Diamond Harbour Women’s University, India
Ana Moldovan, INCDO-INOE 2000 subsidiary Research Institute for Analytical Instrumentation ICIA, Romania
Copyright © 2025 Khafaga, Iqbal, Mahmood, Shahzad, Eid, Alhussan and El-Kenawy. This is an open-access article distributed under the terms of the Creative Commons Attribution License (CC BY). The use, distribution or reproduction in other forums is permitted, provided the original author(s) and the copyright owner(s) are credited and that the original publication in this journal is cited, in accordance with accepted academic practice. No use, distribution or reproduction is permitted which does not comply with these terms.
*Correspondence: Shahid Mahmood, bWFobW9vZC5zaGFoaWRAdW9zLmVkdS5waw==