 Rui Zhi
 Lin Lin1,2*
 Jingxiao Zhang
- 1School of Geographical Sciences, Harbin Normal University, Harbin, China
- 2Heilongjiang Province Key Laboratory of Geographical Environment Monitoring and Spatial Information Service in Cold Regions, Harbin Normal University, Harbin, China
- 3School of Economic and Management, Chang’an University, Xi’an, China
- 4Henan Jiaotong Institute Engineering Technology Group Co, Henan College of Transportation, Zhengzhou, China
Driven by a series of policies, the rapid urban expansion and industrial transformation of the Harbin and Changchun Urban Agglomeration (HCUA), has altered the original land use structure, adversely impacting the ecological environment. This has consequently affected regional carbon storage.In the present study, a theoretical evaluation model of dynamic change of carbon stock based on land use type was established, which linked PLUS, InVEST, geographic detector and geographical weighted regression model to analyze the evolution of land use and carbon stock in the process of industrial transformation. The findings revealed that cultivated and forest were the predominant land types within HCUA. Over these 2 decades, HCUA experienced a decline in carbon stocks by 1.74%, resulting in an overall reduction of 87.02 Mt to reach 4902.63 Mt by 2020. Natural factors primarily shape the spatial distribution of carbon stocks. The amount of carbon stored in each scenario is reduced by 2040. The SD scenario is characterized by its exceptional capacity for carbon storage (4882.06 Mt).
1 Introduction
In recent years, human activities have intensified global climate change by increasing carbon emissions. This presents an immediate danger to the survival of humans and the long-term viability of ecosystem services. Addressing global climate change now hinges on reducing anthropogenic carbon emissions as a priority (Sawyer, 1972). Research indicates that mitigating climate change can be achieved through terrestrial ecosystems’ ability to sequester carbon (Li J. et al., 2021; Sarkodie et al., 2020). China, the largest developing nation globally, has witnessed a rapid surge in urbanization over the past few decades. Consequently, this swift urban expansion has led to alterations in land use and land cover (LULC), thereby diminishing their capacity for carbon storage (Feng et al., 2020). As a result, terrestrial ecosystems have become less efficient at sequestering carbon. Therefore, it is crucial to carry out investigations on the carbon dynamics associated with alterations in LUCC and understand the factors that influence it. This will contribute to the sustainable development of ecosystems.
Therefore, A substantial corpus of research has been amassed by scholars to explore the storage of carbon in regional ecosystems. Field surveying is widely regarded as a reliable source of data since they provide initial data on carbon density and serve as a basis for validating subsequent data products. For instance, some scholars estimated the carbon storage of green spaces in Shanghai’s central urban area through field investigations that measured sample land carbon density (Chen et al., 2024a). However, conducting large-scale ecosystem carbon storage estimations through field investigations requires significant human and material resources. Consequently, remote sensing inversion and model simulation have emerged as more suitable alternatives. To illustrate this point further, Yang et al. (2024) employed machine learning techniques combined with Landsat remote sensing inversion to analyze changes in Zhengzhou’s carbon storage. Carbon sequestration capacity of various land use types directly affects the structure of ecosystems as well as carbon storage in terrestrial ecosystems (Xu et al., 2023). We can estimate the future carbon storage by merging information on forthcoming land utilization and its associated carbon density. Many researchers have extensively studied this topic and often create multiple development scenarios to predict land use. Hence, the use of a land utilization model has become an essential technical tool for evaluating changes in land usage over time and conducting scenario analysis. Many researchers have coupled the InVEST model with it for the purpose of assessing carbon stocks in ecosystems under varying situations. For instance, a study by Liu et al. (2024) investigated fluctuations in carbon stocks within the province of Gansu during the time span from 2000 to 2050 and found that an ecological red line scenario was able to alter the trend of carbon storage. Zhu et al. (2022), on their part, analyzed past, present, and future LULC changes along China’s coastal areas as well as their impact on carbon storage. The simulation of carbon storage under future scenarios has emerged as a prominent trend within current research on carbon sequestration.
Urban agglomeration plays a crucial role in driving urbanization and serves as a strategic focal point for national and regional economic development. The presence of dense populations, rapid urban expansion, and efforts towards urban greening within these agglomerations significantly impact the carbon balance (Liu et al., 2019). In the research on Beijing, Tianjin, and Hebei areas, Wu et al. (2023) simulated future land growth under various ecological priority scenarios. They also made predictions regarding the potential capacity for storing carbon in this region. An evaluation was carried out by Zhang et al. (2023a) to analyze the impact of wetland transformations on carbon sequestration, employing the SDG15.1 indicator. In the context of the “two-carbon” policy, the old industrial infrastructure, has naturally become the focus of carbon emission reduction work. The Harbin-Changchun Urban Agglomeration (HCUA), ranked as one of China’s top second-tier urban agglomerations (Li et al., 2018). It plays a crucial role as a gateway for China’s engagement with Northeast Asia. The implementation of the revitalizing strategy of the old industrial base in Northeast China has facilitated the transformation of the industrial structure in Northeast China.These changes have weakened ecosystem resilience and gradually degraded ecological functions such as carbon storage capacity. Some scholars have conducted initial investigations into carbon dynamics within the HCUA region. Some scholars examined changes in carbon sequestration capacity of HCUA forests between 2000 and 2020 amidst rapid urbanization while exploring driving factors behind these changes (Hong et al., 2024). Liu et al. (2022) studied dynamic shifts in forest carbon storage across three Eastern provinces from 1994 to 2018. However, although the existing studies have evaluated the carbon dynamics in the HCUA region, these studies mainly focus on the carbon sequestration capacity of urban forests or the carbon storage of forests in the three northeastern provinces, lacking systematic research on the HCUA region. And only the forest carbon storage in historical periods is evaluated, lacking predictions for future carbon storage.
Given the lacunae in extant literature, a quantitative evaluation of the factors affecting spatiotemporal evolution in HCUA is imperative. This will aid in reducing the impact on ecosystem carbon storage while achieving industrial transformation and upgrading of urbanization level. Therefore, abased on LUCC, this study investigates the spatiotemporal variations in carbon stocks and their influencing factors, over the past 2 decades. We then predict the land use pattern and carbon stocks.
2 Materials and methods
2.1 Study area
The Harbin-Changchun Urban Agglomeration (HCUA) is situated in the northeastern part of China, precisely within the geographical boundaries defined by latitude 41°37′∼49°04′N and longitude 122°24′∼ 131°23′E (Figure 1). It serves as a significant regional cluster of cities in this part of the country, with Harbin and Changchun acting as its central hubs. The influence of HCUA extends to Heilongjiang and Jilin provinces, encompassing a total land area of 325,385 km2. Geographically, HCUA spans across the Songnen Plain and Changbai Mountain regions. Notably famous for its black soil zone worldwide, the Songnen Plain primarily comprises cultivated land along with grassland and woodland resources. Woodlands are predominantly found in the eastern hills and mountains which serve as crucial carbon storage sites within this region’s ecosystems.
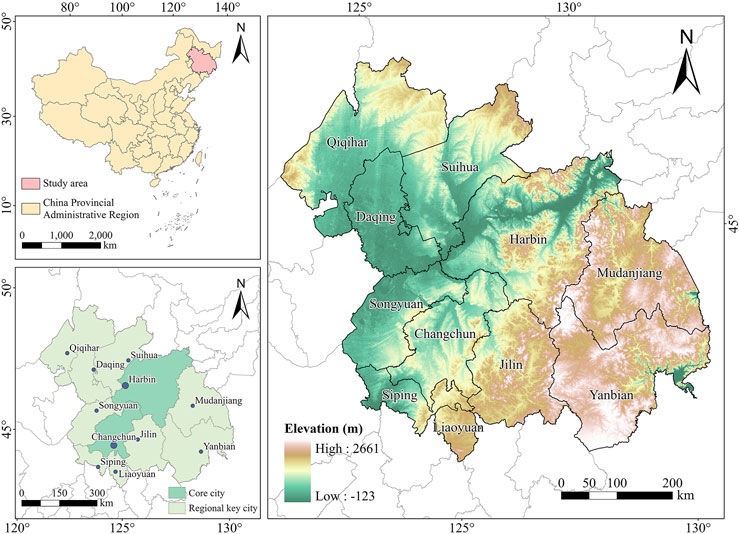
Figure 1. Location map of the research area.
2.2 Data sources
The study incorporates various datasets (Table 1), including land use data, driving factors (such as terrain, weather conditions, vegetation, soil quality, socio-economic aspects, and accessibility). The Zenodo website provides access to the LULC data. It is classified into: arable land, forested areas, grasslands, water bodies, urban areas, and unused lands. To extract slope details from topographic data sources, we acquired DEM data from the Geospatial Data Cloud. The National Tibetan Plateau Scientific Data Center was the source of meteorological data, including temperature and precipitation variables. NDVI data was derived from MOD13A3 dataset available on the EarthData website under MODIS collection. Soil-related data encompasses soil classification and erosion condition. Socio-economic factors include GDP, Night Light Index (NLI), and population density. We acquired data regarding soil categorization, along with statistics on GDP and population density, from the Resources and Environmental Science and Data Center affiliated with the Chinese Academy of Sciences. The Night Light Index was derived by processing improved Chinese DMSP-OLS data conducted by Wu et al. (2022). Accessibility metrics like road networks and railways were obtained through OpenStreetMap platform while ArcGIS 10.8 was employed for Euclidean distance analysis to generate a distance grid layer. All aforementioned datasets were transformed to Albers_Conic_Equal_Area projection.
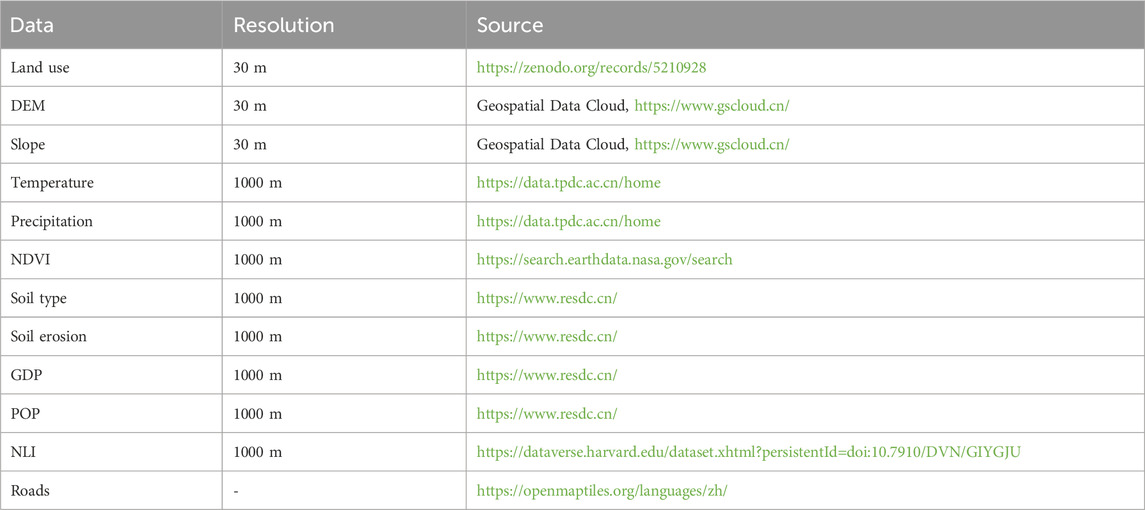
Table 1. Datasets obtained for the research.
2.3 Methods
2.3.1 Research framework
This study establishes a theoretical evaluation model of dynamic change of carbon stocks based on LULC (Figure 2). Figure 3 presents the methodological approach.
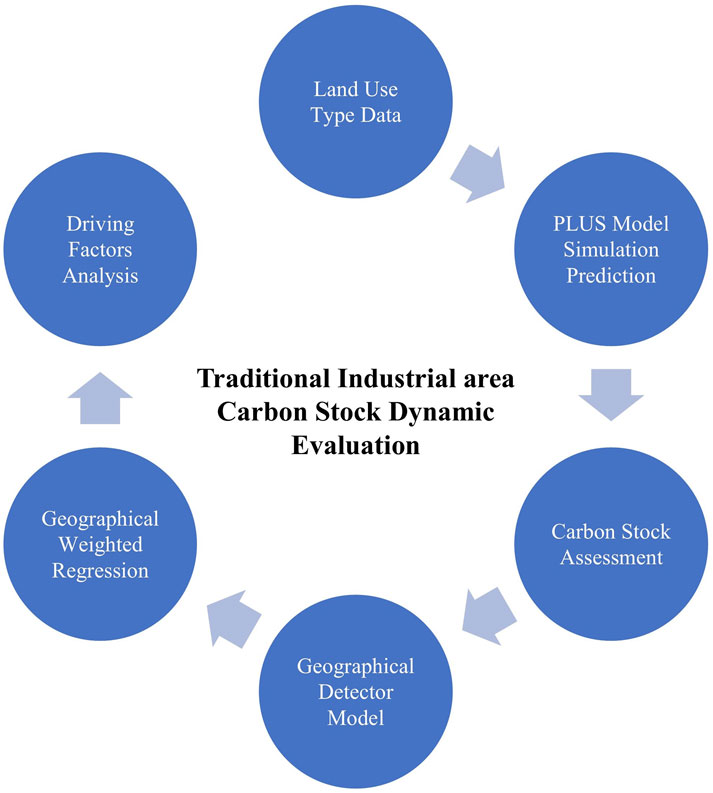
Figure 2. Theoretical evaluation model.
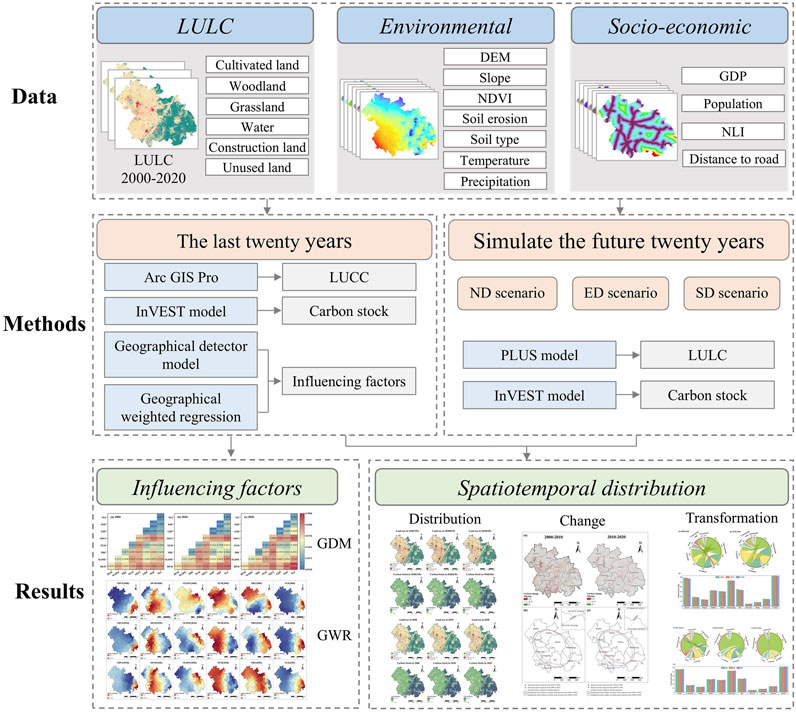
Figure 3. Flowchart of the integrated assessment method in this study.
2.3.2 PLUS model
The PLUS model is capable of predicting alterations in land utilization via raster data (Liang et al., 2021). Compared with the FLUS or CLUE-S models, the PLUS model can achieve higher simulation accuracy and more similar landscapes. This research is conducted using the PLUS model. Initially, we extract data on HCUA land expansion from 2010 to 2020 utilizing the LEAS module. Subsequently, we determine the likelihood of each land type occurrence and assess the contribution rate of various drivers behind land expansion. Additionally, we select twelve influencing factors including DEM, slope, temperature, precipitation, soil type, soil erosion, GDP, population density, distance to highways as well as primary-, secondary-, and tertiary-level roads based on existing studies and regional characteristics. The spatial resolution of all driving factors is consistent with the land use data. By calculating probabilities for six different types of land use using these factors as a basis. Furthermore, by integrating the CA model with relevant parameters such as land demand estimation and considering domain weight age along with transfer matrix for different land types under multiple future scenarios; we aim to forecast future land use for the year 2040 while taking into account 2020 as our initial reference point. Utilizing scenario modeling allows for comparison between various development policies’ potential impacts on future environmental changes (Tang et al., 2024). This study has established three scenarios with the aim of simulating land use patterns in our research area until 2040:
(1) Natural development scenario (ND): We do not take into account any planning policy’s binding effect on land use change. We make the assumption of a consistent socio-economic environment and maintain that the rate at which land use types are converted has remained steady throughout.
(2) Economic development scenario (ED): The HCUA is currently undergoing rapid urbanization and experiencing significant growth in construction land. As a result, there is a 20% higher likelihood of cultivated land, forest land, and grassland being converted into construction land. Conversely, there is a 20% lower probability of construction land being transformed into other landscape types except for cultivated land (Li et al., 2022).
(3) Sustainable development scenario (SD): High-quality spatial development of urban areas is our target through the promotion of coordinated urban growth and ecological protection. We accomplish this through the policies that contain a 20% reduction in the probability of cultivated land and grassland converting to construction land, a 30% decline in the probability of the transformation of forest land into construction land, and a 15% increase in the probability of construction land transformed into forestland. Further, we add restrictions to arbitrary changes between regional water areas and limit their free transformation (Chen L. et al., 2022).
2.3.3 Model accuracy verification
The value of the Kappa coefficient was used as the criterion of precision, and values greater than 0.8 implied strong consistency.(Pontius Jr, and Millones, 2011). The reliability of the PLUS model was tested by HCUA land use data in 2000 and 2010 while mimicking the distribution of land use in 2020. By comparing the real data with the simulation results, it is found that the Kappa coefficient of the model has reached 0.87 and the overall accuracy has reached 0.92. This indicates that the simulation results are robust enough to enable the model to predict different land use change scenarios.
2.3.4 InVEST model
The InVEST model “Carbon Storage and Sequestration” module subdivides carbon storage in terrestrial ecosystems into four basic carbon pools (Equation 1): the calculation formula shown below (Equation 2):
Where i is the land use type and
Where:
Where:
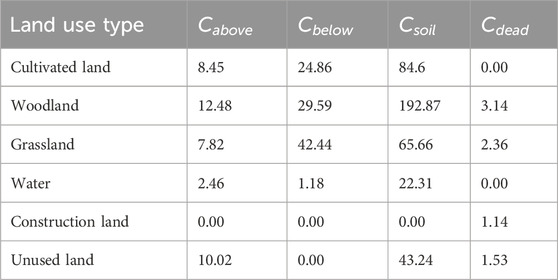
Table 2. Carbon density of each land use type in the study area (Mg/hm2).
2.3.5 Geographical detector model
In this research, we employed factor identification and interactive identification of geographic detectors (Wang and Xu, 2017) to investigate the main factors that contribute to the spatial variation of carbon stocks in HCUA. Drawing on relevant research findings (Jia and Hu, 2024), a total of eight natural and socio-economic factors were chosen for analysis. Natural factors include precipitation (PRE), temperature (TEM), DEM, slope, and normalized difference NDVI, GDP, population (POP), and Night Light Index (NLI) are human factors that reflect human activities and ecosystem disturbances. The q value is used to measure the determinants of the explanatory power of the influence factor on the response variable. Geodetector can also detect interactions between these two factors (Shi et al., 2018).
2.3.6 Geographically weighted regression
We employed the GWR model to explore the spatial heterogeneity and differences in the direction and intensity of the main driving factors in different geographical spatial units (Li et al., 2024).The GWR model can be expressed as (Equation 10):
where
3 Results
3.1 Dynamic changes in land use and carbon stock from 2000 to 2020
3.1.1 LUCC dynamics
The dominant land categories within the HCUA between 2000 and 2020 were agricultural land and woodland, collectively accounting for more than 90% of the overall area (Figure 4). Cultivated land was predominantly found in the plain areas. On the other hand, forest land was mainly distributed across higher-elevation regions. Notably, the concentration of construction land primarily occurred in economic development hubs surrounding provincial capitals as well as smaller cities. In the last 20 years, there has been a notable transformation in land utilization characterized by a substantial growth of construction zones, resulting in an overall increase of 5762.50 km2. Conversely, cultivated land, grassland, and forested areas experienced decreases of 3603.75 km2, 1408.75 km2, and 1103.00 km2 respectively (Figures 5a,b).
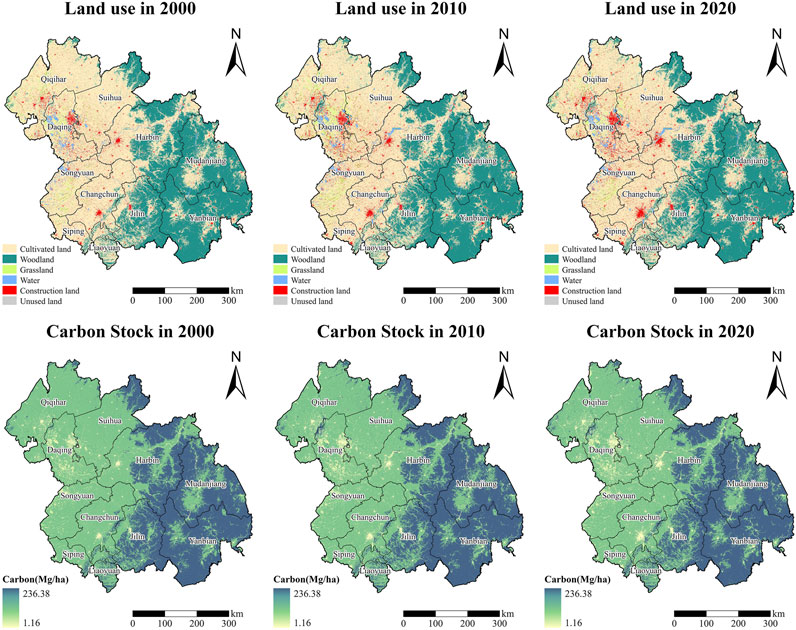
Figure 4. Spatial distribution of land use and carbon stocks in the HCUA from 2000 to 2020.
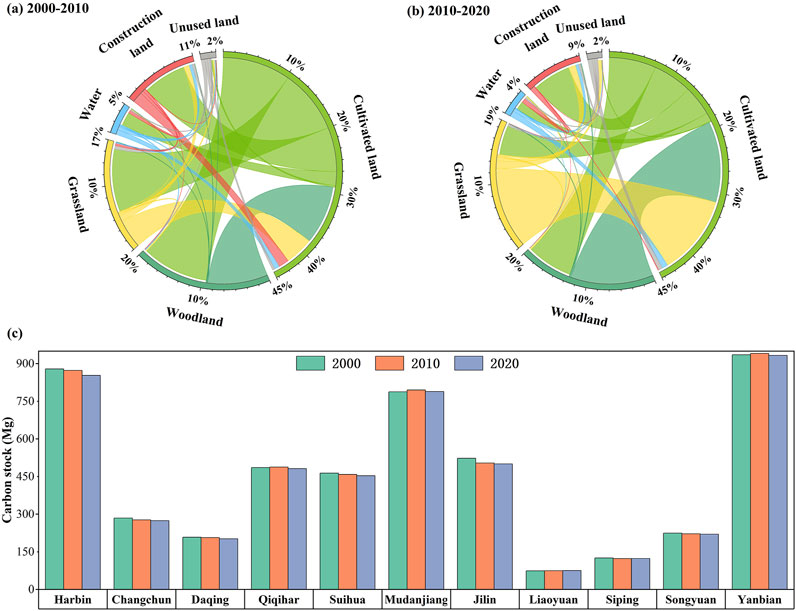
Figure 5. Chordal map of land-use transfer in the HCUA from 2000 to 2020 (a,b) and Statistical map of carbon stocks in each region from 2000 to 2020 (c).
3.1.2 Spatiotemporal variation of carbon stock
The carbon storage of the HCUA experienced a gradual decrease, going down from 4989.65 Mt in 2000–4902.63 Mt in 2020 (Figure 5c). The carbon storage distribution displayed a distinct trend, with comparatively lower levels observed in west of the study area and relatively higher levels detected in east of the study area (Figure 4). Notably, areas with abundant vegetation and predominantly wooded land use types concentrated significant amounts of high-value carbon storage. The distribution of regions exhibiting diminished carbon storage capacity is predominantly concentrated within the central area of each urban settlement. This phenomenon aligns with the observed pattern of construction land distribution (Figure 6a). From 2000 to 2010, the southwest of Harbin and the northeast of Changchun were the centers of carbon storage increases and decreases, respectively. The center of gravity of carbon storage increases moved 30.80 km to the southwest, in the northeast of Changchun, from 2010 to 2020, and the center of gravity of carbon storage reductions moved 35.69 km to the northeast, the southwest of Harbin (Figures 6b,c).
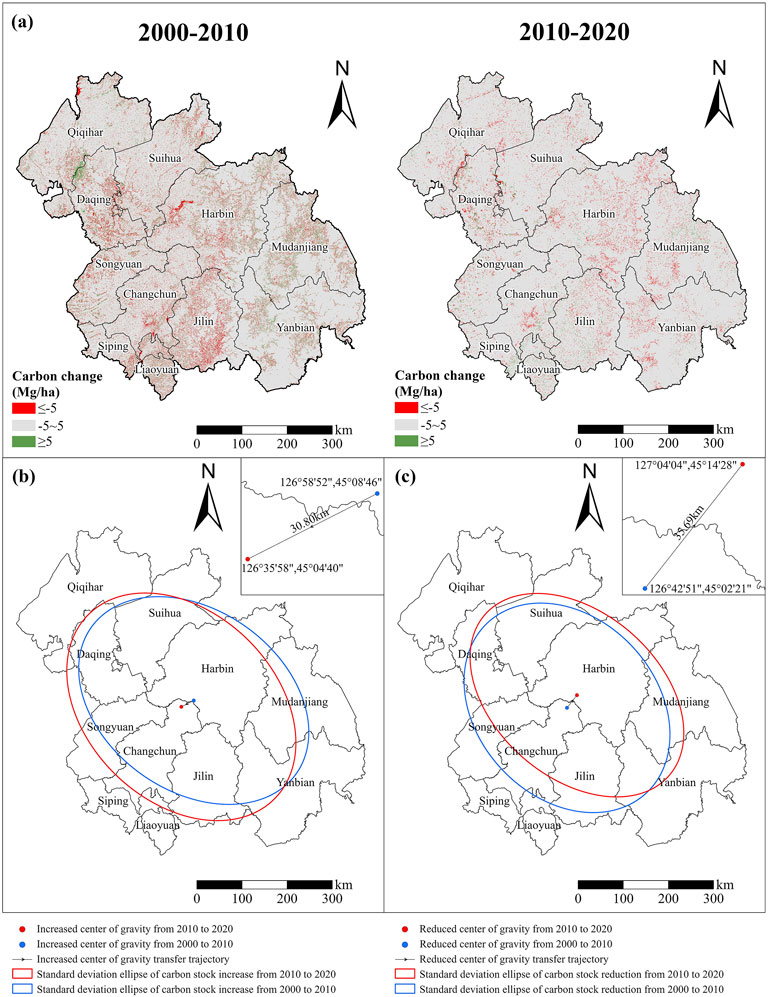
Figure 6. Spatial change map of carbon stocks in the HCUA from 2000 to 2020 (a); Track map of the center of gravity of the increase of carbon storage in the HCUA from 2000 to 2020 (b) and Track map of the center of gravity of the reduction of carbon storage in the HCUA from 2000 to 2020 (c).
3.2 Analysis of the influencing factors of the spatial differentiation of carbon stock
3.2.1 Analysis of driving factors
The results of single factor detection revealed that natural factors demonstrated significantly greater explanatory power than human-related factors. Specifically, from 2000 to 2020, NDVI (0.5006), DEM (0.4329), and SLOPE (0.3541) emerged as dominant explanations for spatial variations in carbon stocks (Table 3). Furthermore, NLI and POP displayed enhanced explanatory power between 2000 and 2020 with respective increases of 0.0708 and 0.0250. The interactive detection results of the geographical detector show (Figures 7a-c) that POP∩NDVI (0.6114), POP∩DEM (0.6372) and NLI∩DEM (0.7752) had the highest q values in the interaction in 2000, 2010 and 2020, respectively. These interactions had the strongest explanatory power to the spatial differentiation of carbon storage in HCUA. From the perspective of different years, with the advancement of the urbanization process of urban agglomerations, the interaction detection q value of socio-economic factors and natural factors was increasing. The q values of POP∩DEM, NLI∩DEM, NLI∩SLOPE, and NLI∩NDVI increased from 2000 to 2020 by 0.0525, 0.2010, 0.0521, and 0.1277, respectively.
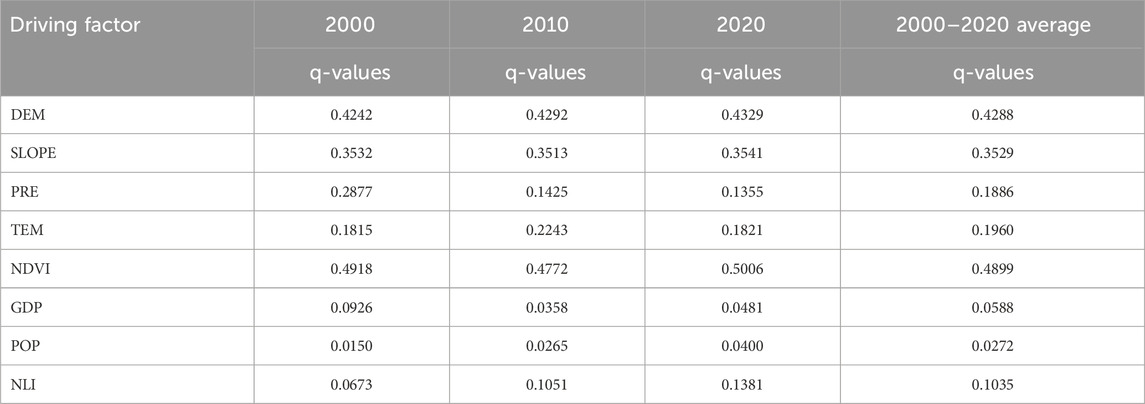
Table 3. Factor detection results in different years.
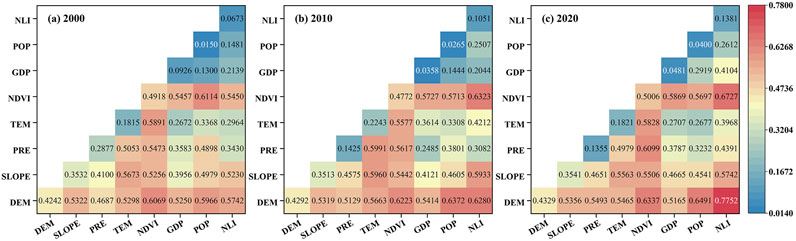
Figure 7. Interaction results of influencing factors on spatial differentiation of carbon stocks in the HCUA from 2000 to 2020 (a-c).
3.2.2 Spatial differences in response to carbon stocks to drivers
The detection results of the geographic detector were considered in this analysis, the six driving factors (NDVI, DEM, SLOPE, TEM, PRE, PRE, and NLI) with the greatest explanatory power for the spatial heterogeneity of carbon storage were selected for collinearity tests (VIF <7). The VIF value of each influence factor is less than 6, indicating that there is no collinearity between the selected factors. The GWR model is characterized by its minimal AICc value, which is notable given its concurrent superiority in terms of R2 and adjusted R2 values (Table 4). This indicates that the GWR model has the highest goodness-of-fit. The geographically weighted regression results (Figure 8) show that during the study period, the influence of each driving factor on the spatial differentiation of carbon stocks exhibits obvious spatial heterogeneity, and the effect intensity also varies with the region. The positive effect of NDVI on the spatial differentiation of carbon storage is stronger than the negative effect. In addition, the positive effects are concentrated in the forest land. The positive effect of DEM is stronger than the negative effect. SLOPE has a positive effect in 2000, while the majority of effects are negative in 2010 and 2020. The positive effects of TEM are predominantly concentrated in the region of western. The direction and intensity of the effects of PRE fluctuate greatly for both the positive and negative effects. The negative effect intensity of NLI is more widely distributed, occupying the core cities and most of both the central and western areas.
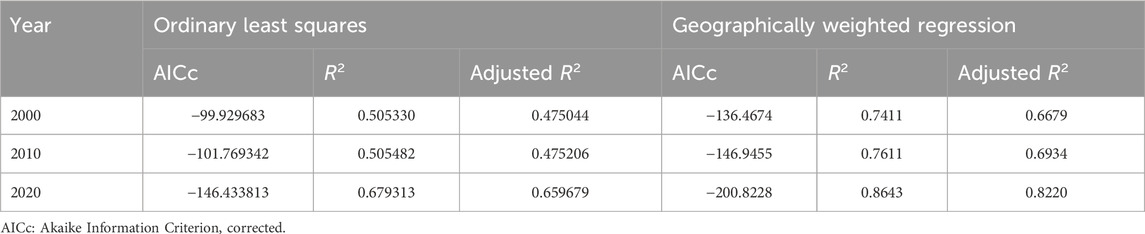
Table 4. Comparison between OLS model and GWR model.
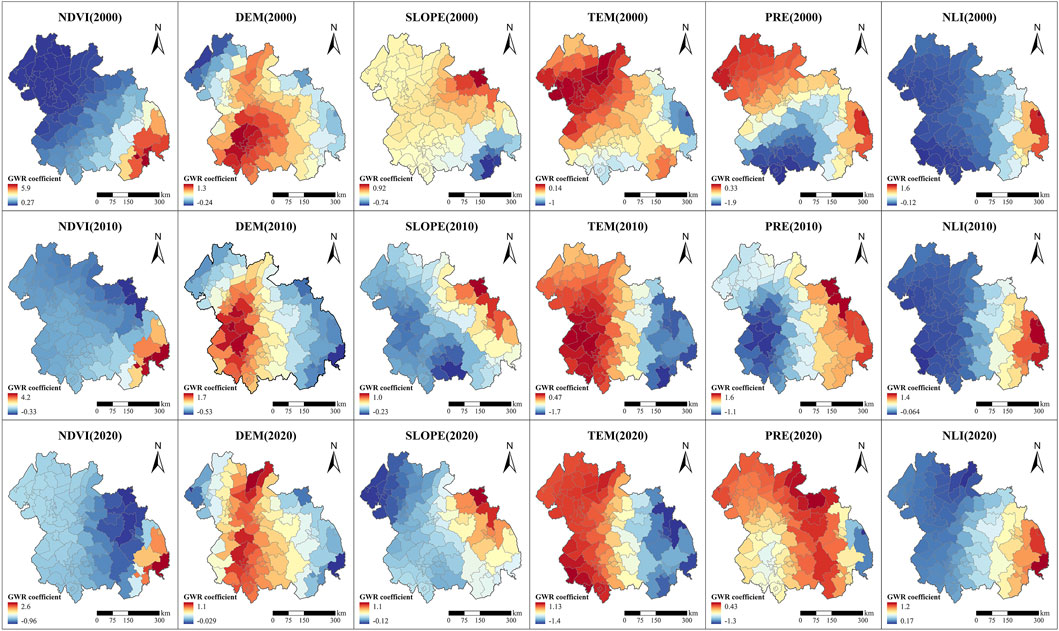
Figure 8. Estimated GWR coefficient maps for major impact factors.
3.3 Scenario simulation of future land use and carbon stocks
3.3.1 Simulation of land use change scenarios
The results of the forecast indicate a consistent rise in urban development, while concurrently, the extent of cultivated land and grassland will undergo a decline, albeit to varying extents, under the specified scenarios in 2040. The spatial arrangement of land use remains unchanged from 2020 (Figure 9). Construction land has witnessed different levels of expansion, with the ED scenario showing the most significant growth by an additional 7507.75 km2 compared to 2020, representing approximately 7.42% of the HCUA (Figures 10a–c). This is consistent with the research results of Li et al. (2025). By way of contrast, in the SD scenario, there is minimal growth in construction land (2365.50 km2) among the three scenarios, accompanied by lesser reduction in cultivated land and grassland compared to others.
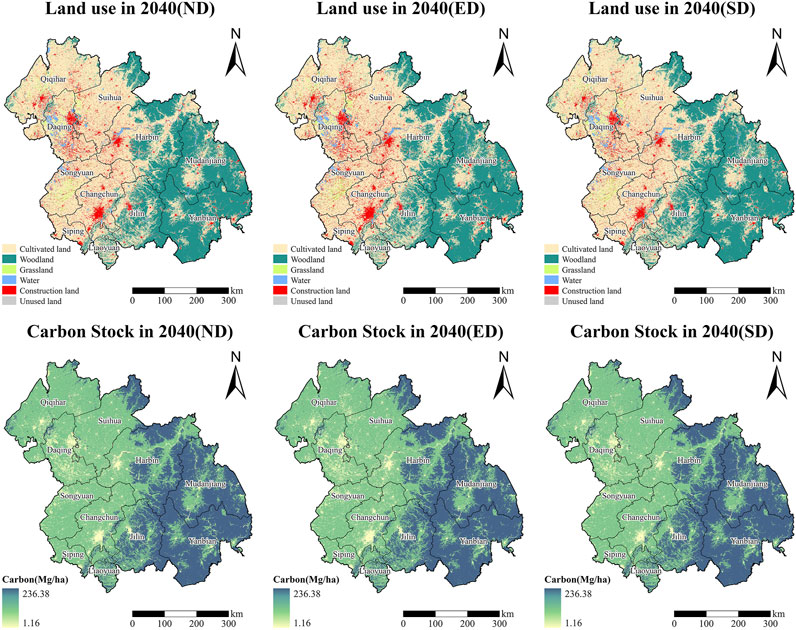
Figure 9. Spatial distribution map of land use and carbon stocks of the HCUA under different scenarios in 2040.
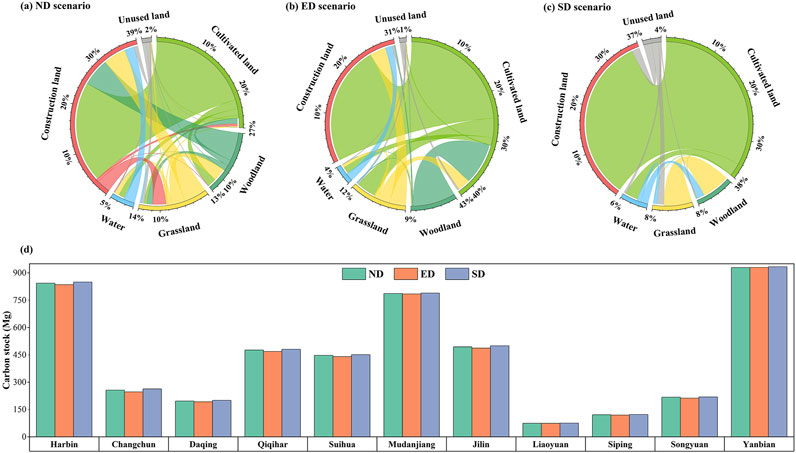
Figure 10. Chordal map of the land use transfer of the HCUA for different scenarios from 2020 to 2040 (a–c) and Statistical map of carbon stocks in each region under different scenarios in 2040 (d).
3.3.2 Carbon stock assessment under different scenario simulations
Under various scenarios in 2040, the carbon storage capacity of HCUA is anticipated to undergo a persistent decline (Figure 10d). Among them, the maximum loss of carbon storage was under the ED scenario, with a loss compared to about 112.85 Mt in 2020. The SD scenario demonstrates a mitigation of 20.57 Mt of carbon storage. Despite the fact that the general spatial distribution of carbon storage remains similar to that of 2020, there has been an increase in low-value areas, primarily concentrated around provincial capitals and their surrounding urban centers due to rapid economic development. Across all land classes in every scenario, both crop and grassland carbon stocks have experienced declines. However, it is noteworthy that forest areas have witnessed an increase in carbon storage by 11.73 Mt solely under the SD scenario while facing reductions in the other two scenarios.
4 Discussion
4.1 Analysis of carbon stock losses in urban agglomerations
The carbon storage inside HCUA has continuously decreased over the past 2 decades, from 97.54 Mt to 87.02 Mt. In particular, during the period 2010–2020, the carbon reduction was greater, by 57.72 Mt, compared to the years 2000–2010, thus revealing that after the formation of the urban agglomerations of Harbin and Changchun, human activities have exacerbated this decline in carbon storage. The southeastern hills and mountains contain high-quality areas with significant carbon storage, which is also more or less consistent with the distribution patterns of forest resources in Yu et al. (2021). Conversely, median-value regions are mainly found in the western plains dominated by farmland. Low-value areas coincide with densely populated urban centers where human activities are frequent, resulting in significant losses of carbon stocks as noted by other researchers (Fan et al., 2023; Li and Geng, 2023). Land use patterns play a crucial role in shaping HCUA’s spatial distribution of carbon stocks (Xie et al., 2022). The implementation of relevant policies alongside accelerated urbanization has substantially altered land use patterns within this urban agglomeration, resulting in a decline in carbon storage.Policies significantly influence land cover change (Tropek et al., 2014).
The primary land use type within the HCUA consists of cultivated areas that serve as crucial carbon reservoirs for this region abundant in black soil resources known for its major grain production sector located in northeastern China. There has been a notable rise in crop output recently according to our investigation spanning 2 decades revealing how cropland expansion activities have led to replacing approximately 6458.25 km2 along with an additional 3667.75 km2 previously occupied by woodlands and grasslands within this region consequently causing a depletion equivalent to losing around 2.40 Mt worth of stored carbon from the overall carbon storage capacity held by HCUA; these outcomes align well with previous studies conducted by Mao et al. (2019). The cultivated area in the study region increased during the period 2010–2020, because several agro-development policies had been executed in China to increase food production. For instance, the elimination of the agricultural tax in 2005 resulted in an influx of illegally reclaimed farmland. Additionally, a food security program was launched in 2008, with both Heilongjiang and Jilin provinces proposing measures to expand agricultural land and enhance modernization of agricultural production (Yu et al., 2021). This expansion aligns with the Ministry of Land and Resources’ initiative in 2010 to safeguard the economy by protecting the red line for cultivated land, as well as The State Council’s issuance of Regulations on Land Reclamation in 2011 (Chen H. et al., 2022). Consequently, policy support for agricultural development has significantly facilitated the growth in cultivated land area, resulting in substantial occupation of ecological land and subsequent carbon loss.
Construction land has a limited carbon sequestration capacity in comparison to agricultural land. Cities with extensive urban expansion and their surrounding areas were the regions with significant carbon storage loss in the HCUA, such as Harbin, Changchun, Jilin, Suihua, and other urban centers. Alongside agricultural policies, China has implemented various economic measures to stimulate regional development and urbanization (Kuang et al., 2016). In 2003, the Northeast China old industrial base revitalization strategy was put into action, leading to substantial economic growth in the region and facilitating industrial transformation and urban expansion. The Northeast Region Revitalization Plan became effective in 2007. The HCUA is identified as a crucial urban agglomeration for development and growth in the 13th Five-Year Plan (Li et al., 2018). The official announcement of the “Harbin and Changchun Urban Agglomeration Development Plan” in 2016 further accelerated the pace of urbanization within the HCUA during this period. Frequent human activities have transformed large parts of green areas into production areas. The specific process of land use conversion primarily involves converting land types with high carbon density to low carbon density, resulting in a reduction of carbon stocks in HCUA, in line with the research findings (Shi et al., 2024).
In addition, alongside the economic development, the government demonstrated its awareness of the severe ecological issues and devised numerous ecological policies to safeguard and rehabilitate the ecosystem. Between 2000 and 2010, there was an expansion of forest land by 686.25 km2 and grassland by 2536.75 km2 in the HCUA region. Consequently, carbon storage increased by 16.72 Mg for forests and 29.85 Mg for grasslands during this period. The implementation of a project aimed at converting farmland into forest areas while addressing land salinization (Ouyang et al., 2016) resulted in some cultivated land being transformed into forests and grasslands.
We used the PLUS model and the InVEST model to predict the land use and carbon storage under three scenarios of HCUA in 2040. In the absence of ecological policy intervention, the ND scenario continues the previous development model, while the ED scenario focuses on rapid economic development while neglecting ecological protection, resulting in a large amount of forest land and grassland being converted into construction land and cultivated land. Both of these scenarios have caused a significant loss of carbon storage compared with 2020. Compared with the above two scenarios, the SD scenario not only restricts the conversion of forest and grassland to construction land, but also increases the probability of the transfer of other land use types to forest and grassland, thereby increasing some carbon sinks. Therefore, the extent of carbon storage loss significantly weakens under the SD scenario, which is consistent with the conclusion drawn by Zhang et al. (2022) and Fan et al. (2023). Historical policies have further demonstrated that the implementation of ecological protection policies can better protect land. For instance, the entire first provincial wetland protection regulation promulgated by Heilongjiang Province, as well as the land salinity/sodium content improvement project developed by Jilin Province, have largely restored grasslands and cultivated land (Mao et al., 2019).
4.2 Driving factor analysis of the spatial differentiation of carbon stock
In order to comprehend the underlying mechanism driving spatial variations in carbon stocks within HCUA ecosystems, we utilized Geodetector as an analytical tool. Our findings indicate that NDVI, DEM, and Slope exhibit strong explanatory power when it comes to explaining spatial variations in carbon stocks within these ecosystems. These findings are also in agreement with previous surveys (Zhang et al., 2024). High-altitude areas that demonstrate higher carbon reserves compared to other regions. This observation aligns with a study conducted by Hong et al. (2022). Notably, these areas include Changbai Mountain National Nature Reserve, Songhua River Three Lakes National Nature Reserve, Moranfeng among other nature reserves. The topography of these regions is characterized by relatively high elevations while maintaining low population density and limited human activities intensity. Moreover, they boast significantly higher vegetation coverage rates compared to other regions along with rich biodiversity. Forests play a crucial role as important terrestrial carbon pools due to their higher carbon density; this has been highlighted by Peng et al. (2023). Consequently, forests within these regions exhibit higher levels of carbon reserves.
Moreover, with the growth of urban agglomerations, the q values for socio-economic factors such as POP and NLI have increased between 2000 and 2020. This indicates a stronger ability to explain spatial differences in carbon stocks, which aligns with Li K. et al. (2021) research findings. The q value for GDP initially decreased from 2000 to 2010 but then rose again from 2010 to 2020. This suggests that industrialization, urbanization, and human activities have intensified since the formation of Harbin and Changchun’s urban agglomeration. Consequently, socio-economic factors are exerting a greater influence on variations in carbon stocks across space. Additionally, all interactive detection results exhibit bilinear or nonlinear enhancement consistent with previous studies (Jia and Hu, 2024). Our study reveals that combining different driving forces can increase the strength of the explanation for the geographical differentiation of carbon storage.
As urbanization and regional economic growth continue expanding within urban agglomerations, natural-social factor interactions will make it easier for each factor to account for differences in carbon storage across space - e.g., POP∩DEM; NLI∩DEM; NLI∩SLOPE; NLI∩NDVI. These findings indicate that human activities increasingly interfere with ecological environments during the development of urban agglomerations thereby affecting spatial differentiation of carbon stocks.
4.3 Suggestions for future development
Although ecological policies have been implemented to promote the growth of forests and grasslands, thereby slowing down the rate of carbon loss, it is necessary to bear in mind that restoring ecosystem functions takes considerable time and cannot fully reach their natural levels (Chazdon, 2008). In addition, land use change also has an impact on other ecosystem functions, including changes in ecosystem services such as habitat quality (Li et al., 2025), soil retention, water production, and their trade-off synergy relationships, all of which are closely related to land cover types (Yu et al., 2021). Hence, to effectively tackle the sustainability of socio-economic factors and ecological safety in urban agglomerations, it is crucial to consider proactive measures.
First, mitigating the negative impacts of development on carbon stocks requires sustainable management. Urban agglomerations should adhere to relevant policies regarding land use planning, adopt a scientific and rational approach towards developing construction land, and prioritize enhancing the quality of urbanization. Furthermore, it is of utmost importance to give priority to the conservation of nature reserves, forests, cultivated land reserves, and black soil reserves within urban agglomerations with the aim of minimizing the adverse effects caused by human activities.
Secondly, it is essential to increase the impact of ecological planning in urban agglomerations and strengthen the establishment of ecological spaces within these areas. The forest ecosystem serves as a vital carbon pool for this region with high-quality forests playing a significant role in improving the country’s forest carbon sink function (Liu et al., 2022). Thus, it is imperative to reinforce forestland protection in the eastern part of our study area while simultaneously improving its quality and ensuring appropriate species distribution within forests (Cao et al., 2011). The HCUA encompasses a variety of aquatic ecosystems, including rivers, lakes, and wetlands.
From 2000 to 2020, the analysis reveals an upward trajectory in water carbon storage within the HCUA. This indicates that protecting wetland ecosystems can contribute significantly to the regional carbon sink.
Lastly, ensuring food security remains a primary responsibility that must be fulfilled diligently while concurrently intensifying efforts towards safeguarding cultivated land–which serves as the second-largest carbon reservoir in the HCUA. Additionally, since black soil farming areas are present within the study area, implementing rational agricultural practices becomes crucial for promoting sustainable agriculture growth while minimizing land transfer activities in these regions and restoring overdeveloped areas with forestation or grassland.
4.4 Limitations and prospects
This study combined the PLUS and InVEST models with the analysis of influencing factors to provide a systematic method for the long-term management of carbon stocks in urban agglomerations. Although these models effectively predict future ecological carbon stocks, they have certain limitations. Instead of relying on direct measurements, this research uses carbon density values from former surveys. However, it is essential to realize that these are just estimates for regional ecosystem carbon storage and do not adequately reflect the actual situation even after adjustment using meteorological data. Therefore, future studies should consider incorporating field sampling and measurement data alongside historical monitoring data to obtain more precise evaluations of carbon storage. Furthermore, when designing different future land use development scenarios, due to the lack of accurate control over future development scenarios, there are subjective factors influencing. Moreover, due to the lack of technology, it is impossible to measure the impact of the quantity and specific types of land use drivers on the simulation accuracy. In future research, various factors will be comprehensively considered in combination with field investigation data. Multiple experiments will be conducted to explore the influence of driving factors on simulation accuracy and design future development scenarios that are more in line with the actual trends of the study area.
5 Conclusion
This research utilized the PLUS and InVEST models with the analysis of influencing factors to provide a systematic method for the long-term management of carbon stocks in urban agglomerations. The key points of this research are outlined below:
(1) From 2000 to 2020, construction land has largely increased, resulting in a loss of carbon storage by about 87.02 Mt. The eastern hilly region is found to be storing high levels of carbon. Whereas the carbon storage of low value is found in the urban center area that has relatively high economic development level.
(2) Natural factors primarily drive the geographical variation in carbon storage within HCUA. Factors such as NDVI, DEM, and slope contribute significantly to explaining these spatial differences. Combining natural and socio-economic factors greatly enhances their collective explanatory capacity.
(3) All the scenarios for natural development and economic development showed great expansion in the area for construction land. In the sustainable development case, it was noted that the forested areas are very well conserved and less sprawl to construction land use.
(4) In 2040, the carbon storage of HCUA shows a decreasing trend, with the economic development scenario witnessing the most substantial decline in carbon storage by 112.85 Mt. Nevertheless, the sustainable development scenario helps alleviate this declining trend to some extent, resulting in an estimated carbon storage of 4882.06 Mt within the study area by 2040.
Data availability statement
The original contributions presented in the study are included in the article/supplementary material, further inquiries can be directed to the corresponding authors.
Author contributions
RZ: Methodology, Writing – original draft, Software, Resources, Conceptualization. LL: Project administration, Conceptualization, Writing – review and editing. XY: Conceptualization, Writing – review and editing. JZ: Conceptualization, Writing – review and editing. JS: Supervision, Writing – review and editing. XX: Writing – review and editing, Data curation, Software.
Funding
The author(s) declare that financial support was received for the research and/or publication of this article. This work was supported by the Heilongjiang Province Philosophy and Social Sciences Research and Planning Project (No. 22JYE462), Henan Provincial Department of Transportation science and technology plan project (No. 2022-5-1), Social Science Foundation of Shaanxi Province (No. 2023R001).
Conflict of interest
The authors declare that the research was conducted in the absence of any commercial or financial relationships that could be construed as a potential conflict of interest.
Generative AI statement
The author(s) declare that no Generative AI was used in the creation of this manuscript.
Publisher’s note
All claims expressed in this article are solely those of the authors and do not necessarily represent those of their affiliated organizations, or those of the publisher, the editors and the reviewers. Any product that may be evaluated in this article, or claim that may be made by its manufacturer, is not guaranteed or endorsed by the publisher.
References
Alam, S. A., Starr, M., and Clark, B. J. F. (2013). Tree biomass and soil organic carbon densities across the Sudanese woodland Savannah: a regional carbon sequestration study. J. Arid Environ. 89, 67–76. doi:10.1016/j.jaridenv.2012.10.002
Cao, S., Chen, L., Shankman, D., Wang, C., Wang, X., and Zhang, H. (2011). Excessive reliance on afforestation in China's arid and semi-arid regions: lessons in ecological restoration. Earth-Sci. Rev. 104, 240–245. doi:10.1016/j.earscirev.2010.11.002
Chazdon, R. L. (2008). Beyond deforestation: restoring forests and ecosystem services on degraded lands. Science 320, 1458–1460. doi:10.1126/science.1155365
Chen, H., Meng, F., Yu, Z., and Tan, Y. (2022b). Spatial-temporal characteristics and influencing factors of farmland expansion in different agricultural regions of Heilongjiang province, China. Land Use Policy 115, 106007. doi:10.1016/j.landusepol.2022.106007
Chen, L., Cai, H., Zhang, T., Zhang, X., and Zeng, H. (2022a). Land use multi-scenario simulation analysis of rao river basin based on Markov-FLUS model. Acta. Ecol. Sin. 42 (10), 3947–3958. doi:10.5846/stxb202106271705
Chen, L., Wang, Y., Zhu, E., Wu, H., and Feng, D. (2024a). Carbon storage estimation and strategy optimization under low carbon objectives for urban attached green spaces. Sci. Total Environ. 923, 171507. doi:10.1016/j.scitotenv.2024.171507
Fan, L., Cai, T., Wen, Q., Han, J., Wang, S., Wang, J., et al. (2023). Scenario simulation of land use change and carbon storage response in Henan Province, China: 1990–2050. Ecol. Indic. 154, 110660. doi:10.1016/j.ecolind.2023.110660
Feng, Y., Chen, S., Tong, X., Lei, Z., Gao, C., and Wang, J. (2020). Modeling changes in China's 2000-2030 carbon stock caused by land use change. J. Clean. Prod. 252, 119659. doi:10.1016/j.jclepro.2019.119659
Hong, L., Shen, Y., Ma, H., Zhang, P., Huo, X., and Wen, H. (2022). Temporal and spatial variation of vegetation net primary productivity and its driving factors in Ningxia, China from 2000 to 2019. Chin. J. Appl. Ecol. 33 (10), 2769–2776. doi:10.13287/j.1001-9332.202210.019
Hong, W., Ren, Z., Guo, Y., Wang, C., Cao, F., Zhang, P., et al. (2024). Spatiotemporal changes in urban forest carbon sequestration capacity and its potential drivers in an urban agglomeration: implications for urban CO2 emission mitigation under China’s rapid urbanization. Ecol. Indic. 159, 111601. doi:10.1016/j.ecolind.2024.111601
Jia, T., and Hu, X. (2024). Spatial-temporal change and driving force of carbon storage in three-river-source national park based on PLUS-InVEST-Geodector model. Environ. Sci., 1–18. doi:10.13227/j.hjkx.202310046
Kuang, W., Liu, J., Dong, J., Chi, W., and Zhang, C. (2016). The rapid and massive urban and industrial land expansions in China between 1990 and 2010: a CLUD-Based analysis of their trajectories, patterns, and drivers. Landsc. Urban. Plan. 145, 21–33. doi:10.1016/j.landurbplan.2015.10.001
Li, C., Gao, B., Wu, Y., Zheng, K., and Wu, Y. (2022). Dynamic simulation of landscape ecological risk in Mountain towns based on PLUS model. J. Zhejiang A&F Univ. 39, 84–94. doi:10.11833/j.issn.2095-0756.20210237
Li, G., Sun, S., and Fang, C. (2018). The varying driving forces of urban expansion in China: insights from a spatial-temporal analysis. Landsc. Urban. Plan. 174, 63–77. doi:10.1016/j.landurbplan.2018.03.004
Li, J., Guo, X., Chuai, X., Xie, F., Yang, F., Gao, R., et al. (2021a). Reexamine China's terrestrial ecosystem carbon balance under land use-type and climate change. Land Use Policy 102, 105275. doi:10.1016/j.landusepol.2020.105275
Li, K., Cao, J., Adamowski, J. F., Biswas, A., Zhou, J., Liu, Y., et al. (2021b). Assessing the effects of ecological engineering on spatiotemporal dynamics of carbon storage from 2000 to 2016 in the loess Plateau area using the InVEST model: a case study in huining county, China. Environ. Dev. 39, 100641. doi:10.1016/j.envdev.2021.100641
Li, M., Abuduwaili, J., Liu, W., Feng, S., Saparov, G., and Ma, L. (2024). Application of geographical detector and geographically weighted regression for assessing landscape ecological risk in the irtysh river basin, central Asia. Ecol. Indic. 158, 111540. doi:10.1016/j.ecolind.2023.111540
Li, Y., and Geng, H. (2023). Spatiotemporal trends in ecosystem carbon stock evolution and quantitative attribution in a karst watershed in southwest China. Ecol. Indic. 153, 110429. doi:10.1016/j.ecolind.2023.110429
Li, Y., Zhao, N., Zhang, Y., Monika, S., and Du, G. (2025). Evolution in land-habitat quality in black soil area of northeast China and muti-scenario forecasting: the study of Heilongjiang province. Environ. Sci., 1–21. doi:10.13227/j.hjkx.202409094
Liang, X., Guan, Q., Clarke, K. C., Liu, S., Wang, B., and Yao, Y. (2021). Understanding the drivers of sustainable land expansion using a patch-generating land use simulation (PLUS) model: a case study in wuhan, China. Comput. Environ. Urban Syst. 85, 101569. doi:10.1016/j.compenvurbsys.2020.101569
Liu, J., Pei, X., Yu, W., Nan, J., Fang, H., Wang, K., et al. (2024). How much carbon storage will loss in a desertification area? Multiple policy scenario analysis from Gansu province. Sci. Total Environ. 913, 169668. doi:10.1016/j.scitotenv.2023.169668
Liu, X., Pei, F., Wen, Y., Li, X., Wang, S., Wu, C., et al. (2019). Global urban expansion offsets climate-driven increases in terrestrial net primary productivity. Nat. Commun. 10, 5558. doi:10.1038/s41467-019-13462-1
Liu, Y., Zhao, G., Liu, Y., and Li, X. (2022). Dynamics of forest carbon stocks in three northeastern provinces from 1994 to 2018. Environ. Sci. Manage. 47, 163–167. doi:10.3969/j.issn.1673-1212.2022.12.033
Mao, D., He, X., Wang, Z., Tian, Y., Xiang, H., Yu, H., et al. (2019). Diverse policies leading to contrasting impacts on land cover and ecosystem services in northeast China. J. Clean. Prod. 240, 117961. doi:10.1016/j.jclepro.2019.117961
Ouyang, Z., Zheng, H., Xiao, Y., Polasky, S., Liu, J., Xu, W., et al. (2016). Improvements in ecosystem services from investments in natural capital. Science 352, 1455–1459. doi:10.1126/science.aaf2295
Peng, B., Zhou, Z., Cai, W., Li, M., Xu, L., and He, N. (2023). Maximum potential of vegetation carbon sink in Chinese forests. Sci. Total Environ. 905, 167325. doi:10.1016/j.scitotenv.2023.167325
Pontius, J. , R., and Millones, M. (2011). Death to kappa: birth of quantity disagreement and allocation disagreement for accuracy assessment. Int. J. remote Sens. 32 (15), 4407–4429. doi:10.1080/01431161.2011.552923
Qu, C., Li, W., Xu, J., and Shang, Y. (2023). Potential impact of black land conservation and utilization on carbon storage in Heilongjiang province. J. Northwest For. Univ. 38, 194–203. doi:10.3969/j.issn.1001-7461.2023.05.26
Sarkodie, S. A., Owusu, P. A., and Leirvik, T. (2020). Global effect of urban sprawl, industrialization, trade and economic development on carbon dioxide emissions. Environ. Res. Lett. 15, 034049. doi:10.1088/1748-9326/ab7640
Sawyer, J. S. (1972). Man-made carbon dioxide and the “greenhouse” effect. Nature 239, 23–26. doi:10.1038/239023a0
Shi, J., Shi, P., Wang, Z., and Cheng, F. (2024). Spatial-temporal evolution and prediction of carbon storage in jiuquan city ecosystem based on PLUS⁃InVEST model. Environ. Sci. 45, 300–313. doi:10.13227/j.hjkx.2023.022
Shi, T., Hu, Z., Shi, Z., Guo, L., Chen, Y., Li, Q., et al. (2018). Geo-detection of factors controlling spatial patterns of heavy metals in urban topsoil using multi-source data. Sci. Total Environ. 643, 451–459. doi:10.1016/j.scitotenv.2018.06.224
Tang, Z., Ning, R., Wang, D., Tian, X., Bi, X., Zhou, Z., et al. (2024). Carbon stocks in coastal wetlands of the yellow river Delta and their response to future multi-scenarios. Acta. Ecol. Sin. 44, 3280–3292. doi:10.20103/j.stxb.202308211801
Tropek, R., Sedlacek, O., Beck, J., Keil, P., Musilova, Z., Simova, I., et al. (2014). Comment on high-resolution global maps of 21st-century forest cover change. Science 344, 981. doi:10.1126/science.1248753
Wang, J., and Xu, C. (2017). Geodetector: principle and prospective. Acta. Geogr. Sin. 72, 116–134. doi:10.11821/dlxb201701010
Wang, X., Qi, G., Yu, D., Zhou, L., and Dai, L. (2011). Carbon storage, density, and distribution in forest ecosystems in Jilin Province of northeast China. Chin. J. Appl. Ecol. 22 (08), 2013–2020. doi:10.13287/j.1001-9332.2011.0277
Wu, W., Xu, L., Zheng, H., and Zhang, X. (2023). How much carbon storage will the ecological space leave in a rapid urbanization area? Scenario analysis from beijing-tianjin-hebei urban agglomeration. Resour. Conserv. Recycl. 189, 106774. doi:10.1016/j.resconrec.2022.106774
Wu, Y., Shi, K., Chen, Z., Liu, S., and Chang, Z. (2022). Developing improved time-series DMSP-OLS-Like data (1992–2019) in China by integrating DMSP-OLS and SNPP-VIIRS. IEEE Trans. Geoscience Remote Sens. 60, 1–14. doi:10.1109/TGRS.2021.3135333
Xie, L., Bai, Z., Yang, B., and Fu, S. (2022). Simulation analysis of land-use pattern evolution and valuation of terrestrial ecosystem carbon storage of changzhi city, China. Land 11, 1270. doi:10.3390/land11081270
Xu, C., Zhang, Q., Yu, Q., Wang, J., Wang, F., Qiu, S., et al. (2023). Effects of land use/cover change on carbon storage between 2000 and 2040 in the yellow river basin, China. Ecol. Indic. 151, 110345. doi:10.1016/j.ecolind.2023.110345
Yang, K., Zhou, P., Wu, J., Yao, Q., Yang, Z., Wang, X., et al. (2024). Carbon stock inversion study of a carbon peaking pilot urban combining machine learning and landsat images. Ecol. Indic. 159, 111657. doi:10.1016/j.ecolind.2024.111657
Yu, Y., Han, L., Li, M., Xiang, H., Wang, Z., Zhang, S., et al. (2021). Study on the spatial-temporal characteristics of ecosystem services and tradeoffs/synergies in Ha-Chang urban agglomeration. Res. Soil Water Conservation 28, 293–300. doi:10.13869/j.cnki.rswc.20200724.002
Zhang, P., Li, Y., Yin, H., Chen, Q., Dong, Q., and Zhu, L. (2022). Spatio-temporal variation and dynamic simulation of ecosystem carbon storage in the north-south transitional zone of China. J. Nat. Resour. 37, 1183–1197. doi:10.31497/zrzyxb.20220506
Zhang, S., Gao, Q., Zhang, R., Song, C., and Li, Z. (2024). Evaluating the changes and driving factors of carbon storage in napa sea basin using the PLUS-InVEST model. China Environ. Sci. 1-9. doi:10.19674/j.cnki.issn1000-6923.20240412.030
Zhang, Z., Jiang, W., Peng, K., Wu, Z., Ling, Z., and Li, Z. (2023a). Assessment of the impact of wetland changes on carbon storage in coastal urban agglomerations from 1990 to 2035 in support of SDG15.1. Sci. Total Environ. 877, 162824. doi:10.1016/j.scitotenv.2023.162824
Keywords: urban agglomeration, land use change, carbon stock, driving factor, scenario simulation, traditional industrial transformation region
Citation: Zhi R, Lin L, Yang X, Zhang J, Shao J and Xu X (2025) Spatiotemporal evolution and driving factors analysis of carbon stock in traditional industrial transformation region: a case study in Harbin and Changchun urban agglomeration, China. Front. Environ. Sci. 13:1636946. doi: 10.3389/fenvs.2025.1636946
Received: 28 May 2025; Accepted: 23 June 2025;
Published: 09 July 2025.
Edited by:
Sandeep Poddar, Lincoln University College, MalaysiaReviewed by:
Sumit Das, JIS College of Engineering, IndiaYavana Rani Subramanian, Jain University, India
Copyright © 2025 Zhi, Lin, Yang, Zhang, Shao and Xu. This is an open-access article distributed under the terms of the Creative Commons Attribution License (CC BY). The use, distribution or reproduction in other forums is permitted, provided the original author(s) and the copyright owner(s) are credited and that the original publication in this journal is cited, in accordance with accepted academic practice. No use, distribution or reproduction is permitted which does not comply with these terms.
*Correspondence: Lin Lin, aHNkbGxAaHJibnUuZWR1LmNu; Xu Yang, eWFuZ3h1MjAwNWdkQGhyYm51LmVkdS5jbg==