 Jianting Liu
 Jixiang Hao
 Limin Su
- School of Mathematics and Statistics, North China University of Water Resources and Electric Power, Zhengzhou, China
Collaborative governance (co-governance) is a crucial pathway and essential strategy for ensuring ecological security and high-quality development in the Yellow River Basin (YRB), which faces complex ecological challenges amid unbalanced regional development. This study employs a three-layer driving chain analytical framework to systematically investigate barriers to ecological co-governance in the YRB through a tiered approach. Firstly, spatial econometric methods are utilized to analyze spatial agglomeration, network strength, and spatial spillover effects, clarifying macro-level associations and driving mechanisms of ecological collaborative governance. Subsequently, tripartite evolutionary game analysis is conducted to explore the intrinsic dynamic logic of barrier factors emerging from micro-level interactions among key actors, supplemented by core driving layer theoretical analysis to investigate obstacles in the co-governance system. The results indicate that, (1) From a spatial measurement perspective, the effectiveness of ecological governance in the YRB exhibits significant spatial correlation, agglomeration, and interaction effects, with insufficient digital governance levels and structural flaws in the green industrial sector identified as key apparent-level barriers. (2) Under stable collaborative conditions, the vertical governance system operates efficiently; parameter sensitivity analysis and model robustness tests reveal that environmental protection costs in production, environmental regulation intensity, and supervision intensity are critical and sensitive parameters, significantly influencing the speed of strategic change and convergence, with the model demonstrating strong robustness. (3) Critically, divergent governance concepts and conflicting regional interests, rooted in disparities in core governance awareness and interests, constitute the most fundamental barriers to ecological co-governance.
1 Introduction
The YRB holds a key position in China’s ecological security pattern and regional economic development map, and is an important pillar for maintaining national ecological stability and promoting coordinated regional development. At present, the governance of river basins still faces practical problems such as insufficient coordination between water conservation in the upper reaches and soil and water conservation in the middle and lower reaches, as well as poor cross-regional rights and responsibilities connection. It is urgent to break the “segmented governance” model and build a governance system that is coordinated throughout the region. On 20 January 2025, the Political Bureau of the Central Committee of the Communist Party of China held a meeting to review and approve the “Opinions on Comprehensively Promoting Ecological Protection and High-Quality Development in the Yellow River Basin”, clearly requiring continuous improvement of the large-scale ecological protection and coordination pattern in the YRB. This will be achieved by systematically enhancing the water conservation capacity in the upper reaches, strengthening soil and water conservation in the middle reaches, and promoting wetland protection and ecological governance in the lower reaches. Strengthen the integrity and correlation of ecological protection throughout the entire river basin; At the same time, it is emphasized that the Central Leading Group for Coordinated Regional Development needs to strengthen overall coordination and supervision and guidance, and relevant central departments should increase their support. The Party committees and governments at all levels in the provinces and regions along the Yellow River should earnestly fulfill their main responsibilities, forming a vertical governance system of “central coordination-departmental collaboration-local implementation”, which not only delineates the implementation path of cross-regional collaboration and hierarchical linkage for the governance of the river basin, It also provides a system framework for mobilizing multiple forces, including enterprises and social organizations, to participate in governance. Despite the high attention of the state and the active actions of various provinces, in the actual process of promoting co-governance, numerous obstructive factors have emerged one after another, significantly reducing the governance efficiency and hindering the improvement of the ecological environment in the YRB. A thorough understanding and analysis of these obstructive factors is precisely a key link in responding to the requirements of the above-mentioned meeting for “cross-regional coordination” and “hierarchical linkage”, and implementing the concept of multi-party participation in the Yellow River Protection Law. It has immeasurable practical significance for promoting the improvement of the ecological environment in the YRB and achieving a win-win development of ecology and economy.
Existing studies on the barriers to ecological co-governance in the YRB have adopted a single-dimensional analytical lens. Scholars have constructed multi-dimensional evaluation frameworks centered on ecological resilience, governance performance, environmental regulation efficiency, and industry-ecology synergy, leveraging spatial econometric models to decipher driving mechanisms. For instance, involved spatial analysis on four dimensions—ecological image, culture, institution, and vitality—using models such as the Theil index, modified gravity model, and multiscale geographically weighted regression (Yang et al., 2024). From the perspective of synergistic enhancement, it reveals the differentiation mechanism of four dimensions upgrading of provincial capital cities through ecological corridor construction and policy coordination to drive the development of the surrounding areas. Examined the impacts of technological innovation, opening-up, and industrial structure on ecological resilience using the Spatial Durbin Model (Wang et al., 2023). The DPSIRM framework is integrated with spatial autoregressive models (SAR) to identify the “pollution haven” effect of interprovincial industrial transfers, and green technology diffusion and market entry restrictions are advocated for to enhance basin - wide collaborative emission reduction (Cai et al., 2022). Additionally, combined coupling coordination models with spatial econometric techniques to uncover the “east-high-west-low” spatial divergence in ecological-economic coordination across the YRB (Li et al., 2022). While these studies highlight the strengths of spatial econometric models in identifying cross-regional interactions and optimizing policy synergies, they often overlook the micro-level behavioral dynamics of governance actors.
In the realm of micro-level behavioral motivations for ecological collaboration, evolutionary game theory has emerged as a critical tool for analyzing strategic interactions among governments, enterprises, and the public. Early research focused on single-policy scenarios: The study developed a dual-level (interprovincial and intraprovincial) game model to assess the effectiveness of ecological compensation mechanisms, demonstrating that their success hinges on the synergistic enhancement of penalty intensity and information transparency (Dong et al., 2024). Constructed a central-local government game framework under China’s environmental inspection regime, revealing that inspection accountability pressures significantly curb local governments’ tendencies towards ‘passive collusion.’ Recent studies have innovatively incorporated extended variables such as reputation mechanisms and technology spillovers (Li et al., 2024). For example, Researchers (Cao et al., 2024) constructed a central-local government game framework under environmental inspection regime, revealing that inspection accountability pressures significantly curb local governments’ tendencies towards ‘passive collusion’. Absorptive capacity theory was integrated, proving that local governments’ ability to imitate neighboring governance practices acts as a key mediator in interprovincial ecological compensation coordination (Lu et al., 2022). Similarly, climate investment and finance and ecological value realization mechanisms were incorporated into a game-theoretic framework (Zhu et al., 2024). A tripartite evolutionary model involving governments, polluting firms, and third-party certifiers was designed, with simulations indicating that a 65% reduction in third-party certification costs effectively resolves “regulatory capture” dilemmas (Xu et al., 2018). These studies, along with several other research works (Lou et al., 2022; Peng et al., 2024; Zhang et al., 2024; Zhao et al., 2023) quantify the sensitivity of institutional parameters to equilibrium strategies through dynamic simulations, offering micro-level insights for precision policy design.
Existing studies have been able to clearly identify the key obstructive factors of co-governance from both macro and micro perspectives respectively. However, the determination of the levels and roles of these obstructive factors often lacks reasonable analytical support. Moreover, the failure to combine macro and micro factors has led to the entire co-governance system chain not being closed. For instance, macro spatial analysis is difficult to reveal the behavioral motives of governance subjects through apparent indicators (Chen M. et al., 2022; Jiang et al., 2023; Xu S. T. et al., 2024; Sun et al., 2023; Chen Y. et al., 2022). The micro-behavioral game model lacks the constraints of geographical heterogeneity on the choice of behavioral strategies, which easily makes it difficult for policy recommendations to reach the root obstacles that hinder co-governance.
Therefore, this study takes the YRB comprehensive collaborative governance system as the research object, and based on the two-way perspectives of horizontal cross-regional collaboration and vertical multi-subject collaboration (central-local-enterprise interaction), conducts in-depth analysis using a three-layer driving chain structure. Firstly, after stratifying the obstacle factors, a spatial macroscopic analysis of the apparent driving layer is conducted to identify the spatial correlation and agglomeration characteristics of the basin’s ecological governance, laying the foundation for clarifying the horizontal synergy effect. Secondly, construct a tripartite evolutionary model of stakeholders in the intermediate influence layer, explore the dynamic equilibrium of co-governance under the interaction of multi-agent strategies, and interpret the vertical collaboration mechanism. Finally, analyze the ideological obstacle factors of the core driving layer and address the root cause of the contradiction between horizontal collaboration and vertical collaboration. Overall, through the combination of spatial econometric model support, evolutionary game numerical simulation, and core factor theoretical analysis, systematically dissects the predicament of the YRB ecological co-governance system from the outside to the inside from a dual perspective, providing targeted analytical support for breaking the “fragmented governance” predicament.
2 Materials and methods
2.1 Study area
The Yellow River is the second longest river in China, with a total length of approximately 5,464 km, flowing through nine provinces and autonomous regions including Qinghai, Sichuan, Gansu, Ningxia, Inner Mongolia, Shaanxi, Shanxi, Henan, and Shandong (Figure 1). There are significant regional differences in ecological quality and economic development within the YRB. Overall, the ecological environment of the YRB is relatively poor. The Yellow River accounts for only 2% of the country’s total water resources, yet it must meet the water needs of 12% of the population and 17% of the cultivated land in the basin. In some areas of the basin, low vegetation coverage, concentrated precipitation, and frequent rainstorms lead to a large influx of sediment into the Yellow River, which raises the riverbed and increases flood control pressures. Moreover, as a key agricultural and industrial area in China, the economic development in the downstream provinces is significantly more advanced than that in the upstream regions. These issues are complex and challenging, spanning multiple regions, and severely restricting the sustainable development of the Yellow River economic belt. Therefore, it is imperative to conduct in-depth research on the barriers to ecological co-governance in the basin to promote high-quality development in the YRB.
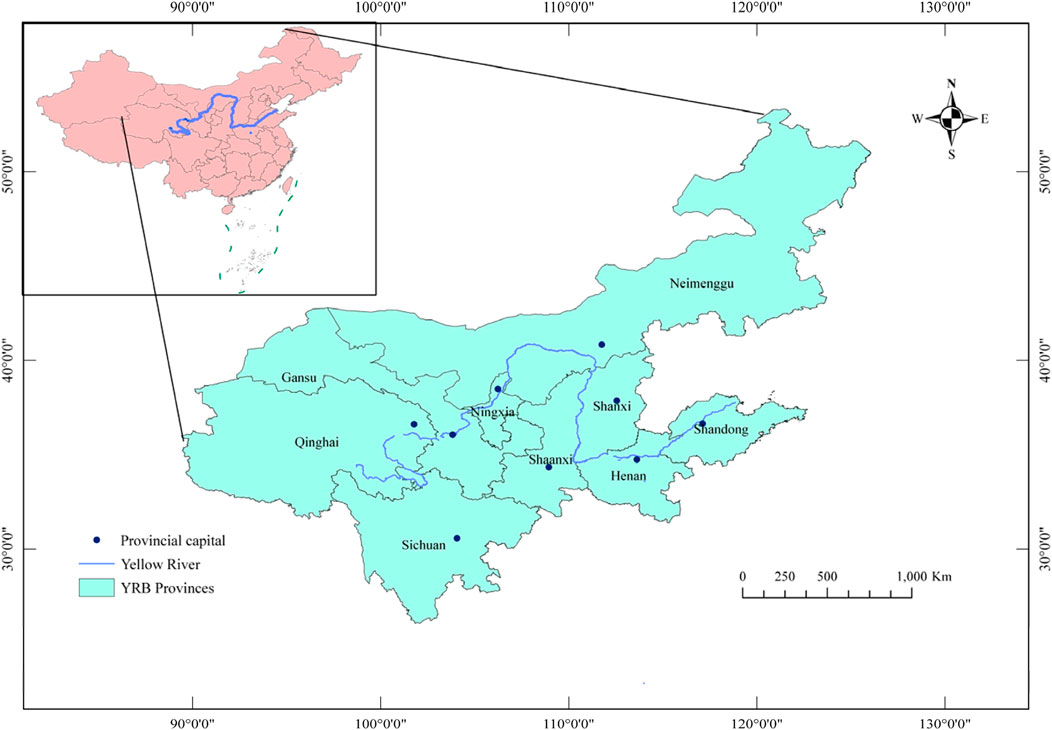
Figure 1. Study area.
2.2 Data sources and factor acquisition
The study takes provincial administrative units as the research units. By systematically reviewing the relevant literatures in databases such as CNKI, Web of Science, and Ei Village, and combining with the policy documents released on the national official website, a systematic review and frequency statistics of the obstructive factors for ecological co-governance in the YRB mentioned in the literatures were conducted first. Then, based on the significance and frequency of the influence of the factors on governance practices, this study makes a preliminary selection. Subsequently, five experts who have been deeply engaged in the research field of the YRB for more than 3 years and hold at least the title of associate professor were invited to participate in the verification. These experts mainly come from the middle and lower reaches of the basin, and their research fields cover environmental governance, environmental policy analysis, sustainable development, environmental management science and engineering, etc. After expert verification and by eliminating some repetitive factors and combining those with strong correlations,16 specific obstacle factors for the ecological co-governance of the YRB were finally determined through comprehensive screening (Table 1). The research data regarding the apparent layer and the ecological co-governance index are obtained from sources such as the National Data Network, China City Yearbook, China Statistical Yearbook, and China Urban Construction Yearbook. These data cover the nine provinces along the YRB from 2014 to 2023. Missing data are filled using the linear interpolation.
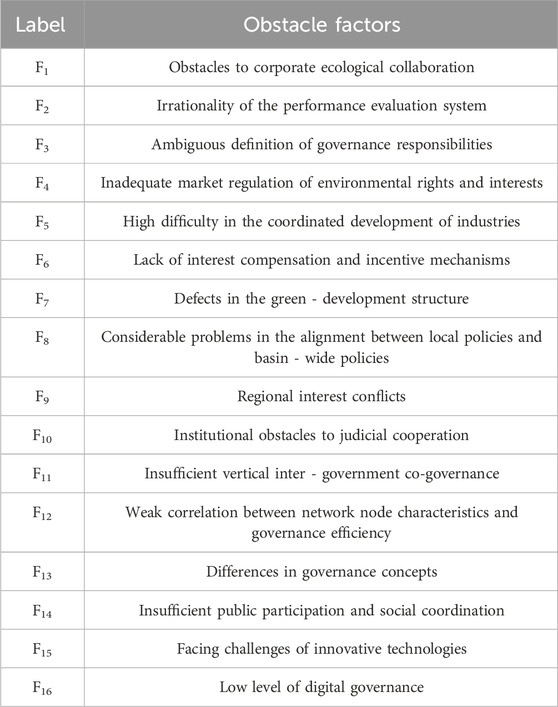
Table 1. Specific obstacle factors.
2.3 Research framework
2.3.1 Theoretical framework design and advantages
The three-layer driving chain framework is rooted in the co-governance theory proposed by Bodin (2017), which emphasizes that effective cooperation among different public and private actors as well as stakeholders is crucial when addressing complex environmental issues. Traditional co-governance research often suffers from narrow analytical perspectives and unclear hierarchical relationships when dealing with complex issues such as trans-regional river basin governance. Specifically, studies in the field often adopt fragmented perspectives, analyzing from macro, micro, and theoretical angles in isolation (Jiang and Zheng, 2024; Xu M. et al., 2024; Geng et al., 2022; Zhu et al., 2023; Nie et al., 2024), ignoring their connections and contradictions, and lacking a systematic transmission process, making it difficult to put forward constructive suggestions for the overall governance framework. To solve these problems, this study innovatively integrates and constructs a three-layer driving chain analytical framework, deeply integrating the co-governance theory, aiming to open up a new path for co-governance. Meanwhile, the analysis also conform to the processes and ideas of traditional methods, with credibility and reliability.
The framework transcends the flat and isolated analytical approaches of traditional research, establishing a three-dimensional hierarchical structure spanning the apparent driven layer, intermediate influence layer, and core driving layer. Progressing from shallow to deep, these layers jointly dissect ecological governance obstacles from diverse perspectives to enable efficient ecological co-governance: the apparent layer centers on the application effects of explicit tools, leveraging spatial econometrics to precisely identify characteristics like spatial agglomeration, network strength, and spillover of river basin governance outcomes; the intermediate layer focuses on subjects’ behavioral strategies, integrating the “multi-subject collaborative interaction” concept of co-governance to analyze actors’ behavioral choices during interest balancing and their impacts on the governance process; the core driving layer returns to the essence of “multi-subject consensus building” in co-governance, delving into ideological factors and their potential influences on governance directions, while incorporating insights from international governance frameworks. Compared to traditional co-governance research, this framework innovates and integrates at both theoretical and practical levels, overcoming the macro-micro disconnection dilemma: theoretically, it reconstructs a transmission chain for governance obstacles, tracing tool failures back to core-layer conceptual roots and revealing multi-perspective factor connections; practically, it bridges macro spatial spillover effects with micro subjects’ strategy choices—addressing the fragmentation of existing studies (e.g., theoretical reviews, spatial econometrics, evolutionary games)—and by connecting macro governance spatial patterns with micro behavioral collaboration under core concepts, provides a holistic trans-regional co-governance solution from spatial pattern identification and behavioral strategy analysis to conceptual consensus building.
2.3.2 Technical route
Based on the three-layer driving chain analytical framework (Figure 2), this study first classifies 16 obstacle factors affecting the ecological co-governance of the YRB into the apparent driven layer, the intermediate influence layer, and the core driving layer using the DEMATEL method and K-means++ algorithm. Subsequently, in the horizontal perspective of the apparent layer, Ecological Governance Index (EGI) was constructed to analyze its spatiotemporal variations, and the global Moran’s I index, modified gravity model and Spatial Lag Model (SLM) were utilized to analyze spatial correlations and spillover effects, thereby identifying the key epigenetic driving layer obstacles. From the vertical perspective of the intermediate influence layer, a tripartite evolutionary game model involving enterprises, local authorities and the central government was established. Through the analysis of equilibrium point stability, combined with numerical simulation, parameter sensitivity analysis and model robustness test, the interaction law of the subject strategy was clarified. At the core driving layer, core obstacles were analyzed, and experiences were extracted by comparing international governance frameworks. Finally, the research findings from the three layers were integrated, and conclusions as well as targeted governance recommendations were proposed from both horizontal and vertical dimensions, to systematically reveal the obstacle mechanisms and solutions for ecological co-governance in the YRB.
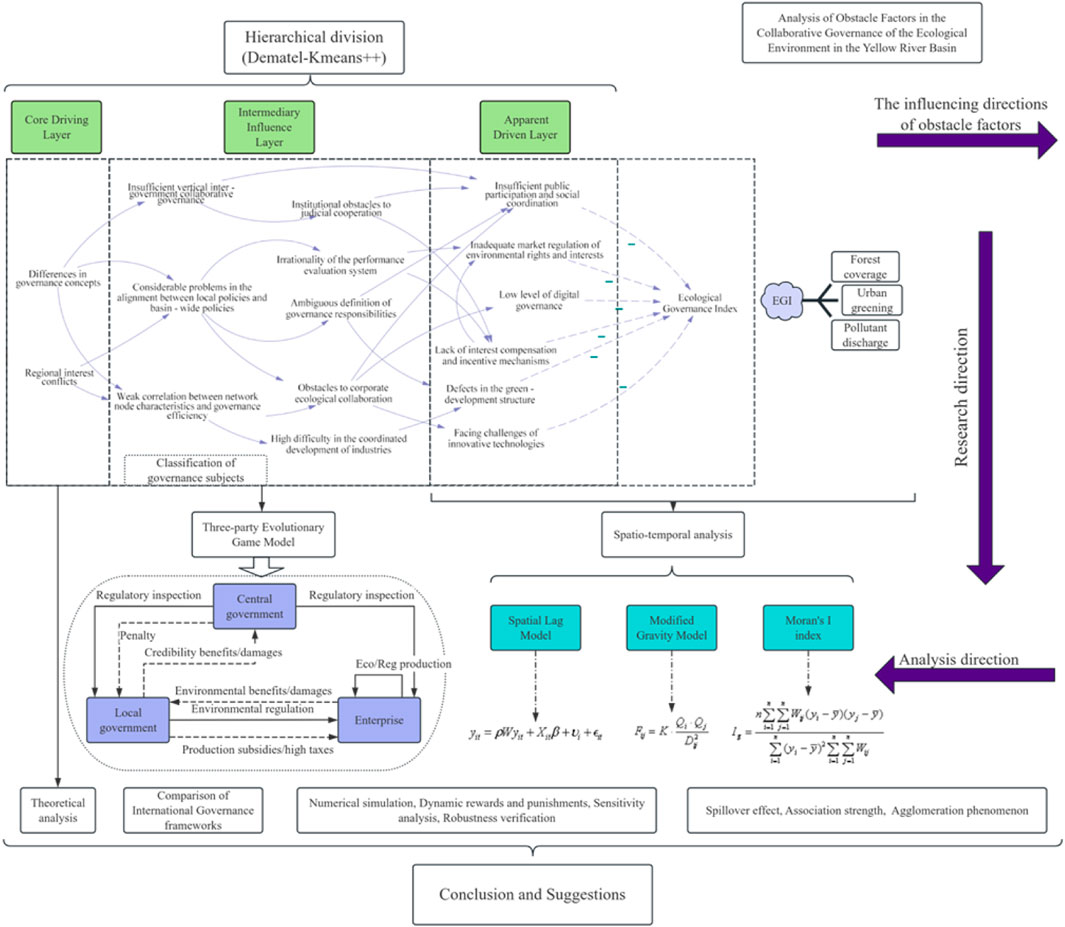
Figure 2. Research framework.
2.4 Methods: quantification tools for the three-layer driving framework
2.4.1 Hierarchical classification of obstacle factors
The Decision-Making Trial and Evaluation Laboratory method (DEMATEL) constructs an influence relationship matrix to assist decision-makers in identifying the interactions among various obstacle factors in the ecological co-governance system of the YRB, thereby revealing the causal relationship structure within the system (Du and Li, 2022). The direct influence matrix is expressed as
the values
The K-means++ algorithm first randomly selects a data point from the centrality and cause-degree values of each factor obtained by the DEMATEL as the first cluster center (Arthur and Vassilvitskii, 2006). For the
where
2.4.2 Spatial agglomeration measurement
The EGI directly reflects the effectiveness of ecological environment governance. To study the coordinated development and spatial correlation within the YRB region, it is necessary to obtain the spatial autocorrelation index. Global spatial autocorrelation was used to analyze the distribution characteristics of the EGI and the spatial correlation across the basin (Dewinter et al., 2022). The calculation formula of the global Moran’s I index is as follows:
among them, the value range of the Moran’s I index
2.4.3 Inter-provincial ecological collaboration linkage intensity measurement
In the process of ecological collaborative management in the YRB, the characteristics of close correlation and mutual influence among provinces and regions in the basin are extremely critical. The theoretical roots of the gravitational model can be traced back to Newton’s law of universal gravitation. The improved model can depict the spatial connection strength between cities or regions through indicators such as GDP (Yang et al., 2024). By using the modified gravity model, this study can accurately analyze the spatial linkage strength and its changes across temporal and spatial dimensions. The formula is as follows:
2.4.4 Apparent driven obstacle spatial spillover effects measurement
Spatial panel models are econometric models that combine spatial correlation and the time dimension. They can effectively capture the spatial dependence and temporal trends among the ecological governance indices of various provinces. Specifically, the introduction of spatial weight matrices and spatial econometric models can reflect the mutual influence of ecological governance among provinces in a river basin and characterize the spatial dependence of ecological environment indices (Wang et al., 2023). After model verification, due to the weak spatial spillover effect of the independent variable, this study selects the SLM derived from the degradation of the Spatial Durbin model (SDM) to investigate the spatial spillover effect of the dependent variable. The EGI of each province is influenced not only by the obstacle-factor indicators within the province itself but also by the governance indices of neighboring provinces. The formula for the spatial panel lag model (random-effect) is:
2.4.5 Intermediate influencing layer strategic interaction simulation
In the ecological co-governance system of the YRB, understanding the motives and strategies of the microscopic behaviors of the main bodies is of great importance. The high-, medium- and low-influence driving layers in the intermediate influence layer of this study can be attributed to three types of main bodies: the central government, local governments, and enterprises. These three subjects all belong the vertical cooperative governance system of the YRB, and there are game relations and differences in interest goals among them. A tripartite evolutionary game model is established for them to analyze the strategic choices and dynamic changes of the main bodies, find the stable equilibrium points of the strategies, and analyze the optimization direction of the microscopic behavior mechanism of the co-governance main bodies.
Based on the actual conditions of the basin and the research design, the game relationships and specific interest orientations among various entities can be determined (Han et al., 2023). Subsequently, the spread and evolution of strategies among these entities can be simulated through the expected payoffs of each entity (for specific assumptions, see Section 2.5.3). Suppose the expected pay-off for subjects when choosing the “adopt” strategy is
The dynamic replication equations of subjects (
2.5 Empirical design and parameter setting
2.5.1 Obstacle factor influence matrix
The construction of the Obstacle factor influence matrix was also determined by the majority voting principle of the above five experts. The scoring process follows the principle of majority voting: Only when 3 or more experts unanimously agree that there is an influence among the factors does the scoring stage commence. Subsequently, based on the intensity of the influence (strong, medium, or weak), the scoring is further refined through the principle of majority voting by the five experts. However, the number of experts, their regional distribution, the coverage of research fields, and the limitation that this scoring matrix cannot conduct reliability and validity statistics may have a potential impact on the universality of the research results. The direct influence matrix (Table 2) was derived and constructed after expert interviews and analysis of the obstacle factors for the co-governance of YRB collected from literature and materials. The score range is from 0 to 9, with 0 indicating almost no direct influence and 9 indicating strong direct influence.
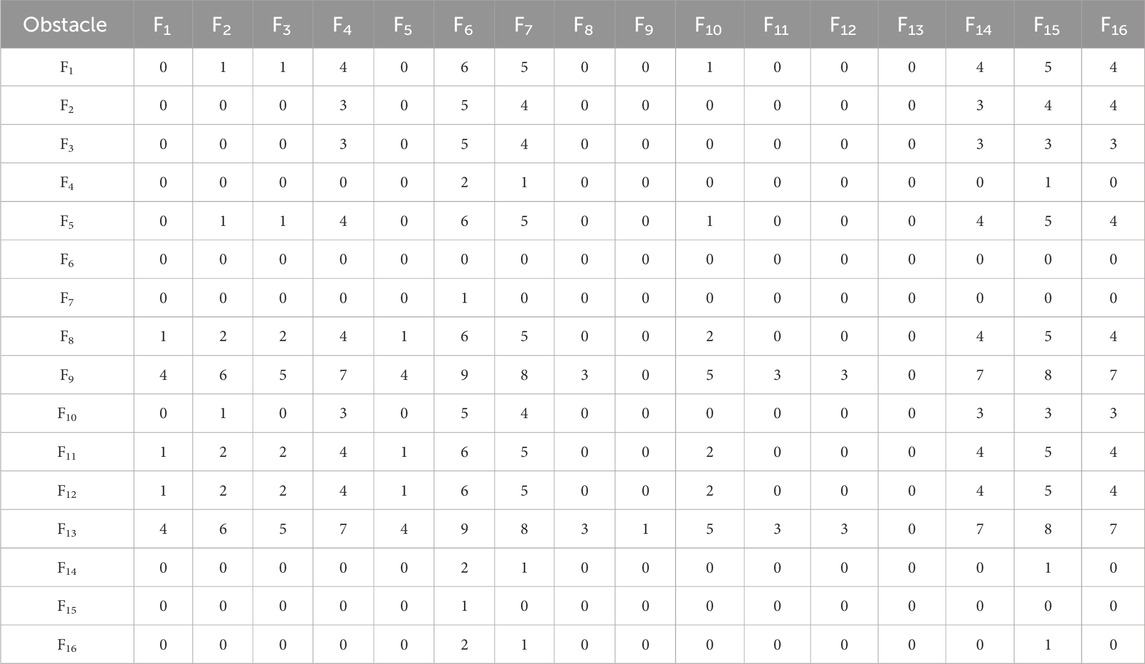
Table 2. Obstacle factor direct influence matrix.
2.5.2 Establishment of the indicator system
The EGI will select indicators from three dimensions: sewage discharge, urban greening, and forest coverage (Table 3). The standardized data are weighted using the critic weighting method, and the comprehensive score is derived via a comprehensive evaluation approach. The six factors in the apparent driven layer are taken as explanatory variables (Table 4), and the EGI is taken as the explained variable to establish a spatial econometric model, aiming to explore the macro - level impact of obstacle factors on ecological co-governance. The data of obstacle factors in the driving layer, which have different measurement scales, were standardized, and collinearity diagnosis was performed. The VIF values were all less than 5, indicating no obvious multicollinearity among the explanatory variables.
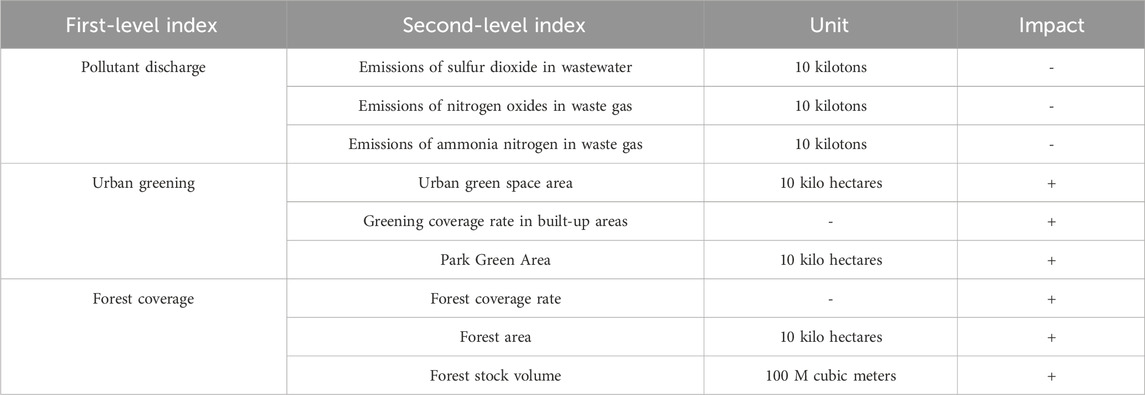
Table 3. Index system for ecological governance.
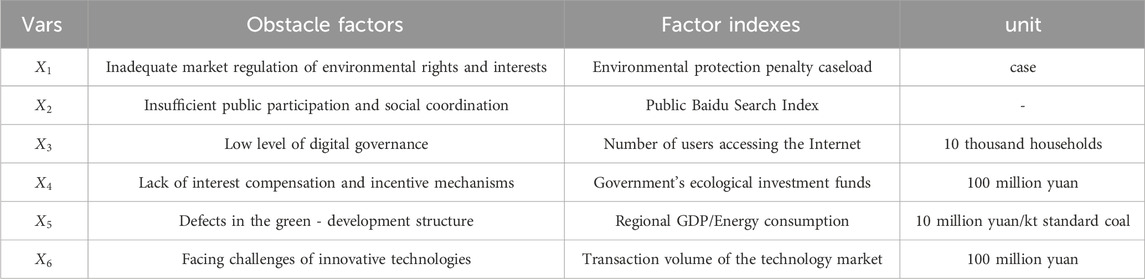
Table 4. Indicator system of explanatory variables.
2.5.3 Basic assumptions of the evolutionary game model
1. Game Subjects
The game involves three participant groups: enterprises, local governments, and the central government, all of which have bounded rationality.
2. Assumptions and meanings of relevant parameters in the evolutionary game model (Table 5)
3. Probabilities of adopting behavioral strategies
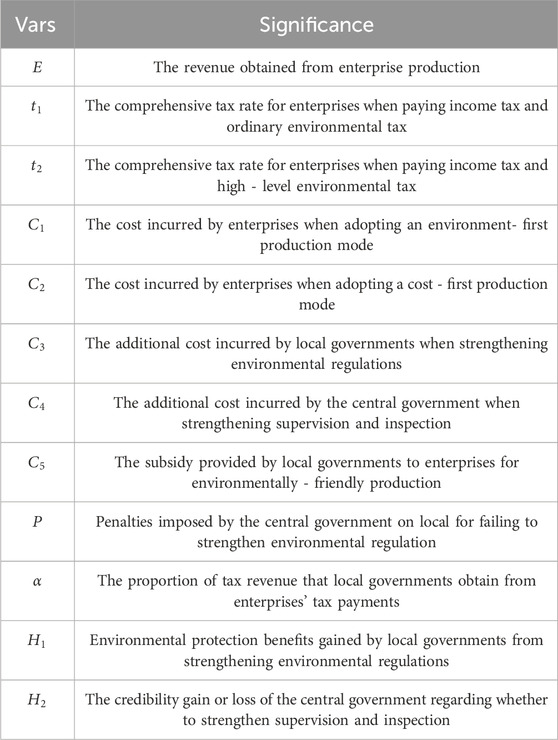
Table 5. Main parameters and meanings.
Suppose that in the initial state of the game among the three players, the probability that an enterprise chooses the “adopt environmentally friendly production” strategy is
3 Results and discussion
3.1 Hierarchical division analysis
In Figure 3, F6, F7, and F15, as strong result factors, and F4, F14, and F16, as weak result factors, indicate that these six influencing factors are more likely to belong to the apparent-driven layer. F9 and F13, as strong cause factors, suggest that they are more likely to play the role of core drivers and influencers in the entire system. And F1, F2, F3, F5, F8, F10, F11, F12 may be at an intermediate level, both influencing the apparent factors and being influenced by the core factors.
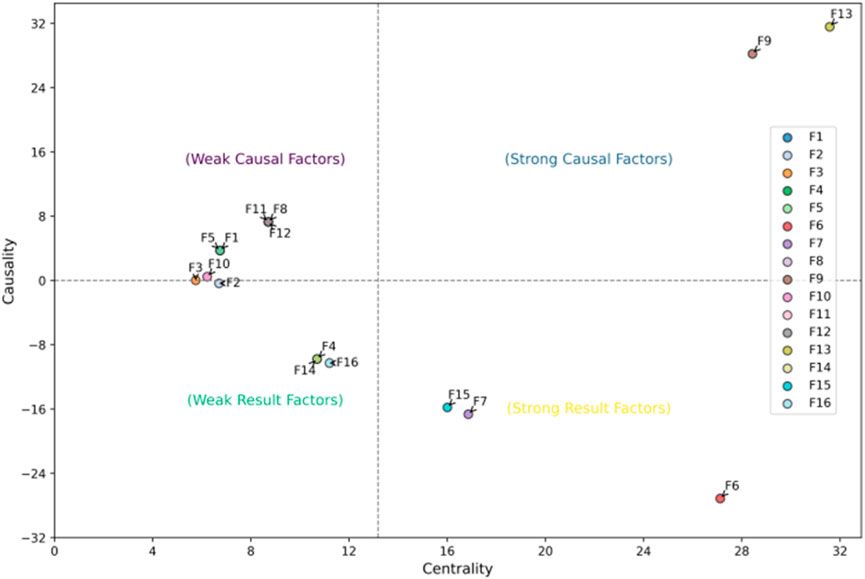
Figure 3. Scatter plot of centrality and causality degree values.
Clustering is performed on the centrality and cause degree values, with the optimal number of clusters set between 3 and 6 (determined based on the number of influencing factors). Using the silhouette coefficient and clustering effect as criteria, it is found that the optimal number of clusters is 6 when the silhouette coefficient reaches 0.79 (Table 6). For further analysis, the core driving layer is retained; the high, medium, and low influence driving layers are merged into an intermediate influence layer; and all driven layers are merged into the apparent driven layer. Additionally, the EGI is incorporated as an indicator to characterize the direct impact of driven-layer indicators on the EGI. This facilitates analyzing the influence intensity and specific effects of factors in the apparent driven layer on ecological co-governance across spatiotemporal dimensions.
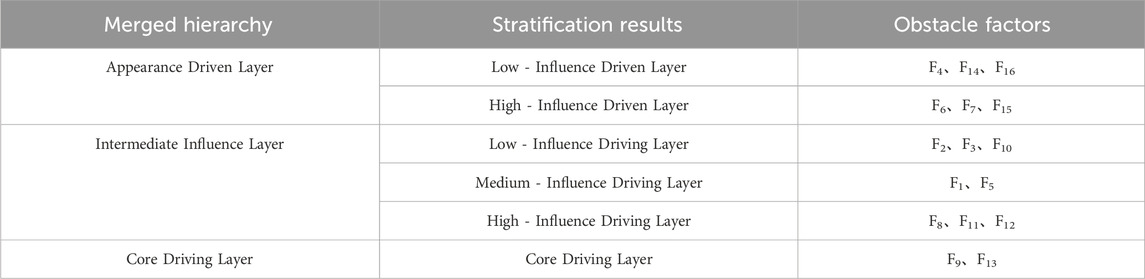
Table 6. Stratification of obstacle factors.
3.2 Analysis of apparent layer
3.2.1 Temporal and spatial changes analysis
The average EGI of the entire YRB has basically maintained an increasing trend year by year (Figure 4). The EGI witnessed a significant leap from 2015 to 2016 and has since remained at a relatively high level in recent years. The specific EGI performance of each province within the basin is shown in Figure 5, the provincial EGI performance within the basin exhibits distinct disparities: Qinghai and Gansu, despite starting with relatively high EGI in 2014, saw sluggish growth in subsequent years. While their ecological governance efforts have yielded modest results, significant room for improvement remains. Shanxi Province, Inner Mongolia Autonomous Region, and Ningxia Hui Autonomous Region fall into a medium EGI bracket, with similar growth trajectories, placing them in the second echelon. Since 2014, Sichuan, Shaanxi and Shandong Province have continuously demonstrated good EGI with rapid growth rates, showcasing strong ecological governance capabilities and achievements, thus belonging to the first echelon. Henan Province, which began with a low EGI in 2014, has surged through sustained efforts to join the first echelon.
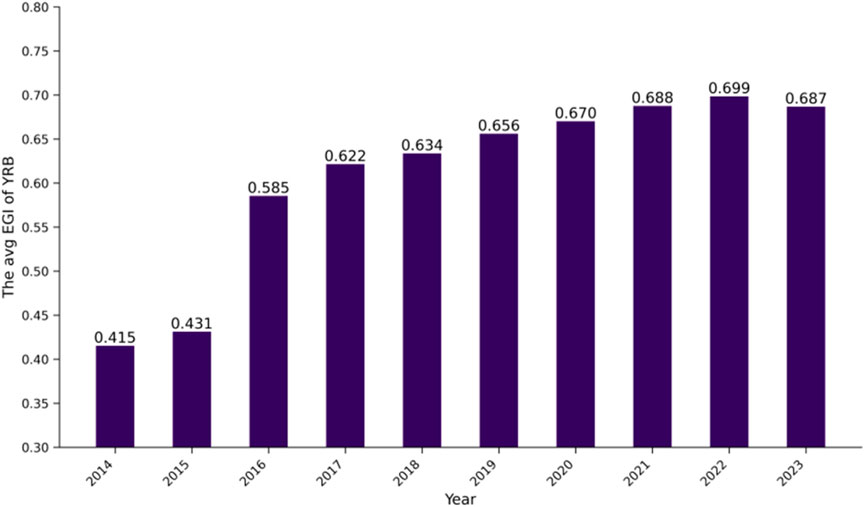
Figure 4. The annual average EGI of YRB.
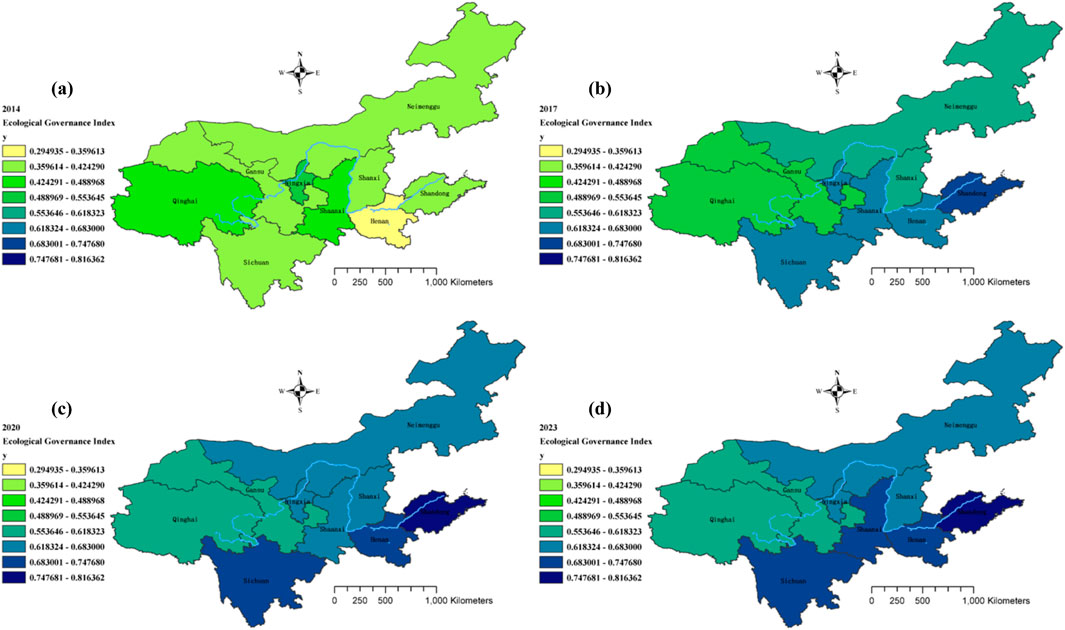
Figure 5. The spatiotemporal evolution of EGI ((a), (b), (c), (d) correspond to 2014, 2017, 2020, 2023).
Given the characteristics of China’s YRB ecological governance, which features progressive deepening of policies and gradual release of synergistic effects amid rapid development, the rapid growth of the EGI index is highly reasonable. However, this study observes relatively significant fluctuations in the EGI around 2016, potentially attributed to the immediate performance of relevant national policies promulgated that year to promote ecological governance. Meanwhile, the outbreak of the COVID-19 pandemic in 2020 may also have impacted the ecological governance process. Against this backdrop, this study aims to determine whether the fluctuations in the EGI index involve structural breaks caused by factors such as policy shocks or sudden events. The Mann-Kendall test (Table 7) on the EGI reveals a significant overall upward trend (p = 0.0003), and the ADF test further indicates that the original sequence is non-stationary. To avoid excessive interference from trend terms in the Quandt-Andrews test, first-order differencing is applied to obtain annual fluctuation terms, thereby stripping out the linear trend. The test results show that the most likely year for a structural break is 2017, with a corresponding F-statistic of 4.9928 (p = 0.0606 > 0.05), indicating no significant structural break at the 5% significance level.
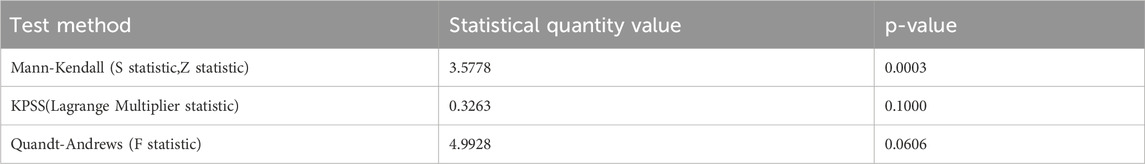
Table 7. Temporal stability test.
This result preliminarily confirms that the improvement of ecological governance effectiveness is a gradual optimization process driven by long-term trends. Notably, the absence of a structural break in 2020 aligns with practical logic: the construction of the EGI incorporates considerations of the continuity of existing governance achievements, and the strict control measures during the pandemic reduced human activities’ interference with the ecosystem, objectively supporting the stable rise of the environmental index without disrupting the overall progressive trend. However, due to limited sample size (e.g., only 2 years of data before 2016), the potential impact of the 2016 policies and the 2020 pandemic on the data structure cannot be completely ruled out, requiring further verification with longer time series in subsequent studies.
3.2.2 Spatial agglomeration development
Based on the Moran’s I index values (Table 8), the nine provinces along the Yellow River exhibited a weak spatial negative autocorrelation in 2014 (

Table 8. Global Moran’s I.
Furthermore, the overall Moran’s I index for ecological governance levels in the YRB remains relatively low. Observations of Moran scatter plots from 2014 to 2023 (Figure 6) further confirm that spatial agglomeration of governance levels is not pronounced. These results collectively indicate that the ecological co-governance effect among YRB provinces remains suboptimal, with insufficient spatial synergy and a need for enhanced inter-regional coordination mechanisms.
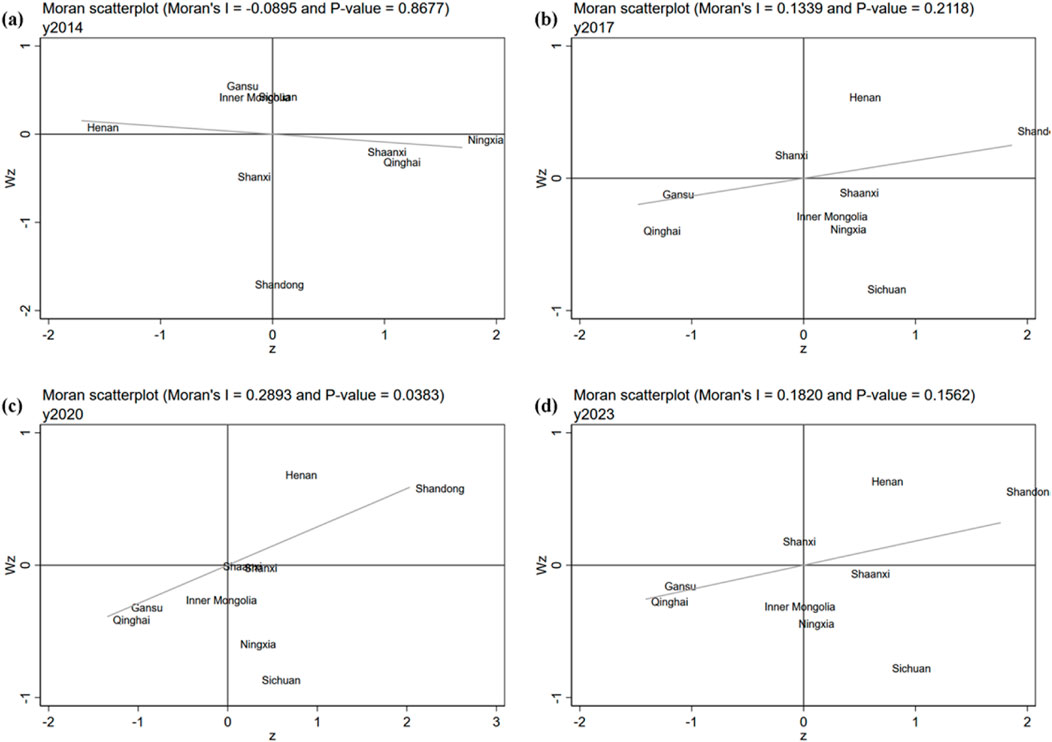
Figure 6. Moran’s I Spatial Autocorrelation ((a), (b), (c), (d) correspond to 2014, 2017, 2020, 2023).
3.2.3 Spatial network strength
The study introduces a modified gravity model to deeply analyze the spatial network structure of the EGI in the YRB. Taking the provincial capitals as key nodes, the ecological gravitational values between provinces are calculated to precisely analyze the linkage strength and mutual attraction degree among the provinces (Figure 7). The spatial network between provinces presents a multi-threaded overflow feature, and its influence has broken through the traditional geographical proximity restrictions. Even though Shandong is not adjacent to Sichuan, Inner Mongolia and Gansu, the spatial linkage between them remains close. Temporally, network strength showed a significant upward trend from 2014 to 2023, with all inter-provincial linkage strengths exceeding 4; notably, the 2023 ecological gravity value was substantially higher than that in 2014. These trends collectively indicate that the EGI spatial network is continuously strengthening, reflecting vibrant progress in ecological governance and robust cross-regional collaborative development capacity. Yang et al. (2024) found that the basin network presents a “Ji-shaped” pattern, which reflects the consistency between natural geography and ecosystems. This study selects the EGI as the quality variable, revealing that the network is in a ‘strong ecological attraction’ state. The difference between the findings and theirs may be attributed to the more refined research perspective or the different setting of quality variables in their study. Meanwhile, this section finds that although the intensity of co-governance is constantly increasing, the degree of linkage is not close enough, which to some extent indicates that the network pattern identified by Yang et al. (2024) may be a favorable form for the subsequent development at the municipal scale.
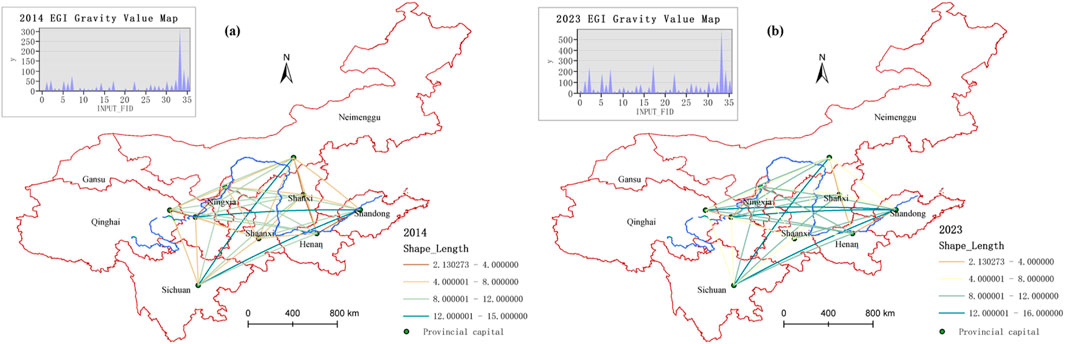
Figure 7. Spatial linkage strength ((a), (b) correspond to 2014, 2023).
3.2.4 SLM selection and regression outcomes
To select an appropriate spatial econometric model for this study, a series of diagnostic tests were performed (Table 9), including Lagrange Multiplier (LM) tests, Likelihood Ratio (LR) tests, Wald tests, and information criterion evaluations. First, both standard and robust LM tests were conducted to examine the presence of spatial lag or spatial error effects. Results indicated that the robust LM-error was not statistically significant. Notably, the information criteria (Table 10) and LR test results for the SEM were identical to those of the SLM, suggesting that the spatial autoregressive parameter
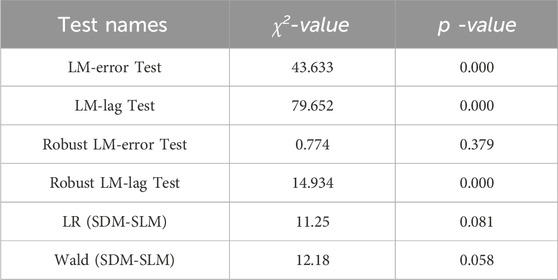
Table 9. Results of spatial Lagrange multiplier test.
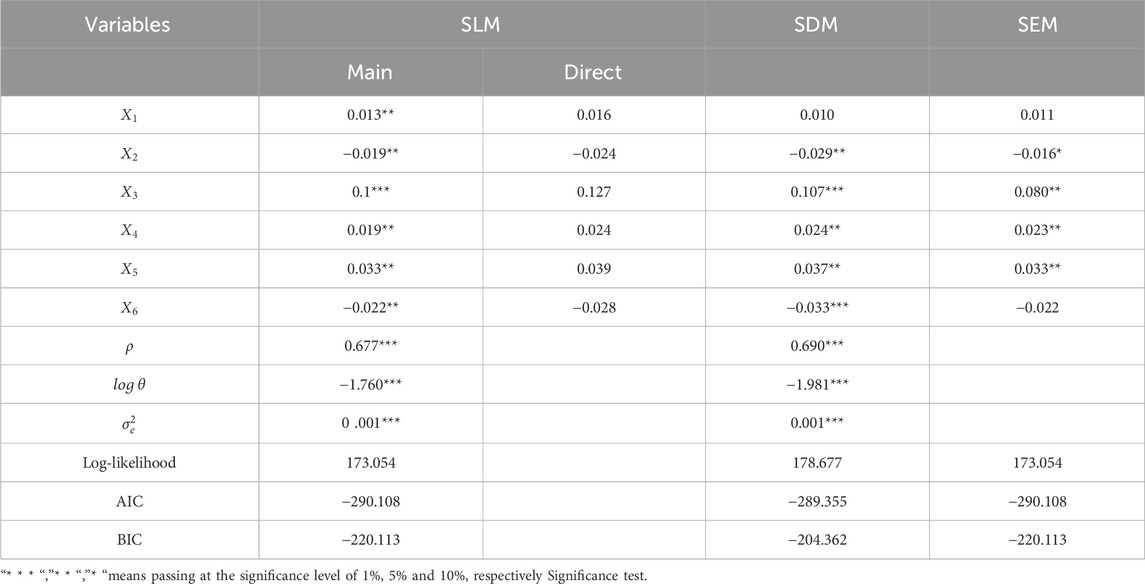
Table 10. Fitting results of the SLM.
The SLM has a quite good overall fitting effect with a goodness-of-fit of 0.8685 and all independent variables are statistically significant (Table 10; Figure 8). The coefficient
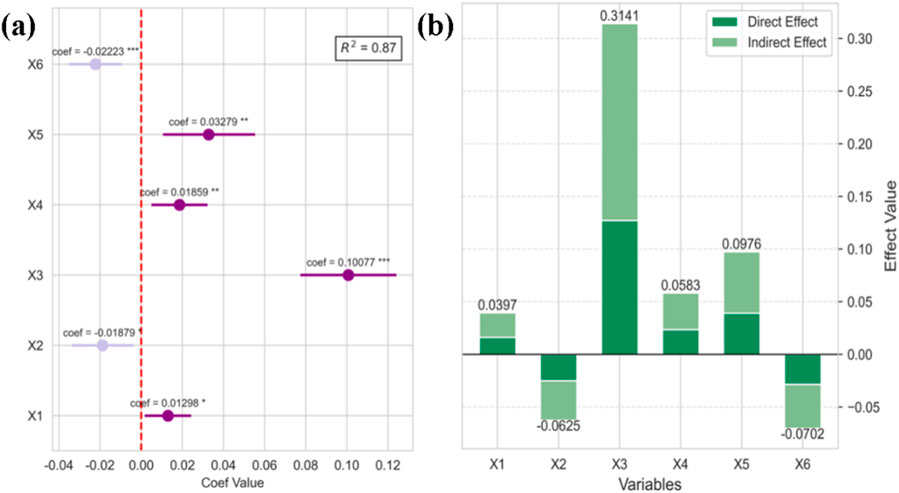
Figure 8. Coefficients of Obstacle Factors and Effect Diagram (a,b).
Combining the coefficients of explanatory variables in the model with an analysis of the direct, indirect, and total effects of the SLM (Figure 8), although SDM performs poorly in some parameters and the model is relatively complex, the fitting effect is basically the same as that of SLM, once again confirming the authenticity of the results.
3.3 Analysis of intermediate influence layer
3.3.1 Payoff matrix
To facilitate calculation and interpretation, an evolutionary game model involving tripartite entities is constructed with specific strategies and a payoff matrix (Table 11). The payoff matrix is ordered as follows: enterprises, local governments, and the central government.
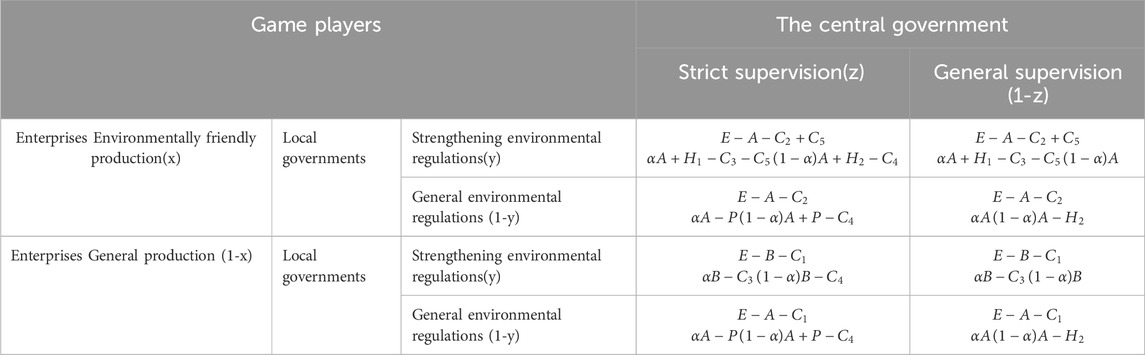
Table 11. The strategy and payoff matrix of the game players.
3.3.2 Analysis of equilibrium point stability
Below, replicator dynamic equations for the behavioral strategies of enterprises, local governments, and the central government are constructed respectively (Figure 9). The dynamic replication equations of enterprise (
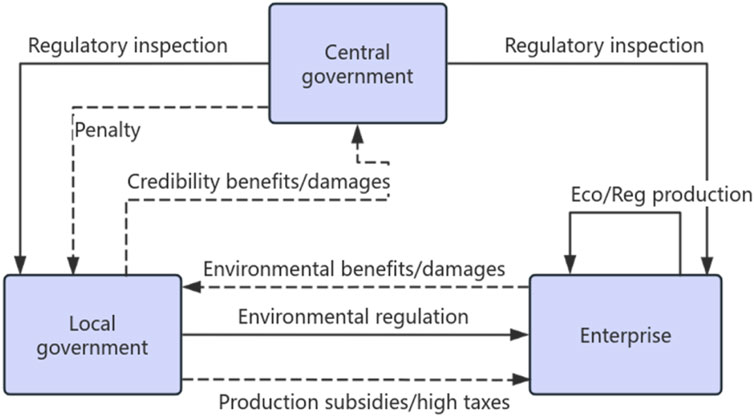
Figure 9. Simplified schematic of evolutionary game.
Setting
Table 12 shows the eigenvalues of the Jacobian matrix for each strategy combination. According to Lyapunov’s stability theory, the local stability of the system at equilibrium points can be determined by the eigenvalues of the corresponding Jacobian matrix. An equilibrium point is an evolutionarily stable point if all its eigenvalues are less than 0. Substituting the equilibrium points into the Jacobian matrix yields the eigenvalue expressions for each equilibrium point. In Table 13,
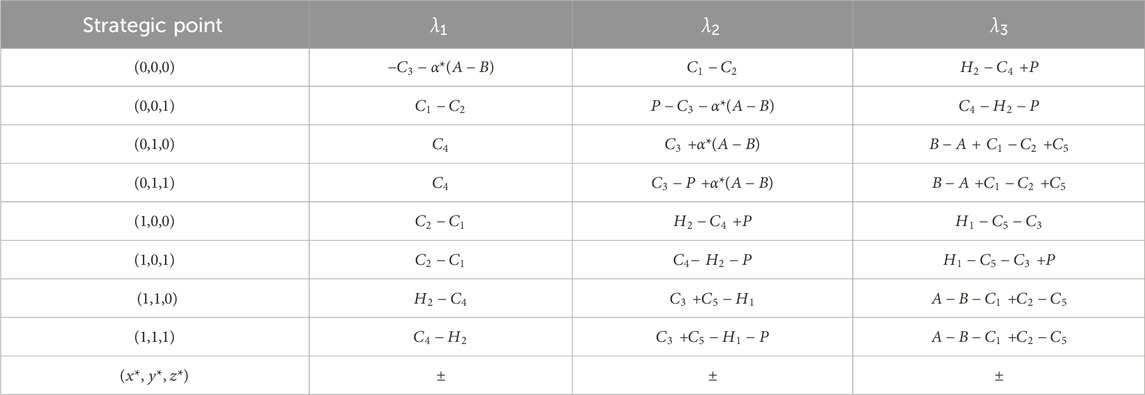
Table 12. Eigenvalues of strategy points.
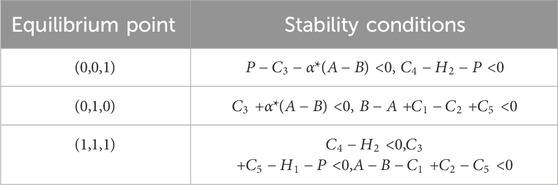
Table 13. ESS conditions.
3.3.3 Numerical simulation of the tripartite evolutionary game
The simulation process focuses on simulating the three scenarios mentioned above that may reach evolutionary equilibrium points. Initial strategy probabilities are set as follows: for the two-dimensional evolution schematic, probabilities are set to
Currently, all three parties tend to adopt pro-environmental strategies, forming a virtuous cycle. When the central government strengthens supervision and inspection, the penalties imposed on local governments exceed the additional costs incurred by local governments to enhance environmental supervision. For enterprises, adopting environmentally friendly production not only avoids high environmental taxes but also qualifies them for production subsidies from local governments; meanwhile, the environmental benefits gained by local governments outweigh the subsidies provided to enterprises. Key factors driving enterprises’ strategic shifts include the costs of pro-environmental production and the intensity of local government supervision. For the central government, credibility considerations are critical, with its supervision intensity serving as the core factor guiding strategic directions. As illustrated in the three-dimensional evolution path diagram (Figure 10), the three parties gradually converge into a virtuous cycle and reach a stable state.
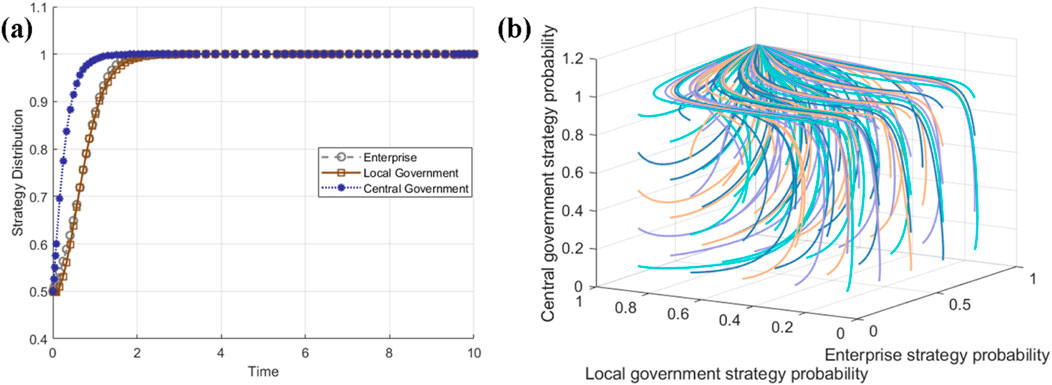
Figure 10. (1, 1, 1) Numerical simulation process ((a), (b) correspond to 2D, 3Dgraph).
Furthermore, under the equilibrium parameter conditions, although varying the initial strategy probabilities of the three subjects (from 0.1 to 0.9, Figure 10b) alters the evolutionary simulation paths and speeds, the outcome remains consistent. This confirms that the stable behavioral strategy selection is significantly determined by parameter values: when parameters meet the evolutionary stability conditions, the initial strategy probabilities of subjects have a relatively minor impact on the evolutionary equilibrium of the vertical governance system.
3.3.4 Dynamic rewards and punishments analysis
Dynamic reward-punishment simulations were conducted by treating penalty
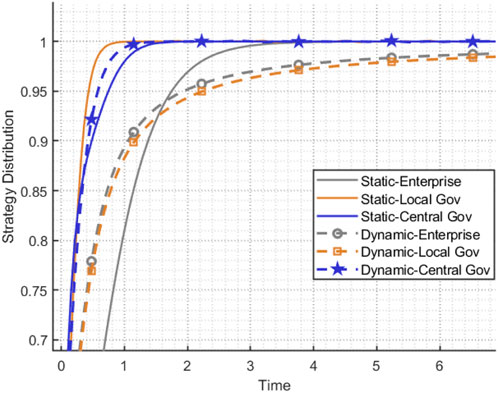
Figure 11. Dynamic rewards and punishments.
3.3.5 Parameter sensitivity analysis
This section conducts a sensitivity analysis of partial model parameters from the enterprise perspective. In practical research, some parameters lack practical significance after initial setting when adjusted, or their value ranges are restricted, making in-depth exploration difficult. Therefore, the analysis focuses on key parameters. As shown in Figure 12, the penalty intensity
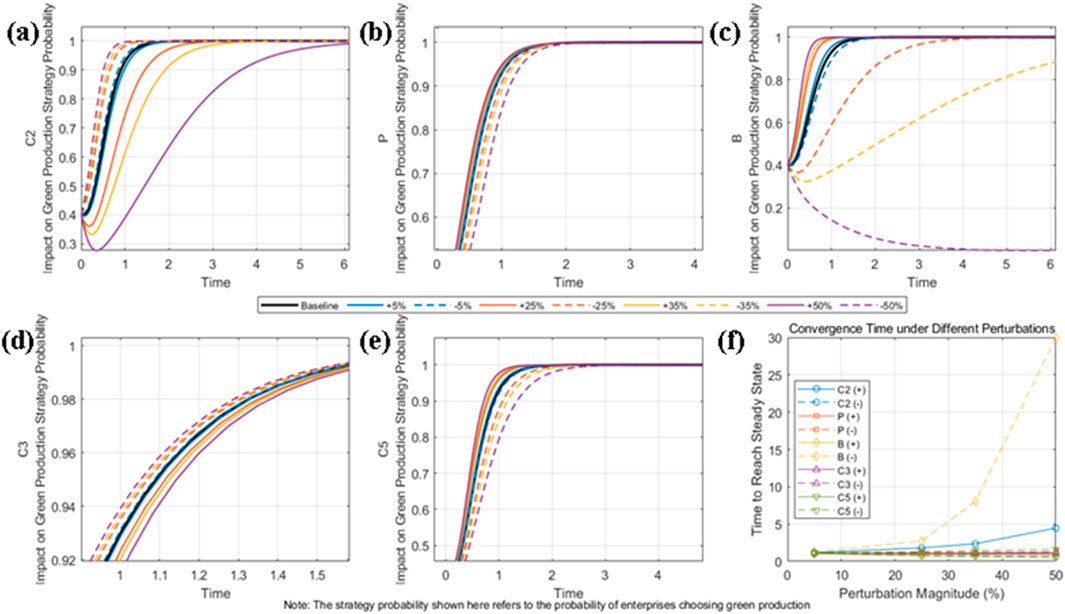
Figure 12. Multi - parameter sensitivity analysis. (a–e) show the sensitivity trends of different key factors on the impact of green production strategy probability over time; (f) presents the convergence time to reach a steady state under different perturbation magnitudes.
Further observation on the impact of high environmental taxes reveals that when the environmental tax rate is at a low level, enterprises will persistently choose non-green production strategies (even when facing fines). Under other fluctuation scenarios, the interference pattern of tax rates on strategy convergence is like that of costs. In Figure 12, under fluctuation amplitudes of 5%, 25%, 35%, and 50%: negative fluctuations in
3.3.6 Model robustness analysis
In the previous section, perturbations were added to the parameter range to verify parameter sensitivity. In this section, Gaussian white noise (
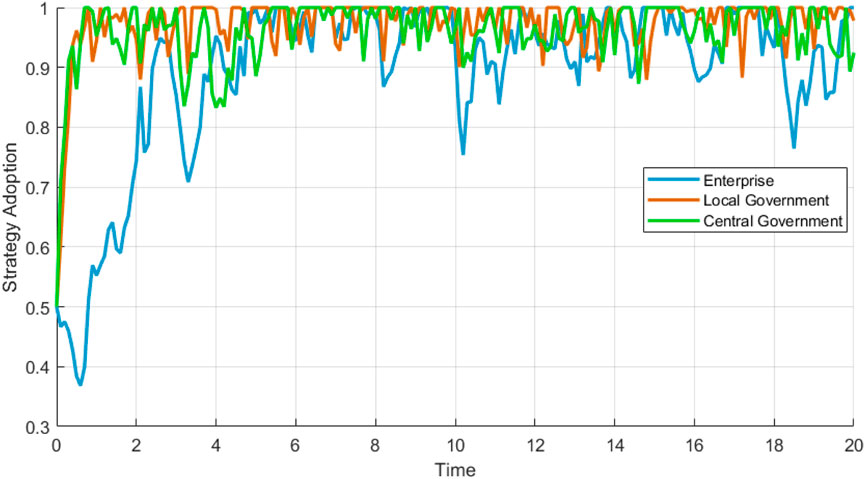
Figure 13. Stochastic evolutionary model.
Meanwhile, a comparison of the average convergence times from 500 experiments under different noise levels was carried out. Considering that the stochastic evolutionary model only attains dynamic equilibrium within a certain range, a convergence threshold of 0.99 was set, and the model was deemed to have converged once this threshold was reached for the first time. By observing Figure 14a, it is evident that the average convergence time of enterprises is significantly longer than that of the other two subjects, which verifies the previous analysis results. However, it is observed that when the noise impact is relatively strong, the overall convergence is relatively faster. This phenomenon seems counterintuitive: Theoretically, strong noise will increase the strategic fluctuations of subjects, requiring more time to explore optimal strategies and balance probabilities. Nevertheless, as the noise intensity in this study ranges from 10% to 30% of the green production cost
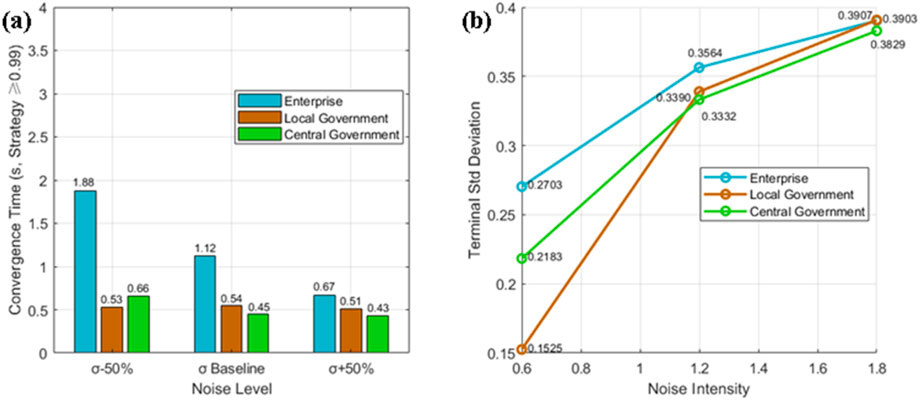
Figure 14. Convergence time and terminal standard deviation. (a) Convergence time under different noise levels; (b) Terminal standard deviation with varying noise intensity, both for enterprise, local government, and central government.
Comprehensively analyzing the overall stochastic evolutionary game model, along with the changes in convergence time and the fluctuation situation, it is concluded that the overall robustness of the model is favorable. The strategy evolution paths of the two government subjects are relatively stable, while the strategy probability of the enterprise subject is more significantly affected by the environment (such as noise and payoff), and its stability is somewhat poorer. If one intends to test the limit of the model’s robustness, one can increase the noise intensity or switch to other perturbation methods.
3.3.7 Overall analysis of evolutionary game
Zhao et al. (2022) explored the evolution of the macro-level resource-economy-environment coupling system from a multi-dimensional perspective through simulation analysis, identifying macro critical factors such as resource and environmental carrying capacity and differentiated ecological constraint policies that influence ecological conservation and high-quality development of the composite system. Similarly, Cui et al. (2020) found that increasing pollution compensation and reducing regulatory costs can promote the development of a sustainable green financial system. From the perspective of vertical governance system, this section presents findings that align with the above studies while being more closely tailored to the context of vertical governance.
Among the three strategies that may reach the equilibrium point, only (1,1,1) can facilitate ecological co-governance, and ensure the normal operation of the vertical co-governance system when parameters are satisfied. After comparing static and dynamic rewards and punishments, conducting a sensitivity analysis of parameter value fluctuations ranging from 5% to 50%, and simulating a stochastic evolutionary game model with Gaussian white noise, it was found that among the three subjects, the enterprise is the one most affected by the environment and has the slowest convergence speed. This is consistent with the decision-making logic of enterprises in reality that takes profits and survival as the premise. Their strategies are prone to fluctuations due to external interference, and the key parameters
To enhance the effectiveness of the YRB’s vertical ecological governance system, the central government should appropriately increase penalties for local government inaction; local governments should raise the comprehensive tax rate (including environmental protection tax rates) and provide substantial subsidies to enterprises adopting environment-friendly production. These measures will promote the healthy development of the entire governance system and strengthen ecological co-governance effects.
3.4 Analysis of the core driving layer
The core driving layer contains two obstructive factors deeply rooted in the YRB context: divergent governance concepts and regional interest conflicts between its nine provinces. These factors operate at a foundational level, exerting cascading impacts on intermediate barriers such as policy misalignment and fragmented regulation across the basin. Whether at the national level or in the refined co-governance of the Yangtze River Basin and YRB, there exist deficiencies in trust, competitive mentality, and collective action dilemmas. These issues indirectly reflect the reality of divergent governance concepts and regional interest conflicts as two parallel core obstacles (Liu and Ma, 2024; Xia et al., 2024).
Differences in governance concepts manifest starkly across the YRB’s ecological and economic gradients. For instance, upstream provinces like Qinghai and Gansu—where fragile alpine ecosystems and headwater protection are paramount—prioritize strict ecological preservation, often advocating for restricted industrial development to safeguard water quality and biodiversity. In contrast, downstream regions such as Shandong and Henan, which host dense populations and industrial hubs (e.g., Zhengzhou’s manufacturing sector and Shandong’s coastal industries), tend to balance ecological goals with economic growth, emphasizing green industrial transition over absolute protection (Liu and Yuan, 2023; Li and Wu, 2022; Nie and Lee, 2023). This divide leads to inconsistent implementation of basin-wide policies: upstream provinces may resist infrastructure projects proposed by downstream regions, while downstream areas often delay investments in upstream ecological compensation.
Regional interest conflicts in the YRB are exacerbated by its uneven resource distribution and economic disparities. The basin’s upstream regions control 60% of the Yellow River’s water resources but contribute only 15% of the basin’s GDP, creating a “protection-development paradox”: upstream efforts to reduce pollution and conserve water directly benefit downstream regions but constrain local economic growth. These conflicts are further amplified by unequal negotiation power—economically stronger provinces like Shandong often secure favorable water quotas, leaving less developed regions like Gansu and Ningxia with unmet ecological protection needs.
The root causes of these core barriers are deeply embedded in the YRB’s historical and economic fabric. Upstream provinces with large ethnic minority populations (e.g., Qinghai) have traditional livelihoods tied to pastoralism and low-impact agriculture, fostering a cultural emphasis on ecological harmony. In contrast, coal-rich regions like Shanxi and Shaanxi have long relied on resource extraction, shaping a governance culture focused on short-term economic gains. Addressing these core barriers requires YRB-specific solutions, such as establishing a trans-provincial ecological compensation fund (modeled on the Yangtze River’s pilot program but tailored to the Yellow River’s water scarcity) and creating a basin-wide coordination committee with rotating leadership to balance upstream and downstream voices. Additionally, aligning governance concepts could involve cross-provincial training programs, for example, pairing officials from Qinghai’s environmental agencies with their counterparts in Shandong to share best practices in balancing protection and development.
3.5 Comparative discussion on international governance frameworks
The core challenges in ecological co-governance of the YRB share significant commonalities (Table 14) with those addressed by the European Union Water Framework Directive (EU WFD) and Australia’s Murray-Darling Basin (MDB). Odume et al. (2022) identified ambiguous departmental responsibilities, prioritization of short-term economic agendas over long-term ecological goals, and overly centralized governance as key drivers of river ecosystem degradation; their proposed strategies—such as “strengthening science-policy-practice interactions and “promoting polycentric governance”, align closely with imperatives to break administrative barriers and improve cross-regional coordination mechanisms, mirroring the shared focus on “ecological primacy” within the EU WFD. Like the EU WFD (EC, 2000; EC, 2001), the YRB faces cross-administrative collaboration dilemmas, the former balancing interprovincial interests and the latter reconciling transnational ones-yet the approach of the EU WFD, which involves dynamic coordination through decennial “river basin management plans” and mandated stakeholder participation,offers direct insights for mitigating in the YRB; the polluter pays principle within the MDB, which internalizes ecological costs via economic levers, further informs optimization of benefit compensation mechanisms to resolve the upstream “protection-development paradox”.
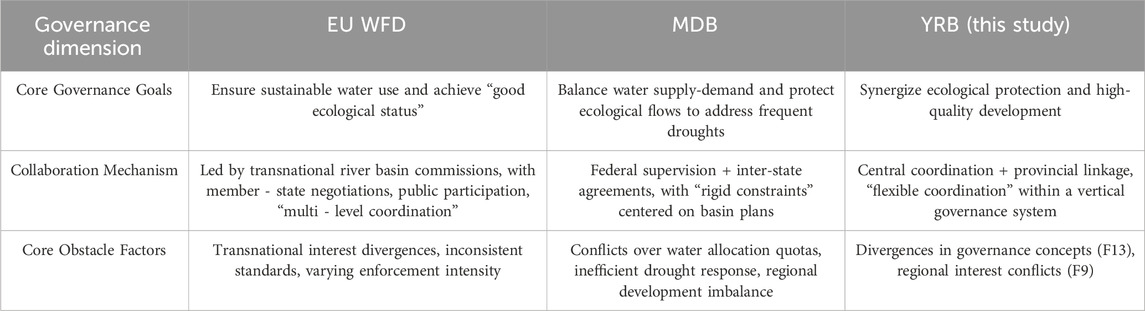
Table 14. Comparison of Key Dimensions of Ecological governance.
Pressures of water scarcity and industrial-agricultural water conflicts in the YRB align more closely with the geographical context of the MDB—both are agricultural cores plagued by chronic drought and tensions between upstream protection and downstream development. The use of water rights trading by the MDB to clarify allocation quotas and market-based tools to reduce regional conflicts provides critical lessons for alleviating “regional interest conflicts (F9)”; the drought emergency response mechanisms of the MDB, demonstrating robust coordination during crises, also serve as a model for addressing climate-induced water variability and enhancing dynamic coordination feasibility (MDBA, 2012a; MDBA, 2012b; Murray-Darling Basin Authority, 2012a; Murray-Darling Basin Authority, 2012b). This aligns with cross-basin comparative study (Bouckaert et al., 2022), which highlights the MDB focuses on biodiversity, the YRB emphasizes water demand and coordination. With insights from France and Brazil, it resonates with the three-layer driving chain framework of this study. While the core barrier of “divergent governance philosophies (F13)” is globally universal, the goal of the YRB to “synergize ecological protection and high-quality development” integrates developing-country transitional characteristics and national strategic imperatives, necessitating retention of centralized institutional strengths when adapting the periodic planning of the EU and the water rights trading experiences of the MDB.
The governance context of the YRB is uniquely irreplicable: as the world’s most sediment-laden river, its ecological restoration challenges far exceed those of basins under the EU WFD and the MDB; spanning China’s eastern, central, and western regions (with a fourfold gap in per capita GDP), developmental disparities exacerbate divergent governance philosophies; as a nationally strategic basin, it bears overlapping mandates of ecological, food, and energy security, rendering its governance complexity unparalleled globally. The three-layer driving chain identifies ideological consensus (core layer) as foundational, stakeholder behavioral synergy (intermediate layer) as critical, and tool implementation (apparent layer) as a safeguard,a framework that avoids the vicious cycle of ideological divergence-behavioral conflict-policy failure. Targeted policies for upstream (pollution control), midstream (industrial transformation), and downstream (ecological compensation) based on regional endowments further offer universal value for basins with “pronounced natural-economic gradients,” circumventing inefficiencies of one-size-fits-all policies (Gou and Liu, 2024; Zhou et al., 2024). Additionally, the integration by the framework of rigid administrative assessments and flexible ecological compensation outperforms the legal reliance of the EU WFD and the market-centric approach of the MDB in developing contexts. Administrative leverage can rapidly establish coordination foundations amid institutional and market immaturity, with gradual market integration providing transitional solutions for basins such as the Amazon, Mekong, Ganges, and Nile.
This three-layer driving chain theory and governance framework align closely with international best practices (Table 14), comprehensively identifying governance barriers while acknowledging limitations, including its current theoretical rather than implementable status. The emphasis by the EU WFD on NGO roles, coupled with the findings of Baudoin and Gittins (2021) that enhanced NGO participation reduces point-source pollution, this highlight gaps in exploration of NGOs’ specific functions; future research should deepen analysis of NGO engagement pathways in the YRB context and examine operational logics of the EU WFD and the MDB. In conclusion, the three-layer driving chain framework for the YRB both validates global basin governance commonalities and uniquely addresses “multi-objective synergy in complex contexts.” Its insights confirm no universally applicable governance model, but the principles of “hierarchical coordination”, “flexibility-rigidity integration”,and “contextual adaptation” offer cross-regional, cross-institutional references for global basin governance while informing localized progress through international experiences.
4 Conclusion and suggestions
4.1 Conclusion
This study adopts a three-layer driving chain framework and analyzes the obstacles to ecological co-governance in the YRB and their interactions by two systems: horizontal cross-regional collaborative governance and vertical multi-subject collaborative governance. Firstly, From 2014 to 2023, the average EGI showed an increasing trend year by year, and the ecological differences among regions gradually decreased. According to Moran’s I index and the modified gravitational value, it can be found that from a weak negative correlation (
After constructing a tripartite evolutionary game model involving enterprises, local and the central government (the strategy combination includes 8 pure strategies and 1 hybrid strategy), and through the stability analysis of the equilibrium point, numerical simulation, comparison of static and dynamic rewards and punishments, sensitivity analysis of parameter fluctuations ranging from 5% to 50%, and random evolutionary game simulation introducing Gaussian white noise, it was found that When all three adopt active strategies (1,1,1), enterprises choose environmentally friendly production, local governments strengthen supervision, and the central government conducts strict inspections, the system can achieve ESS and meet the expectations of co-governance. Currently, the core parameters need to satisfy
In terms of theoretical analysis, the fundamental obstacles of the core driving layer focus on the differences in governance concepts and regional interest conflicts, which constitute the underlying constraints of ecological co-governance. The differences in governance concepts are reflected in the differentiation of the priority cognition of ecological protection and economic development within the basin, which directly affects the consistency of policy goals and the coordination of implementation. Regional interest conflicts stem from the imbalance between the resource allocation pattern and development demands, leading to the existence of interest games and mismatches of rights and responsibilities in cross-regional collaboration. These two factors, through hierarchical transmission, interact with the strategies of the middle-level subjects and the implementation effects of the apparent tools, becoming the deep-seated root cause that hinders co-governance.
The framework of this study shares commonalities with EU WFD and MDB in core governance goals such as cross-regional interest coordination and multi-subject collaboration, and all face the challenges of balancing protection and development and resolving regional differences. The dynamic programming mechanism and public participation system of the EU WFD, as well as the market-oriented water rights trading and emergency response system of the MDB, provide references for optimizing interest coordination and enhancing governance flexibility. The centralized governance advantages of the YRB and the systematic analysis framework of the “three-layer driving chain” also provide ideas for handling complex multi-objective collaborative issues in international river basin governance. The three parties need to learn from each other in terms of the construction of consensus on concepts, the flexibility of mechanisms and the coordination of systems, to promote the optimization and popularization of the basin governance model.
4.2 Research limitations
This study has the following limitations:
1. At the research method level, the construction of the DEMATEL scoring matrix only relies on the discussion results of 5 experts and is limited by the initially designed scoring rules, making it impossible to conduct statistical verifications such as reliability and validity. This may have a potential impact on the objectivity of the research process and the universality of the conclusion.
2. The practical applicability of the theoretical framework remains to be tested. The three-layer driving chain research and governance framework proposed in this paper, although covering the complete content of ecosystem governance and logically capable of systematically analyzing the obstacle factors of ecological co-governance in the YRB, still remains at the theoretical deduction stage and has not yet been verified through practical application.
3. The depth of some research contents is still insufficient. Although the research has integrated macro and micro theories as well as various analytical methods, striving to comprehensively and systematically dissect governance obstacles, the exploration and model details in some specific fields are still relatively thin. For instance, the role positioning and participation paths of non-governmental organizations (NGOs) in ecological co-governance have not been fully analyzed, and the depth of research in related directions needs to be further strengthened.
4.3 Suggestions
Based on these findings, the study proposes the following recommendations:
1. Core Driving Layer Recommendations:
The central government should develop a unified ecological governance framework, clarify the rights and responsibilities of upstream, midstream, and downstream regions in ecological protection and development, and ensure consistent governance concepts across the basin. It is necessary to establish cross-regional coordination mechanisms and information-sharing platforms to enhance communication and trust among provinces, for instance, by regularly organizing joint conferences on basin governance to align strategic goals. Drawing on the EU Water Framework Directive’s (EU WFD) experience of “decennial river basin management plans” and public participation mechanisms, it is necessary to establish cross-regional coordination committees with rotating leadership—comprising representatives from all nine provinces—to balance upstream protection demands and downstream development needs through regular consultations. Additionally, learn from Australia’s Murray-Darling Basin (MDB) water rights trading system to explore market-oriented tools such as ecological water quota trading, which can alleviate regional interest conflicts by quantifying the economic value of ecological protection. An inter-provincial ecological compensation fund should be established, with standards dynamically adjusted based on water resource contributions and pollution control efforts, ensuring that upstream regions’ protection costs are reasonably compensated by downstream beneficiaries, thereby addressing the “protection-development paradox” at the root.
2. Intermediate Layer Recommendations-Vertical governance system
Strengthening the alignment between local policies and basin-wide strategies to maintain consistency in implementation—specifically, local governments should incorporate basin ecological goals into their development plans and establish a mechanism for regular assessment and adjustment of policy synergies. Clarify the vertical collaborative governance responsibilities between central and local governments: the central government could focus on formulating unified environmental standards and supervision mechanisms, while local governments implement targeted measures based on regional characteristics. Incorporate ecological governance outcomes, such as cross-border pollution reduction and water resource conservation, into local government performance evaluations, with incentives for provinces achieving collaborative goals and accountability for those failing to meet standards. For enterprises, local governments should improve the green production incentive system, such as increasing subsidies for environmentally friendly technologies and imposing differentiated environmental taxes based on pollution levels, to guide enterprises toward active participation in co-governance.
3. Apparent Layer Recommendations-Horizontal governance system
Accelerate the digital transformation of ecological governance in the YRB by building a unified big data platform integrating water quality monitoring, pollution sources, and resource allocation, to realize real-time data sharing and intelligent early warning among provinces. Promote the green transformation of industrial structures: upstream regions could develop eco-tourism and green agriculture, while midstream and downstream regions focus on upgrading high-pollution industries and fostering emerging green sectors, supported by preferential policies such as tax breaks for green enterprises and low-interest loans for technological upgrading. Enhance cross-regional policy coordination and improve interest compensation mechanisms—for example, using fiscal subsidies to support upstream ecological restoration and establishing a trans-provincial carbon trading market to internalize environmental costs. Strengthening public participation by expanding channels such as online supervision platforms and community environmental initiatives, and encourage social organizations to participate in governance through project funding. Increase investment in scientific research to support green technology innovation, particularly in water-saving irrigation, sewage treatment, and renewable energy, while promoting regional cooperation in technology diffusion to bridge the innovation gap between upstream and downstream regions.
Data availability statement
The data analyzed in this study is subject to the following licenses/restrictions: Data may involve personal privacy, business secrets or legally binding confidentiality agreements. Disclosing such data may violate relevant laws or agreements. Requests to access these datasets should be directed to JH.
Author contributions
JL: Conceptualization, Software, Resources, Writing – review and editing, Formal Analysis. JH: Visualization, Validation, Software, Writing – original draft, Writing – review and editing. Data curation, Methodology. LS: Project administration, Funding acquisition, Formal Analysis, Supervision, Writing – review and editing. WH: Writing – original draft, Software, Investigation.
Funding
The author(s) declare that financial support was received for the research and/or publication of this article. This work was supported by the Henan Province Key Research and Development and Promotion Special Fund (Science and Technology Attack) (242102320257), China, and the Henan Provincial Philosophy and Social Sciences Planning Annual Project (2023BSH014), China.
Acknowledgments
We express our gratitude to all who participated in this study as well as to the editors and reviewers.
Conflict of interest
The authors declare that the research was conducted in the absence of any commercial or financial relationships that could be construed as a potential conflict of interest.
The reviewer KF declared a shared affiliation with the authors to the handling editor at the time of review.
Generative AI statement
The author(s) declare that no Generative AI was used in the creation of this manuscript.
Any alternative text (alt text) provided alongside figures in this article has been generated by Frontiers with the support of artificial intelligence and reasonable efforts have been made to ensure accuracy, including review by the authors wherever possible. If you identify any issues, please contact us.
Publisher’s note
All claims expressed in this article are solely those of the authors and do not necessarily represent those of their affiliated organizations, or those of the publisher, the editors and the reviewers. Any product that may be evaluated in this article, or claim that may be made by its manufacturer, is not guaranteed or endorsed by the publisher.
References
Baudoin, L., and Gittins, J. R. (2021). The ecological outcomes of collaborative governance in large river basins: who is in the room and does it matter? J. Environ. Manag. 281, 111836. doi:10.1016/j.jenvman.2020.111836
Bodin, Ö. (2017). Collaborative environmental governance: achieving collective action in social-ecological systems. Science, 357(6352), eaan1114. doi:10.1126/science.aan1114
Bouckaert, F. W., Wei, Y. P., Pittock, J., Vasconcelos, V., and Ison, R. (2022). River basin governance enabling pathways for sustainable management: a comparative study between Australia, Brazil, China and France. Ambio 51 (8), 1871–1888. doi:10.1007/s13280-021-01699-4
Cai, Z., Yang, X., Lin, H., Yang, X., and Jiang, P. (2022). Study on the Co-benefits of air pollution control and carbon reduction in the Yellow River Basin: an assessment based on a spatial econometric model. Int. J. Environ. Res. Public Health 19 (8), 4537. doi:10.3390/ijerph19084537
Cao, F., Zhang, L., Wu, W., Han, S., Wu, Z., and Wu, Y. (2024). Challenging the nexus of power: the gaming dilemma of collaboration between government and enterprises in environmental management. Heliyon 10 (1), e23472. doi:10.1016/j.heliyon.2023.e23472
Chen, M., Wang, Q., Bai, Z., Shi, Z., Meng, P., and Hao, M. (2022). Green land use efficiency and influencing factors of resource-based cities in the Yellow River Basin under carbon emission constraints. Buildings 12 (5), 551. doi:10.3390/buildings12050551
Chen, Y., Su, X., and Zhou, Q. (2022). Spatial differentiation and influencing factors of the green development of cities along the Yellow River Basin. Discrete Dyn. Nat. Soc. 2022, 9185108. doi:10.1155/2022/9185108
Cui, H. R., Wang, R. Y., and Wang, H. R. (2020). An evolutionary analysis of green finance sustainability based on multi-agent game. J. Clean. Prod. 269, Article 121799. doi:10.1016/j.jclepro.2020.121799
Dewinter, M., Vandeviver, C., Dau, P. M., Vander Beken, T., and Witlox, F. (2022). Hot spots and burning times: a spatiotemporal analysis of calls for service to establish police demand. Appl. Geogr. 143, 102712. doi:10.1016/j.apgeog.2022.102712
Dong, F., Shi, M., and Li, W. (2024). Research on ecological protection mechanisms in watersheds based on evolutionary games-inter-provincial and intra-provincial perspectives. Water Resour. Manag. 38 (7), 2377–2397. doi:10.1007/s11269-024-03773-4
Du, Y. W., and Li, X. X. (2022). Critical factor identification of marine ranching ecological security with hierarchical DEMATEL. Mar. Policy 138, Article 104982. doi:10.1016/j.marpol.2022.104982
EC (2000). Directive 2000/60/EC of the European Parliament and of the Council of 23 October 20000 establishing a framework for community action in the field of water policy, 72. Brussels: EC.
EC (2001). Common implementation strategy for the water framework directive (2000/60/EC). Strategic document as agreed by the water directors under Swedish presidency 2 may 2001. Brussels: EC.
Geng, W. L., Li, Y. Y., Zhang, P. Y., Yang, D., Jing, W. L., and Rong, T. Q. (2022). Analyzing spatio-temporal changes and trade-offs/synergies among ecosystem services in the Yellow River Basin, China. Ecol. Indic. 138, 108825. doi:10.1016/j.ecolind.2022.108825
Gou, K. Y., and Liu, Y. (2024). The hidden mechanism under the policies: governance logic and network of the collaborative governance of air pollution control in the CCEC, China. Environ. Dev. Sustain. doi:10.1007/s10668-024-04871-4
Han, D., Diao, Y., Wang, X., Ding, Y., and Wang, H. (2023). Research on the dynamic evolution and convergence of collaborative capacity of pollution control and carbon reduction: from the perspective of whole-process governance. Environ. Sci. Pollut. Res. Int. 30 (46), 103179–103197. doi:10.1007/s11356-023-29272-4
Jiang, X. H., and Zheng, W. Q. (2024). Dynamic strategies for collaborative governance of rural environments: a simulation study on the most effective mechanisms. Environ. Dev. Sustain. doi:10.1007/s10668-024-05335-5
Jiang, Z., Feng, Y., Song, J., Song, C., Zhao, X., and Zhang, C. (2023). Study on the spatial–temporal pattern evolution and carbon emission reduction effect of industry–city integration in the Yellow River Basin. Sustainability 15 (6), 4805. doi:10.3390/su15064805
Li, C. X., and Wu, J. Y. (2022). Land use transformation and eco-environmental effects based on production-living-ecological spatial synergy: evidence from Shaanxi Province, China. Environ. Sci. Pollut. Res. 29 (27), 41492–41504. doi:10.1007/s11356-022-18777-z
Li, D., Liang, D., Li, T., and Chen, S. (2022). Ecological-economic coordination in the Yellow River basin: spatial and temporal evolution and driving mechanisms. Environ. Dev. Sustain. 26 (2), 3819–3848. doi:10.1007/s10668-022-02859-6
Li, Q., Liu, J., and An, S. (2024). Research on the central-local environmental co-governance mechanism based on the central inspection. Environ. Dev. Sustain. doi:10.1007/s10668-024-05232-x
Liu, K., and Ma, F. (2024). The impact of the digital economy on environmental pollution: a perspective on collaborative governance between government and Public. Front. Environ. Sci. 12, 1435714. doi:10.3389/fenvs.2024.1435714
Liu, Y., and Yuan, L. (2023). Study on the influencing factors and profitability of horizontal ecological compensation mechanism in Yellow River Basin of China. Environ. Sci. Pollut. Res. 30 (37), 87353–87367. doi:10.1007/s11356-023-28243-z
Lou, X., Zhu, Z., and Liang, J. (2022). The evolution game analysis of platform ecological collaborative governance considering collaborative cultural context. Sustainability 14 (22), 14935. doi:10.3390/su142214935
Lu, C., and Feng, Q. (2024). The influence of green technology innovation on industrial ecology at the Yellow River Basin in China. Resour. Conservation Recycl. 206, 107649. doi:10.1016/j.resconrec.2024.107649
Lu, Y., Fan, L., and Zhai, L. (2022). Evolutionary game analysis of inter-provincial diversified ecological compensation collaborative governance. Water Resour. Manag. 37 (1), 341–357. doi:10.1007/s11269-022-03375-y
MDBA (2012a). Basin plan. Available online at: www.mdba.gov.au/basin-plan.
MDBA (2012b). Addendum to the proposed groundwater baseline and sustainable diversion limits: methods report. Canberra, 41.
Murray - Darling Basin Authority (2025a). Basin plan evaluation – publications and information. Available online at: www.mdba.gov.au/publications-and-data/publications.
Murray - Darling Basin Authority (2025b). 2025 sustainable rivers audit – reports and data. Available online at: www.mdba.gov.au/publications-and-data/publications.
Nie, C. F., and Lee, C. C. (2023). Synergy of pollution control and carbon reduction in China: spatial-temporal characteristics, regional differences, and convergence. Environ. Impact Assess. Rev. 101, 107110. doi:10.1016/j.eiar.2023.107110
Nie, L., Bao, X. L., Song, S. F., and Wu, Z. F. (2024). The impact of the digital economy on total-factor carbon emission efficiency in the Yellow River Basin from the perspectives of mediating and moderating roles. Systems 12 (3), 99. doi:10.3390/systems12030099
Odume, O. N., Onyima, B. N., Nnadozie, C. F., Omovoh, G. O., Mmachaka, T., Omovoh, B. O., et al. (2022). Governance and institutional drivers of ecological degradation in urban river ecosystems: insights from case studies in african cities. Sustainability 14 (21), 14147. doi:10.3390/su142114147
Peng, K., Dong, C., and Mi, J. (2024). Dynamic research on the collaborative governance in urban and rural black-odorous water: a tripartite stochastic evolutionary game perspective. Systems 12 (8), 307. doi:10.3390/systems12080307
Shi, L., Cai, Z., Ding, X., Di, R., and Xiao, Q. (2020). What factors affect the level of green urbanization in the Yellow River Basin in the context of new-type urbanization? Sustainability 12 (6), 2488. doi:10.3390/su12062488
Sun, T., Luo, Y., and Zhang, Z. (2023). Collaborative governance of air pollution caused by energy consumption in the Yangtze River delta urban agglomeration under low-carbon constraints: efficiency measurement and spatial empirical testing. Water, Air, and Soil Pollut. 234 (9), 566. doi:10.1007/s11270-023-06579-z
Wang, L., Gong, W., Wang, C., and Li, W. (2023). Spatial-temporal evolution and influencing factors of urban ecosystem resilience in the Yellow River Basin. Glob. NEST J. 25 (1), 66–76. doi:10.30955/gnj.004500
Xia, Y., Tian, Z., and Ding, C. (2024). Collaborative governance in action: driving ecological sustainability in the Yangtze River basin. Front. Environ. Sci. 12, 1463179. doi:10.3389/fenvs.2024.1463179
Xu, R., Wang, Y., Wang, W., and Ding, Y. (2018). Evolutionary game analysis for third-party governance of environmental pollution. J. Ambient Intell. Humaniz. Comput. 10 (8), 3143–3154. doi:10.1007/s12652-018-1034-6
Xu, M., Luan, S., Gao, X., and Wang, H. (2024). Spatiotemporal evolution, spatial agglomeration and convergence of environmental governance in China—a comparative analysis based on a basin perspective. Land 13 (2), 231. doi:10.3390/land13020231
Xu, S. T., Dong, M. Y., and Chen, X. (2024). Information transparency of government environmental supervision and corporate green innovation in Chinese highly polluting sectors. Environ. Dev. Sustain. doi:10.1007/s10668-024-05701-3
Yang, Z., Cui, X., Dong, Y., Guan, J., Wang, J., Xi, Z., et al. (2024). Spatio-temporal heterogeneity and influencing factors in the synergistic enhancement of urban ecological resilience: evidence from the Yellow River Basin of China. Appl. Geogr. 173, 103459. doi:10.1016/j.apgeog.2024.103459
Zhang, X. H., Tang, Z., and Luo, W. (2024). Research on the synergistic evolution of comprehensive transportation network system in the Yellow River Basin aimed at high-quality development. Systems 12 (9), 340. doi:10.3390/systems12090340
Zhao, A. W., Wang, J. Y., Sun, Z. Z., and Guan, H. J. (2022). Research on the evolutionary path of eco-conservation and high-quality development in the Yellow River Basin based on an agent-based model. Systems 10 (4), 105. doi:10.3390/systems10040105
Zhao, H., Xu, X., Tang, J., Wang, Z., and Miao, C. (2023). Spatial pattern evolution and prediction scenario of habitat quality in typical fragile ecological region, China: a case study of the Yellow River floodplain area. Heliyon 9 (3), Article e14430. doi:10.1016/j.heliyon.2023.e14430
Zhou, W., Lyu, Z., and Chen, S. X. (2024). Mechanisms influencing the digital transformation performance of local governments: evidence from China. Systems 12 (1), 30. doi:10.3390/systems12010030
Zhu, J. P., Wu, S. H., and Xu, J. B. (2023). Synergy between pollution control and carbon reduction: China's evidence. Energy Econ. 119, 106541. doi:10.1016/j.eneco.2023.106541
Keywords: collaborative governance, three-layer drive chain, spatiotemporal analysis, spatial lag model, evolutionary game model
Citation: Liu J, Hao J, Su L and Hua W (2025) Analysis of obstacle factors in the collaborative governance of the ecological environment in the yellow river basin. Front. Environ. Sci. 13:1637509. doi: 10.3389/fenvs.2025.1637509
Received: 29 May 2025; Accepted: 17 September 2025;
Published: 02 October 2025.
Edited by:
Narongsak Sukma, King Mongkut’s University of Technology North Bangkok, ThailandReviewed by:
Duminda Senevirathna, Uva Wellassa University, Sri LankaPeng Du, Liaoning Normal University, China
Kai Feng, North China University of Water Conservancy and Electric Power, China
Copyright © 2025 Liu, Hao, Su and Hua. This is an open-access article distributed under the terms of the Creative Commons Attribution License (CC BY). The use, distribution or reproduction in other forums is permitted, provided the original author(s) and the copyright owner(s) are credited and that the original publication in this journal is cited, in accordance with accepted academic practice. No use, distribution or reproduction is permitted which does not comply with these terms.
*Correspondence: Jixiang Hao, aGFvaml4aWFuZzc3QDE2My5jb20=