 Jianfang Wang1
 Guangming Yang
- 1School of Economics and Management, Honghe University, Mengzi, Yunnan, China
- 2School of Management, Chongqing University of Technology, Chongqing, China
- 3Research Center for Ecological Security and Green Development, Chongqing Academy of Social Sciences, Chongqing, China
- 4School of Management and Economics, Kunming University of Science and Technology, Kunming, China
- 5School of Marxism, Yunnan Minzu University, Kunming, Yunnan, China
Improving the utilization efficiency of agricultural water resources constitutes one of the effective approaches to addressing the current issue of water resource scarcity. This study, from the perspective of water resource pollution severity, integrates the DPSIRM model with the Slacks-Based Measure (SBM) method, thereby constructing a novel DPSIRM-SBM model to measure and analyze the agricultural water resource utilization efficiency across 31 provinces in China. Furthermore, it employs Moran’s Index and standard deviational ellipse analysis to investigate the spatiotemporal distribution patterns. The findings are as follows: (1) From 2007 to 2021, the agricultural water resource utilization efficiency in China generally maintained a stable development trend, fluctuating around 0.8; (2) The spatiotemporal distribution of agricultural water resource utilization efficiency among provinces and municipalities exhibited non-agglomerative and imbalanced characteristics, with significant spatial disparities and weak interregional radiation effects; (3) From a spatial distribution standpoint, the agricultural gray water footprint demonstrated a pattern of “high in the west and low in the east,” accompanied by agglomeration effects; (4) From a regional perspective, the eastern region outperformed the central and western regions, with the central region exhibiting pronounced efficiency fluctuations and the western region persistently displaying low efficiency. The study’s results suggest that enhancing the agricultural water resource utilization efficiency in China necessitates intensifying efforts in water pollution control, breaking path dependencies through interregional ecological compensation, and strengthening the optimizing role of market-based mechanisms in resource allocation.
1 Introduction
In the 21st century, water resources are confronted with challenges of unsustainability, vulnerability, and chronic scarcity (Srinivasan et al., 2012). Globally, agriculture consumes 80%–90% of all water resources utilized by humans (Mbava et al., 2020). Agricultural water resources serve as a strategic resource maintaining food production and ecological security, and their efficient utilization holds decisive significance for achieving sustainable agricultural development (Sun et al., 2024; He et al., 2021). Scientific and accurate evaluation of water resource utilization efficiency constitutes a crucial foundation for promoting the conservation and efficient use of agricultural water resources and realizing the United Nations’ 2030 Sustainable Development Goals (Shi et al., 2022). Although China ranks sixth globally in total water resources, its per capita water resource availability is merely 25% of the world average, with spatially uneven distribution. In the agricultural sector, water resource utilization is pivotal to the development of agricultural economy and food security (Song et al., 2023), acting as a vital link between ecological security and agricultural safety (Bao et al., 2025). As a major agricultural nation, China’s agricultural water resource efficiency faces dual constraints from carbon emissions and water pollution (Feng et al., 2024), which has become a bottleneck restricting economic development. Therefore, improving agricultural water resource utilization efficiency and achieving coordinated development of dual security has emerged as an administrative priority debated by governments and societal stakeholders in recent years.
Current academic research on water resource utilization efficiency is relatively abundant. In terms of research subjects, studies primarily focus on national, provincial, regional, and urban scales. Research scopes encompass agricultural water resource utilization efficiency, industrial water resource utilization efficiency (Zhao et al., 2024), urban water resource utilization efficiency (Zheng et al., 2024), and comprehensive water resource utilization efficiency (Wang et al., 2024). In terms of measurement methods, the Malmquist index method (Shah et al., 2024) and Data Envelopment Analysis (DEA) (Geng et al., 2019) are commonly used to calculate the efficiency of agricultural water resource utilization. However, their analyses do not include unexpected outputs and fail to consider factors such as efficiency and spatial distribution (Jingxue et al., 2021). On the other hand, the Analytic Hierarchy Process (AHP) (Lu et al., 2022) and Stochastic Frontier Analysis (SFA) (Bai et al., 2024), including DEA, are frequently employed in the analysis of total-factor water resource efficiency. Research dimensions cover spatial heterogeneity (Zhang et al., 2022), influencing factors (Jingxue et al., 2021), policies and technologies (Shah et al., 2023), carbon sequestration and pollution (Zou et al., 2024), and systematic management (Whitney et al., 2025). Although these research results have laid a good foundation for subsequent studies, there are still some limitations. Currently, relatively few studies systematically analyze the temporal and spatial distribution characteristics of agricultural water resource efficiency. Moreover, the undesired outputs involved in the research mainly focus on wastewater discharge, fertilizer loss, pollutant emissions, etc., and the timeliness of relevant data needs to be improved.
This paper focuses on an in-depth study of the temporal and spatial distribution characteristics of agricultural water resource efficiency in China. The DPSIRM (Driving Forces-Pressures-State-Impacts-Responses-Management) framework provides a systematic foundation for multidimensional efficiency analysis through its structured logic encompassing the full causal chain of “Driving Forces - Pressures - State - Impacts - Responses - Management.” This framework extends efficiency analysis beyond mere numerical evaluation of the “State” (S) - which serves as the core efficiency metric assessed by Data Envelopment Analysis (DEA) models - to deeply investigate the underlying formation mechanisms (“why it forms”), consequential effects (“what it leads to”), and intervention strategies (“how to manage”). The six categories of indicators within this framework can be flexibly integrated into DEA models as input/output variables, enabling systematic integration of multidimensional metrics. When combined with spatiotemporal data, it captures dynamic and holistic efficiency characteristics, thereby transcending the limitations of single-dimensional assessments and realizing multidimensional analysis of causal chains and systemic feedback mechanisms in efficiency formation (Shi and Zhou, 2023). By integrating the DPSIRM-SBM (Slacks-Based Measure) model with spatial analytical methods such as spatial autocorrelation and Spatial Durbin Models, this study comprehensively examines the spatiotemporal evolution patterns and characteristics of agricultural water use efficiency in China. It investigates the heterogeneous roles of different provinces in mitigating water pollution while exploring the spatiotemporal distribution dynamics. Based on these analyses, context-specific policy recommendations are formulated to enhance agricultural water use efficiency tailored to regional development realities as shown in Figure 1.
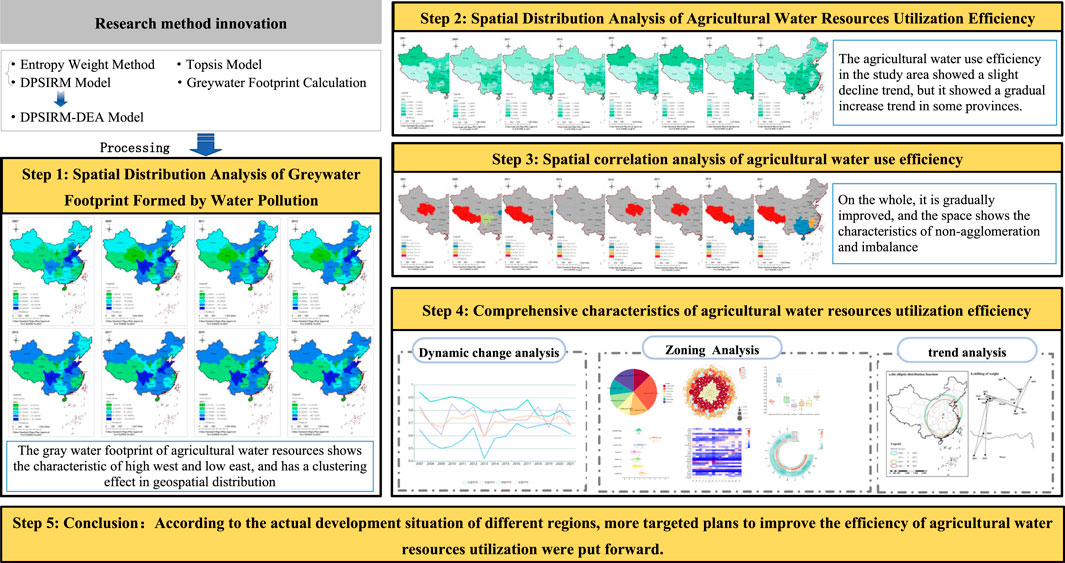
Figure 1. Research idea diagram.
2 Research methods
2.1 Entropy weight method
The entropy weight method is an objective weight-determination method. Its basic function is to determine the objective weight according to the differences of indicators. In this paper, the Entropy Weight Method is used to calculate the weights of indicators. The processing results are used as the initial data for SBM-EDA. The specific calculation steps are as follows:
Among them, Equation 1 is the standardization treatment for positive indicators, and Equation 2 is the standardization treatment for negative indicators.
The formula for calculating the index weights is as follows:
2.2 DPSIRM model
The Organization for Economic Cooperation and Development (OECD) proposed the DPSIR model in 1993. The DPSIRM model adds a management subsystem to the DPSIR model, changing the single directionality of the initial DPSIR model and strengthening the connection between each subsystem to form a causal feedback loop. The new index system constructed using the DPSIRM model includes six parts: the driving force, pressure, state, impact response, and management (Sun et al., 2024), as shown in Figure 2.
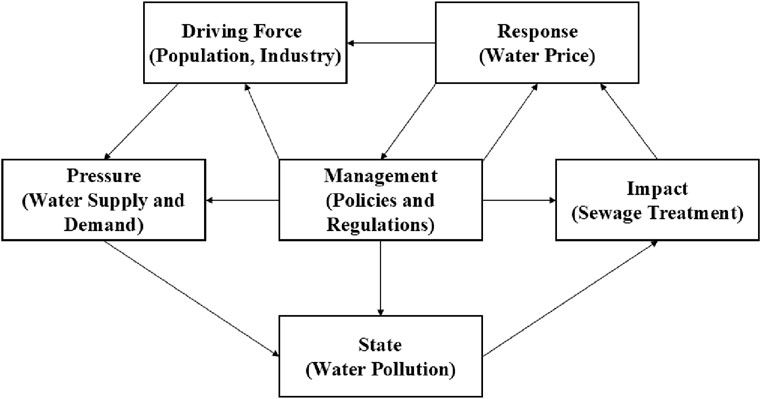
Figure 2. The DPSIRM model.
2.3 DPSIRM-SBM model
Since the Data envelopment analysis (DEA) model was proposed by the American operations research scientist Charnes in 1978, it has been widely used and gradually improved. Tone (2001) proposed a non-radial and non-rectangular SBM model based on slack variables to solve the slack problem between inputs and outputs (Tone, 2001). The DPSIRM-SBM model incorporates inputs, expected outputs, and unexpected outputs into the objective function, solving the impact of slack variables on measurement. The undesirable output Slacks-Based Measure (SBM) model not only addresses the biases introduced by slack variables in conventional Data Envelopment Analysis (DEA) models but also resolves the issue of undesirable outputs, overcoming the limitation of certain methodologies that are only applicable to single-project or technology-specific analyses. Accordingly, this study integrates the DPSIRM conceptual framework with the undesirable output SBM model to construct the DPSIRM-SBM evaluation model. Based on the connotations and attributes of each component within the DPSIRM (Driving Forces-Pressures-State-Impacts-Responses-Management) framework, we designate Driving Forces (D), Pressures (P), and Management (M) as input indicators, while State (S), Impacts (I), and Responses (R) are defined as output indicators. Within the Pressures (P) category, chemical fertilizer usage and urban sewage discharge are treated as undesirable outputs to measure the comprehensive index of tourism ecological security (Yang et al., 2023). Therefore, this study introduces the DPSIRM evaluation framework covering multiple system elements and uses SMB-DEA to solve the problems of unexpected outputs and environmental efficiency measurement (Pan et al., 2020; Yang G. et al., 2025). The mathematical expressions are as follows:
Where,
2.4 Construction of SBM with non-expected inputs
2.4.1 Classical SBM with non-expected outputs
Considering that a large number of previous studies have regarded pollution as a by-product of the production process, this paper first introduces an SBM with non-expected outputs, and then solves the problem of maximizing green production efficiency based on this model. Suppose there are n decision-making units (DMUs) in the production system. Each decision-making unit has three input and output vectors. The input vector
According to the weak disposability hypothesis, the production possibility boundary (PPS) under the condition of constant returns to scale can be defined as:
Based on Equation 11, the assumption of the radial distance function is relaxed, and a classical SBM based on non-radial slack is constructed, which solves the problem of efficiency solution in the case of unbalanced factor allocation. The efficiency solution process of decision-making unit 0 is as follows:
2.4.2 Improved SBM with non-expected inputs
This paper proposes a new SBM based on model (12). The new model takes into account the weak disposability hypothesis of undesired outputs while maintaining the original settings. Assume that each decision-making unit has four input and output vectors: the desired input vector
The efficiency solving process of decision-making unit 0 is shown in Equation 14, where the variables
Thus, we have
Model (15) conforms to the assumption of constant returns to scale. In particular, the model (13) can be extended to the case of variable returns to scale by adding the restriction
2.5 Topsis model
The TOPSIS (Technique for Order Preference by Similarity to an Ideal Solution) method was first proposed by C.L. Hwang and K. Yoon in 1981. This method evaluates the distance between a certain object and the optimal and worst values among all evaluation objects. If the object is close to the optimal value and far from the worst value, it indicates that the evaluation result of this object is the best; otherwise, it is the worst. The TOPSIS evaluation method pays less attention to specific scores and focuses more on the ranking of different objects (Zhao et al., 2023). Its evaluation can be carried out entirely using objective data or can be comprehensively evaluated by adding subjective preferences. This paper uses objective data for analysis. The specific methods are as follows:
(1) Obtain the normalized decision-making matrix Z using the vector normalization method.
(2) Construct the weighted normalized matrix.
(3) Determine the ideal solution and the negative ideal solution.
(4) Calculate the distances from each scheme to the ideal solution and the negative ideal solution.
Distance to the ideal solution:
Distance to the negative ideal solution:
(5) Calculate the degree of closeness of each scheme to the ideal solution.
(6) Rank the schemes in descending order of superiority.
2.6 Greywater footprint calculation
The Agricultural Greywater Footprint (GWFa) includes the Greywater Footprint Of Planting (GWFp) and the Greywater Footprint Of Breeding (GWFb). Nitrogen fertilizer is the largest source of water pollution in planting, and the chemical oxygen demand (COD) and total nitrogen (TN) in the feces and urine of cattle, sheep, pigs, and poultry are the main sources of water pollution in breeding. When calculating the greywater footprint, the greywater footprints generated by the same type of pollutants are summed up, and the maximum value is taken for the greywater footprints generated by different types of pollutants (Cui et al., 2020). The calculation formulas are as follows:
Where,
3 Construction of the indicator system
3.1 Indicator selection
DPSIRM is a systematic analytical framework model based on causal relationships, reflecting the interactions and impacts between human activities and ecosystems (Yang et al., 2025). This study, based on the DPSIRM systematic analytical framework, constructs an evaluation index system for agricultural water resource utilization efficiency. This model systematically reveals the multi-element feedback relationships and dynamic evolution laws of agricultural water resource systems by analyzing the causal chain mechanism of ‘socio-economic driving - resource pressure transmission - environmental state response - comprehensive impact feedback - governance measure regulation.’ In accordance with the principles of scientificity, systematicness, and data availability, and combining with the characteristics of agricultural water resource utilization in China, an evaluation system comprising six subsystems and 17 indicators is constructed (Table 1). The selection criteria for indicators in each dimension are as follows:
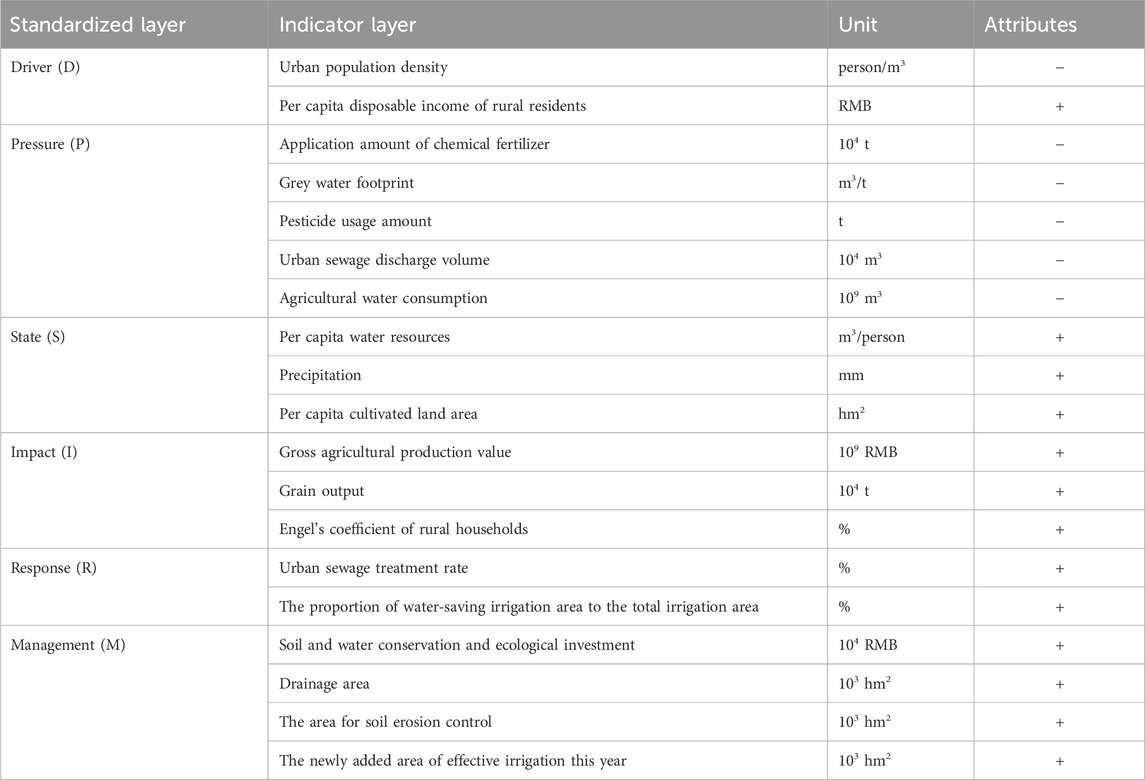
Table 1. Evaluation index system for agricultural water resources utilization efficiency.
The driving force dimension characterizes the underlying causes of socio-economic activities on water resource demand. Urban population density is selected to reflect the spatial agglomeration effect of resource demand induced by the urbanization process, which forms a fundamental driving force for agricultural water resource allocation by altering land use patterns and consumption structures. Rural residents’ per capita disposable income, as a proxy variable for economic development level, embodies the hierarchical transition of water demand driven by income growth, from survival-oriented water use to quality-of-life improvement-oriented water use (Yang et al., 2024).
The pressure subsystem reveals the stress effects of human activities on water resources. Excessive application of chemical fertilizers induces the migration of nitrogen and phosphorus elements, creating non-point source pollution pressure. The grey water footprint quantifies the water demand for pollutant dilution, representing the potential risk of water quality pollution (Roudbari et al., 2023). The total agricultural water use reflects the intensity of competitive resource occupation. Urban sewage discharge affects irrigation water quality through water circulation pathways, constituting a composite pressure source (Yu and Li, 2025).
The state dimension analyzes the background conditions and constraint mechanisms of soil and water resources. Per capita water resources represent the carrying threshold of resource endowments, while annual precipitation reflects natural replenishment capacity, both of which constitute the natural foundation for sustainable water resource utilization. Per capita cultivated land area affects irrigation demand elasticity through the cultivated land-water resource matching degree, and the increase in the multiple cropping index indirectly exacerbates the contradiction between water supply and demand.
The impact dimension assesses the comprehensive effects of water resource utilization. Agricultural production value and agricultural output value per unit of water resources form dual-core indicators of economic efficiency, with the former reflecting total scale and the latter characterizing marginal output benefits. Grain yield per unit of water resources measures the ‘water-grain’ coordination efficiency, and changes in the Engel’s coefficient reflect the socio-economic foundation for the promotion of water-saving technologies.
The response mechanism reflects the immediate regulation of resource problems through technical measures. The enhancement of sewage treatment capacity primarily addresses the prevention and control of irrigation water quality risks (Zheng et al., 2024). The popularity of water-saving irrigation technologies (represented by the proportion of drip and sprinkler irrigation) reflects the transformation process of water resource utilization methods and, as a supplementary effect to chemical fertilizer application, inhibits the carbon-increasing effect of fertilizers and enhances water use efficiency (Guo and Zhang, 2023).
The management dimension focuses on the long-term governance effectiveness of institutional measures. The intensity of investment in soil and water conservation reflects the level of ecological compensation mechanism construction. The area of drainage engineering characterizes the resilience of drainage systems. The areas of soil erosion control and the increment of effective irrigation area jointly constitute dual observation indicators for infrastructure improvement, systematically reflecting the collaborative governance effects of management measures.
3.2 Data sources
The research data for this study primarily originate from the China Statistical Yearbook, statistical yearbooks of various provinces, and statistical bulletins on national economic and social development of respective provinces. The missing data scenarios accounted for 3.48% of the total dataset, with the maximum missing proportion among individual indicators reaching 0.76% and regional missing values peaking at 0.37%. Agricultural water resource metrics (e.g., gross agricultural output value, urban wastewater discharge) typically exhibit linear or quasi-linear trends during short-term/specific phases, and the missing values were characterized as short-term, sporadic, and overall proportionally manageable. Given the validity of linear interpolation assumptions under these conditions, linear interpolation was employed to impute missing values, ensuring data accuracy and authenticity in subsequent analyses.
4 Results
4.1 Spatial distribution analysis of greywater footprint formed by water pollution
To explore the impact of water pollution on the utilization efficiency of agricultural water resources, this study has compiled the greywater footprint distribution maps for the period from 2007 to 2021, as shown in Figure 3. As a new method for calculating water pollution, the greywater footprint can essentially and quantitatively analyze the relationship between water quality and quantity. Its advantage lies in its ability to quickly and intuitively calculate the impact of water pollution on water resources in a large scale research area. This study also used the SBM-DEA model to calculate the greywater footprint parameters of 31 provinces in China from 2007 to 2021.
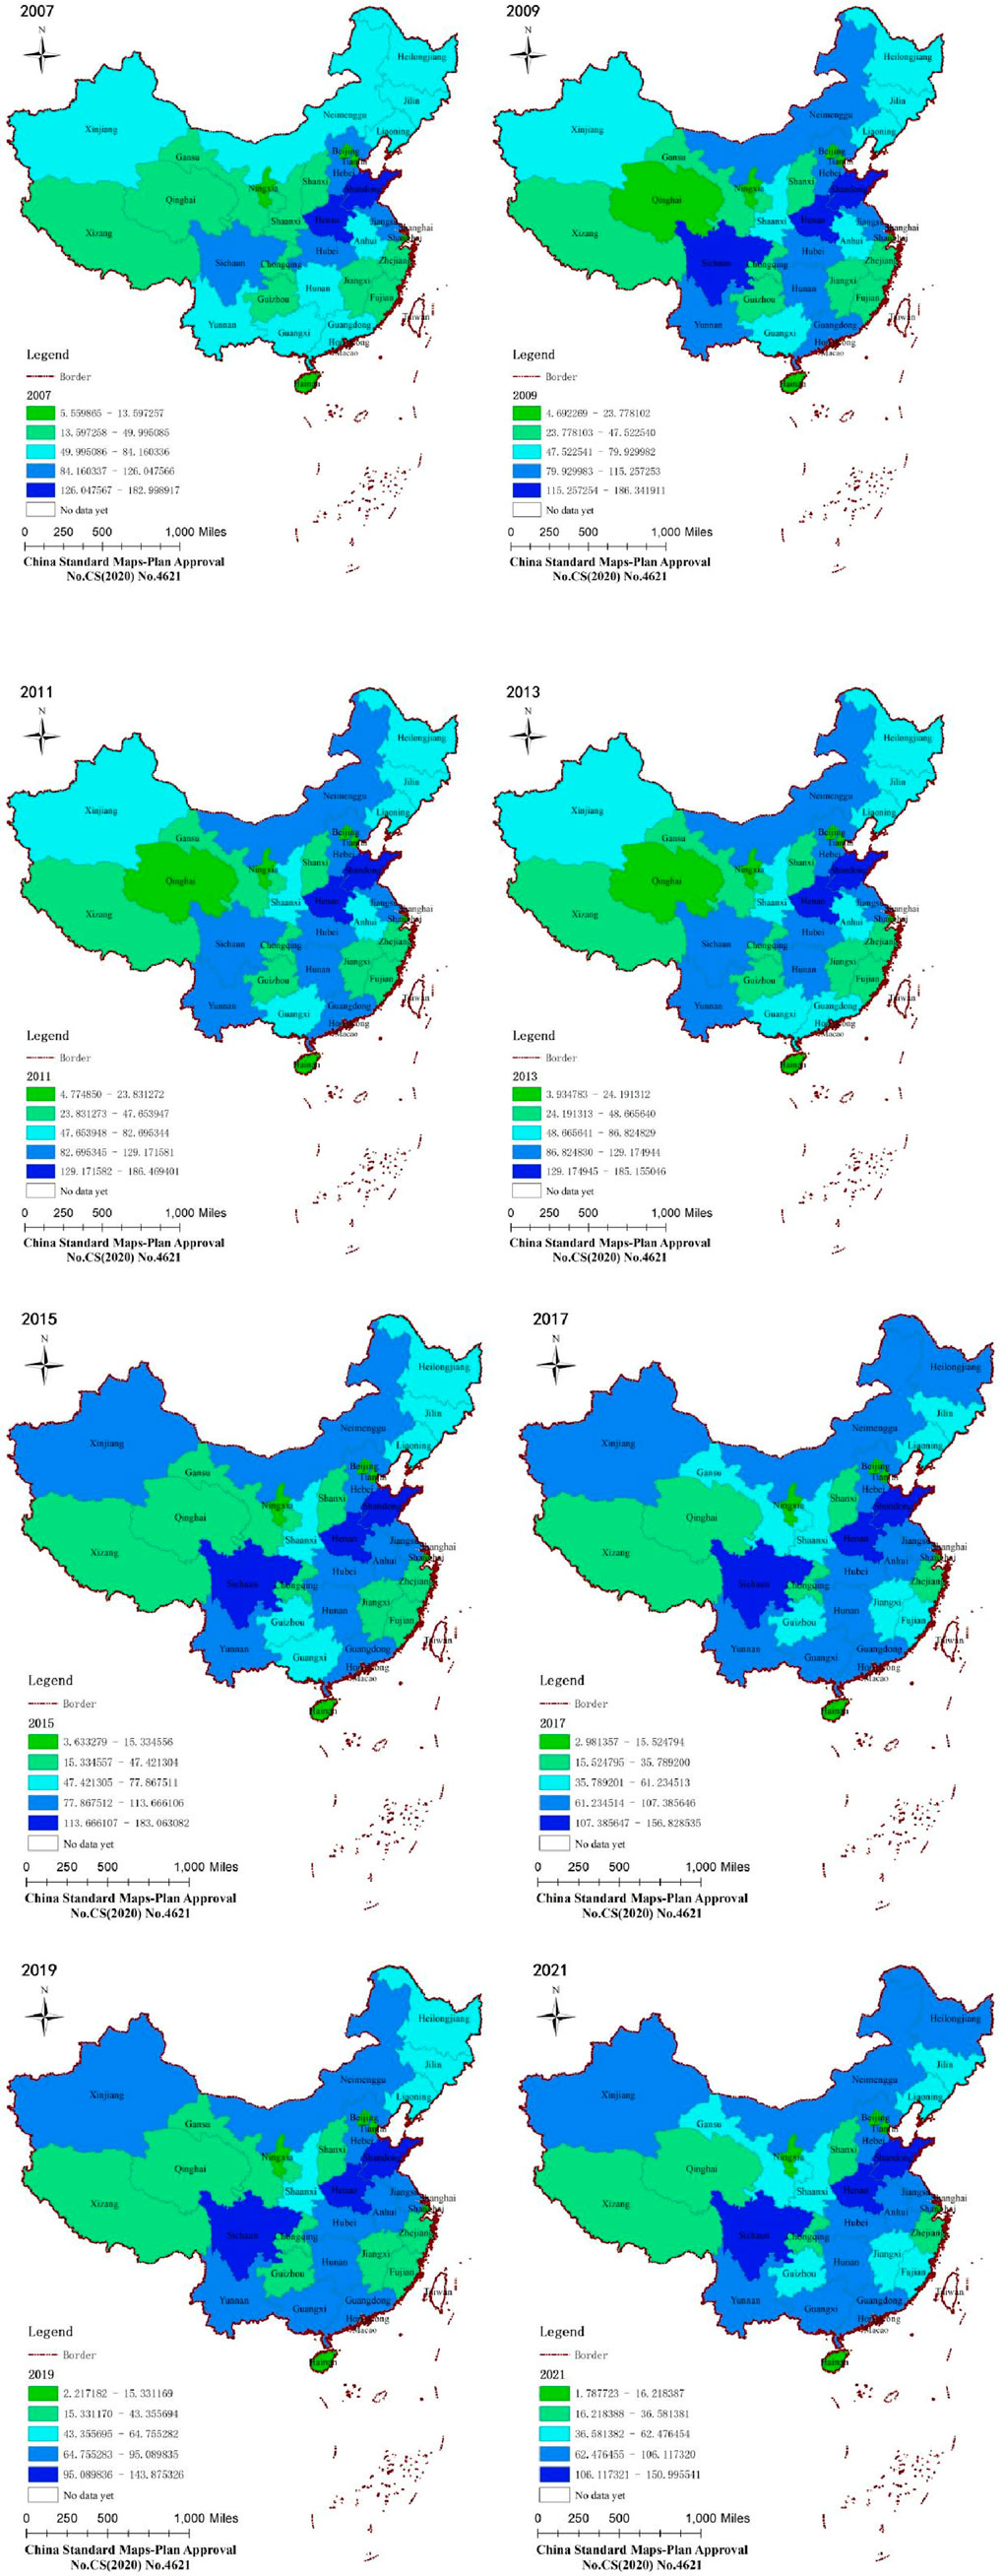
Figure 3. Distribution of graywater footprint of water resources by province and city.
According to Figure 3, it can be seen that the gray water footprint of agricultural water resources shows the characteristic of high west and low east. The gray water footprint of agriculture has a clustering effect in geospatial distribution (Zhao et al., 2024). In the northern region of the study area, in 2007, the grey water indication was between 36.58 and 62.47. Until 2021, it showed an uninterrupted upward trend. Now, the northern region has basically reached between 106.11 and 150.99. From 2007 to 2021, the overall manifestation of greywater in China demonstrated a decreasing trend, the minimum value declined from 5.55 to 1.78, while the maximum value decreased from 182.99 to 150.99. This trend initially emerged in the central and eastern regions and subsequently extended across the entire nation. This culminated in an overall declining pattern across the country. Although a slight upward trend was observed during the 2007–2009 period, a turning point emerged in 2013 when provinces in the central-eastern regions such as Guangdong, Fujian, and Jiangxi began to exhibit downward trajectories. Subsequently, western provinces including Guizhou and Gansu also started to demonstrate declining trends. The greywater footprint conditions of neighboring provinces exerted a substantial influence on other provinces. According to the calculation result, although the gray water footprint of Henan Province has been decreasing year by year, its gray water footprint in the whole country is still located in the high point, indicating that it has been difficult to effectively strengthen the efficiency of agricultural water use in Henan Province. Due to its unique geographical factors, the grey water footprint in the Tibet Autonomous Region has always been in a good state. However, the grey water footprint in Heilongjiang Province has been progressively deteriorating, suggesting that the utilization efficiency of agricultural water resources in Heilongjiang Province is decreasing annually.
Therefore, the spatial pattern of China’s grey water footprint from 2007 to 2021, characterized by “central-eastern regions leading the decline followed by nationwide integration,” fundamentally stemmed from spatiotemporal gradient differences in water pollution control resources, technologies, and policies. Leveraging their advantageous conditions, the central-eastern regions spearheaded substantial improvements in wastewater treatment capacity and standards while strengthening industrial point source control, emerging as the vanguard region for decline. Subsequently, driven by national strategic initiatives and technology diffusion, governance effectiveness extended nationwide, propelling the overall declining trend.
4.2 Spatial distribution analysis of agricultural water resources utilization efficiency
The DPSIRM-SBM model was used to measure the agricultural water use efficiency of 31 provinces in mainland China. The starting, ending, and intermediate years during the research period were selected as representatives to analyze the results of the utilization efficiency of agricultural water resources in the research area, as shown in Figure 4. The results show that the agricultural water use efficiency in most provinces is between 0.5 and 0.75. Some regions such as Xinjiang, Sichuan, Hunan, Beijing, Heilongjiang, Shandong, Guangdong, and Fujian are slightly above 0.75. Tibet, Qinghai, and Ningxia are at the lower end of the national scale, with a minimum of about 0.1260. In 2009, the efficiency of agricultural water use decreased in several provinces, such as Xinjiang, Heilongjiang, and Hunan. However, after 2013, the efficiency in Xinjiang, Beijing, and Liaoning continued to increase, reaching a maximum of 1.896, while the efficiency of agricultural water use in Shanghai declined. In 2019, the efficiency of agricultural water use in the whole country again showed a declining trend. Most of the regions have efficiency values around 0.5.
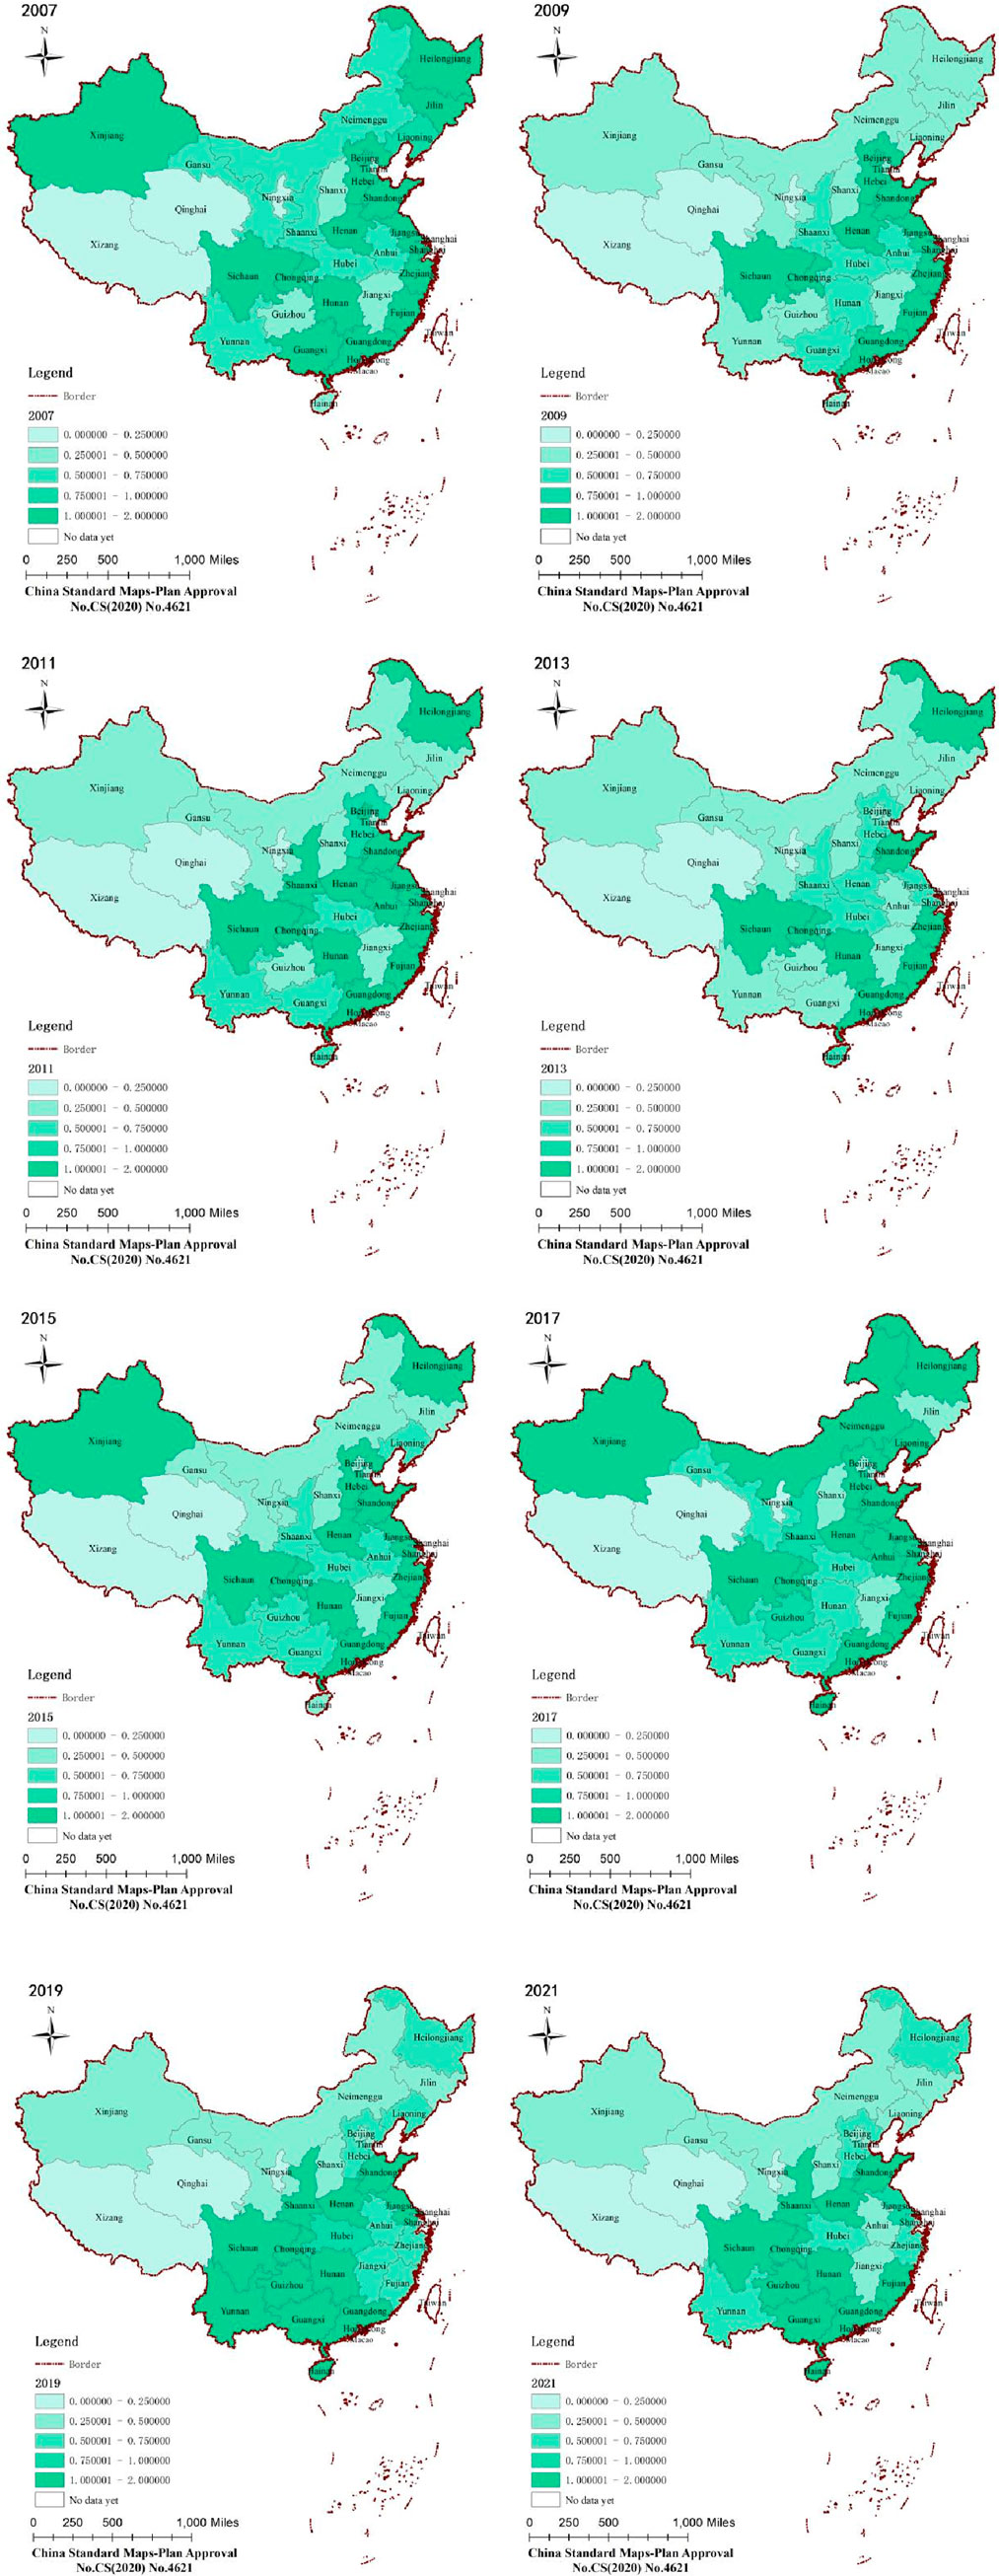
Figure 4. Spatial distribution of water use efficiency in agriculture.
Overall, the agricultural water use efficiency in the study area shows a slight decreasing trend, but individual provinces, such as Hainan, gradually increase their agricultural water use efficiency. This may be closely related to the differences in the development status of each province, local water use policies and strategies for efficient water use.
4.3 Spatial correlation analysis of agricultural water use efficiency
The Moran’s I index was employed to analyze the spatial correlation of the utilization efficiency of agricultural water resources (Yang et al., 2024a). The Moran’s I index and statistical quantities for the growth of the utilization efficiency of agricultural water resources in the study area from 2007 to 2021 are presented in Table 2. As can be seen from Table 2, during the period from 2007 to 2021, the Moran’s I index of the changing trends of the utilization efficiency of agricultural water resources in various regions fluctuated between −0.013 and 0.158. The Moran’s I index was both positive and negative and passed the significance test, indicating that the regions showed positive and negative spatial correlations in different years respectively. The alternating changes of positive and negative correlations of the Moran’s I index in space during the research period demonstrate that the spatial correlation characteristics of the utilization efficiency of agricultural water resources in each province of China are complex and changeable. For example, in 2007, the utilization efficiency of agricultural water resources in various regions of China was spatially negatively correlated, while in 2009 it was positively correlated, in 2013 it was negatively correlated again, and in 2019 it was positively correlated once more. The correlation of the utilization efficiency of agricultural water resources shows a more obvious agglomeration phenomenon in geographical space. Therefore, it is particularly important to analyze the utilization efficiency of China’s agricultural water resources based on spatiality.
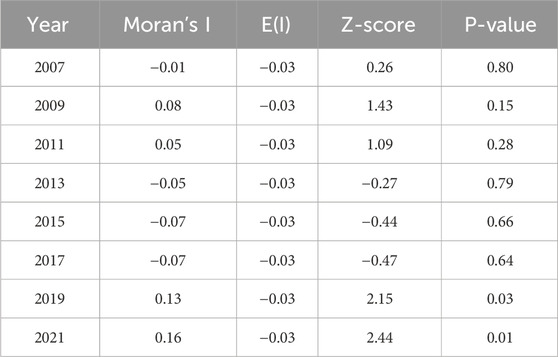
Table 2. The Moran’s I index and statistical quantities.
Through local spatial autocorrelation, this paper analyzed the spatial agglomeration degree of the utilization efficiency of agricultural water resources at eight time nodes. Moreover, the ArcGIS software was used to spatially process the agglomeration results, and the LISA cluster map of the efficiency of agricultural water resources was obtained, which more intuitively displayed the spatial heterogeneity of the utilization efficiency of agricultural water resources. The results are shown in Figure 5. Most of the utilization efficiency of agricultural water resources presents a spatial distribution of low-low agglomeration and high-high agglomeration. In 2007, 2015, and 2017, Qinghai Province was in the low-low agglomeration area, while Tibet was in the low-low agglomeration area in 2009, 2011, 2019, and 2021. In 2009 and 2013, Sichuan and Shandong respectively joined the high-low agglomeration areas, which indicates that the utilization efficiency values of agricultural water resources in Sichuan and Shandong were higher than those in the surrounding areas and had a radiation effect on the surrounding areas. In 2011 and 2013, Jiangxi was in the low-high agglomeration area, indicating that the efficiency values of agricultural water resources in the surrounding areas of Jiangxi were relatively high, but its own value was relatively low, which is a shortcoming hindering the improvement of the utilization efficiency of agricultural water resources. In 2009, Henan, Jiangsu, Shanghai, and Zhejiang joined the high-high agglomeration areas, indicating that the efficiency values of these four provinces and cities and their adjacent areas were relatively high, and the internal spatial differences between regions were relatively small. In 2021, only Jiangxi was in the low-high agglomeration area, and Guangdong, Yunnan, and Hainan joined the high-high agglomeration areas, indicating that the utilization efficiency of agricultural water resources in each province was improving, but there were large differences in spatial distribution, and the radiation effect between regions was weak.
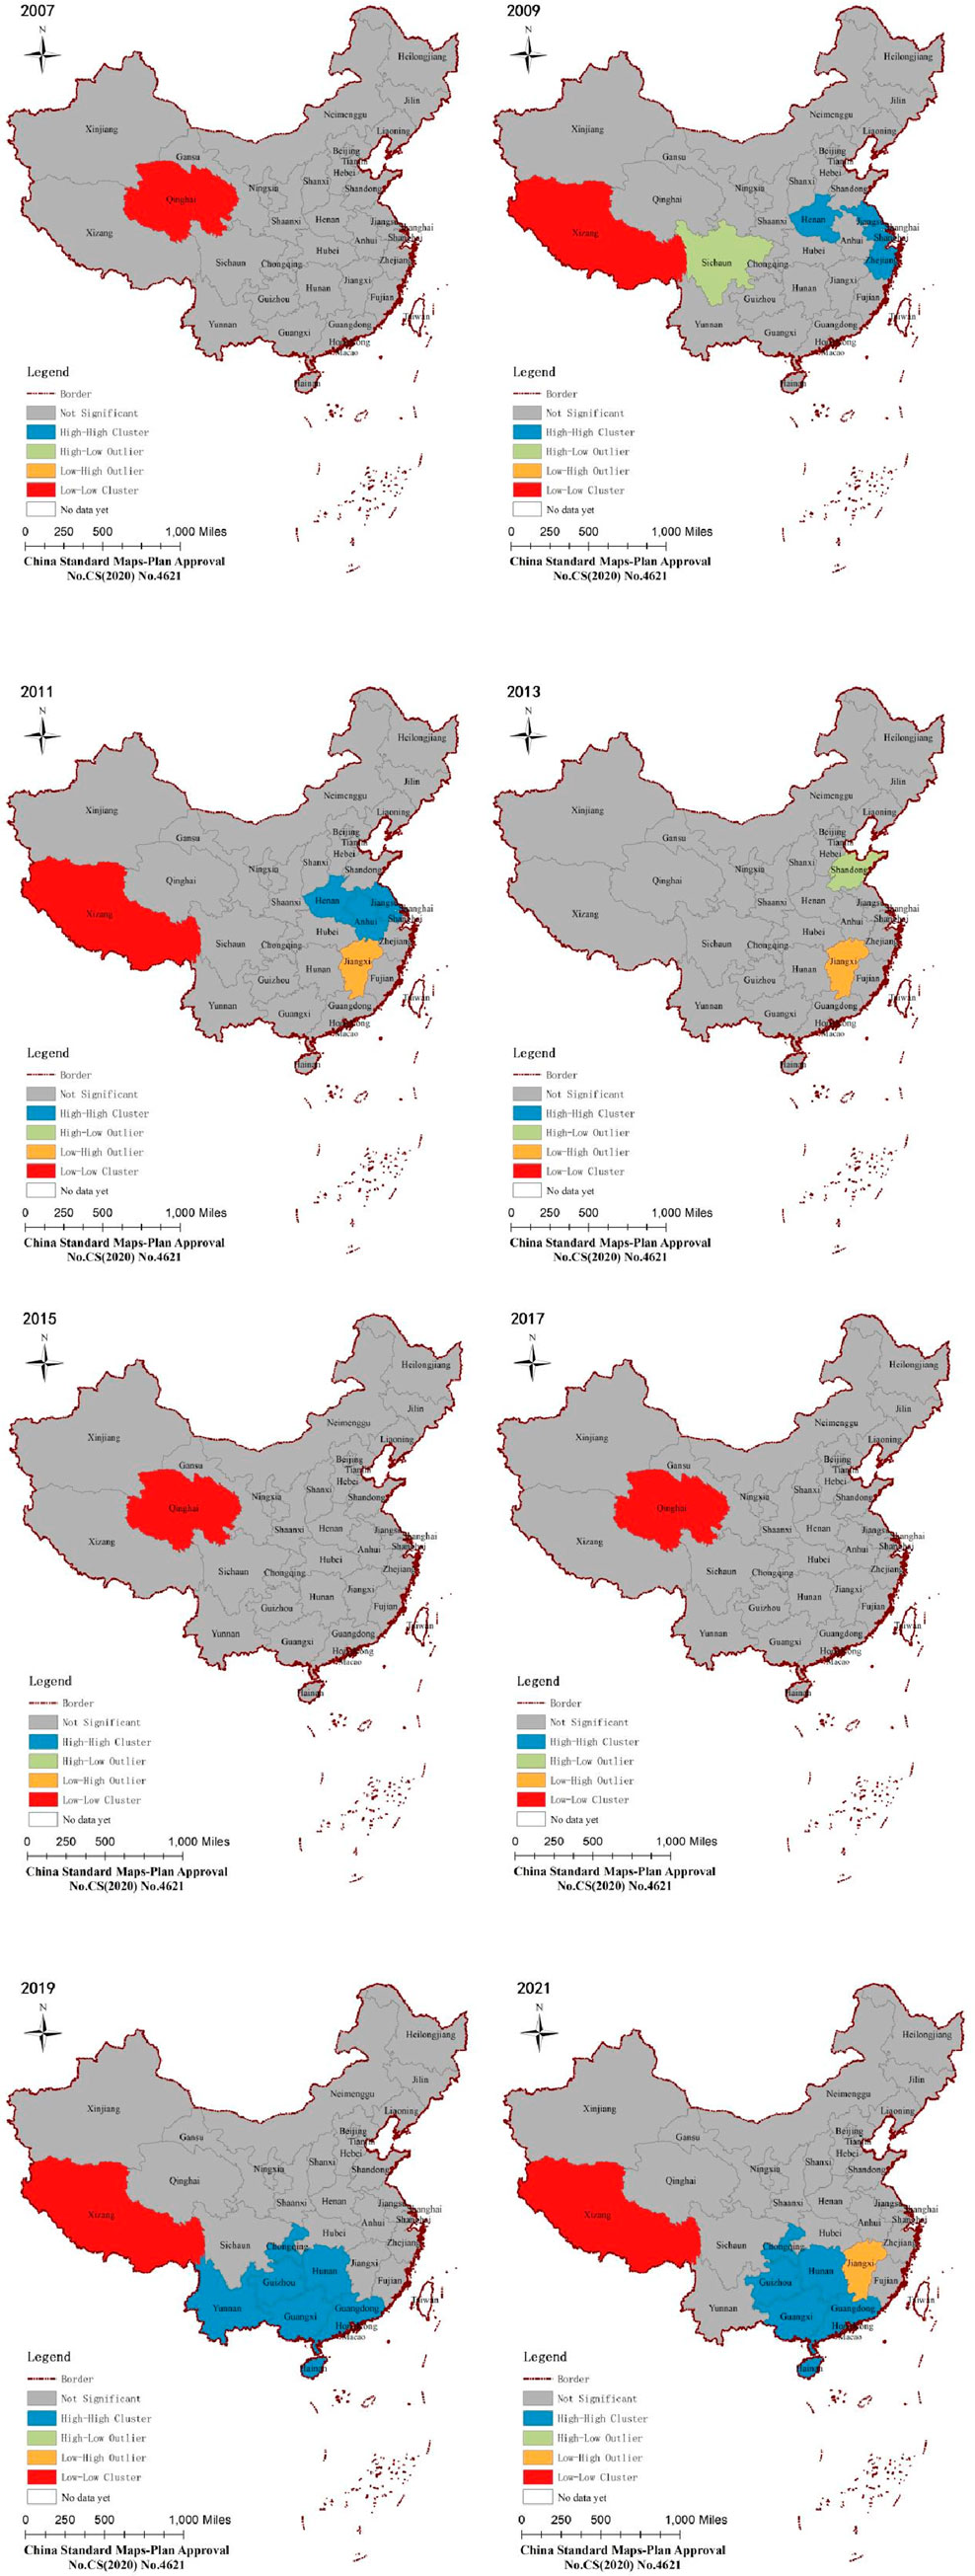
Figure 5. The LISA cluster map.
Overall, the number of provinces in the high-high agglomeration areas is increasing, indicating that the utilization efficiency of agricultural water resources in China’s provinces is gradually improving overall. However, there still exist phenomena of non-agglomeration and imbalance. Moreover, the agricultural water resource efficiency in some provinces is quite unstable. Therefore, it is necessary to strengthen the connections among provinces, attach importance to the development of low-low agglomeration areas, and enhance the radiation effect.
4.4 Analysis of dynamic changes in agricultural water use efficiency
In this study, the SBM-DEA model was utilized to calculate the agricultural water resource utilization efficiency indices of 31 regions across the country during the period from 2007 to 2021. Additionally, the average agricultural water resource utilization efficiency indices of the whole country and the three major geographical regions, namely, the eastern, central, and western regions, were calculated, and the results are shown in Figure 6.
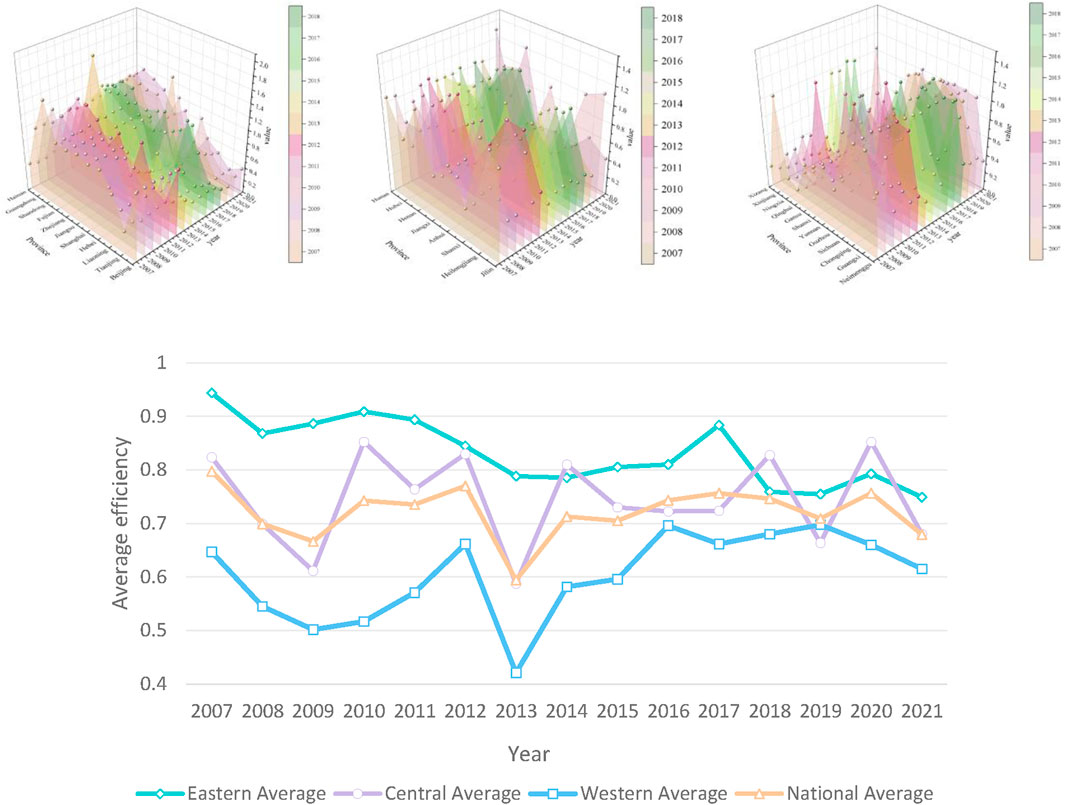
Figure 6. Shows the utilization efficiency and average changing trend of agricultural water resources in the eastern, central and western regions of China from 2007 to 2021.
By observing the agricultural water resource utilization efficiency indices and the changing trajectories of their average indices across the country and within the three major geographical regions, the following can be found. First, from a national perspective, during the period from 2007 to 2021, the agricultural water resource utilization efficiency of various provinces in China showed an overall stable development trend. After rapid increases and decreases from 2008 to 2013, it began to fluctuate between 0.6 and 0.9, with a relatively small gap. The agricultural water resource utilization efficiency was generally distributed within the range of 0.6–0.9, and there was a downward trend at the end of the sample period. This indicates that the attention paid by all provinces in the country to the utilization of agricultural water resources still needs to be improved. Second, in the eastern region, the agricultural water resource utilization efficiency was higher overall than the national average level. Although it remained in a stable development state throughout the sample period, there were occasional downward trends. However, it was still higher than that of the central and western regions. This indicates that the eastern region is not only the main contributor to national economic growth but also the leader in high-quality national growth. Third, in the central region, the agricultural water resource utilization efficiency was basically higher than the national level. However, during the sample period, the fluctuation range was relatively large, suggesting potential risks of unstable development. This shows that there is still a lack of sufficient attention to the agricultural water resource utilization efficiency in this region. Finally, the agricultural water resource utilization efficiency in the western region has always been lower than the national average level, indicating that their development model is still somewhat backward.
4.5 Zonal study of water use efficiency in agriculture
To explore the influencing factors of the zoning of agricultural water resource utilization efficiency, pie charts, cluster heatmaps, raincloud plots, box plots, and circular packing diagrams were drawn for analysis, and the results are shown in Figure 7.
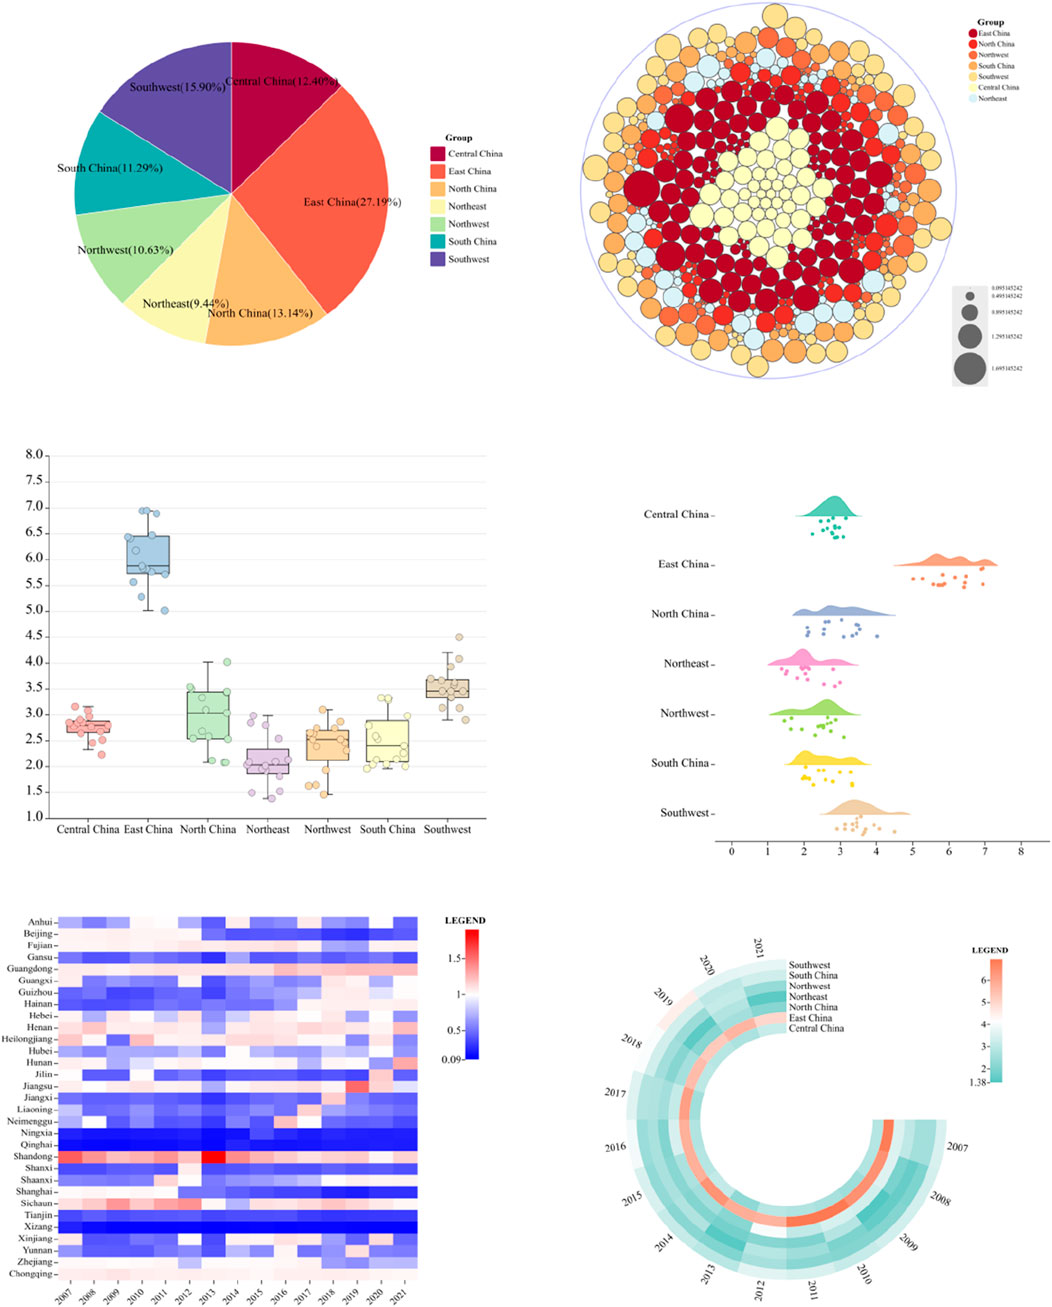
Figure 7. Research results map of zoning of agricultural water resource utilization efficiency (Pie chart, cluster heatmap, raincloud plot, box plot, and circular packing diagram).
From the pie chart and circular packing diagram, there is an imbalance in development among regions. The agricultural water resource utilization efficiency in China, from high to low, is as follows: the eastern region, the southwestern region, the northern region, the central region, the southern region, the northwestern region, and the northeastern region. There is significant room for improvement in the agricultural water resource utilization efficiency of each region. The eastern and southwestern regions have the highest agricultural water resource efficiency, because these regions have superior geographical factors and abundant water resources. With the support and guidance of policies, they are effectively combined with the local environmental location, which is conducive to enhancing the utilization efficiency of agricultural water resources. The northeastern region has the lowest water resource utilization efficiency, due to the relatively scarce water resources and relatively backward agricultural water resource utilization in the region. As can be seen from the box plot and raincloud plot, the agricultural water resource utilization efficiency of the eastern region far exceeds that of the other six regions. However, the index gap of the water resource utilization efficiency in the eastern region is also relatively large, mostly fluctuating between 5.8 and 6.5, while the gap in the central region is relatively small compared to the whole country, only fluctuating between 2.6 and 2.9. The results of the cluster heatmap show that the red part, that is, the high-efficiency zoning of agricultural water resources, is relatively scarce, and only Shanghai and Jiangsu can reach this level. However, the blue part is widely distributed, indicating that the agricultural water resource utilization efficiency in most parts of China still needs to be improved.
In summary, due to differences in the development levels, resource utilization levels, and regional geographical locations of various regions, there are variations in the utilization efficiency of agricultural water resources among the three major geographical divisions. The utilization efficiency of agricultural water resources in the eastern and central regions is basically on a par with or higher than the national average level. However, the development of the utilization efficiency of agricultural water resources in the western region is relatively low.
4.6 Analysis of the transfer trend of the spatial gravity center of agricultural water resource utilization efficiency
The gravity center of agricultural water resource utilization efficiency was calculated using ArcGIS. Leveraging the advantages of ArcGIS in spatial analysis and thematic map making, the movement trajectory of the gravity center of agricultural water resource utilization efficiency was visualized. With the support of the ArcGIS software, based on the calculated migration of the gravity center of agricultural water resource utilization efficiency during the research period, a phased comparison of the migration of the gravity center of agricultural water resource utilization efficiency was carried out. A thematic map of the migration trajectory of the gravity center of agricultural water resource utilization efficiency was created, and a local area was enlarged to an appropriate scale, as shown in Figure 8.
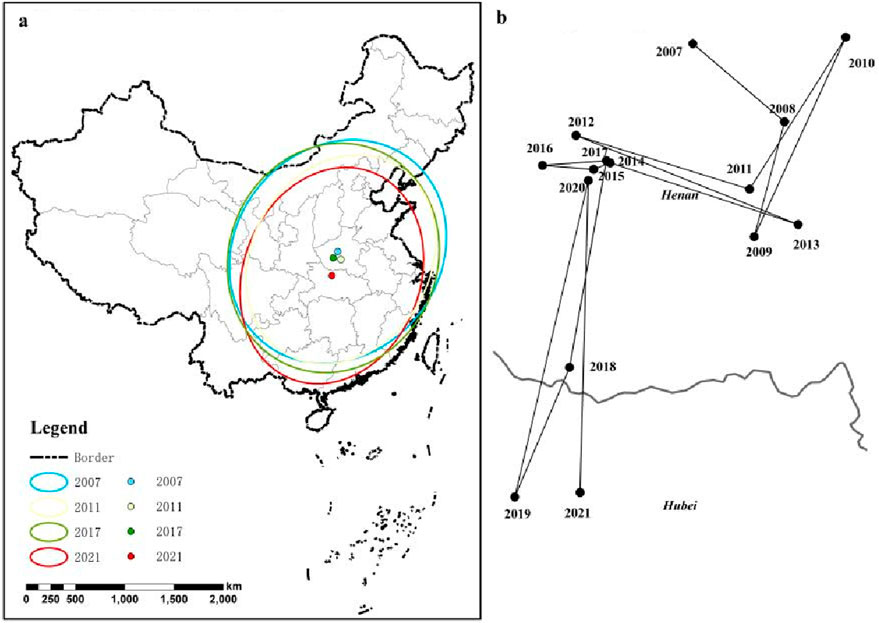
Figure 8. Elliptical function and gravity center migration trend diagram of agricultural water resource utilization efficiency.
From the perspective of the elliptical area generation, for the ellipse with a semi-major axis of 1125748.655 and a semi-minor axis of 896728.4684 (year 2021), it can be found that the intensity of the water resource development scope in 2021 is much smaller than that in previous years, and the coverage area has decreased significantly. Moreover, the agglomeration areas, which are roughly distributed in the east-west and north-south directions, have also decreased to some extent. The oblateness (the difference between the semi-minor axis and the semi-major axis) increases, indicating that the directivity of the data becomes more obvious. During the research period, the lengths of the semi-major and semi-minor axes of the ellipse show a fluctuating trend. However, in 2021, the data of the semi-minor axis is the lowest, indicating that the centripetal force presented by the data in recent years is more obvious, and the distribution characteristics are remarkable. The central point positions of the ellipse in the figure show little difference in 2007, 2011, and 2017. However, the central point in 2021 deviates significantly, indicating a relatively large degree of data variation. The distribution directions of the ellipses during the research period are basically the same, so the connections between regions are also relatively close.
5 Discussion and conclusion
This study, grounded in the DPSIRM-SBM model and the grey water footprint accounting framework, systematically dissects the spatiotemporal differentiation characteristics and driving mechanisms of agricultural water resource efficiency across 31 provincial regions in China from 2007 to 2021. The findings not only unveil the persistence of regional efficiency disparities but also elucidate the complexity of efficiency evolution from multifaceted dimensions including pollution pressure, management responsiveness, and spatial interactions, thereby providing theoretical and empirical underpinnings for sustainable agricultural water resource management.
The “west-high, east-low” spatial configuration of grey water footprint (as depicted in Figure 2) indicates that the implicit occupation of water resources by agricultural non-point source pollution in the western regions is notably higher than in the eastern regions. This outcome aligns with the findings of certain scholars, such as the observation that despite a year-on-year decline in agricultural grey water footprint in Henan Province, its absolute magnitude still ranks first nationwide (Kong et al., 2022; Song et al., 2023), reflecting the cumulative pollution effects of intensive agriculture in the Huang-Huai-Hai Plain (Wang et al., 2024).
The mean efficiency in the eastern regions (0.83) significantly surpasses that of the central and western regions (as shown in Figure 5), with pronounced efficiency fluctuations in the central region and prolonged inefficiency in the western region, underscoring the synergistic effects of technological advancement and policy regulation. However, the sharp efficiency fluctuations in some developed provinces (e.g., Shanghai) suggest that a mere reliance on economic inputs may lead to the “diminishing marginal returns” trap, necessitating the reinforcement of institutional constraints on pollution control (Zhou et al., 2021; Hao et al., 2025).
The Moran’s I index reveals a non-stationary characteristic of “positive-negative alternation” in the spatial correlation of efficiency (as presented in Table 2). For instance, the Moran’s I value surged to 0.135 (P < 0.05) in 2019, indicating the formation of efficiency enhancement poles through technological diffusion in “high-high” agglomeration areas (e.g., Guangdong, Yunnan), which resonates with Hao Wang’s findings on the spatial spillover effects of water-saving technologies (Wang et al., 2023). Furthermore, the lock-in effect in low-low agglomeration areas (Qinghai, Tibet) unveils the risk of the “resource curse,” necessitating the disruption of path dependency through cross-regional ecological compensation. Additionally, the migration trajectory of the efficiency gravity center (as illustrated in Figure 6) demonstrates a southeastward shift of the efficiency core area, validating the optimizing role of market-oriented approaches in resource allocation.
Through the analysis of the utilization efficiency of agricultural water resources in various regions of China, the following conclusions are drawn:
(1) The utilization efficiency indices of agricultural water resources in most provinces across the country are basically in the range of 0.5–0.75, with the Xinjiang and Heilongjiang regions being particularly prominent. However, they still show a downward trend during the research period. (2) From the perspective of the degree of agglomeration, the number of provinces in the high-high agglomeration areas is increasing. There are phenomena of non-agglomeration and unbalanced development in the study area, and the utilization efficiency of agricultural water resources among various provinces and cities is unstable. (3) In terms of the three major geographical regions in China, namely, the eastern, central, and western regions, the utilization efficiency of agricultural water resources in the eastern and central regions is higher than that in the western region. (4) Judging from the movement trajectory of the gravity center of the utilization efficiency of agricultural water resources, the directivity of the gravity center movement of provinces across the country becomes more and more obvious. The distribution characteristics of the gravity center in 2021 are more remarkable, and the regional connections during the research period are relatively close. (5) From the perspective of the zoning of the utilization efficiency of agricultural water resources, the utilization efficiency of agricultural water resources in the eastern region is the most stable and ranks first. The southwestern region also ranks among the top due to its superior geographical location. However, the distribution of water resource utilization efficiency in the northeastern region is unstable and low, and still needs to be promoted.
Author contributions
JW: Writing – review and editing, Supervision. HS: Writing – original draft, Writing – review and editing, Validation, Data curation. GY: Supervision, Funding acquisition, Writing – review and editing, Resources. DL: Visualization, Supervision, Writing – review and editing. YQ: Validation, Writing – review and editing, Software. CZ: Methodology, Writing – review and editing. LZ: Writing – review and editing, Visualization.
Funding
The author(s) declare that financial support was received for the research and/or publication of this article. The authors are grateful for the financial support provided by National Social Science Foundation Post-funded Project (24FGLB092), Key Science and Technology Project of Chongqing Municipal Education Commission (2024CJZ015), Science and Technology Research Program of Chongqing Municipal Education Commission (KJQN202504022), Higher Education Teaching Reform Research Project of Chongqing (233337), and Planning Project of Chongqing Academy of Educational Science (K23YG2110387).
Conflict of interest
The authors declare that the research was conducted in the absence of any commercial or financial relationships that could be construed as a potential conflict of interest.
Generative AI statement
The author(s) declare that no Generative AI was used in the creation of this manuscript.
Publisher’s note
All claims expressed in this article are solely those of the authors and do not necessarily represent those of their affiliated organizations, or those of the publisher, the editors and the reviewers. Any product that may be evaluated in this article, or claim that may be made by its manufacturer, is not guaranteed or endorsed by the publisher.
References
Bai, Y., Zhang, C., Xie, X., Wang, Y., and Hu, Y. (2024). How can agricultural water use efficiency be promoted in the North China plain? Phys. Chem. Earth Parts A/B/C 136, 103740. doi:10.1016/j.pce.2024.103740
Bao, Q., Ding, J., Wang, J., Han, L., and Tan, J. (2025). Utilizing CMIP6-SSP scenarios with the VIC model to enhance agricultural and ecological water consumption predictions and deficit assessments in arid regions. Comput. Electron. Agric. 232, 110083. doi:10.1016/j.compag.2025.110083
Cui, S., Dong, H., and Wilson, J. (2020). Grey water footprint evaluation and driving force analysis of eight economic regions in China. Environ. Sci. Pollut. Res. 27 (16), 20380–20391. doi:10.1007/s11356-020-08450-8
Feng, Y., Cheng, J., and Deng, Y. (2024). Study on agricultural water resource utilization efficiency under the constraint of carbon emission and water pollution. Environ. Res. 253, 119142. doi:10.1016/j.envres.2024.119142
Geng, Q., Ren, Q., Nolan, R. H., Wu, P., and Yu, Q. (2019). Assessing China’s agricultural water use efficiency in a green-blue water perspective: a study based on data envelopment analysis. Ecol. Indic. 96, 329–335. doi:10.1016/j.ecolind.2018.09.011
Guo, Z., and Zhang, X. (2023). Carbon reduction effect of agricultural green production technology: a new evidence from China. Sci. Total Environ. 874, 162483. doi:10.1016/j.scitotenv.2023.162483
Hao, L., Zhang, S., Zhang, F., Ren, Y., Zhang, X., and Yan, J. (2025). Balancing water saving, market attractiveness, and pollution control in crop spatial planting structure planning of arid regions. Agric. Water Manag. 309, 109348. doi:10.1016/j.agwat.2025.109348
He, G., Geng, C., Zhai, J., Zhao, Y., Wang, Q., Jiang, S., et al. (2021). Impact of food consumption patterns change on agricultural water requirements: an urban-rural comparison in China. Agric. Water Manag. 243, 106504. doi:10.1016/j.agwat.2020.106504
Jingxue, W., Lei, Y., Yao, H., Ge, J., Wu, S., and Liu, L. (2021). Estimation and influencing factors of agricultural water efficiency in the Yellow River Basin, China. J. Clean. Prod. 308, 127249. doi:10.1016/j.jclepro.2021.127249
Kong, Y., He, W., Zhang, Z., Shen, J., Yuan, L., Gao, X., et al. (2022). Spatial-temporal variation and driving factors decomposition of agricultural grey water footprint in China. J. Environ. Manag. 318, 115601. doi:10.1016/j.jenvman.2022.115601
Lu, C., Ji, W., Hou, M., and Mao, J. (2022). Evaluation of efficiency and resilience of agricultural water resources system in the Yellow River Basin, China. Agric. Water Manag. 266, 107605. doi:10.1016/j.agwat.2022.107605
Mbava, N., Mutema, M., Zengeni, R., Shimelis, H., and Chaplot, V. (2020). Factors affecting crop water use efficiency: a worldwide meta-analysis. Agric. Water Manag. 228, 105878. doi:10.1016/j.agwat.2019.105878
Pan, Z., Wang, Y., and Zhou, Y. (2020). Analysis of the water use efficiency using super-efficiency data envelopment analysis. Appl. Water Sci. 10 (6), 139. doi:10.1007/s13201-020-01223-1
Roudbari, M. V., Dehnavi, A., Jamshidi, S., and Yazdani, M. (2023). A multi-pollutant pilot study to evaluate the grey water footprint of irrigated paddy rice. Agric. Water Manag. 282, 108291. doi:10.1016/j.agwat.2023.108291
Shah, W. U. H., Gang, H., Yasmeen, R., Yan, H., and Qi, Y. (2024). Impact of agricultural technological innovation on total-factor agricultural water usage efficiency: evidence from 31 Chinese provinces. Agric. Water Manag. 299, 108905. doi:10.1016/j.agwat.2024.108905
Shah, W. U. H., Hao, G., Yasmeen, R., Yan, H., Shen, J., and Lu, Y. (2023). Role of China’s agricultural water policy reforms and production technology heterogeneity on agriculture water usage efficiency and total factor productivity change. Agric. Water Manag. 287, 108429. doi:10.1016/j.agwat.2023.108429
Shi, C., Li, L., Chiu, Y.-H., Pang, Q., and Zeng, X. (2022). Spatial differentiation of agricultural water resource utilization efficiency in the Yangtze river economic belt under changing environment. J. Clean. Prod. 346, 131200. doi:10.1016/j.jclepro.2022.131200
Shi, Z., and Zhou, S. (2023). A study on the dynamic evaluation of ecosystem health in the Yangtze river basin of China. Ecol. Indic. 153, 110445. doi:10.1016/j.ecolind.2023.110445
Song, M., He, W., An, M., Fang, X., Wang, B., and Ramsey, T. S. (2023). Toward better agricultural grey water footprint allocation under economy-resource factors constraint. Ecol. Indic. 154, 110806. doi:10.1016/j.ecolind.2023.110806
Srinivasan, V., Lambin, E., Gorelick, S. M., Thompson, B. H., and Rozelle, S. (2012). The nature and causes of the global water crisis: syndromes from a meta-analysis of coupled human-water studies. Water Resour. Res. 48. doi:10.1029/2011wr011087
Sun, C., Wang, X., and Zhang, Y. (2024). Ecological health assessment of an arid basin using the DPSIRM model and TOPSIS—a case study of the Shiyang river basin. Ecol. Indic. 161, 111973. doi:10.1016/j.ecolind.2024.111973
Sun, J., Yang, Y., Qi, P., Zhang, G., and Wu, Y. (2024). Development and application of a new water-carbon-economy coupling model (WCECM) for optimal allocation of agricultural water and land resources. Agric. Water Manag. 291, 108608. doi:10.1016/j.agwat.2023.108608
Tone, K. (2001). A slacks-based measure of efficiency in data envelopment analysis. Eur. J. Operational Res. 130 (3), 498–509. doi:10.1016/s0377-2217(99)00407-5
Wang, H., Liu, C., Xiong, L., and Wang, F. (2023). The spatial spillover effect and impact paths of agricultural industry agglomeration on agricultural non-point source pollution: a case study in Yangtze River Delta, China. J. Clean. Prod. 401, 136600. doi:10.1016/j.jclepro.2023.136600
Wang, M., Huang, X., Dong, Y., Song, Y., Wang, D., Li, L., et al. (2024). Spatiotemporal drivers of agricultural non-point source pollution: a case study of the Huang-Huai-Hai Plain, China. J. Environ. Manag. 370, 122606. doi:10.1016/j.jenvman.2024.122606
Wang, X., Cui, B., Chen, Y., Feng, T., and Fang, G. (2024). Dynamic changes in water resources and comprehensive assessment of water resource utilization efficiency in the Aral sea basin, central Asia. J. Environ. Manag. 353, 120198. doi:10.1016/j.jenvman.2024.120198
Whitney, C., O’Brien, G., Dlamini, V., Greffiths, I. J., Dickens, C., and Luedeling, E. (2025). Balancing ecosystem sustainability and irrigated smallholder agriculture: a modeling approach for water resource management. J. Hydrology 651, 132560. doi:10.1016/j.jhydrol.2024.132560
Yang, G., Cheng, S., Huang, X., Cheng, S., and Huang, X. (2024a). What were the spatiotemporal evolution characteristics and influencing factors of global land use carbon emission efficiency? A case study of the 136 countries. Ecol. Indic. 166, 112233. doi:10.1016/j.ecolind.2024.112233
Yang, G., Gui, Q., Liu, J., Chen, X., and Cheng, S. (2023). Spatial-temporal evolution and driving factors of ecological security in China based on DPSIR-DEA model: a case study of the three gorges reservoir area. Ecol. Indic. 154, 110777. doi:10.1016/j.ecolind.2023.110777
Yang, G., Yang, Y., Gong, G., and Chen, X. (2024b). The coupling and coordination characteristics of agricultural green water resources and agricultural economic development in China. Environ. Dev. Sustain. 26 (1), 2131–2151. doi:10.1007/s10668-022-02807-4
Yang, G, Li, D, Zhou, C, Li, C., Qin, Y., Sheng, H., et al. 2025. Analysis of spatial network characteristics in the coupling coordination between global industrial structure optimization and carbon emission efficiency. Ecol. Indic. 178, 113812.
Yang, L., Hao, Y., Wang, B., Li, X., and Gao, W. (2025). Evaluation of the water resources carrying capacity in Shaanxi Province based on DPSIRM–TOPSIS analysis. Ecol. Indic. 173, 113369. doi:10.1016/j.ecolind.2025.113369
Yu, K., and Li, Z. (2025). Multi-scenario analysis of green water resource efficiency under carbon emission constraints in the Chengdu-Chongqing urban agglomeration, China: a system dynamics approach. Ecol. Indic. 171, 113139. doi:10.1016/j.ecolind.2025.113139
Zhang, F., Xiao, Y., Gao, L., Ma, D., Su, R., and Yang, Q. (2022). How agricultural water use efficiency varies in China—a spatial-temporal analysis considering unexpected outputs. Agric. Water Manag. 260, 107297. doi:10.1016/j.agwat.2021.107297
Zhao, D., Wang, W., Ji, X., Wu, P., and Zhuo, L. (2024). Nitrogen cycling and associated grey water footprint in croplands under different irrigation practices. J. Clean. Prod. 480, 144081. doi:10.1016/j.jclepro.2024.144081
Zhao, F., Guo, M., Zhao, X., and Shu, X. (2024). Spatio-temporal characteristics and coupling coordination factors of industrial water resource system resilience and utilization efficiency: a case study of the Yangtze river economic belt. Ecol. Indic. 167, 112704. doi:10.1016/j.ecolind.2024.112704
Zhao, M., Li, J., Zhang, Y., Han, Y., and Wei, J. (2023). Water cycle health assessment based on combined weight and hook trapezoid fuzzy TOPSIS model: a case study of nine provinces in the Yellow River Basin, China. Ecol. Indic. 147, 109977. doi:10.1016/j.ecolind.2023.109977
Zheng, H., Wang, H., He, H., Wu, Y., Delang, C. O., Wu, J., et al. (2024). Quantifying the heterogeneity of urban water resources utilization efficiency through meta-frontier super SBM model: application in the Yellow River Basin. J. Clean. Prod. 485, 144410. doi:10.1016/j.jclepro.2024.144410
Zhou, L., Li, L., and Huang, H. J. (2021). The river chief system and agricultural non-point source water pollution control in China. J. Integr. Agric. 20 (5), 1382–1395. doi:10.1016/s2095-3119(20)63370-6
Keywords: agricultural water efficiency, DPSIRM-SBM model, space-time evolution, entropy method, greywater footprint
Citation: Wang J, Sheng H, Yang G, Li D, Qin Y, Zhou C and Zou L (2025) What were the spatial-temporal distributions of agricultural water resource efficiency in China?. Front. Environ. Sci. 13:1640712. doi: 10.3389/fenvs.2025.1640712
Received: 05 June 2025; Accepted: 11 July 2025;
Published: 06 August 2025.
Edited by:
Spyros Foteinis, Heriot-Watt University, United KingdomReviewed by:
Ying Zhu, Xi’an University of Architecture and Technology, ChinaCopyright © 2025 Wang, Sheng, Yang, Li, Qin, Zhou and Zou. This is an open-access article distributed under the terms of the Creative Commons Attribution License (CC BY). The use, distribution or reproduction in other forums is permitted, provided the original author(s) and the copyright owner(s) are credited and that the original publication in this journal is cited, in accordance with accepted academic practice. No use, distribution or reproduction is permitted which does not comply with these terms.
*Correspondence: Guangming Yang, eWFuZ2d1YW5nbWluZ0BjcXV0LmVkdS5jbg==