 Qingdong Hao1
 Rimsha Arshad2*
- 1Department of Philosophy, School of Humanities, Xi’an Jiaotong University, Xi’an, China
- 2Department of Economics, Guangdong University of Science and Technology, Dongguan, China
This study investigates the impact of green technology (GT), energy intensity (EIN), environmental performance (EPR), and economic growth (GDP) on carbon emissions (CEM) across the G5 economies—Brazil, China, India, Mexico, and South Africa—over the period 2000 to 2022. Unlike previous studies, this research integrates these four variables in a unified framework using Method of Moments Quantile Regression (MMQR) and panel Granger causality tests—an approach rarely applied to emerging economies collectively. This allows for a deeper, distribution-sensitive understanding of how technological, economic, and environmental factors interact to shape emissions trajectories across high- and low-emission contexts. Employing MMQR, we assess the heterogeneous effects of these drivers across the carbon emission distribution, with particular attention to the potential decoupling of economic growth from environmental degradation. To further explore directional dynamics, the Dumitrescu and Hurlin panel Granger non-causality test is applied. The empirical results reveal that green technology development and economic growth are significantly associated with reductions in carbon emissions, especially in higher emission quantiles, indicating that environmentally sustainable growth is attainable through targeted technological investments. In contrast, both energy intensity and environmental performance indicators show a positive association with emissions, suggesting that increased energy demand and limited effectiveness of current environmental measures hinder mitigation efforts. Causality analysis confirms that both GT and GDP Granger-cause carbon emissions, whereas EIN and EPR do not exhibit statistically significant causal relationships. These findings underscore the pivotal role of green technology in advancing low-carbon transitions and support the design of integrated policy frameworks aimed at enhancing energy efficiency, fostering innovation, and aligning with Sustainable Development Goals (SDGs), particularly those related to climate action and sustainable urban development. The study provides actionable insights for policymakers in the G5 and other emerging economies striving to balance economic growth with environmental sustainability.
1 Introduction
Climate change has emerged as one of the most urgent and complex global challenges of the 21st century (Feulner, 2015). A primary driver of this crisis is the persistent reliance on fossil fuels, which has significantly contributed to environmental degradation and an alarming rise in greenhouse gas emissions—particularly carbon emissions (CEM) (Mehmood et al., 2024). Recognizing the escalating threats posed by CEM to sustainability, development, and environmental integrity, policymakers, researchers, and international organizations have intensified their focus on mitigation strategies (Raihan and Tuspekova, 2022).
Efforts to curb climate change remain constrained by the carbon-intensive nature of economic development, energy use, and trade, as well as the embeddedness of emissions in current industrial and institutional systems (Sarkodie, 2021). The United Nations’ Sustainable Development Goal (SDG) 13 explicitly calls for urgent action to combat climate change and its impacts (Department of Economic and Social Affairs, 2025). In this context, reducing CEM while maintaining economic growth has become a critical research and policy imperative (Dong and Yu, 2024; Ren and Zhu, 2025; Zhao et al., 2025).
This study examines the role of green technology (GT), energy intensity (EIN), environmental performance (EPR), and economic growth (GDP) in shaping carbon emissions across G5 economies—Brazil, China, India, Mexico, and South Africa—from 2000 to 2022. The analysis aims to offer actionable insights for effective climate action plans by investigating how these variables interact and influence emissions outcomes in rapidly developing economies. While green investments and innovations are widely promoted as tools for sustainable development, their empirical effectiveness—particularly in emerging economies—remains underexplored (Duan, 2025; Xia et al., 2025; Xu et al., 2025).
In parallel, the deteriorating environmental performance in some regions underscores the importance of institutional reforms (Barra and Falcone, 2024; Feng et al., 2024; Tufail et al., 2021) emphasize that improving fiscal decentralization, lowering the cost of non-renewables, and strengthening institutional quality are crucial to reversing environmental degradation. Meanwhile, evidence suggests that increases in EIN and foreign direct investment (FDI) may inadvertently escalate CEM (Lan et al., 2012). Their findings highlight the spatial spillover effects of EIN reduction targets in China and suggest a nonlinear relationship between GT innovation and CEM mitigation, dependent on innovation thresholds.
This study aligns closely with multiple SDGs. SDG 7 emphasizes the need for affordable and clean energy, and EIN is directly related to energy consumption efficiency—a key indicator of sustainable energy use. Lower EIN reflects improved energy efficiency, contributing to reduced emissions (Tsvetkov et al., 2024). Similarly, SDG 8 (Decent Work and Economic Growth) and SDG 9 (Industry, Innovation, and Infrastructure) are addressed through the analysis of GDP and its relationship with CEM, underscoring the challenge of reconciling economic development with environmental protection. Green technology—such as clean energy innovations and patents for eco-efficient processes—are essential levers in this transition (Dong et al., 2025).
Further, SDG 12 advocates for sustainable consumption and production patterns, which can lower EPR and ultimately reduce CEM through improved industrial practices and resource efficiency (Barbhuiya et al., 2024). The role of international partnerships, as captured under SDG 17, is also critical; collaboration in clean technology development and financial mechanisms is necessary to support low-carbon transitions (Weko and Goldthau, 2022). However, recent SDG progress reports show that G5 countries are falling short on key environmental targets, particularly those related to climate action, clean energy, and sustainable production (Sachs et al., 2022; Apergis, 2016) stress that scaling up investments in renewable energy, restoring natural ecosystems, and advancing GT are pivotal to achieving carbon neutrality.
The G5 nations were selected for this study due to their significant contributions to global economic activity and carbon emissions, as well as their strategic importance in the climate transition. Collectively, these countries represent more than 30% of global carbon emissions and are among the top emerging economies contributing to global GDP growth. Moreover, their participation in key global forums such as the G20 and COP climate negotiations highlights their central role in shaping international environmental policies (Alomair et al., 2025; Jia et al., 2024). These countries—Brazil, China, India, Mexico, and South Africa—represent the world’s leading emerging economies and are simultaneously key stakeholders in climate negotiations. Their rapid industrialization, rising energy demands, and heterogeneous policy responses provide a valuable context for examining the complex trade-offs between growth and environmental sustainability.
Moreover, the geographical and developmental diversity among G5 countries allows for a more nuanced understanding of how GT, EIN, EPR, and GDP interact with emissions. Brazil and Mexico offer insight into Latin America’s natural resource dynamics and institutional responses. China and India, as Asia’s economic giants, reflect the tensions between industrial growth and green innovation. South Africa, as the leading economy in Africa, exemplifies the challenge of decarbonizing economies heavily reliant on fossil fuels.
Figure 1 illustrates the distribution of CEM across the G5 nations over the study period. China exhibits the widest range and highest median emissions, highlighting its sustained industrial expansion. South Africa also displays a high median with moderate variability. Mexico’s emissions are more stable, while Brazil and India maintain the lowest medians—though Brazil’s emissions show greater variability due to periodic surges. These patterns reflect the developmental trajectories and policy environments unique to each country.
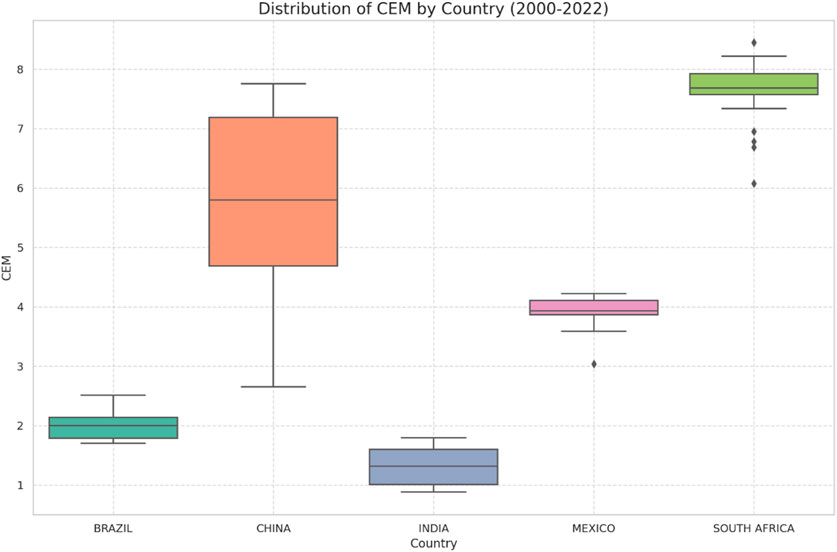
Figure 1. Distribution of CEM values by country (2000–2022). The boxplot shows the range, median, interquartile range, and outliers for each country, providing insights into the variability and central tendency of CEM within each region.
By investigating the effects of GT, EIN, EPR, and GDP on carbon emissions, this study contributes to the understanding of environmental sustainability pathways in emerging economies. It aims to inform policymaking, support international climate goals, and offer a comparative framework for designing green growth strategies in the Global South.
Although earlier works have examined aspects of these relationships individually—such as the link between EIN and CEM (Bashir et al., 2021), or the influence of GT on emissions reduction (Luo et al., 2024; Lv et al., 2024)—these studies typically isolate variables rather than examining their combined and interactive effects. Few studies have integrated GT, EIN, EPR, and GDP into a unified empirical framework to assess their collective impact on CEM. Moreover, emerging literature still lacks the application of dynamic and distribution-sensitive techniques, such as the MMQR method or the Westerlund cointegration test, especially in multi-country studies focusing on emerging economies (Machado and Santos Silva, 2019).
Additionally, longitudinal research examining the evolution of GT’s impact on CEM over extended periods remains scarce. Most studies provide only short-term snapshots or static assessments, failing to capture the structural transformations and policy shifts that occurred between 2000 and 2022—a period marked by considerable regulatory and technological advancements (Chien et al., 2023; Dhayal et al., 2025). These evolving dynamics are crucial to understanding how sustainable transitions unfold in emerging economies.
These research questions collectively aim to highlight the technological advancements of the G5 nations in mitigating CEM, particularly through the application of clean technologies, environmental innovations, and renewable energy patents. The study also evaluates whether economic expansion can occur alongside environmental sustainability, and whether improvements in EPR can support the achievement of Sustainable Development Goals (SDGs).
To achieve these objectives, a comprehensive econometric framework is employed. The Method of Moments Quantile Regression (MMQR) developed by Machado and Santos Silva (2019) is particularly appropriate for this study, as it captures the heterogeneous effects of explanatory variables (GT, EIN, EPR, GDP) across different points in the carbon emissions distribution. This is essential because the G5 countries differ significantly in their emission profiles and policy contexts, which cannot be fully addressed using mean-based models like OLS or traditional fixed effects.
MMQR allows for a nuanced understanding of how each factor affects low-, medium-, and high-emission scenarios, aligning well with our research goal of exploring decoupling between economic growth and emissions at multiple intensity levels. This technique has been increasingly applied in energy-environmental economics, though its use in multi-country G5-focused studies remains limited (Ulucak and Ozcan, 2020).
We complement MMQR with several panel diagnostics to ensure robustness. The slope heterogeneity test (Hashem Pesaran and Yamagata, 2008) addresses structural and institutional differences across countries. The cross-sectional dependence test accounts for potential spillover effects among countries—especially relevant in the globally integrated context of energy and environmental policy. The CIPS unit root test ensures that data are stationary, while the Westerlund cointegration test verifies long-run relationships among variables. This combination of tests enhances both the credibility and depth of the analysis.
Additionally, panel Granger non-causality tests (Dumitrescu and Hurlin, 2012) are used to assess the direction of influence between variables, providing policy-relevant insights on whether, for example, GT and GDP can predict emission trends.
Although our study does not develop a new technique, it offers a novel methodological application by integrating MMQR with cointegration and causality analysis in the context of G5 countries—something not previously done in this combination. This integrative approach allows us to explore both distributional impacts and temporal causality in a single framework, advancing the methodological application of MMQR in comparative environmental research.
Figure 2 illustrates the temporal variation of carbon emissions across G5 countries from 2000 to 2022. China shows a consistent and steep upward trend in emissions until 2020, likely driven by rapid industrialization and economic growth, followed by a visible decline possibly attributable to recent policy shifts or global disruptions. South Africa presents persistently high emission levels with relatively stable trends, except for a mild dip in 2020. Mexico and Brazil exhibit moderate emissions with fluctuations, including observable declines around 2016–2020 in Brazil and in 2020 in Mexico. India demonstrates a steady upward trend, corresponding with its gradual but continuous development trajectory, with a slight decline after 2018 that may reflect the effects of structural reforms.
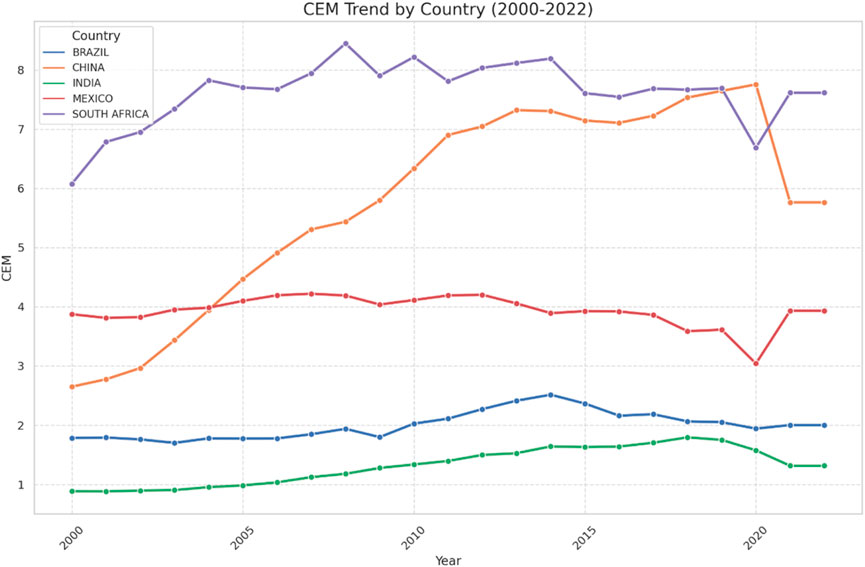
Figure 2. Temporal trends of CEM across Brazil, China, India, Mexico, and South Africa from 2000 to 2022. The plot highlights country-specific changes over time, with distinct trajectories indicating varying dynamics in CEM growth and fluctuation.
These country-specific patterns reflect the diversity of economic development pathways and the critical role of industrialization, regulatory interventions, and external shocks in shaping CEM trends. By contextualizing these dynamics within a robust econometric analysis, this study offers valuable insights into sustainable development strategies applicable to the broader Global South.
The remainder of the paper is organized as follows. Section 2 presents the literature review on CEM, GT, EIN, EPR, and GDP, along with the identified research gaps. Section 3 describes the data sources and empirical methodology. Section 4 reports and interprets the empirical findings. Section 5 concludes the study with policy implications and recommendations.
2 Review of literature
This section explores the theoretical and empirical linkages between green technology (GT), energy intensity (EIN), environmental performance (EPR), economic growth (GDP), and carbon emissions (CEM), with a focus on how these variables interact to support sustainability objectives, particularly in emerging economies. GT has increasingly played a pivotal role in the global reduction of carbon emissions. Green technology (GT)—also referred to in the literature as environmental or clean technologies—refer to innovations and practices that minimize environmental harm by enhancing energy efficiency, reducing emissions, and supporting sustainable resource use. These technologies encompass a range of applications, including renewable energy systems, energy-efficient industrial processes, carbon capture technologies, and low-emission transportation (UNCTAD, 2024). In this study, we use the term green technology (GT) consistently and proxy it through the number of environmental technology patents filed, in line with OECD and WIPO classifications.
The role of GT in mitigating carbon emissions has been emphasized in recent reports. The highlights that clean energy innovation needs to triple by 2030 to meet global climate targets. Similarly, the IPCC Sixth Assessment Report (IPCC, 2025) notes that scalable low-carbon technologies are essential to achieving net-zero transitions. GT has been linked to significant improvements in environmental performance by decoupling economic activity from emissions, particularly in emerging economies (Chen and Yang, 2024; Kashif et al., 2024).
Several empirical studies support the role of GT in emissions mitigation. For instance (Bilgili et al., 2016), found that renewable-based GT significantly reduced emissions in OECD countries, while (Chen et al., 2023) reported similar outcomes in BRICS nations. Despite these insights, there remains limited evidence for multi-country applications involving G5 countries, especially using robust distributional techniques. Our study addresses this gap by incorporating GT into a comprehensive panel framework covering the years 2000–2022.
Rafei et al. (2022) found that economic complexity significantly improves EPR, implying that advanced, diversified economies tend to perform better environmentally. While numerous studies have examined the relationship between economic growth and environmental degradation, many have focused narrowly on renewable energy use, often omitting the broader context of innovation and institutional performance.
Technological innovation in renewable energy depends heavily on R&D, requiring a robust and well-functioning financial system. This study departs from prior research by examining the combined effects of GT, EIN, EPR, and GDP on CEM, with a specific focus on the G5 economies. (Zhang and Vigne (2021) investigated the effect of EPR and CEM disclosures on firm value, using data from SRI-KEHATI index-listed firms. Their findings suggest that while CEM disclosure does not directly affect firm value, EPR and integrated disclosure do have a positive effect.
Guo et al. (2023) provided further insight, indicating that renewable energy development contributes more substantially to reducing environmental pressure in low-income countries compared to middle-income ones. Ulucak and Ozcan (2020) analyzed OECD countries from 1980 to 2016 using the augmented mean group (AMG) estimator. Their results showed that renewable energy consumption helps mitigate environmental degradation, while dependence on non-renewable sources exacerbates it. These findings emphasize the need for countries to shift toward cleaner energy pathways.
Regarding energy intensity, higher economic activity often entails greater energy consumption, leading to increased emissions. Bashir et al. (2021) found that increased EIN significantly contributes to higher CEM, while (Wen et al., 2022) reaffirmed the critical role of energy efficiency technologies in lowering environmental damage. Additionally (Xu et al., 2022), demonstrated that improved EPR is associated with lower ecological footprints, highlighting its relevance as a sustainability indicator. Liu et al. (2024) emphasized the importance of policy and financial support in fostering GT development, revealing that countries with greater eco-innovation investments tend to experience sharper declines in emissions.
The relationship between GDP and CEM is more complex when green technology is factored in. Luo et al. (2024) explored the causal links among GT, GDP, and CEM, and suggested that the introduction of GT can decouple economic growth from rising emissions. Their findings support the idea that investments in green innovation can enable sustained development without exacerbating environmental pressures.
Overall, the existing literature confirms that GT, EIN, EPR, and GDP all play significant roles in influencing CEM. Advancements in energy efficiency and environmental governance are critical for emission reductions. GT promotes the adoption of cleaner production methods and alternative energy sources, offering promising solutions for climate change mitigation. By enabling the decoupling of carbon emissions from economic growth, green technology can contribute meaningfully to sustainable development. This study aims to expand on this literature by empirically testing these dynamics across the G5 economies using advanced panel econometric techniques. The insights are intended to guide policymakers in designing integrated strategies for climate resilience and inclusive development.
2.1 Literature gap
The structure of this research is designed to offer substantial insights into the complex interrelationships between carbon emissions (CEM) and key determinants such as green technology (GT), energy intensity (EIN), environmental performance (EPR), and economic growth (GDP). While prior studies have explored the role of GT in reducing emissions, significant gaps remain, particularly concerning comprehensive and context-specific assessments that integrate multiple variables using advanced econometric techniques. For instance, existing research tends to isolate GT or EIN without considering their interaction with governance or macroeconomic factors in emerging economies (Lv et al., 2024). In the specific context of the G5 countries—Brazil, China, India, Mexico, and South Africa—between 2000 and 2022, there is a noticeable lack of in-depth empirical exploration using modern estimation strategies. In the specific context of the G5 countries—Brazil, China, India, Mexico, and South Africa—between 2000 and 2022, there is a noticeable lack of in-depth empirical exploration.
Although earlier works have examined aspects of these relationships individually—such as the link between EIN and CEM (Lv et al., 2024), or the influence of GT on emissions reduction (Maasoumi et al., 2021)—these studies typically isolate variables rather than examining their combined and interactive effects.
Moreover, there is limited application of sophisticated econometric methods in this domain. Most existing literature tends to rely on traditional panel data or linear regression models, which may overlook complex dynamics and cross-country heterogeneities. Advanced techniques such as matrix correlation, slope heterogeneity testing, cross-sectional dependence (CSD), CIPS unit root testing, Westerlund cointegration analysis, and the Method of Moments Quantile Regression (MMQR) are rarely employed despite their capacity to yield more robust and nuanced findings (Lin et al., 2015). The failure to utilize these tools limits the depth of understanding about how variables behave across emission quantiles and over time, especially within heterogeneous groups like the G5.
Additionally, longitudinal research examining the evolution of GT’s impact on CEM over extended periods remains scarce. Most studies provide only short-term snapshots or static assessments, failing to capture the structural transformations and policy shifts that occurred between 2000 and 2022—a period marked by considerable regulatory and technological advancements. These evolving dynamics are crucial to understanding how sustainable transitions unfold in emerging economies.
Although a growing number of studies have explored the individual relationships between green technology, energy intensity, environmental performance, and economic growth with carbon emissions, few have integrated these four dimensions into a unified empirical framework. For instance, Ulucak and Ozcan (2020) examined energy intensity and environmental sustainability in OECD nations but did not incorporate technological innovation. Han et al. (2022), Shahbaz et al. (2020) analyzed GT and economic growth, yet omitted environmental performance and energy metrics. Similarly (Khezri et al., 2021), focused on GT and emissions in Asia but did not explore the moderating role of economic growth or energy structures. These fragmented approaches limit the ability to understand systemic interactions.
Our study addresses this gap by integrating GT, EIN, EPR, and GDP in a single model across G5 economies, thereby providing a multidimensional analysis of emission drivers. Using Method of Moments Quantile Regression (MMQR), we account for distributional heterogeneity, which is typically neglected in traditional models. This integrated, nonlinear approach allows us to assess whether green technology have a greater impact in high- or low-emission contexts, offering deeper insights than mean-based regressions.
Furthermore, the translation of empirical insights into actionable policy frameworks remains limited in the literature. While (Ali et al., 2022; Mohd Suki et al., 2022) provided policy suggestions for BRICS based on GT investment patterns, and (Sheng Yin and Hussain, 2021) emphasized energy efficiency in ASEAN economies, these recommendations were largely descriptive and lacked alignment with SDGs or cross-sectoral feasibility assessments.
This study contributes by aligning findings with specific SDG targets (7, 8, 9, 12, 13) and providing targeted policy guidance—e.g., emphasizing investment in renewable patents in high-emission provinces or focusing on energy restructuring in lower-income G5 countries. We go beyond simply identifying statistical associations by offering a structured pathway for decision-makers to integrate emissions, growth, and innovation into low-carbon transition policies.
2.2 Theoretical framework
This study draws on principles from the Environmental Kuznets Curve (EKC) hypothesis and Ecological Modernization Theory (EMT) to frame the relationship between economic growth, technological progress, environmental regulation, and carbon emissions. The EKC suggests that as an economy grows, environmental degradation initially worsens but improves after surpassing a certain income threshold. EMT, on the other hand, argues that technological innovation and institutional responses can decouple economic development from ecological harm.
In this context, green technology (GT) are theorized to reduce carbon emissions directly and indirectly through improved efficiency and sustainable practices. Energy intensity (EIN) reflects production and consumption efficiency—higher EIN implies greater energy use per unit of GDP, thereby contributing to more emissions. Environmental performance (EPR) captures a country’s regulatory and policy-driven efforts, which can either moderate or intensify emissions depending on enforcement and design. Lastly, GDP reflects economic activity, which may increase emissions unless accompanied by green innovation or regulatory controls.
A conceptual model illustrating these interrelationships is presented in Figure 3, providing a schematic view of the hypothesized pathways linking these factors to carbon emissions in the G5 economies.
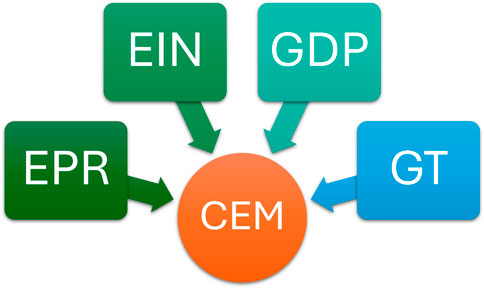
Figure 3. Conceptual model of the study.
3 Data and methodology
The study includes four main independent variables: green technology (GT), energy intensity (EIN), environmental performance (EPR), and economic growth (GDP), to investigate their effects on carbon emissions (CEM) in the G5 economies from 2000 to 2022.
This particular combination of variables offers a novel multidimensional lens. While individual pairwise combinations (e.g., GT and GDP, EIN and CEM) have been analyzed in prior research (Ulucak and Ozcan, 2020), the joint integration of all four variables using a quantile-based, long-run panel approach is rare, especially in the G5 context.
All variable definitions are presented in Table 1, but are detailed here for clarity:
• Carbon Emissions (CEM): Measured in metric tons per capita (WDI, 2019).
• Green Technology (GT): Measured by the number of environment-related patents filed, in line with OECD and WIPO standards (OECD, 2020).
• Energy Intensity (EIN): Energy use per unit of GDP (MJ/USD constant 2015), from WDI. It indicates production energy efficiency—higher values imply inefficiency.
• Environmental Performance (EPR): Proxied by Ecological Footprint per capita (Global Footprint Network, 2021). This reflects the pressure a country places on ecological systems. Higher EPR values represent greater environmental strain, thus this variable is positively associated with emissions.
• Economic Growth (GDP): Measured as GDP per capita (constant 2015 USD), from WDI.
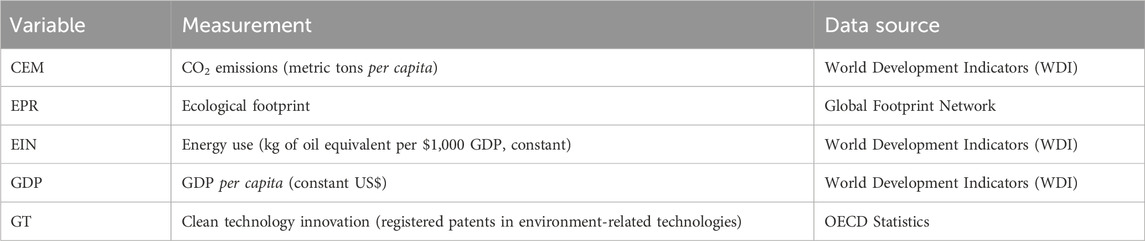
Table 1. Description of variables.
The use of ecological footprint (EF) as a proxy for EPR is based on its ability to capture broad environmental pressure (biocapacity use vs. availability), widely used in studies like (Ha et al., 2022; Sarkodie, 2021). This provides a holistic indicator beyond single-pollutant measures.
The analytical methods employed include Method of Moments Quantile Regression (MMQR), Westerlund cointegration tests, and Dumitrescu-Hurlin causality analysis. MMQR is particularly appropriate for this analysis because it detects how the relationship between predictors and emissions varies at different emission quantiles, reflecting cross-country heterogeneity. This is critical for the G5, whose economies vary widely in emissions levels and development.
Cointegration analysis ensures that the long-term relationships among non-stationary variables are valid, while the panel Granger causality test examines directionality and policy relevance of relationships (e.g., whether GT “causes” lower emissions).
The chosen period, 2000–2022, is based on data availability and policy relevance. This period captures the rollout of major global environmental initiatives (Sun et al., 2022), sharp technology transitions, and rising climate governance in emerging economies. Although data for some variables (e.g., patents or EF) are not yet available for 2023 across all G5 countries, 2022 offers the most recent complete year.
Limiting the analysis to 2000–2022 ensures that the findings reflect the full evolution of green innovation and emission intensity policies in the 21st century, while minimizing inconsistencies caused by incomplete data.
MMQR technique regarding this research is given in Equation 1.
Where,
Error term is denoted by
It takes into consideration the heterogeneous impacts across several quantiles, the MMQR technique has the advantage of offering a comprehensive knowledge of how each independent variable affects the dependent variable (CEM) throughout its distribution, as opposed to only at the mean. This is especially helpful for studies on CEM, as different factors may have various impacts at different levels of CCE metrics.
Equation 2 depicts the summarization of Slope heterogeneity (Pesaran, 2006) test.
Where,
However, to find out if panel data exhibits cointegration, the (Westerlund and Edgerton, 2008) test has also been conducted before MMQR analysis. A long-term equilibrium relationship between the dependent variable and one or more independent variables is indicated by cointegration. It is based on the error correction model depicted in Equation 3. Where
Equation 4 given below is supposed to be used when incorporating the Westerlund test in the situation where CEM is the dependent variable and GT, EPR, EIN and GDP are the independent variables:
Dependent variable for the cross-section
An extensive and reliable method for managing complicated data is provided by econometric analysis, which makes use of matrix correlation, slope heterogeneity, cross-sectional dependence tests such as the CIPS unit root test, Westerlund cointegration analysis, and MMQR. Figure 4 is showing the flowchart of test techniques. Moreover, Matrix correlation offers a comprehensive understanding of interdependencies by assisting in the identification of correlations between various variables. Slope heterogeneity improves the precision of model estimations by acknowledging that various cross-sectional units may display a range of behavioural tendencies. Besides, the validity of panel data results is ensured by cross-sectional dependence tests, including the CIPS unit root test, which address potential correlations between units. Strong techniques for identifying long-term equilibrium relationships are provided by Westerlund’s cointegration tests, even in the presence of cross-sectional dependence or structural fractures. Furthermore, MMQR offers a refined comprehension of the correlation between variables across several quantiles, hence identifying heterogeneity in the response variable distribution and facilitating more customized policy implications. When combined, these techniques improve the econometric findings’ depth, dependability, and applicability.
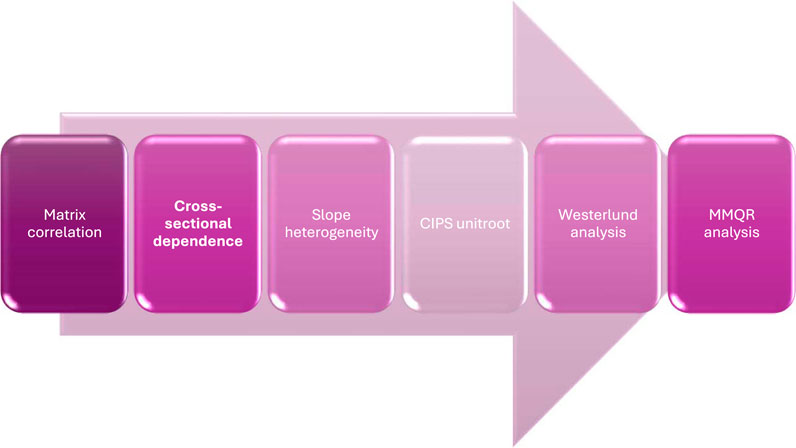
Figure 4. Flowchart of methodology.
While MMQR is suitable for capturing distributional effects across quantiles, we also employed complementary techniques such as Westerlund cointegration and Dumitrescu-Hurlin causality tests to verify long-run equilibrium and directionality. These methods, when used together, reduce model misspecification risk and enhance the robustness of findings. Moreover, the dataset passed key diagnostics such as cross-sectional dependence and slope heterogeneity tests, confirming the appropriateness of applying advanced panel estimators over simpler pooled or fixed effects regressions.
4 Results and discussions
This section presents the empirical results of the study. Table 2 provides the descriptive statistics for the study variables, while Table 3 displays the correlation matrix. The descriptive statistics indicate variability across countries and time, which underscores the heterogeneity in economic and environmental profiles within the G5 nations.
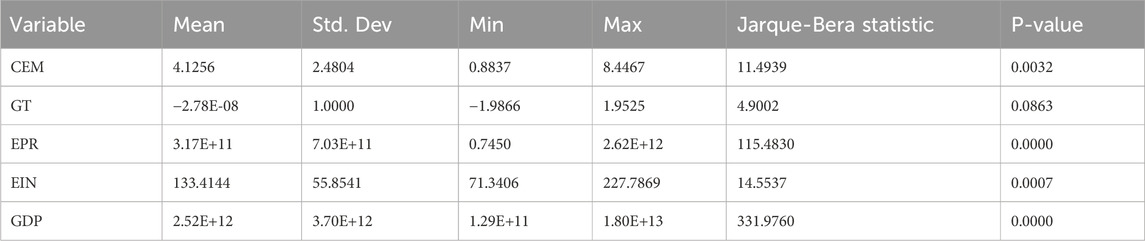
Table 2. Descriptive statistics of the variables.
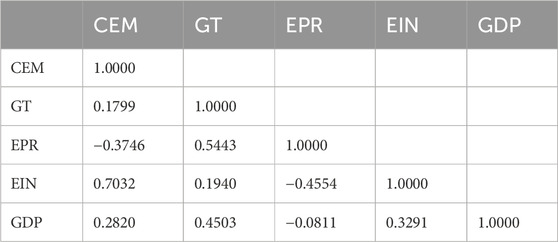
Table 3. Correlation matrix.
The skewness and kurtosis as indicated by the Jarque-Bera statistics show that most variables deviate from normality, supporting the use of non-parametric quantile regression methods.
Table 3 presents the correlation matrix among the key variables. Carbon emissions (CEM) are strongly and positively correlated with energy intensity (EIN) at 0.7032, indicating that countries with higher energy intensity tend to emit more carbon. In contrast, CEM is moderately and negatively correlated with environmental performance (EPR) at −0.3746, suggesting that improved environmental governance is associated with lower emissions. Additionally, green technology (GT) are positively associated with both EPR (0.5443) and GDP (0.4503), underscoring their dual environmental and economic relevance.
The strong statistical association between environmental performance (EPR) and carbon emissions may reflect overlapping constructs, particularly since ecological footprint per capita captures a broad spectrum of environmental pressures—land use, carbon absorption, and resource demand. However, ecological footprint remains one of the most comprehensive and globally comparable metrics, used extensively in environmental sustainability research (Li et al., 2023). It reflects not only emissions but also the systemic capacity of a country to sustain its ecological demand. Nonetheless, we caution that part of the correlation observed may stem from structural overlap with the dependent variable and encourage future research to triangulate EPR with multidimensional indices, such as the Environmental Performance Index (EPI) or planetary boundaries framework.
Table 4 presents the results of the cross-sectional dependence (CSD) test. All variables show significant cross-sectional dependence, with p-values below 0.01. This implies that shocks or policy changes in one G5 country are likely to influence the others, validating the need to account for interdependencies in panel estimations.
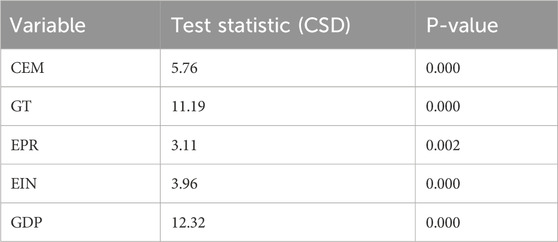
Table 4. Cross-sectional dependence analysis.
Table 5 reports the slope heterogeneity test results. Both the Delta and Adjusted Delta statistics are highly significant (p < 0.01), confirming that the slope coefficients vary across the G5 countries. This heterogeneity reinforces the choice of quantile regression to capture differential effects across emission levels and nations.

Table 5. Slope heterogeneity test.
The slope heterogeneity test (Hashem Pesaran and Yamagata, 2008) confirmed statistically significant differences in slope coefficients across countries. This suggests that the relationships between variables—particularly between GT and CEM or EIN and CEM—are not uniform across G5 economies. For instance, the effect of green technology may be more pronounced in technologically advanced countries like China, while energy intensity may matter more in South Africa’s coal-heavy energy mix. These heterogeneous dynamics imply that policy implications must be country-specific and caution should be exercised when generalizing findings to other economies without accounting for contextual factors such as industrial structure, institutional capacity, and policy enforcement.
Table 6 provides the results of the CIPS unit root test. The findings reveal that all variables are non-stationary at levels [I (0)] but become stationary after first differencing [I (1)]. This justifies the use of cointegration analysis to examine long-term relationships.
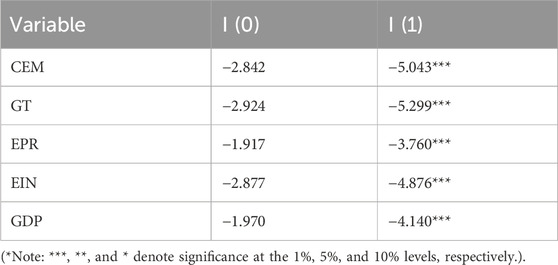
Table 6. CIPS unit root test results.
The results of the Westerlund cointegration test are shown in Table 7. Three of the four test statistics (Gt, Ga, Pt, and Pa) indicate significant cointegration, particularly Gt and Pt, which have p-values of 0.000. This confirms the existence of a stable long-term equilibrium relationship among CEM, GT, EIN, EPR, and GDP.

Table 7. Westerlund cointegration test.
The preliminary diagnostics confirm that the panel data are characterized by cross-sectional dependence and slope heterogeneity, and the variables are integrated of order one with evidence of cointegration. These results validate the application of MMQR for estimating the differential impact of the independent variables on CEM across its conditional distribution, which will be discussed in the subsequent section.
The Method of Moments Quantile Regression (MMQR) results are reported in Table 8, which captures the differential effects of independent variables—green technology (GT), environmental performance (EPR), energy intensity (EIN), and economic growth (GDP)—on carbon emissions (CEM) across various quantiles (0.25, 0.50, 0.75, and 0.90). This approach provides a more nuanced understanding of the emission dynamics across low-, medium-, and high-emission scenarios.
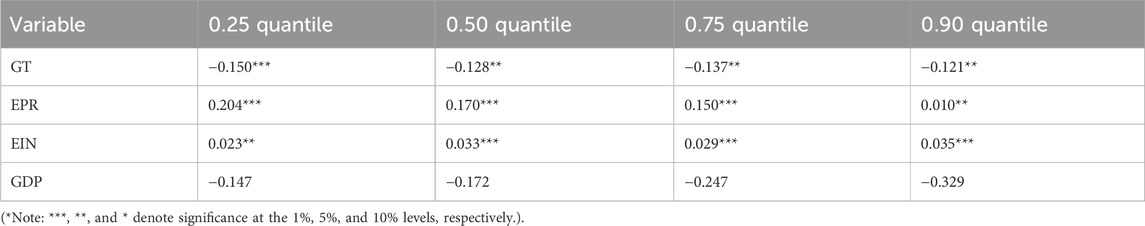
Table 8. MMQR estimation results (dependent variable: CEM).
The MMQR results indicate that green technology have a consistently negative and statistically significant effect on CEM across all quantiles. The strongest effect is observed in the lowest quantile (−0.150), suggesting that green technology adoption is especially effective in reducing emissions in countries or periods with relatively lower emission levels. This highlights the essential role of GT in decarbonization efforts across varying environmental contexts.
Conversely, EPR shows a positive and significant relationship with CEM across all quantiles, although the effect diminishes as emissions increase. This counterintuitive result suggests that current EPR indicators may not be fully capturing the effectiveness of environmental policies, or that higher ecological footprints still coexist with rising emissions in some G5 countries. It reflects the possible gap between policy design and actual implementation.
Energy intensity (EIN) is also positively associated with CEM across all quantiles, with the highest effect seen at the 0.90 quantile (0.035). This finding reinforces the well-established link between inefficient energy use and increased emissions and underscores the urgent need for energy efficiency improvements, especially in high-emission contexts.
Economic growth (GDP), although showing a negative relationship with CEM, does not reach statistical significance at any quantile. This suggests that while some decoupling between growth and emissions may be occurring, it is not yet strong or consistent enough across the G5 countries to yield robust results in this model.
Figure 5 visually presents the quantile-specific impacts of GT, EPR, EIN, and GDP on CEM, with marker symbols indicating the level of statistical significance. The horizontal dashed line represents the zero-impact threshold, clearly distinguishing variables with mitigating versus exacerbating effects on emissions.
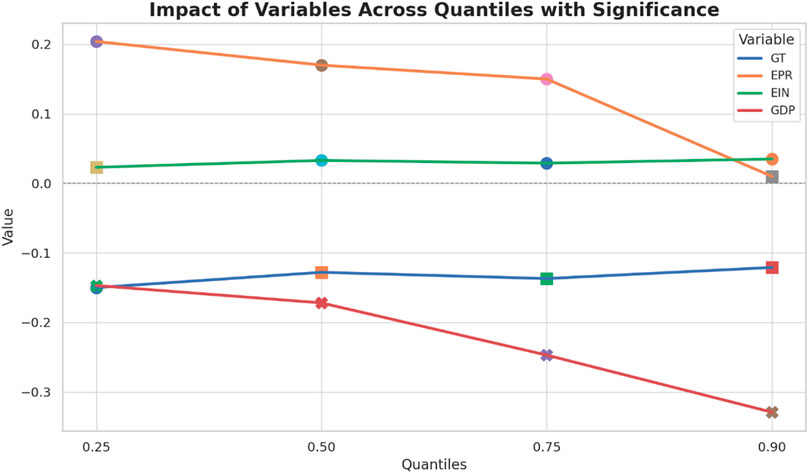
Figure 5. The figure illustrates the relationship of Green Technology (GT), Environmental Performance (EPR), Energy Intensity (EIN), and Economic Growth (GDP) with Carbon Emissions (CEM) across different quantiles (0.25, 0.50, 0.75, 0.90). Marker styles represent the statistical significance of the impact: circles for high significance, squares for moderate significance, diamonds for low significance, and crosses for non-significant effects. The horizontal dashed line indicates the threshold between positive and negative impacts.
To validate the robustness of the MMQR findings, FMOLS and DOLS estimations were performed. Table 9 summarizes the results.
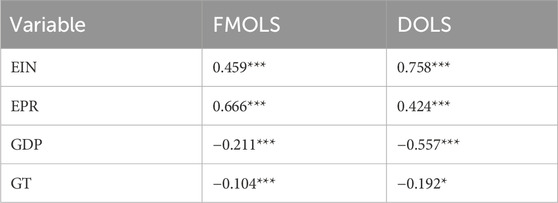
Table 9. Robustness check: FMOLS and DOLS estimation results (dependent variable: CEM).
The robustness checks confirm the primary findings from the MMQR analysis. Both FMOLS and DOLS show that energy intensity significantly increases carbon emissions, reaffirming the need to reduce energy consumption per unit of economic output. Similarly, environmental performance remains positively associated with emissions, although the magnitude is slightly lower in the DOLS estimation. This again raises questions about the adequacy of current environmental performance metrics in driving emission reductions.
GDP shows a statistically significant negative relationship with emissions in both models, indicating that structural economic improvements may facilitate lower emissions in the long run. Lastly, green technology continue to exhibit a negative association with CEM, with stronger effects observed under the DOLS estimation, underscoring the strategic importance of investing in clean technologies for long-term climate mitigation.
Figure 6 illustrates the relationships among variables using DOLS and FMOLS trends, further reinforcing the directional consistency of the results across methodologies.
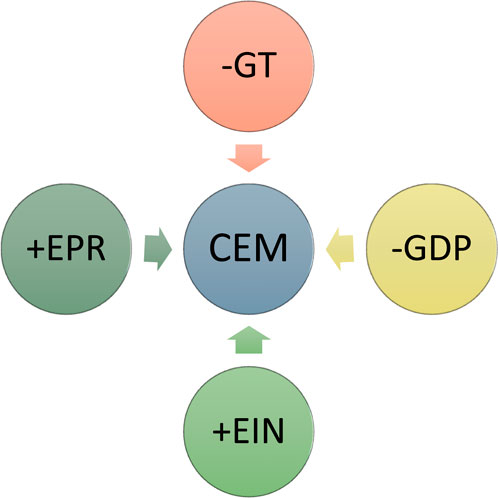
Figure 6. Relationship among variables.
In summary, the empirical results suggest that while energy intensity and environmental performance continue to exert upward pressure on emissions, green technology play a decisive role in emissions reduction. The influence of GDP is more nuanced and context-dependent, suggesting a potential shift toward green growth. These findings underscore the need for more targeted and integrated policies that not only promote clean technology adoption but also enhance the effectiveness of environmental performance measures and energy-use efficiency in emerging economies.
To further investigate the directionality of relationships among the variables, the (Dumitrescu and Hurlin, 2012) Panel Non-Causality Test was conducted. The results, presented in Table 10, reveal statistically significant causal effects from green technology (GT), energy intensity (EIN), environmental performance (EPR), and economic growth (GDP) toward carbon emissions (CEM). In contrast, no evidence was found for reverse causality from CEM to any of these predictors, suggesting a unidirectional causality pattern.
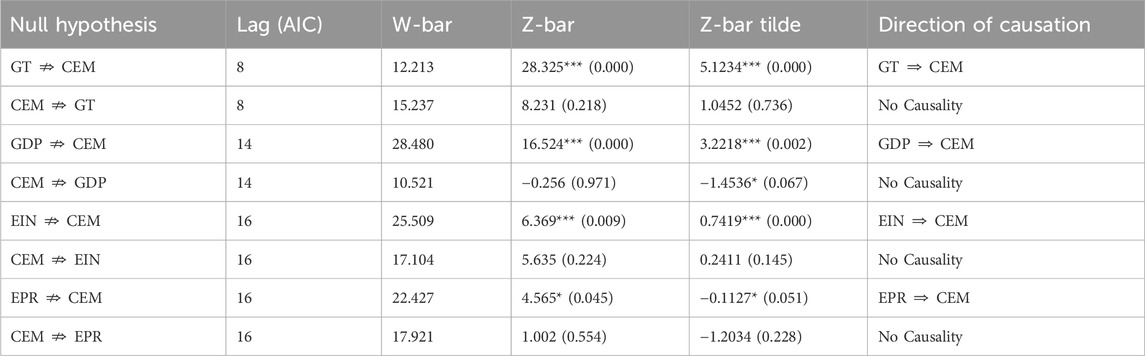
Table 10. Results from Dumitrescu and Hurlin’s (2012) panel non-causality test.
Specifically, GT Granger-causes CEM with strong significance (p < 0.01), confirming that the expansion of green technology significantly contributes to emissions mitigation across the G5 countries. Likewise, GDP shows a significant causal relationship with CEM, indicating that economic activities influence emissions trends—likely reflecting industrial structure, energy usage patterns, and environmental policies. The causal impact of EIN on CEM is also robust, supporting the argument that energy intensity is a key driver of emissions. Finally, EPR exhibits a weaker but still statistically significant causal relationship with emissions, implying that environmental performance—although imperfect—may influence emission dynamics to some extent.
Overall, these results underscore the importance of proactive policy interventions that promote green technology deployment, improve energy efficiency, and strengthen environmental performance frameworks to effectively reduce carbon emissions in emerging economies.
5 Conclusion and policy implications
5.1 Conclusion
This study provides a comprehensive empirical analysis of the determinants of carbon emissions (CEM) in G5 countries—Brazil, China, India, Mexico, and South Africa—over the period 2000 to 2022. Employing the Method of Moments Quantile Regression (MMQR) alongside robust techniques such as FMOLS, DOLS, cointegration analysis, and Granger non-causality testing, the research explores how green technology (GT), energy intensity (EIN), environmental performance (EPR), and economic growth (GDP) shape carbon emission patterns across varying levels of emissions.
The findings consistently demonstrate that the adoption of green technology significantly reduces carbon emissions across all emission quantiles. This reinforces the critical role of clean innovation and eco-friendly patents in facilitating the transition to a low-carbon economy.
However, energy intensity is positively associated with carbon emissions, suggesting that overdependence on energy-intensive production processes remains a substantial barrier to decarbonization. Environmental performance, somewhat counterintuitively, also shows a positive correlation with emissions, which may indicate limitations in the effectiveness or enforcement of environmental policies across the G5. In contrast, GDP shows a negative—though not always statistically significant—relationship with CEM, implying that economic growth may be decoupling from emissions, particularly in high-growth contexts.
The panel Granger causality tests further support these findings, showing unidirectional causal flows from GT, EIN, GDP, and EPR to carbon emissions. These causal relationships confirm that targeted interventions in technology deployment, energy use, and policy enforcement can directly influence emissions outcomes.
Despite its strengths, the study has several limitations. First, the geographic scope is limited to the G5 economies, which—while diverse—do not fully represent other emerging regions such as Southeast Asia or Sub-Saharan Africa. Thus, extrapolating these findings should be done with caution. Second, although the time period (2000–2022) captures important policy shifts, longer-term structural dynamics may require extended datasets as they become available.
Lastly, although the use of Granger causality adds robustness to the directionality of relationships, endogeneity concerns cannot be entirely ruled out, especially given the potential for reverse causality or omitted variable bias in macroeconomic panel data. Future studies may address this using instrumental variable techniques, structural equation modeling, or dynamic panel GMM approaches.
5.2 Policy implications
This study yields several actionable insights for policymakers in the G5 and beyond. The results highlight the nonlinear and heterogeneous impacts of green technology (GT) and energy intensity (EIN) on carbon emissions across different emission quantiles. These findings reinforce the need for context-specific and sector-sensitive strategies, as opposed to uniform policy frameworks.
Country-specific recommendations for the G5 include:
• China and India, as high emitters with expansive industrial and manufacturing sectors, should scale up sectoral green R&D, especially in renewable energy, clean transportation, and smart manufacturing. Expanding national green patent programs, enforcing emission-linked tax incentives, and deploying low-carbon transition funds can accelerate decarbonization. Stronger compliance mechanisms under existing carbon markets (e.g., China’s ETS) should also be considered.
• Brazil should enhance policies that integrate sustainable agriculture technologies, reforestation schemes, and payment for ecosystem services. Aligning agricultural exports with environmental standards (e.g., through green certifications and carbon labelling) could help reduce its ecological footprint and fulfill SDG 12.
• Mexico should adopt targeted demand-side energy reforms, encourage industrial energy audits, and incentivize clean production through tax rebates. Supporting innovation hubs focused on green technology in small and medium-sized enterprises (SMEs) could boost both employment and emissions reductions.
• South Africa, constrained by energy poverty and infrastructure gaps, should invest in grid decentralization, renewable mini-grid deployment, and just transition programs for coal sector workers. Regulatory reforms in energy procurement and capacity building in local green industries are essential.
Beyond the G5, this integrated GT–EIN–EPR policy framework offers transferable value to emerging regions such as Southeast Asia, MENA, and Sub-Saharan Africa. By combining technology adoption, resource efficiency, and environmental performance metrics, countries can tailor their climate strategies based on their unique development stages and institutional capacities.
Furthermore, this study’s quantile-based analysis supports differentiated mitigation pathways: high emitters must pursue aggressive innovation policies, while lower-emitting economies can prioritize early-stage investments in green infrastructure and resilience planning. Adopting ecological footprint indicators in policymaking can improve cross-sector coordination and alignment with SDGs 7, 9, and 13.
5.3 Future research directions
Future research should disaggregate green technology into sector-specific innovations—such as solar photovoltaics, carbon capture, energy-efficient machinery, or circular economy practices—to assess their individual impact on emissions. Moreover, studies could evaluate the effectiveness of major environmental policy reforms over time, such as green bond frameworks, carbon pricing mechanisms, and green credit guidelines. Longitudinal models or dynamic panel approaches (e.g., GMM or panel VAR) may offer deeper insight into the temporal effects of these interventions. Incorporating institutional quality and governance effectiveness into such analyses can further clarify how policy design influences the success of green transitions.
5.4 Limitations
The focus on the G5 countries limits the generalizability of the results to other regions or countries with different economic and environmental contexts. One key limitation of the study is the use of the 2000–2022 period, which, while not extremely short, may exclude earlier dynamics. However, this time frame was deliberately selected due to data availability constraints, especially for variables like green technology patents and ecological footprint, which are not consistently available prior to 2000 across all G5 countries. Moreover, the selected period captures the most transformative era in climate policy and green innovation—from the Kyoto Protocol’s implementation through to post-Paris Agreement responses. Including older data may introduce measurement inconsistencies and dilute the policy relevance of the findings.
Another limitation is the generalizability of findings beyond the G5 context. While the G5 countries represent diverse emerging economies, policy applications in other regional blocs may require recalibration based on local institutional and energy dynamics.
Nevertheless, this study offers three key contributions. First, it integrates GT, EIN, EPR, and GDP into a unified empirical framework, a rare approach in existing literature. Second, it applies the MMQR estimator to assess how these variables influence carbon emissions across quantiles, capturing heterogeneity in a way that mean-based models cannot. Third, it aligns econometric findings with targeted, SDG-linked policy implications, making it relevant for both researchers and decision-makers.
These innovations address the literature gap concerning multidimensional, country-level analyses of emission drivers using robust econometric techniques within emerging economies. Prior studies have tended to isolate variables or overlook nonlinearity—limitations that this paper directly confronts.
Data availability statement
The original contributions presented in the study are included in the article/supplementary material, further inquiries can be directed to the corresponding author.
Author contributions
QH: Formal Analysis, Funding acquisition, Writing – review and editing, Validation, Investigation. RA: Writing – original draft.
Funding
The author(s) declare that no financial support was received for the research and/or publication of this article.
Conflict of interest
The authors declare that the research was conducted in the absence of any commercial or financial relationships that could be construed as a potential conflict of interest.
Generative AI statement
The author(s) declare that Generative AI was used in the creation of this manuscript. The language of the manuscript was improved with the assistance of ChatGPT, an AI-based language model. The authors take full responsibility for the content, interpretations, and any remaining errors in the manuscript.
Publisher’s note
All claims expressed in this article are solely those of the authors and do not necessarily represent those of their affiliated organizations, or those of the publisher, the editors and the reviewers. Any product that may be evaluated in this article, or claim that may be made by its manufacturer, is not guaranteed or endorsed by the publisher.
References
Ali, N., Phoungthong, K., Techato, K., Ali, W., Abbas, S., Dhanraj, J. A., et al. (2022). FDI, green innovation and environmental quality nexus: new insights from BRICS economies. Sustainability 14 (4), 2181. doi:10.3390/SU14042181
Alomair, A., Ibrahim, R. L., and Al Naim, A. S. (2025). Natural resources heterogeneity and environmental sustainability in G20 nations: post-COP28 analysis. Front. Environ. Sci. 12. doi:10.3389/fenvs.2024.1524350
Apergis, N. (2016). Environmental kuznets curves: new evidence on both panel and country-level CO2 emissions. Energy Econ. 54, 263–271. doi:10.1016/j.eneco.2015.12.007
Barbhuiya, S., Das, B. B., and Adak, D. (2024). A comprehensive review on integrating sustainable practices and circular economy principles in concrete industry. J. Environ. Manag. 370, 122702. doi:10.1016/J.JENVMAN.2024.122702
Barra, C., and Falcone, P. M. (2024). Environmental performance of countries. Examining the effect of diverse institutional factors in a metafrontier approach. Socio-Economic Plan. Sci. 95, 101972. doi:10.1016/J.SEPS.2024.101972
Bashir, M., Benjiang, M., Shahbaz, M., and Shahzad, U. (2021). Unveiling the heterogeneous impacts of environmental taxes on energy consumption and energy intensity: empirical evidence from OECD countries. Energy 226, 120366. doi:10.1016/j.energy.2021.120366
Bilgili, F., Koçak, E., and Bulut, Ü. (2016). The dynamic impact of renewable energy consumption on CO2 emissions: a revisited environmental Kuznets curve approach. Renew. Sustain. Energy Rev. 54, 838–845. doi:10.1016/j.rser.2015.10.080
Chen, R., Ramzan, M., Hafeez, M., and Ullah, S. (2023). Green innovation-green growth nexus in BRICS: does financial globalization matter? J. Innovation Knowl. 8 (1), 100286. doi:10.1016/j.jik.2022.100286
Chen, S., and Yang, Q. (2024). Renewable energy technology innovation and urban green economy efficiency. J. Environ. Manag. 353, 120130. doi:10.1016/j.jenvman.2024.120130
Chien, F. S., Hsu, C. C., Moslehpour, M., Sadiq, M., Tufail, B., and Ngo, T. Q. (2023). A step toward sustainable development: the nexus of environmental sustainability, technological advancement and green finance: evidence from Indonesia. Environ. Dev. Sustain. 26, 11581–11602. doi:10.1007/s10668-023-03424-5
Department of Economic and Social Affairs (2025). Goal 13 Take urgent action to combat climate change and its impacts. Available online at: https://sdgs.un.org/goals/goal13 (Accessed July 9, 2025).
Dhayal, K. S., Giri, A. K., Agrawal, R., Agrawal, S., Samadhiya, A., and Kumar, A. (2025). Do the innovative technological advancements foster the green transition pathways for industry 5.0? A perspective toward carbon neutrality. Benchmarking Int. J. doi:10.1108/BIJ-04-2024-0330
Dong, M., Li, C., and Sampene, A. K. (2025). Exploring the impact of green finance, technological innovation, mineral resources, and carbon tax on the green energy transition. Smart Energy 19, 100189. doi:10.1016/J.SEGY.2025.100189
Dong, X., and Yu, M. (2024). Green bond issuance and green innovation: evidence from China’s energy industry. Int. Rev. Financial Analysis 94, 103281. doi:10.1016/j.irfa.2024.103281
Duan, N. (2025). The quest for balance: the journey of energy, environment and sustainable development. Energy and Environ. Sustain. 1 (1), 100001. doi:10.1016/j.eesus.2024.12.001
Dumitrescu, E. I., and Hurlin, C. (2012). Testing for granger non-causality in heterogeneous panels. Econ. Model. 29 (4), 1450–1460. doi:10.1016/j.econmod.2012.02.014
Feng, Y., Chen, J., and Luo, J. (2024). Life cycle cost analysis of power generation from underground coal gasification with carbon capture and storage (CCS) to measure the economic feasibility. Resour. Policy 92, 104996. doi:10.1016/j.resourpol.2024.104996
Feulner, G. (2015). Global challenges: climate change. Glob. Challenges 1 (1), 5–6. doi:10.1002/GCH2.1003
Guo, Q., Abbas, S., AbdulKareem, H. K. K., Shuaibu, M. S., Khudoykulov, K., and Saha, T. (2023). Devising strategies for sustainable development in Sub-Saharan Africa: the roles of renewable, non-renewable energy, and natural resources. Energy 284, 128713. doi:10.1016/j.energy.2023.128713
Ha, L. T., Huong, T. T. L., and Thanh, T. T. (2022). Is digitalization a driver to enhance environmental performance? An empirical investigation of European countries. Sustain. Prod. Consum. 32, 230–247. doi:10.1016/j.spc.2022.04.002
Han, J., Raghutla, C., Chittedi, K. R., Tan, Z., and Koondhar, M. A. (2022). How natural resources affect financial development development? Fresh evidence from top-10 natural resouce abundant countries. Resour. Policy 76, 102647. doi:10.1016/J.RESOURPOL.2022.102647
Hashem Pesaran, M., and Yamagata, T. (2008). Testing slope homogeneity in large panels. J. Econ. 142 (1), 50–93. doi:10.1016/j.jeconom.2007.05.010
Jia, Z., Alharthi, M., Haijun, T., Mehmood, S., and Hanif, I. (2024). Relationship between natural resources, economic growth, and carbon emissions: the role of fintech, information technology and corruption to achieve the targets of COP-27. Resour. Policy 90, 104751. doi:10.1016/j.resourpol.2024.104751
Kashif, M., Ullah, A., Ullah, S., and Qian, N. (2024). Towards a greener future: the impact of financial technology (FinTech) and climate finance on ecological sustainability. J. Environ. Manag. 370, 122876. doi:10.1016/J.JENVMAN.2024.122876
Khezri, M., Karimi, M. S., Khan, Y. A., and Abbas, S. Z. (2021). The spillover of financial development on CO2 emission: a spatial econometric analysis of Asia-Pacific countries. Renew. Sustain. Energy Rev. 145, 111110. doi:10.1016/j.rser.2021.111110
Lan, J., Kakinaka, M., and Huang, X. (2012). Foreign direct investment, human capital and environmental pollution in China. Environ. Resour. Econ. 51 (2), 255–275. doi:10.1007/S10640-011-9498-2
Li, X., Wang, F., Al-Razgan, M., Mahrous Awwad, E., Zilola Abduvaxitovna, S., Li, Z., et al. (2023). Race to environmental sustainability: can structural change, economic expansion and natural resource consumption effect environmental sustainability? A novel dynamic ARDL simulations approach. Resour. Policy 86, 104044. doi:10.1016/j.resourpol.2023.104044
Lin, D., Wackernagel, M., Galli, A., and Kelly, R. (2015). Ecological footprint: informative and evolving–A response to Van den bergh and grazi (2014). Ecol. Indic. 58, 464–468. doi:10.1016/j.ecolind.2015.05.001
Liu, S., Padhan, H. P. J., Jose, A., and Rahut, D. (2024). Do green trade and technology-oriented trade affect economic cycles? Evidence from the Chinese provinces. Technol. Forecast. Soc. Change 202, 123334. doi:10.1016/J.TECHFORE.2024.123334
Luo, S., Chishti, M. Z., Beata, S., and Xie, P. (2024). Digital sparks for a greener future: unleashing the potential of information and communication technologies in green energy transition. Renew. Energy 221, 119754. doi:10.1016/J.RENENE.2023.119754
Lv, Z., Chen, L., Ali, S. A., Muda, I., Alromaihi, A., and Boltayev, J. Y. (2024). Financial technologies, green technology and natural resource nexus with sustainable development goals: evidence from resource abundant economies using MMQR estimation. Resour. Policy 89, 104649. doi:10.1016/J.RESOURPOL.2024.104649
Maasoumi, E., Heshmati, A., and Lee, I. (2021). Green innovations and patenting renewable energy technologies. Empir. Econ. 60 (1), 513–538. doi:10.1007/S00181-020-01986-1
Machado, J. A. F., and Santos Silva, J. M. C. (2019). Quantiles via moments. J. Econ. 213 (1), 145–173. doi:10.1016/J.JECONOM.2019.04.009
Mehmood, K., Tauseef Hassan, S., Qiu, X., and Ali, S. (2024). Comparative analysis of CO2 emissions and economic performance in the United States and China: navigating sustainable development in the climate change era. Geosci. Front. 15 (5), 101843. doi:10.1016/J.GSF.2024.101843
Mohd Suki, N., Mohd Suki, N., Afshan, S., Sharif, A., Ariff Kasim, M., and Rosmaini Mohd Hanafi, S. (2022). How does green technology innovation affect green growth in ASEAN-6 countries? Evidence from advance panel estimations. Gondwana Res. 111, 165–173. doi:10.1016/j.gr.2022.06.019
Pesaran, M. H. (2006). Estimation and inference in large heterogeneous panels with a multifactor error structure. Econometrica 74 (4), 967–1012. doi:10.1111/J.1468-0262.2006.00692.X
Rafei, M., Esmaeili, P., and Balsalobre-Lorente, D. (2022). A step towards environmental mitigation: how do economic complexity and natural resources matter? Focusing on different institutional quality level countries. Resour. Policy 78, 102848. doi:10.1016/j.resourpol.2022.102848
Raihan, A., and Tuspekova, A. (2022). Dynamic impacts of economic growth, energy use, urbanization, agricultural productivity, and forested area on carbon emissions: new insights from Kazakhstan. World Dev. Sustain. 1, 100019. doi:10.1016/J.WDS.2022.100019
Ren, Z., and Zhu, Y. (2025). The trade-off between middle class and ecological footprint: empirical cross-country analysis. Ecol. Econ. 235, 108631. doi:10.1016/j.ecolecon.2025.108631
Sachs, J. D., Kroll, C., Lafortune, G., Fuller, G., and Woelm, F. (2022). Sustainable development report 2022. doi:10.1017/9781009210058
Sarkodie, S. A. (2021). Environmental performance, biocapacity, carbon and ecological footprint of nations: drivers, trends and mitigation options. Sci. Total Environ. 751, 141912. doi:10.1016/j.scitotenv.2020.141912
Shahbaz, M., Raghutla, C., Chittedi, K. R., Jiao, Z., and Vo, X. V. (2020). The effect of renewable energy consumption on economic growth: evidence from the renewable energy country attractive index. Energy 207, 118162. doi:10.1016/j.energy.2020.118162
Sheng Yin, X., and Hussain, J. (2021). The implication of technological innovation and tourism development on FDI-growth-environment nexus in association of Southeast Asian countries: a simultaneity modeling analysis. Energy Sources, Part B Econ. Plan. Policy 16, 878–902. doi:10.1080/15567249.2021.1971801
IPCC (2025). Sixth Assessment Report. Available online at: https://www.ipcc.ch/assessment-report/ar6/.
UNCTAD (2024). Statistics and data. Available online at: https://unctad.org/statistics.
Sun, R. S., Gao, X., Deng, L. C., and Wang, C. (2022). Is the paris rulebook sufficient for effective implementation of paris agreement? Adv. Clim. Change Res. 13 (4), 600–611. doi:10.1016/J.ACCRE.2022.05.003
Tsvetkov, P., Samuseva, P., and Nikolaychuk, L. (2024). The research of the impact of energy efficiency on mitigating greenhouse gas emissions at the national level. Energy Convers. Manag. 314, 118671. doi:10.1016/J.ENCONMAN.2024.118671
Tufail, M., Song, L., Adebayo, T. S., Kirikkaleli, D., and Khan, S. (2021). Do fiscal decentralization and natural resources rent curb carbon emissions? Evidence from developed countries. Environ. Sci. Pollut. Res. 28 (35), 49179–49190. doi:10.1007/S11356-021-13865-Y
Ulucak, R., and Ozcan, B. (2020). Relationship between energy consumption and environmental sustainability in OECD countries: the role of natural resources rents. Resources Policy 69, 101803. doi:10.1016/j.resourpol.2020.101803
WDI. (2019). World development indicators. World Bank. Available online at: https://databank.worldbank.org/indicator/NY.GDP.PCAP.CD/%201ff4a498/%20Popular-Indicators.
Weko, S., and Goldthau, A. (2022). Bridging the low-carbon technology gap? Assessing energy initiatives for the global south. Energy Policy 169, 113192. doi:10.1016/J.ENPOL.2022.113192
Wen, J., Okolo, C. V., Ugwuoke, I. C., and Kolani, K. (2022). Research on influencing factors of renewable energy, energy efficiency, on technological innovation. Does trade, investment and human capital development matter? Energy Policy 160, 112718. doi:10.1016/j.enpol.2021.112718
Westerlund, J., and Edgerton, D. L. (2008). A simple test for cointegration in dependent panels with structural breaks. Oxf. Bull. Econ. Statistics 70 (5), 665–704. doi:10.1111/j.1468-0084.2008.00513.x
Xia, W., Zheng, S., Qiu, L., Hu, H., Chen, Y., Wei, S., et al. (2025). Evolution of the innovation network of lithium-ion battery recycling technologies in China from the perspective of patents. Pol. J. Environ. Stud. doi:10.15244/pjoes/203046
Xu, A., Dai, Y., Hu, Z., and Qiu, K. (2025). Can green finance policy promote inclusive green growth? based on the quasi-natural experiment of China’s green finance reform and innovation pilot zone. Int. Rev. Econ. and Finance 100, 104090. doi:10.1016/j.iref.2025.104090
Xu, P., Hussain, M., Ye, C., Wang, J., Wang, C., Geng, J., et al. (2022). Natural resources, economic policies, energy structure, and ecological footprints’ nexus in emerging seven countries. Resour. Policy 77, 102747. doi:10.1016/J.RESOURPOL.2022.102747
Zhang, D., and Vigne, S. A. (2021). The causal effect on firm performance of China’s financing–pollution emission reduction policy: firm-level evidence. J. Environ. Manag. 279, 111609. doi:10.1016/j.jenvman.2020.111609
Keywords: environmental performance, carbon emissions, energy intensity, economic growth, green grow
Citation: Hao Q and Arshad R (2025) Exploring carbon emission drivers in G5 economies: the interplay of green technology, environmental performance, energy intensity, and economic growth. Front. Environ. Sci. 13:1640946. doi: 10.3389/fenvs.2025.1640946
Received: 04 June 2025; Accepted: 21 July 2025;
Published: 12 August 2025.
Edited by:
Kentaka Aruga, Saitama University, JapanReviewed by:
Esther M. Folarin, Covenant University, NigeriaJaime Moll de Alba, United Nations Industrial Development Organization, Austria
Copyright © 2025 Hao and Arshad. This is an open-access article distributed under the terms of the Creative Commons Attribution License (CC BY). The use, distribution or reproduction in other forums is permitted, provided the original author(s) and the copyright owner(s) are credited and that the original publication in this journal is cited, in accordance with accepted academic practice. No use, distribution or reproduction is permitted which does not comply with these terms.
*Correspondence: Rimsha Arshad, cmltc2hhYXJzaGFkMzEzQHlhaG9vLmNvbQ==