 Christina Zeuner
 Jana Levison
 Marie Larocque
- 1Department of Civil, Environmental and Water Resources Engineering, School of Engineering, Morwick G360 Groundwater Research Institute, University of Guelph, Guelph, ON, Canada
- 2Departement des sciences de la Terre et de l’atmosphere, Université du Québec à Montréal, Montreal, QC, Canada
Nitrogen is necessary for successful crop growth, but excess nitrogen in water has implications for both environmental and human health. The factors driving these impacts and their extent remain incompletely understood. In particular, how average nitrogen concentrations compare to concentrations following intense rain events is not well known, partly due to the challenges of building spatially and temporally realistic concentration datasets. Thus, the aim of this study was to investigate hydraulic and nutrient dynamics in a sand plain aquifer system in the Laurentian Great Lakes Basin (north of Lake Erie in Ontario, Canada) through monthly and sub-daily groundwater and surface water sampling to contextualize storm event responses. A study was conducted across the Lower Whitemans Creek (LWC) subcatchment and at a field scale site. Spatial and temporal variations in nitrate concentrations and field parameters were measured in groundwater and surface water monthly from October 2021 to November 2024. Event-based sampling campaigns were conducted using either an ISCO autosampler with a 2-hr interval (in November 2022 and March 2023) or SUNA/EXO monitoring stations with a monitoring interval of 15-60 min (at varying times during October 2022 to November 2024). The results showed that shallow groundwater loaded with NO3-N discharging to small creeks is apparently a notable contributor to elevated levels in Whitemans Creek. It was also observed that the high sampling frequency, carried out via in-situ monitoring equipment, provided marked advantages over automated grab sampling methods. The study highlights the benefits and limitations associated with the different sampling methods to guide future research related to nitrogen quantification, including enhancing the sampling procedures and dataset collection approaches.
1 Introduction
Nutrients (e.g., nitrogen and phosphorous) are crucial for plant growth. However, when in excess, they can have negative impacts on the environment such as eutrophication of surface water bodies, and they can bring human health concerns. Chronic elevated nitrogen in the form of nitrate (NO3-N) in drinking water represents a critical health concern given its link to methemoglobinemia, thyroid disease, and certain cancers (Ward et al., 2018). The World Health Organization suggests <50 mg NO3−/L in drinking water, while in Canada the drinking water standard is 45 mg NO3−/L (10 mg NO3-N/L) (World Health Organization, 2021; Health Canada, 2013). Nitrate can enter drinking water through many pathways such as biological fixation, wastewater treatment, and agricultural practices, with the latter being the most prevalent in groundwater resources (Health Canada, 2013). Nitrate concentrations generally are increasing across the globe with a noted common tie to agricultural fertilizers and pesticides (Abascal et al., 2022). Approximately half of the global population uses groundwater for domestic purposes (United Nations, 2022) while in Canada, 30% of people depend on groundwater to supply their needs, mostly in rural areas (ECCC, 2013).
Beyond regulations for drinking water for human health, aquatic environments and the species therein are also sensitive to long-term exposure to high NO3-N concentrations. Recognizing and assessing the ecological risk alongside human health impacts from nonpoint source contamination, as is the case with NO3-N from agricultural practices, have recently been highlighted as needing further consideration (Wang, et al., 2023). Additionally, there is growing recognition of the importance of groundwater as a biodiverse ecosystem (Saccò et al., 2024) and the lack of knowledge on how stressors, such as elevated NO3-N, are impacting these systems (Castaño-Sánchez et al., 2020). Currently, it is recommended by the (CCME, 2012) that NO3-N concentrations in freshwater do not exceed 3.0 mg/L (long-term exposure) and 124 mg/L (short-term <96 h) for the health of aquatic life (CCME, 2012).
While many studies have focused on nonpoint source loading to streams to understand the contamination sources and flow paths, and to determine the most suitable mitigation efforts for protecting available water resources (e.g., Rixon et al., 2024; Pohle et al., 2021; Zhi and Li, 2020), the complexity of groundwater-surface water systems require prioritizing different contaminants and pathways depending on region (Wang et al., 2023). Geological factors such as groundwater flow in sandy and fractured bedrock aquifers, in combination with fertilization practices result in the need for a site-by-site basis assessment approach (Gardner et al., 2020). Meteorological factors such as the intensity and frequency of precipitation events in areas with shallow groundwater can induce varying response times at different locations within the same watershed (Gootman and Hubbart, 2021). Seasonal events such as spring snow melts and those associated with agricultural land use (Irvine et al., 2019) or tile drain flow (Speir et al., 2021) can cause spatiotemporal spikes in NO3-N. Other critical factors influencing NO3-N concentrations and transport have been identified as site location and crop cover (Elsayed et al., 2025), slope and existence of preferential groundwater paths (Shabaga and Hill, 2010), variability in riparian buffer zones (Nsenga Kumwimba et al., 2023), or presence of wetlands (Crossley et al., 2025). Many studies have demonstrated the connection of algae blooms in lakes to the intensive agricultural practices surrounding the Great Lakes (Bosse et al., 2024; Crossman and Weisener, 2020; Watson et al., 2016). In rural Ontario (Canada), the concentrations of NO3-N within the Grand River watershed have been recognized as an important issue for cold water salmonid species (Anderson, 2021; CCME, 2017; Ivey, 2024).
Additionally, the increasing variability in meteorological conditions leads to more intense storms and droughts, more frequent freeze and thaw events, and significant shifts in seasonal weather (Allan et al., 2020). Much of Canada is impacted by climate change in various ways including increased temperatures and more frequent extreme precipitation events. For the agricultural sector in southwestern Ontario specifically, the combination of extensive crop production, shallow aquifers, and changing groundwater recharge patterns can negatively impact potable water resources (Bhatti et al., 2021). In agricultural settings with shallow water tables, nitrate transport has been shown to increase in wet seasons as well as during and following large flow events (Williams et al., 2015). Potential nitrate contamination of groundwater and surface water can thus be exacerbated by rapid transport through sandy, overburden aquifers with intensive agriculture (Gardner et al., 2020; Saleem et al., 2020). As large hydrometeorological events become more frequent, increases in nitrate concentrations in surface water and groundwater are expected (Bhatti et al., 2021; Costa et al., 2022; Shephard et al., 2014). Measuring NO3-N can be done on samples brought to a laboratory (off site), at the sampling location (on site), or directly in the waterbody of interest (in situ) through manual collection of grab samples at low frequency (e.g., monthly samples and short sampling campaigns; e.g., Venkiteswaran et al., 2019). The use of autosamplers provides a means for intermediate frequency (e.g., 4–8 h intervals, Biagi et al. (2022); rise-peak-fall of event hydrograph; May et al. (2023)). In situ sampling for NO3-N can be done using spectrophotometry with submersible sensors (e.g., Crossley et al., 2025; Speir et al., 2021; Wollheim et al., 2017). Fouling issues are frequently reported as a limitation to this technique, but solutions have been reported (e.g., Liu et al., 2019). Solid-state potentiometric probes using in situ nitrate-selective electrodes provide an energy-efficient alternative (Cuartero and Crespo, 2018; Forrest et al., 2022). These techniques have different advantages and limitations which present specific challenges in the study of NO3-N transport in agricultural watersheds, requiring further study to improve understanding.
The goal of this research was to better understand NO3-N transport in an agriculturally intense, sandy aquifer at different spatial and temporal scales, using field instrumentation and a variety of sampling techniques, including examining responses from storm events. The specific objectives were to: (1) determine surface water and shallow groundwater quality trends across the subcatchment; (2) evaluate the influence of storm events on nitrate concentrations in groundwater and surface water; and (3) identify the strengths and weaknesses of different methods to optimize data collection approaches. This work was carried out using the Lower Whitemans Creek (LWC), a sub-catchment of the Grand River, as a field-based case study in a shallow, sandy aquifer system in southwester Ontario, Canada.
2 Site description
2.1 Land use
The Whitemans Creek subcatchment (Figure 1) was originally home to the Attiwandaronk First Nations (pop. 5,000) until conflict with the Iroquois in 1,653 (Dunham, 1945; Earthfx, 2018). In 1793, European settlers established the township of Burford as it was seen as ideal land for both plant and animal agriculture. Approximately 75% of the land was cleared to produce hay (20%), fall wheat (19%), pasture (16%), spring wheat (8.5%), oats (9.5%), corn (4%), and the remainder specialty crops (Reville, 1883). From the 1950s to the 1970s, across the entire Whitemans Creek sub-watershed, the main cash crop was corn, and the main specialty crop was tobacco. From 2011 to 2015, almost 30% of the area was used to grow corn, around 20% was used for soybeans. Overall, around 75% of the land was used for agricultural purposes (Earthfx, 2018). Most recently, LWC is intensively farmed for cash crops, hay, and specialty crops. From 2020 to 2023, in the Lower Whitemans Creek sub-catchment (64 km2) land used for agriculture (46 km2; Figure 1A) consists of mostly corn-soybean (36%), corn-soybean-winter wheat/rye (20%), and continual corn (10%) with the remaining 33% used for pasture and mixed crops such as potatoes, ginseng, tobacco, and rye (AAFC, 2023). Liu et al. (2021) showed legacy nitrogen stored in soils (82%–92%) and groundwater (6%–18%) to range from 705 to 1,071 kg N/ha. Historically, the nitrogen surplus in Whitemans Creek was between 40–50 kg/ha/yr (2000–2016) (Liu et al., 2021).
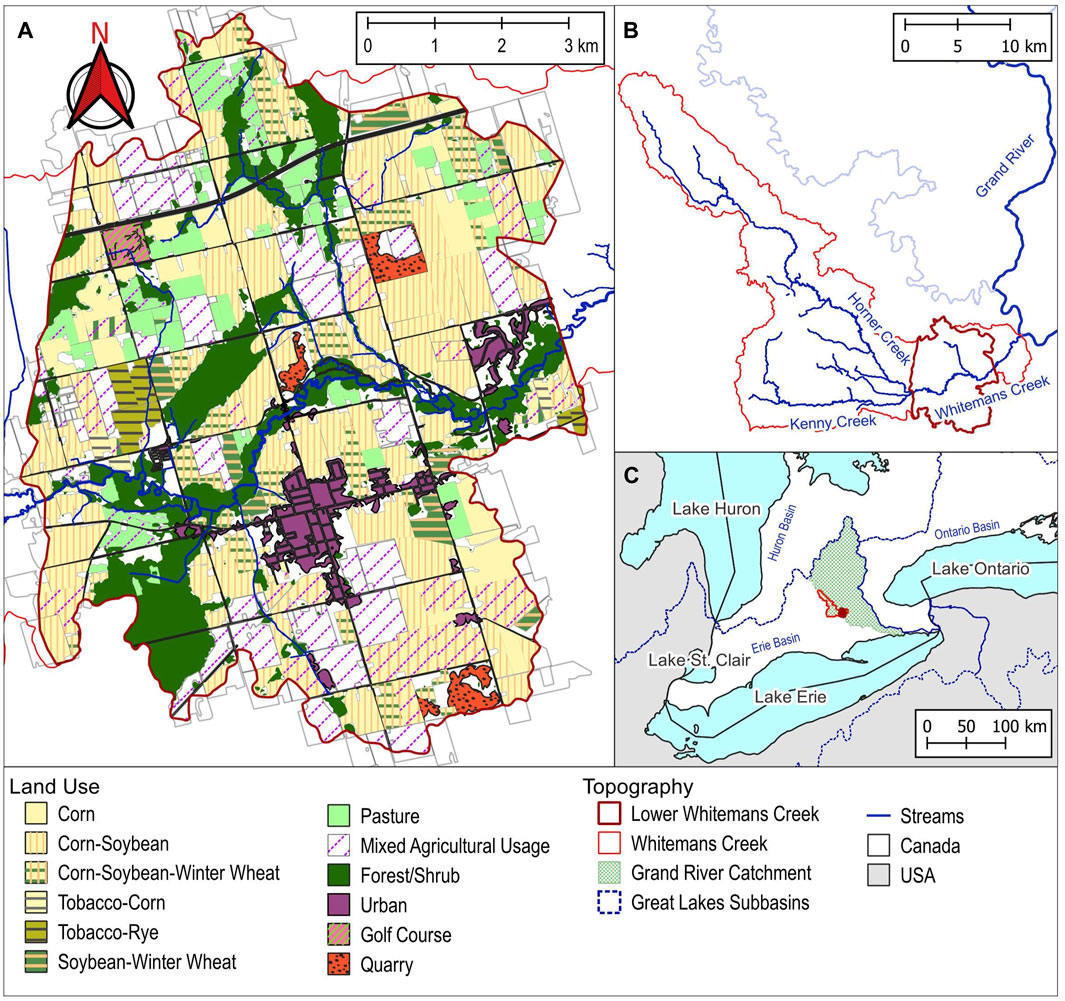
Figure 1. Map of the study area. (A) LWC catchment and land use (AAFC, 2023); (B) location of LWC within the larger Whitemans Creek catchment; and (C) location in southwestern Ontario, Canada.
2.2 Hydrology
Whitemans Creek is a 6th order stream with many tributaries contributing to its flow within the LWC sub-catchment. Upstream of the inlet, the confluence of Horner Creek (5th order) and Kenny Creek (4th order) combine as the main surface water contributions (Figures 2A,B). Both locations have bridges near the confluence, providing an ideal location for stage and discharge measurements for the study, as opposed to the inlet directly, where flooding over the banks is a common occurrence. There are one 3rd order stream, eight 2nd order and ten 1st order tributaries contributing to the surface water discharge measured at the Ontario Provincial (Stream) Water Quality Monitoring (PWQMN) water gauging station (Mt. Vernon, 02GB002; Figure 2D) (ECCC, 2024).
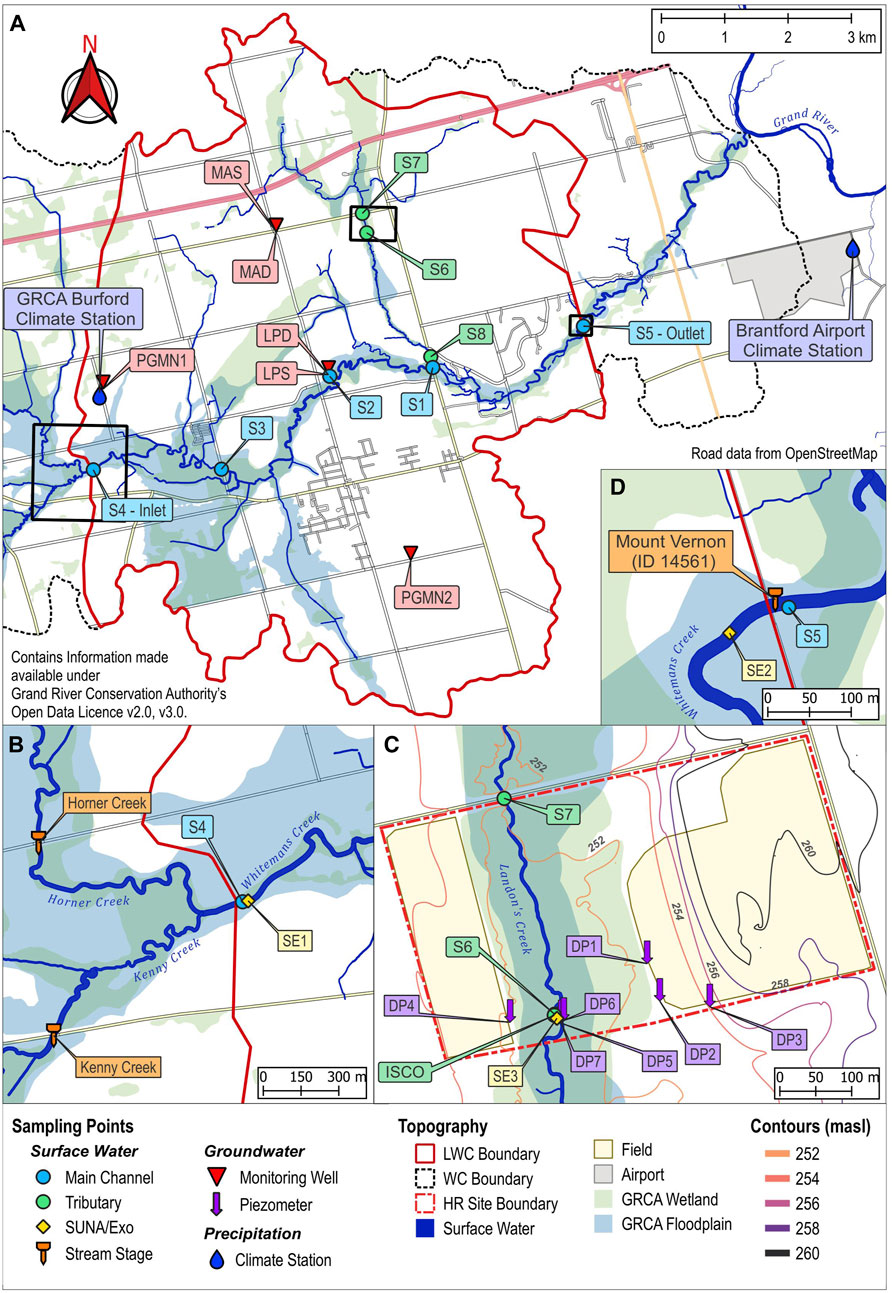
Figure 2. Sampling locations withing the Lower Whitemans Creek subcatchment (A) overview of the site with surface water and groundwater monitoring stations, (B) inlet location with upstream locations of the bridge-mounted ultrasonic sensors, (C) high resolution site, and (D) the outlet station.
The PWQMN has a long-term monitoring station for water quality located at the outlet of LWC (Figure 2D, near S5) with records from 1980 covering a range of variables including nitrate, chloride, electrical conductivity, and pH (Kaltenecker, 2023). Stage and discharge are available for Whitemans Creek (Figure 2D, near S5; 02GB008) since 1961 (ECCC, 2024). Using daily discharge from the Mt. Vernon station the average discharge at the outlet was 4.28 m3/s (maximum 41.60 m3/s, minimum 0.35 m3/s; Oct. 2021 to Nov. 2024). Discharge at the outlet was typically highest in winter and spring, relating to snow melt, while the lowest discharge consistently occurred in the early fall (ECCC, 2024). Larocque et al. (2019) estimated baseflow between 0.34 and 1.25 m3/s from baseflow separation using a digital filter (Larocque et al., 2019) and 0.49 m3/s using an integrated SWAT-MODFLOW model. Considering that a gain of surface discharge occurs between the inlet and outlet of 1.54 m3/s (Osman, 2017), approximately 32% of Whitemans Creek surface water discharge occurring between the inlet and outlet is baseflow. Additionally, during the study period (Oct. 2021 to Nov. 2024), Whitemans Creek was found to only freeze over at the inlet (S4) and S3 while Landon’s Creek was never frozen, indicating that Landon’s Creek (Figure 2) is receiving groundwater during the winter season.
2.3 Geology and hydrogeology
The geology of LWC is characterized by the Norfolk Sand Plain–sandy soil, rapid infiltration, shallow water table–and the flatter southern part of the Horseshoe Moraines (Chapman and Putman, 1984; Chapman and Putnam, 2007). The Brunicolic gray-brown luvisol soil has been described as rapidly drained, loam to silt loam containing gravel in the first 20 cm, underlain by gravelly clay loam to 75 cm below ground level (bgl) (Acton, 1989; Janzen, 2018). Well drained (66%) and imperfectly drained (14%) soils comprise most of the cultivated fields while poor and very poorly drained soils (16%; 4% undefined) are in forested and riparian areas of the catchment (Acton et al., 1998; CanSIS, 2014). Tile drained fields in LWC make up just 5% of the total land used for plant agriculture (Ontario Ministry of Agriculture, 2025). Finally, within LWC, 85% of the land is classified as having predominantly nearly level/very gentle slopes (0.3°–3°), 10% as moderate (5°–8.5°), and 1.5% as strong slopes, with the steepest slope found on the north bank of Whitemans Creek at the outlet (S5, Figures 2D).
Surficial geology consists mainly of gravel and sand with small silt to sandy silt areas in the southwest and is underlain by Upper Silurian bedrock (Larocque et al., 2019; Chapman and Putnam, 2007; Osman, 2017). Geological cross-sections show an unconfined aquifer (maximum thickness of 15 m in certain areas; Figure 3) characterized by the coarse sand and gravel of the Grand River valley outwash (AFA2) and the gravelly fine sand of the Upper Erie Phase aquifer (AFB1). Silty to clayey till (ATB1, ATB2) underlay the superficial aquifer (Bajc and Dodge, 2011).
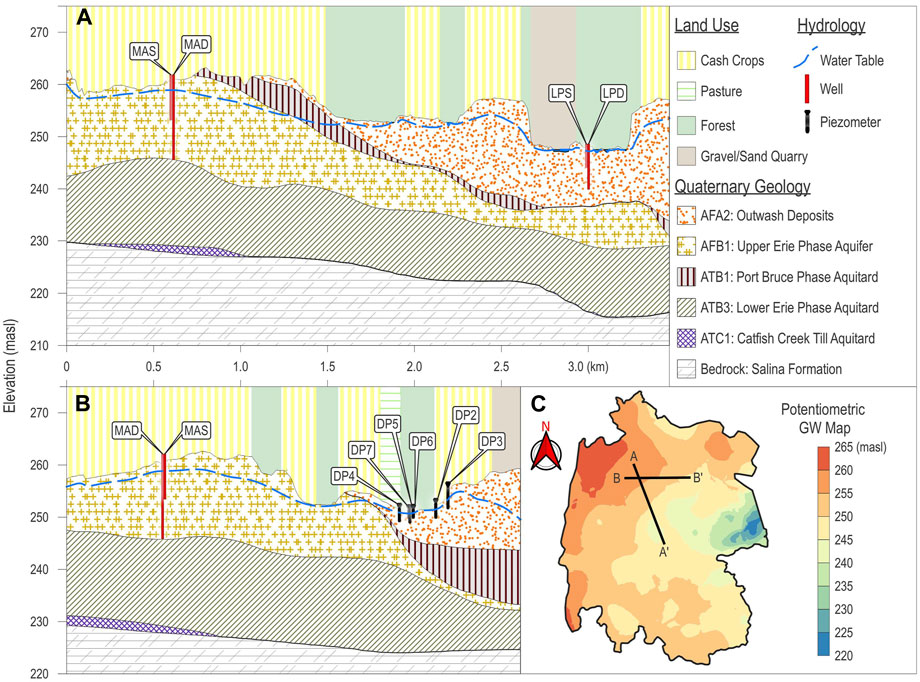
Figure 3. Geological cross sections (A) A-A’ cross-section, (B) B-B’ cross-section, and (C) piezometric map and location of cross-sections (Bajc and Dodge, 2011; Osman, 2017).
Within the study area, two provincial monitoring wells are maintained by the Grand River Conservation Authority (GRCA), PGMN1 (Id: 477) since 2008 and PGMN2 (Id: 065) since 2001 (Roogojin, 2024). Four additional monitoring wells were dug for and used in previous studies in the area (LPS, LPD, MAS, and MAD; Figure 2) and are monitoring temperature and water level since 2016 (Larocque et al., 2019; Osman, 2017). The potentiometric map (Figure 3C), drawn using available data from well drillers logs, indicates groundwater flow from west to east north of the creek (Larocque et al., 2019; Osman, 2017). The LWC drains the aquifer all along the study area, indicating potential surface water–groundwater connections. Previous research suggested that groundwater is entering Whitemans Creek from different locations, either via the streambed or from the many small SW tributaries (Osman, 2017). Due to the high irrigation water consumption and Permits to Take Water (PTTWs, for users pumping more than 50,000 L/day) in the area, the Whitemans Creek subcatchment is a region of potential water conflict (Shifflett et al., 2014). In 2023, the Whitemans Creek had 102 PTTW, of which 40 were within the LWC study area (MECP, 2023). In addition to irrigation, groundwater from private wells is used as the only source of drinking water for the local population within Burford (urban area in Figure 1; population, 2021: 1,058) (Lake Erie Region Source Protection Committee, 2025; Statistics Canada, 2023).
2.4 Meteorological conditions
Hourly precipitation was measured at the GRCA Burford Climate Station located inside the LWC catchment area near the inlet (S4) (GRCA, 2024) and the temperature records were obtained from the Brantford Airport (BA) weather station (ID: 6140942) operated by Environment and Climate Change Canada since 2014 (CCCS, 2024). The Brantford Airport Climate station is located 4.4 km east of the outlet (S5) (Figure 2). At the nearby Brantford MOE (Ministry of the Environment) climate station (ID: 6140954, approx. 8 km east of Brantford Airport and in operation from 1960 to 2013), the mean annual precipitation from 1975 to 2005 was 861 mm (15% as snow water equivalent); mean daily air temperature was 7.6 °C; annual average minimum of −24.4 °C and maximum of 32.4 °C. Over the observation period (2021 and 2024), mean precipitation was 869 mm and the percentage of precipitation as snow varied between 6% and 25%. Mean daily air temperature was 9.2 °C with an annual average minimum of −19.7 °C and maximum of 32.4 °C.
3 Materials and methods
3.1 Instrumentation
The primary observation period extended from October 2021 to November 2023 and was supplemented with additional datasets collected from December 2023 to November 2024 (Arce-Rodriguez, 2024; Pattrick et al., 2024). Collected datasets included (1) groundwater level measurement (Van Essen Divers); (2) groundwater and surface water samples analyzed monthly for field parameters (EC: electrical conductivity, DO: dissolved oxygen, ORP: oxidation-reduction potential, pH, and water temperature), and major anions (i.e., fluoride, chloride, bromide, nitrite, nitrate, phosphate, and sulfate); (3) river stage measured with either pressure transducers or bridge-mounted ultrasonic level sensors; and (4) in situ water quality and nitrate sensing instrumentation during selected periods.
To complement the stage measurements at the Mt. Vernon station, three additional gauging stations were installed in 2022. Two are bridge-mounted ultrasonic level sensors on bridges over Horner Creek and Kenny Creek (Figure 2B) and one is a Solinst pressure transducer along Landon’s Creek tributary.
3.1.1 Groundwater
A total of six monitoring wells were equipped with pressure and temperature transducers and were sampled monthly for major anions and field parameters. The provincial monitoring wells PGMN1 and PGMN2 were sampled monthly during the research while temperature and water table level were provided by the GRCA. The four pre-existing monitoring wells (LPS, LPD, MAS, and MAD), were reequipped in November 2021 with Van Essen TD-Divers (replacing Solinst transducers) for hourly monitoring of temperature and water level (well location on Figure 2, screened depth on Figure 5C).
A high resolution (HR) sampling location was selected for examining groundwater-surface water interaction and NO3-N at a local scale on Landon’s Creek (Figure 2C). The instruments were installed on either side of the stream (Figure 2A). HR was instrumented with six 25 mm-diameter Solinst 615N Simple Well Point piezometers with a screen length of 20 cm (i.e., drive point piezometers installed using a post hammer). Four piezometers (DP1-4; screen top 1.6,1.8,3.0, and 1.4 m bgs) were installed in July 2022, two of which (DP3 and DP4) were equipped with Van Essen Micro-Divers to monitor groundwater levels on opposing sides of the stream. In May 2023, three similar piezometers were installed at the tributary (DP5-7; screen top 1.0, 1.8, and 0.4 m bgs). When targeting storm events in 2022 and 2023, these sites were used for high-frequency sampling.
3.1.2 Surface water
Surface water instrumentation included an autosampler, pressure transducer, and in situ water quality stations. A Teledyne ISCO autosampler was use for targeting three storm events (Nov. 11–12, 2022; Mar. 22–23, 2023; Mar. 25, 2023). An in-stream Solinst pressure transducer, attached using aircraft cable to a steel fence post vertically hammered into the stream bed and protected with a perforated PVC pipe jacket, was used for temperature and stream stage measurements at 30 min intervals. Finally, three in situ water quality monitoring stations (labelled as SE, Figure 2) were used during the warm seasons at various sites from 2022 to 2024. These high-frequency monitoring stations were each equipped with a submersible Seabird Scientific Ultraviolet Nitrate Analyzer V2 (SUNA) and a YSI EXO Sonde (EXO). The SUNA is an in situ spectrophotometer which uses a wavelength range between 217–240 nm to measure NO3-N concentrations in water (Johnson and Coletti, 2002; Seabird Scientific, 2024). Each EXO instrument was equipped with four probes for measuring electrical conductivity, temperature, pH, dissolved oxygen, and turbidity in stream water, but in the current project, only water temperature was used. The SUNA/EXO (SE) station SE1 (Figure 2B) was installed all 3 years (2022–2024) while SE2 (Figure 2D) at the outlet was in operation during 2023 and 2024. A third station, SE3 (Figure 2C), was used in 2024 for targeting storm events (Table 1).
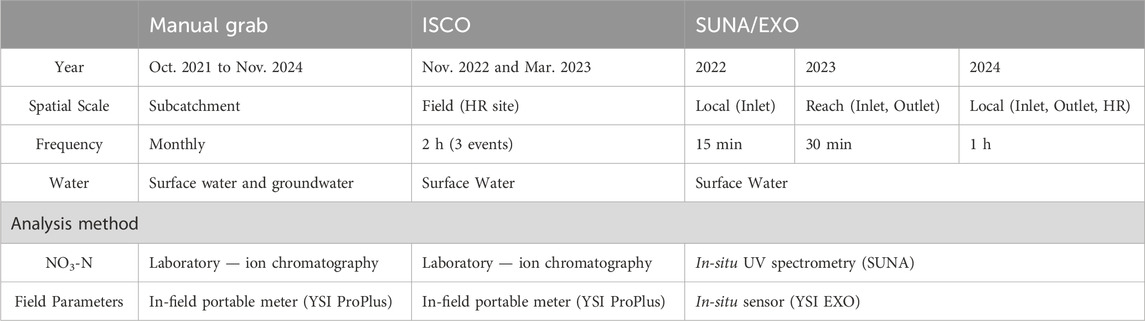
Table 1. Sampling frequency and analysis methods–note measurement frequency in subsequent years was reduced from 15 min to 1 h for energy saving purposes.
3.2 Sampling and processing
Groundwater and surface water samples were collected monthly, during storm events, or for calibration purposes over the course of the study. All water samples were immediately stored in a cooler with ice until refrigeration at the laboratory, usually within 8 h from sampling. Samples to be analysed for major anions were filtered into 30 mL HDPE single-use bottles using 0.45 μm Fisherbrand Basix Syringe Filters, PVDF, non-sterile. Major anion analysis was conducted by the Morwick G360 Groundwater Research Institute laboratory using a Metrohm Eco IC Ion Chromatograph using Ion-Suppressed Chromatography (2.925.0020).
3.2.1 Monthly sampling
Groundwater sampling from wells and drive point piezometers were conducted using either a submersible pump (Grundfos), peristaltic pump (GeoTech), or hand pump foot tubing (Waterra HDPE tubing), depending on well diameter, screen depth, and equipment availability. Wells and piezometers were purged by pumping three well volumes or the amount of water required for stabilization of field parameters measured with a YSI ProPlus multiparameter (sensors included: specific conductivity, temperature, pH, dissolved oxygen, and oxidation-reduction potential). Clean 1 L HDPE sample bottles were rinsed three times with fresh sample water, filled with no headspace for all groundwater and surface water samples. Surface water grab samples were taken at all steam gauging stations approximately 2.5 m from the bank of the creek using an extendable dip pole at a depth between 0.25 and 0.5 m at five locations along the stream (Figure 2A; Supplementary Figures S1–S5). Grab samples in the tributary (Figure 2C; Supplementary Figures S6–S8) were collected in the center of the creek at approximately 0.25 m from the surface by hand.
3.2.2 Storm events
Three storm events (Nov. 11–12, 2022; Mar. 22–23, 2023; Mar. 25, 2023) were sampled with a Teledyne ISCO autosampler, which collected surface water samples every 2 hours and stored samples internally in 1 L HDPE bottles. Storm events assessed with the SUNA/EXO instruments were sampled at a frequency between 15 min and 1 hour depending on the sampling site and season (Table 1). Turbidity, sediment build-up, and sensor fouling impact the performance of the SUNA by impeding the UV light transmittance. The SUNA is designed to account for darker conditions by increasing the amount of time the sensor takes to scan its 256-channel spectrometer, but excessive fouling can still impact performance (Seabird Scientific, 2024). Throughout the deployment periods, sediments were manually removed from the sensors approximately once per month, with the 2024 season seeing cleaning occur every 2 weeks. Calibration with deionized water was conducted monthly for the SUNA and NO3-N grab samples analyzed using ion chromatography were taken for comparison. The EXOs were also calibrated monthly following the procedures outlined by the YSI EXO user manual (Revision K; Xylem, 2020).
4 Results
4.1 Surface water and groundwater monthly sampling
Between November 2021 and November 2024, there were 890 continuous precipitation events (consecutive hours recording precipitation >0.1 mm) recorded at the Brantford Airport Weather station. A total of 76% of these events had intensities below 1 mm/hr with an average duration of 2.1 h (Figure 4A). Storm events with intensities above 2 mm/hr (red marks on Figure 4A) accounted for 11% during the study period with the most intense storm recording 22.4 mm/hr in a single hour (1 h duration, August 2022).
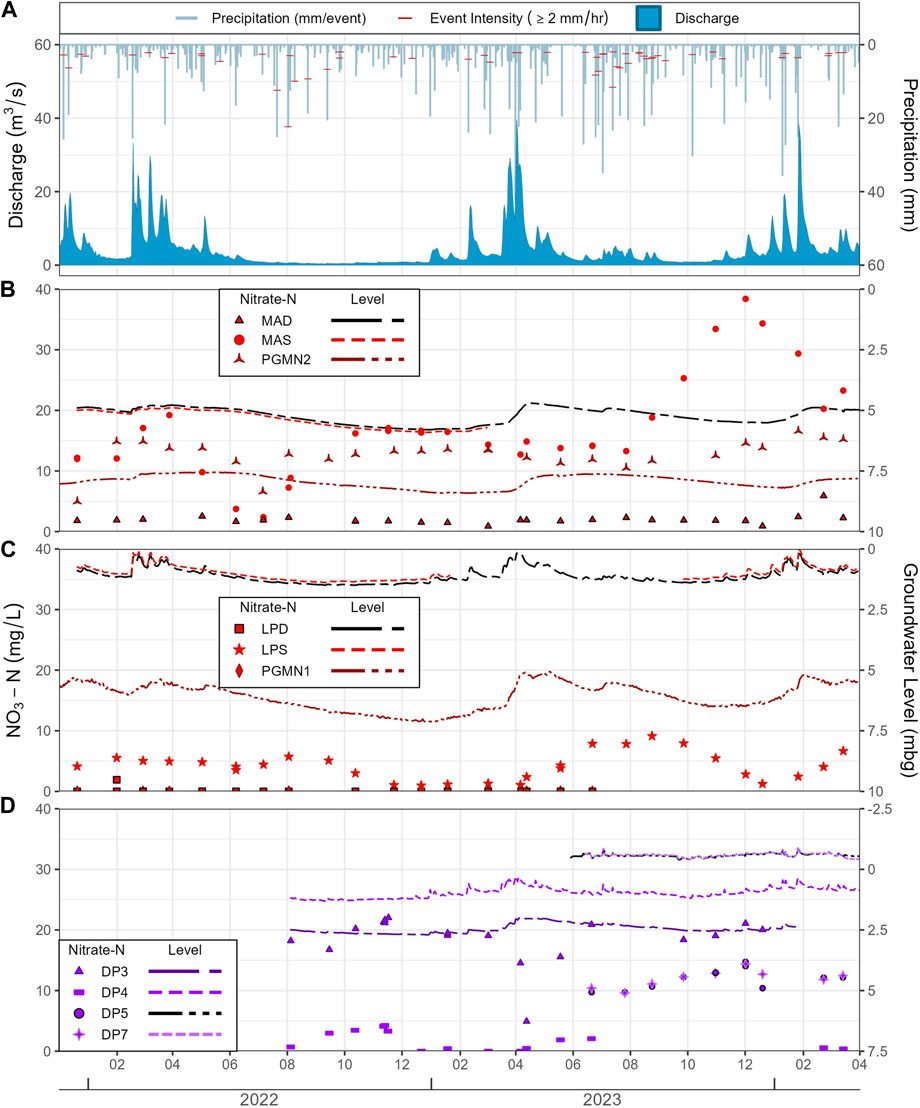
Figure 4. (A) Daily precipitation and stream discharge at the outlet; (B–D) groundwater NO3-N concentrations and groundwater levels for different monitoring stations during the study period. PGMN1 was excluded from graph due to NO3-N concentrations consistently below detection limit.
4.1.1 Flowrates and groundwater levels
Seasonal patterns in discharge at the Mt. Vernon station (S5) are readily evident, such as the significant increase during the spring snow melt, starting around February 15th in 2022, March 15th in 2023, and February 1st in 2024 (Figure 4A). Maximum spring season flow rates then reached 33.3, 39.5 and 38.5 m3/s in 2022, 2023, and 2024, respectively. The extreme peak in discharge in August 2024, was linked to the tail of Hurricane Debby. Summer daily averages in discharge range between 1.3 and 3.5 m3/s, reaching 0.4 m3/s in the relatively dry summer and fall of 2022 while minimum discharge in summer/fall 2023 and 2024 was 0.8 and 0.7 m3/s, respectively.
Groundwater levels in the sand aquifer (Figure 5C) responded to seasonal changes in inputs from precipitation and snowmelt (Figure 4). The maximum difference in groundwater levels was seen in PGMN1 (2.1 m; Figure 5C). The two in-stream drive points located at the HR site (DP5 and DP7) showed the least total change in water level (0.65 and 0.61 m respectively, Figure 5C). LPD, LPS, DP3, and DP4 were more sensitive to precipitation, as noted by the noisier data (Figures 4C,D), than MAD, MAS, and PGMN2 (Figure 4B).
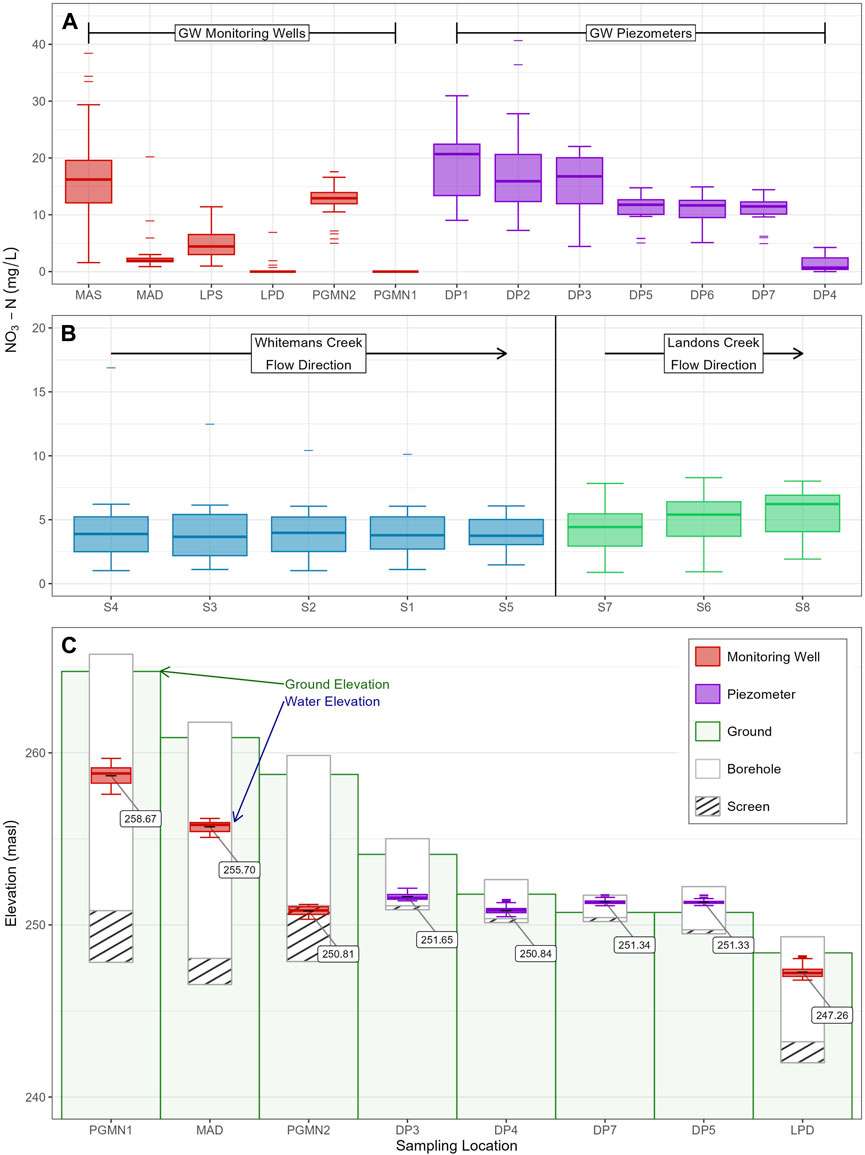
Figure 5. Trends in monthly NO3-N concentrations over the study period: (A) measurements from the six monitoring wells (red) and drivepoint piezometers at the HR Site (purple), (B) surface water concentrations ordered in downstream direction for Whitemans Creek (blue) and Landon’s Creek (green), (C) average GW level over the course of the study period as compared to the ground elevation and screened depth of each well (in meters above sea level).
4.1.2 Water chemistry
For major anions across all groundwater and surface water sampling locations throughout the study period, only NO3-N, Cl−, and SO42- had measurable concentrations (Table 2; Supplementary Material). Nitrite (NO2−), bromide (Br−), and phosphate (PO4-) were always below the minimum detection limit (MDL) at all sites (0.10 mg/L). Across all groundwater samples, only 25% had fluoride (Fl−) concentrations above the MDL (mean = 0.7 mg/L; maximum = 3.2 mg/L) while surface water above the MDL occurred in 46% of samples (mean = 0.6 mg/L; maximum = 3.6 mg/L). Other field parameters measured over the study period were specific conductivity, pH, dissolved oxygen, and oxidation-reduction potential. Groundwater and surface water mean, minimum, and maximum values for the field parameters are summarized in Table 2 (timeseries graphs for each sampling location and field parameter are in the Supplementary Figures S1–S5).
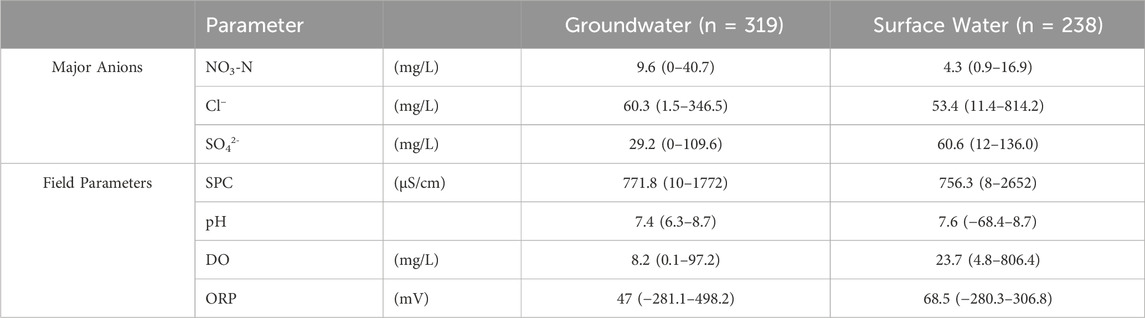
Table 2. Summary table of field parameters during study for groundwater and surface water samples [mean (minimum-maximum)]. See Supplementary Material for averages per location.
NO3-N concentrations in the shallow monitoring wells MAS and LPS averaged 17.2 and 5.0 mg/L NO3-N with maximum values 38.4 and 11.4, respectively (Figure 5A). The deeper wells, MAD and LPD, had averages of 2.8 and 0.4 mg NO3-N/L, and maximum values 20.2 and 6.9, respectively. Samples from the PGMN1 well never exceeded the NO3-N detection limit while the PGMN2 samples averaged 12.5, peaking at 17.6 mg/L. Mean NO3-N concentrations in the shallow drive point piezometers (DP1 to DP7) ranged between 21.4 (DP1) and 1.0 (DP4) mg/L NO3-N, with a maximum value of 40.7 mg/L occurring in DP2 (Figure 5A).
Average NO3-N concentrations at the five sampling locations on the main creek (S1-S5) varied between 4.1 (Inlet) and 3.9 (S2) mg/L (Figure 5B). Results from the tributary sampling sites (S6-S8) had NO3-N concentrations between 4.3 (S7) and 5.6 (S8) mg/L, but the point nearest the outlet (S8) having a higher average concentration than the inlet (S7) (Figure 5A).
4.2 Event-based sampling
Two approaches for capturing responses of the study area to precipitation events were used and are referred to as the “ISCO” and “SUNA/EXO” methods. The three events captured using the ISCO method saw precipitation intensity ranging from 0.45 to 1.93 mm/hr, with the highest precipitation event and most intense event both occurring on 25 March 2023 (Table 3). A total of seven events captured by the SUNA/EXO method were analysed further, at times when most sensors were functioning properly. The intensity of six of these seven events were within the top 11% of most intense events recorded during the study period (see Section 4.2). Difference in the scale of storm events which were captured (i.e., intensity and timing of events) between the two methods were due to resource availability and difficulties in predicting when it was ideal to initiate ISCO sampling.
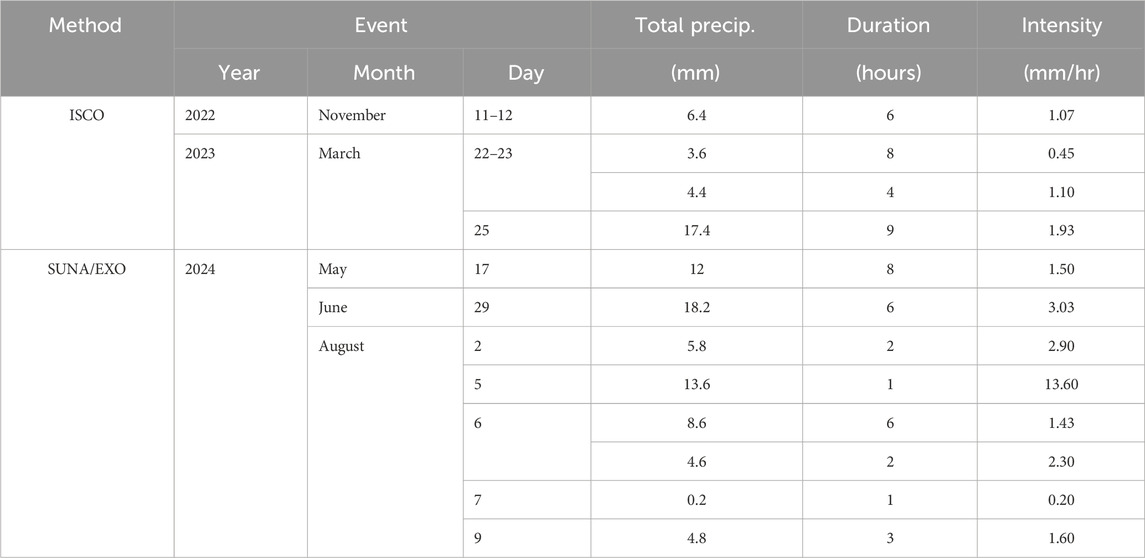
Table 3. Summary of captured storm event characteristics.
4.2.1 ISCO method
The ISCO method captured storm event responses at a single location on Landon’s Creek tributary (S6). During the storm events (Figure 6), the NO3-N concentrations varied between 5.5 and 6.5 mg/L (November 11–12, 2022), 1.1 and 1.9 mg/L (March 22–23, 2023), and 0.90 and 2.0 mg/L (25 March 2023). For the three events, NO3-N concentrations decreased between 0.8 and 1.1 mg/L during the storm. Figures 6B,C were consecutive events, with the second occurring 41 h after the first. The sampling gap between the two events was 30 h, after which the NO3-N returned to the pre-storm high of ∼2 mg/L before dropping again during the following event.
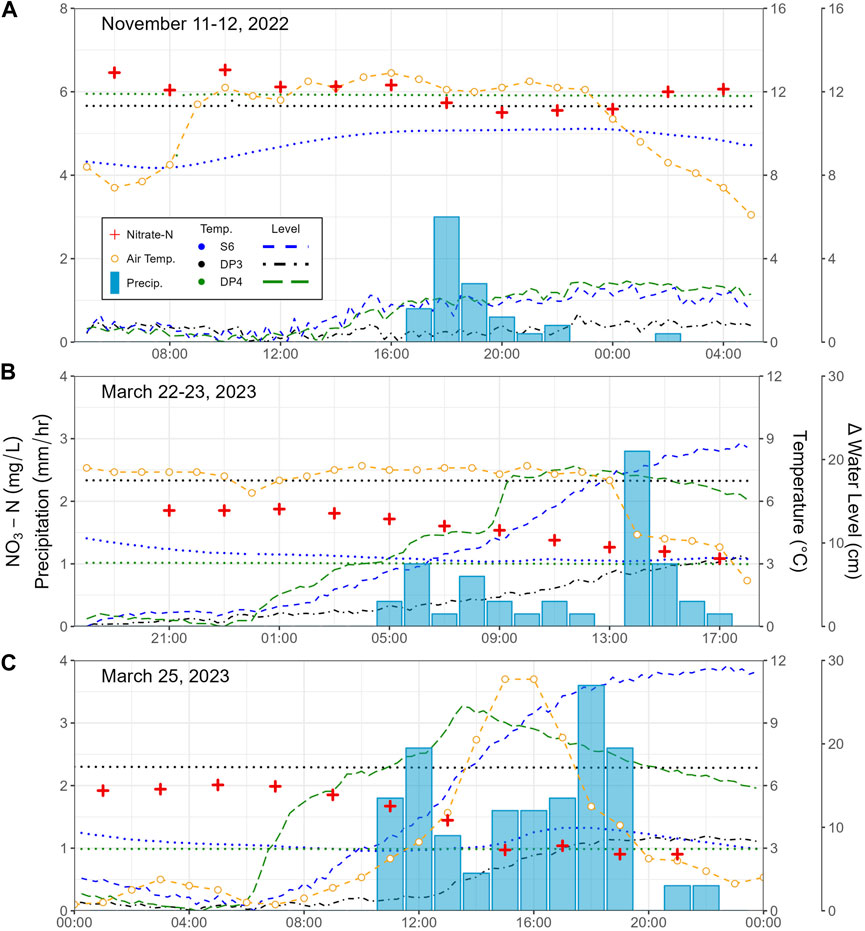
Figure 6. NO3-N concentrations and water temperature in the stream during storm events from the ISCO meter, along with hourly precipitation and variation in stream stage during three storm events (A) November 11–12, 2022, (B) March 22–23, 2023, and (C) 25 March 2023.
Stream temperature varied slightly throughout the course of each storm. When compared to change in atmospheric temperature, surface water temperature changed by 1.9 °C (8.4–10.2) and air temperature by 6.8 °C (6.1–12.9) (Nov.11), 1.1 °C (3.1–4.2) and air temperature by 5.5 °C (2.2–7.7) (Mar. 22), and 1.1 °C (2.9–4.0) and air temperature by 10.8 °C (0.3–11.1) (Mar. 25). Shallow groundwater temperature (DP3, DP4) did not change during any of the three storms.
Change in water level for both surface water (S6) and shallow groundwater (DP3, DP4) varied over the course of each storm. S6 and DP4 showed similar changes the water level magnitude 2.8 vs. 2.9 cm (Nov. 11), 22.0 vs. 19.2 cm (Mar. 22), and 29.4 vs. 24.5 cm (Mar. 25) while DP3 saw changes of 1.4, 8.4, and 9.0 cm, respectively.
4.2.2 SUNA/EXO method
High resolution temporal data were captured at specific locations using the SUNA/EXO stations. All data collected with the SUNAs were filtered by removing measurements for which the difference between the light spectrum absorbance (up to 20,000 counts) and the dark spectrum absorbance (thermal noise; typically between 500–600 counts) readings was less than 1,500. It was found that values below this range indicated significant sediment build-up on the sensor, resulting in unreliable readings. Validation of the sampling method was done through comparing grab sample concentrations measured in lab with ion chromatography to SUNA readings (Figure 7). The SUNA consistently recorded higher concentrations of NO3-N than the grab samples, averaging +0.75 mg/L [±0.77] (max.: 2.87 mg/L; min.: 0.28 mg/L).
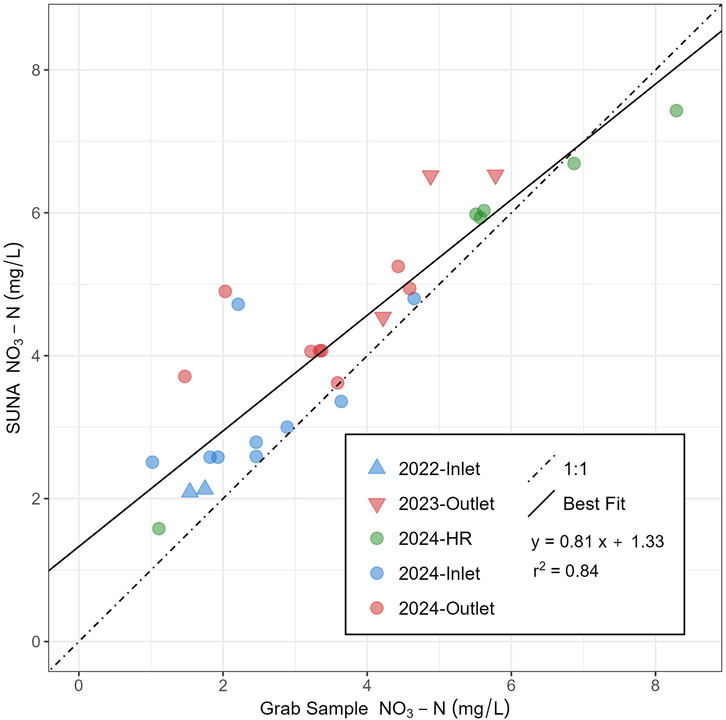
Figure 7. Comparison of NO3-N concentrations recorded using the SUNA with grab samples taken near the same time at inlet, outlet and high resolution (HR) sites.
Daily average NO3-N concentration and water temperature were compared to daily precipitation. During the fall of 2022, a SUNA-EXO (SE) station was set up at the inlet (S4) and recorded a NO3-N range of 1.24–2.28 mg/L. In 2023, the SE station at the outlet (S5) varied between 3.68 and 8.32 mg/L. During the 2024 sampling season, when all three SE stations were operational, NO3-N concentrations varied between 2.18–5.65 (Inlet), 2.76–5.55 (Outlet), and 2.09–8.47 mg/L (HR). Daily averages of NO3-N (considering only days with at least 8 h of measurements) had noisier readings from mid-April (DoY 100) to early August (DoY 220). When compared with the second part of the season, the noisier period corresponded to days with more daily precipitation (Figures 8A,C). Additionally, cooler temperatures in the tributary (S6) corresponded with higher concentrations of NO3-N (Figures 8B,C).
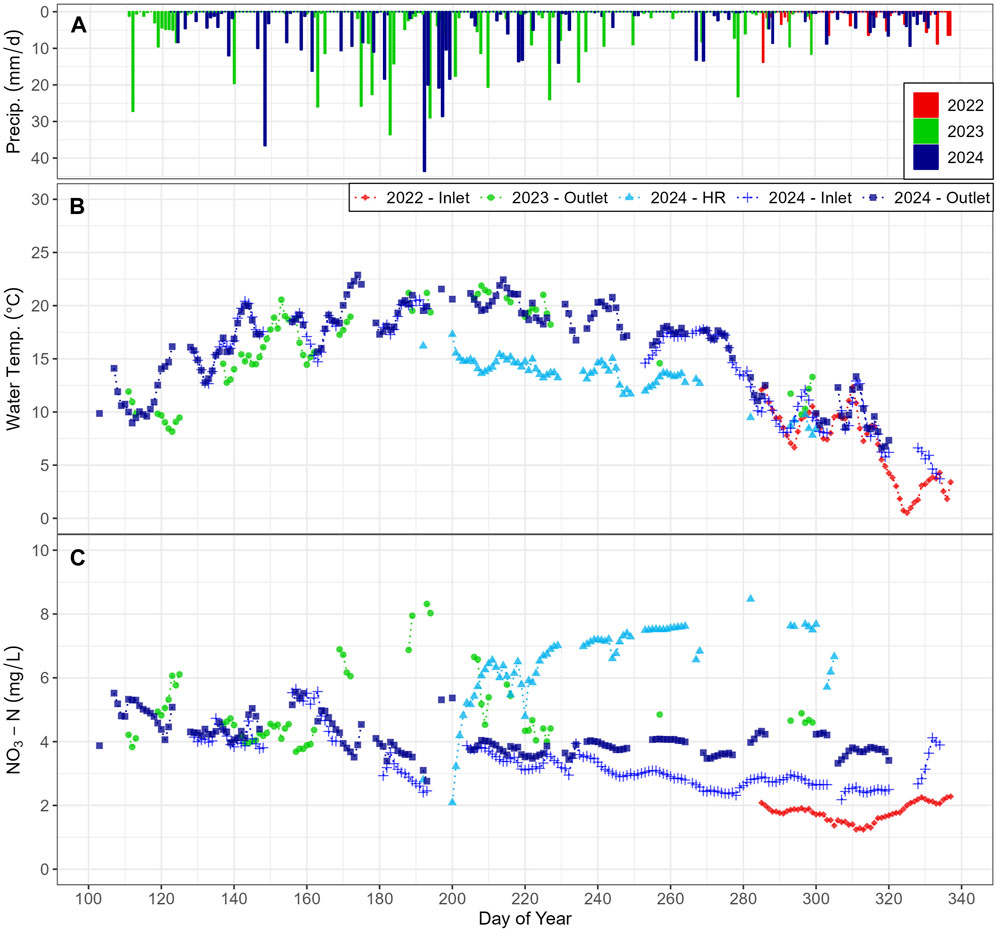
Figure 8. Comparison of (A) daily precipitation to (B) daily average stream temperature, and (C) NO3-N concentrations in the stream from the SUNA and EXO at inlet, outlet and high resolution (HR) sites. Daily precipitation shown for full operating period each year.
During the 2024 sampling period, NO3-N concentrations were compared to precipitation, water temperature, and change in stream level (i.e., stage height). The inlet and outlet SE stations were compared for two events, May 17 and 29 June 2024 (Figures 9A,B). NO3-N peaked 5 days after the May event while it peaked just under 2 days after the June event at the inlet. The outlet peak for both events occurred after an additional 12 h. Peak values for the change in water level occurred approximately 12 h prior to all four peak values in NO3-N.
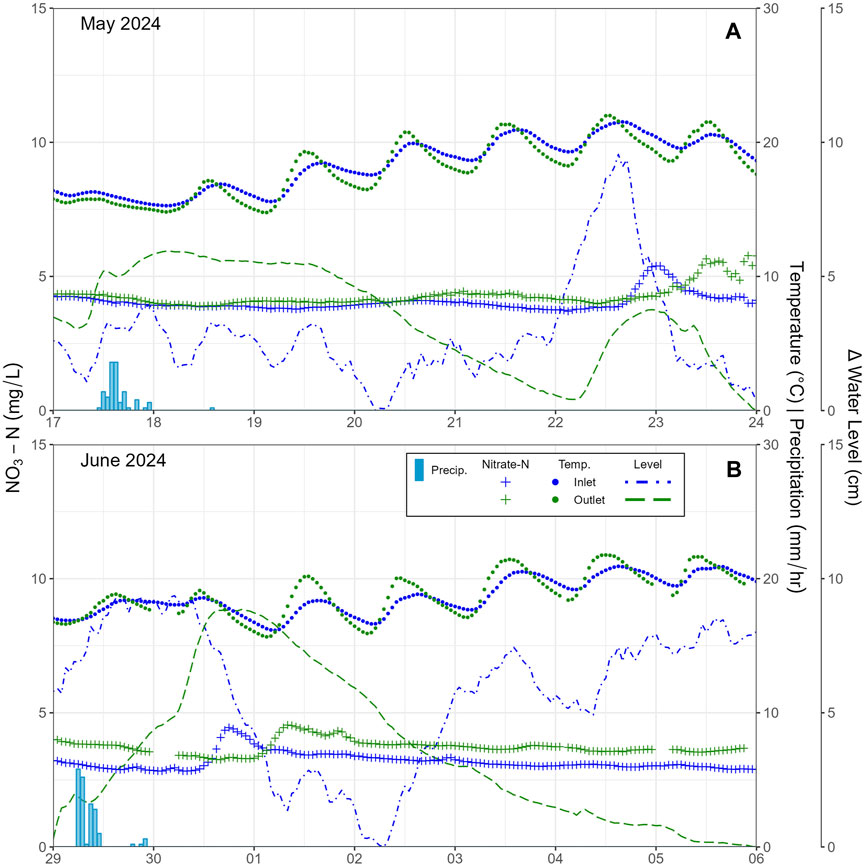
Figure 9. Comparison of stream NO3-N concentrations and water temperature in the stream as a response to precipitation events (A) in May 2024 and (B) in June 2024 at inlet and outlet sites.
For the first 10 days in August 2024 (DoY 213–222), three SE stations were compared (Inlet, Outlet, HR). NO3-N notably dropped promptly over the course of a storm event at the HR site, also corresponding with an increase in water level (Figure 10). Such a relationship was not observed at the inlet and outlet SE stations during the same period (note: water level measurements at the inlet were lost during this period and NO3-N concentrations are only available during daylight hours).
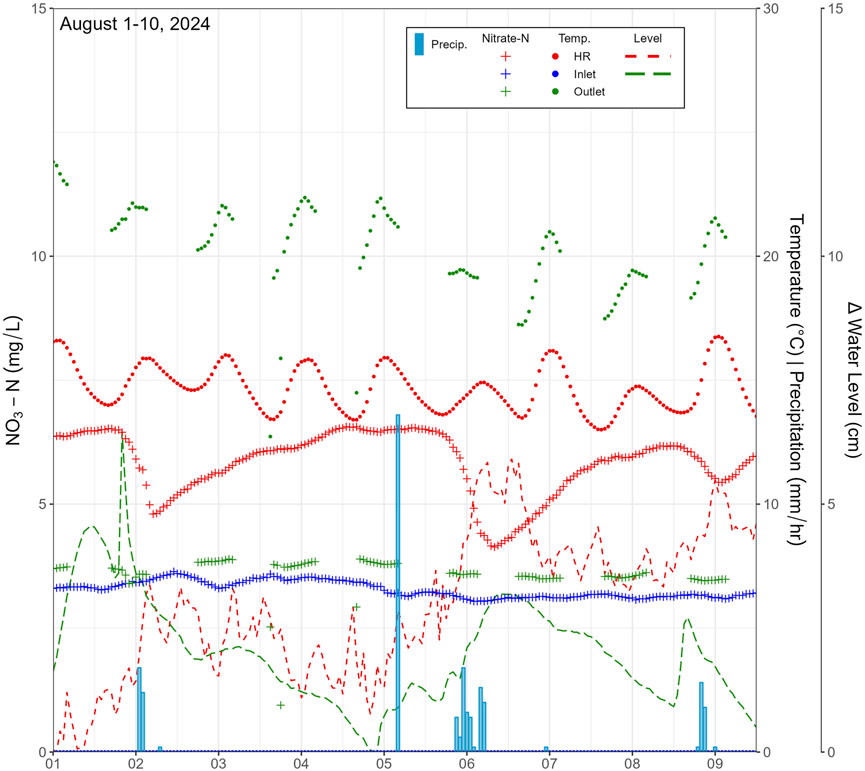
Figure 10. Comparison of stream NO3-N concentrations and water temperature as a response to precipitation in August 2024 at inlet, outlet, and high resolution (HR) tributary site.
5 Discussion
To assess the transport pathways of NO3-N in groundwater and surface water in connection to storm events in the study area, combinations of spatiotemporal sampling methods targeting different parameters were assessed. Concurrent methods for NO3-N sampling were defined by low frequency high spatial coverage (monthly sampling on the entire LWC) or high frequency local scale (storm event sampling at a small number of specific locations). Water level and temperature measurements were sampled at high frequency (hourly) and at both reginal scale (monitoring wells distributed over the LWC) and local scale (high-resolution site instrumented with drive-point piezometers).
5.1 Interpretation of lower resolution data
On the monthly scale over the study period (Oct. 2021 to Nov. 2024), assessment of groundwater NO3-N concentrations showed distinct differences at the varying locations and depths. Average measurements from shallow wells MAS and LPS (17.2 and 5.0 mg/L) were markedly higher than in their paired deeper wells MAD and LPD (2.8 and 0.4 mg/L). The other two deep monitoring wells studied were PGMN1 (undetectable NO3-N), and PGMN2 which consistently recorded some of the highest concentrations of NO3-N. Wells screened at similar depths, but different locations, e.g., MAD (12.8–14.3 m bgs) vs. PGMN1 (13.9–16.9 m bgs), had notable differences in the average concentrations (2.2 mg/L in MAD and not detected in PGMN1). Finally, wells screened closer to the average water table level had higher NO3-N concentrations than wells screened deeper, while still being in the overburden aquifer (screened near water table: MAS, LPS, PGMN2; screened relatively deeper than water table: PGMN1, MAD, LPD). Many factors can be contributing to this. For example, the vadose zone has been identified as an overlooked yet significant store of NO3-N impacting groundwater quality, especially in agricultural areas where the vadose zone is thick (Ascott et al., 2017a), thicker than in the LWC where it varies between 0–7 m.
5.1.1 Hydrogeologic factors
Sensitivity of the water table to precipitation (Figure 4) was assessed by comparing stream discharge at the outlet (Mt. Vernon) to the water levels recorded in the monitoring wells. The frequency of fluctuations for each well hydrograph was highest for MAD and MAS, followed by PGMN2, then LPD, LPS, and then PGMN1. The fluctuations in groundwater levels in LPD and LPS notably follow changes in discharge closely, perhaps due to the proximity of these wells to the main creek, which contrasts with PGMN1, a well significantly further from the creek, that followed a smooth seasonal pattern with lowest levels during summer. Given the fluctuations in LPD/S following stream discharge, it is possible that WC is either a losing or gaining stream at this location, depending on season and storm event, which could be affecting GW NO3-N in LPS/D. For example, if WC is losing during high flows in the spring, the shallow groundwater would reflect NO3-N concentrations in WC. During low flows, when WC is gaining, NO3-N in LPS/D would be expected to reflect a different source, such as upgradient GW NO3-N. While the pattern appears to reflect concentrations in LPS, it is not seen in LPD (see S1-5, Figure 5; Supplementary Figure S6). Therefore, LPD/S having lower relative NO3-N as compared to MAD/S is likely caused by other factors, such as anthropogenic or biogenic factors discussed below.
On the south side of Whitemans Creek, only one well, PGMN2, was studied. It is screened at a depth comparable to that of MAD and PGMN1, yet it had a comparable average NO3-N to MAS (15 and 17 mg/L). PGMN2 has a relatively deeper average GW level (∼8 m bgs) compared to PGMN1 (∼6 m bgs) and MAD/MAS (∼5.5 m bgs) and had smoother (less variable) well hydrographs which could imply less connection to surface. This could also imply a higher storativity, i.e., the aquifer at this location can store more water and effectively buffer impacts from surface inputs. Differences in storativity may impact response times and thus NO3-N concentrations. Although both MAD/MAS and PGMN2 are screened into similar overburden material, coarse sand (Osman, 2017) and gravelly sand (Government of Ontario, 2017) respectively, the quaternary hydrostratigraphic units are different, with MAD/MAS in the Upper Erie phase aquifer (AFB1) and PGMN2 in outwash deposits (ATA2) (Bajc and Dodge, 2011). Further testing using pumping tests would help determine the extent to which storativity may be impacting responses.
5.1.2 Anthropogenic factors
Land use (Table 4) likely also impacted the results, since the MAD and MAS wells (2.8 and 17.2 mg NO3-N/L) were surrounded by cash crops which are fertilized with nitrogen during the corn rotation. PGMN2 (12.68 mg NO3-N/L) was similar in that nearby fields are corn or potatoes, whereas PGMN1 (n.d.) is in a tree nursery and the LPD and LPS wells (0.4 and 5.0 mg NO3-N/L) are in a forested park (Figure 2).
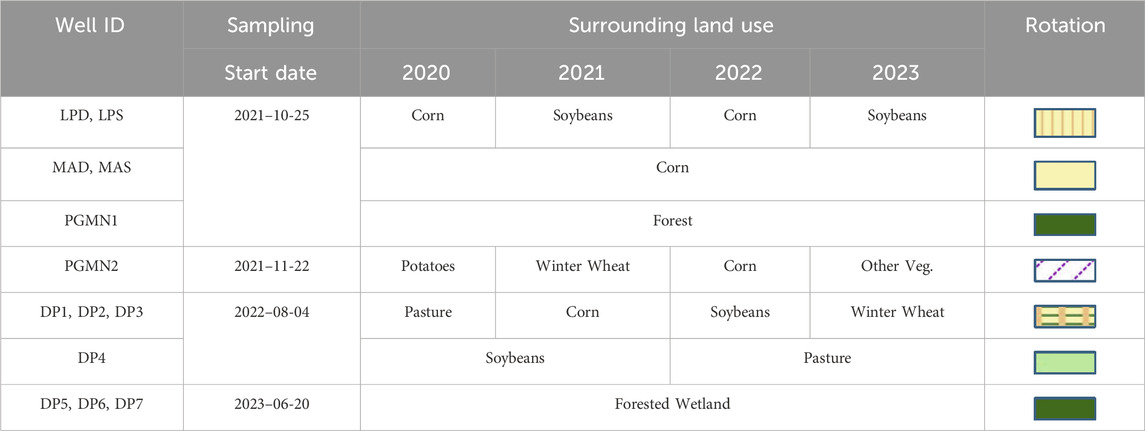
Table 4. Summary of conditions surrounding monitoring wells during the study period. Land use data from Annual Crop Inventory (AAFC, 2023). Coloured rotation legend corresponds to land use map (Figure 1).
Land use surrounding the PGMN2 well is notably different than other wells monitored. Moreover, PGMN2 is located less than 1 km from a housing subdivision in the Township of Burford, where residences use septic systems for wastewater treatment (County of Brant, 2023; Maxwell, 2020). The PGMN2 well is screened near a similar elevation (∼250 m asl) as the potentiometric surface located under the nearby houses (250–245 masl, Figure 3), from which elevated NO3-N may be related, due to the septic systems which are known to contribute NO3-N, along with many other contaminants, to groundwater systems globally (Gyimah et al., 2024; Robertson, 2021). Monthly sampling data for specific conductivity and chloride was notably higher in PGMN2 (1,348 μS/cm and 253 mg Cl−/L) than all other groundwater samples taken during the study (See Supplementary Table S1; Supplementary Figures S1, S2 for comparison). Additionally, the mixed agricultural land use (Figure 1) has recently consisted of potatoes and other vegetables along with corn and winter wheat (Table 4) on fields equipped with irrigation capabilities. These high concentrations measured at depths further below ground surface than the other wells (MAS, LPS) also screened near the water table may be indicative of legacy NO3-N build up due to the relatively thicker vadose zone (Ascott et al., 2017a) or different antecedent GW geochemistry coming from the west, among other factors.
A comparable well to PGMN2 from Gardner et al. (2020) had high NO3-N concentrations (average 13.5 mg NO3-N/L) in Norfolk County, just south of LWC and in a sand plain aquifer, where proximity to residences on septic systems were identified as the likely source via timeseries patterns and isotopic signatures. However, not enough data was taken on the south side of the LWC catchment to be able to determine conclusively the sources of NO3-N and its relationships to precipitation in PGMN2. Further study of NO3-N isotopes could help identify sources of NO3-N (Nikolenko et al., 2018). Some samplings of NO3-N isotopes were conducted in 2023 at the site (for collection and processing methods see Arce-Rodriguez (2024); Supplementary Material), but PGMN2 did not show notable signatures for septic waste.
5.1.3 Geochemical and biogenic factors
Heterotrophic denitrification, a redox transformation, in groundwater can occur under specific conditions, typically when NO3-N concentrations are greater than 1 mg/L, dissolved oxygen is below 2 mg/L, pH is between 5.5 and 8.0, and chloride is below 500 mg/L (Rivett et al., 2008). Presence of electron acceptors (e.g., dissolved organic carbon) are also typically needed. To determine redox state of natural waters, methods such as cross-referencing dissolved oxygen (DO), manganese (Mn), iron (Fe), and NO3-N to field measured oxidation-reduction potential (ORP), categorized into anoxic (−300 to 0 mV), suboxic (0–50 mV), and oxic (50–300 mV) (Gardner et al., 2020; Kehew, 2001; Stumm and Morgan, 1996). As the transformation of NO3-N requires anoxic environments, when the redox potential is moderate-to-low, NO3-N is not expected to be present (Grant Ferris et al., 2021; Kehew, 2001).
When comparing monthly groundwater samples over the course of the study the deeper wells averaged between 2.7 and 4.1 mg DO/L (MAD, LPD, PGMN1) while the shallow ranged from 6.7 to 11.2 mg DO/L (MAS, LPS, PGMN2, DP1-7). Only wells LPD and PGMN1 had, on average, reducing conditions with ORPs of −35.34 and −19.49 mV respectively. However, all groundwater samples recorded ORP values below zero at varying points in the study (See Supplementary Table S2; Supplementary Figures S3, S4 for further detail). Chloride concentrations never exceeded 350 mg/L in any groundwater samples and pH consistently ranged between 6.2 and 8.5 (Supplementary Tables S1, S2). Considering these factors, it seems unlikely that denitrification contributed to the noted lower concentrations of NO3-N with depth between MAS and MAD. A stronger argument may be made for denitrification potentially occurring at LPS and LPD during times when DO fell below 2 mg/L. For PGMN2 and DP1-7 favorable conditions for denitrification were less likely, since all these monitoring points are screened just below the average water table depth and have relatively high DO and ORP values. However, sampling these wells required the use of foot valve hand pumping, which prevented a flowthrough cell from being used when sampling, thus may have artificially increased the measured DO values. PGMN1 had the strongest evidence for denitrification contributing to NO3-N rarely being detected in the well, as the DO was consistently low (2.7 mg DO/L) and ORP averaged below 0 mV.
The 2023 NO3-N isotopes samples from Arce-Rodriguez (2024) show indications of denitrification in only three of the 75 samples taken, all three originating from the MAD well. Further delineation of sources was not possible due to most samples falling within the Soil-N range, where sources of NO3-N range from possible mineral fertilizers, naturally occurring in soil, manure, or septic sources (+3‰ to +8‰; Nikolenko et al., 2018).
5.2 Interpretation of higher resolution data
5.2.1 Hydrogeologic factors
During all storm events, water elevations in streams and groundwater level both rose within a short timeframe, within a day on Landon’s Creek (Figures 6, 10) or within two to 5 days in Whitemans Creek (Figure 9). Deeper monitoring wells further away from the tributary and creek (MAD/S, PGMN2) did not appear to respond in the same rapid fashion as seen at the high resolution site (DP3, DP4) or the shallow well near the main creek (LPD/S), which can be seen in the relative smoothness of water level measurements in Figure 4B as compared to Figures 4C,D. When linked with NO3-N concentrations, the rapid response in the tributary to storm events initially lowered the NO3-N concentration but was followed within a day by a return to pre-storm levels (e.g., 1.1 mg/L at the end of March 23 and 2.1 mg/L beginning 24 March 2023; Figure 6). In the LWC, no noticeable NO3-N dilution was seen due to the storm events and, on the contrary, a noticeable increase occurred slightly delayed from the peak in discharge. Additionally, the outlet for both May and June/July lagged about half a day behind the peak in concentration occurring at the inlet (Figure 9). The August 1–10, 2024 rain event was the most thoroughly captured event using the methods attempted. Decreasing NO3-N concentrations were observed at the HR site, followed by a rapid rise to pre-storm levels (e.g., ∼6.5 mg/L pre Aug. 6th storm, ∼5.5 mg/L mid storm, and return to ∼6.3 mg/L by Aug. 8th, 2024; Figure 10), while no notable drop in NO3-N was recorded during the same period at the Inlet and Outlet stations (Figure 10).
This can be interpreted as the small tributary likely acting as a conduit for NO3-N entering the main creek. From the research conducted at the HR site, Landon’s Creek appears to be a gaining stream, which could explain why it has particularly high NO3-N concentrations. The creek supports coldwater species of brook, brown, and rainbow trout (personal communication with Trout Unlimited Canada [now Freshwater Conservation Canada) – Middle Grand Chapter, 2024; (OMNR, 2025)]. It maintains a higher temperature relative to LWC during the winter (min.: 2.3 °C–4 °C at S6 vs. 0 °C–0.2 °C at S1) and lower during the summer (max.: 16.4 °C–20 °C at S6 vs. 20.7 °C–22.5 °C at S1) (Supplementary Table S2), did not freeze over in the winter (both the inlet and S3 froze at times), and did not go dry in the summer. A similar study on the larger Bazile Creek in Nebraska (1958 km2) highlighted the higher impact of some groundwater-fed tributaries in conducting NO3-N to the main creek, emphasizing the need for sampling lower-order streams (Richards et al., 2021).
5.2.2 Anthropogenic factors
On the field scale at the HR site, DP4 has the lowest average NO3-N concentration (1.40 mg/L) and is located on an alfalfa field only receiving potash (potassium) as fertilizer. Highest concentrations are on the cash crop field (Corn-Soybean-Winter Wheat) (DP1:19.8 mg/L, DP2:17.8, DP3: 15.4) and in between are the bank/bed DPs (DP5:11.0 mg/L, DP6: 10.6, DP7: 10.6 (Figure 5A). Elevated levels of NO3-N in shallow groundwater can be linked to fertilization under high water inputs, such as the case with irrigation (Su et al., 2022). While the HR site fields are not irrigated, as is the case with the majority of operations within the LWC catchment, the associated shallow GW levels also appear to correspond to surface inputs from precipitation (rain and snow), as highlighted by the increase in apparent noise of the timeseries where the water table is nearer to the surface (Figure 4). The delay time difference between stream stage (S6) and GW levels at the HR Site, where DP4 responds before S6 and DP3 responds after, may, in-part, be due to different land usage. Rapid (sub-daily delay) shallow groundwater verses stream response to precipitation events have been shown to vary in a small subcatchment, with GW responding before or after depending on land use (Gootman and Hubbart, 2021). The implication being that local land use can notably change response to precipitation and should be considered for assessing response to non-point source contaminants. However, more events than those captured in this study would be needed to draw a stronger connection to land use specifically, as differences in slope and relative location to S6 are present.
The shallow groundwater below a corn-soybean-winter wheat rotational field (Figure 1) averaged between 15–19 mg/L (DP1-3) and the groundwater in the nearby stream between 10–11 mg/L (DP5,7), while the tributary (S6) averaged 5 mg NO3-N/L (Figure 5B). The difference between the average groundwater and surface water at the HR Site may be the result of water contributions from the shallow GW on the alfalfa field (1.40 mg/L at DP4) or deeper groundwater from further away (e.g., MAD averaging 2.2 mg/L) discharging to Landon’s Creek, causing a dilution. Alternatively, the difference may, in part, be due to the shallow GW and SW being transported through a wetland area (Figure 3C), as retention in the hyporheic zone via denitrification is a possibility (Boulton et al., 2010; Lefebvre et al., 2024).
5.2.3 Geochemical and biogenic factors
Over the course of the study, it was noted that Landon’s Creek had a pattern of downstream increase of NO3-N, implying the ability of the stream to retain nitrogen is less than the overall contribution, a common situation in groundwater fed streams near cropped fields (Hill, 2023). As the water travels downstream in Landon’s Creek the average concentration increases from 4.0 to 5.5 mg/L. In contrast, Whitemans Creek holds a relatively constant average of 4.1 mg/L between the inlet and the outlet (S1-5, Figure 5). Since the discharge also increases, either groundwater or surface water necessarily contributes to the stream flow. If the surface water from other small streams act similarly to Landon’s Creek, then Whitemans Creek must either be retaining NO3-N, receiving discharge from the lower parts of the aquifer (i.e., PGMN1, MAD, LPD), or some combination to maintain a constant NO3-N at the outlet when contributing SW is higher.
The scientific literature shows that the presence of wetlands can contribute to reduce non-point source pollutant loading to groundwater and surface water (Nsenga Kumwimba et al., 2023; Ranalli and Macalady, 2010; Walton et al., 2020). Natural attenuation of NO3-N occurs mainly via denitrification, but plant assimilation, and microbial immobilization can also play a role, all of which can vary with location, season, hydrogeology. Some recent studies focused on small groundwater-fed wetlands used 222Rn as a natural tracer to delineate water source (Lefebvre et al., 2024), or in-stream high-frequency NO3-N sampling (Crossley et al., 2025). They demonstrate both the potential for retention and the many simultaneous factors (e.g., temporal changes in geochemical conditions for denitrification or storm intensity) affecting this retention. Lefebvre et al. (2024) found that 80% of groundwater entering a small stream was via the wetland flow, where denitrification and plant assimilation can occur. In the current study, beavers were observed to create dams which flooded the HR site, something which potentially can decrease NO3-N downstream transport and increase nutrient storage (Larsen et al., 2021). Here, the experimental methods were not designed to highlight these effects, but the presence of a riparian wetland inhabited by beavers in the HR site may decrease NO3-N concentrations in the shallow groundwater of DP5-7 and in Landon’s Creek (S6-8). However, beaver activity on Landon’s Creek may also negatively impact nearby farms through flooding and the coldwater species through water temperature increase associated with stream bank deterioration.
5.3 Advantages and limitations of the sampling methods addressing various spatiotemporal scales
Each of the three methods used for characterizing NO3-N in the LWC watershed under varying conditions had advantages and limitations, as described below (see summary in Table 5). The monthly sampling methods allowed for a regional spatial scale assessment and a low-frequency temporal scale assessment of NO3-N concentrations within the subcatchment. Some visible seasonal trends and relationships to land use can be assessed with these methods (Figure 4), but the low frequency does not allow for event-based assessment. However, this method is important for contextualizing water dynamics when using higher frequency methods such as the ISCO or SUNA/EXO. Supplementation of the monthly NO3-N samples with groundwater level, precipitation, and discharge at the outlet helped to highlight seasonal trends (Figure 4). Use of discharge was restricted to the outlet due to complications creating stage-discharge rating curves with stream levels recorded at the inlet and HR site. These difficulties stemmed from beavers damming the creek (downstream of S6 and upstream of Inlet) and subsequent clearing by farmers whose fields were being flooded.
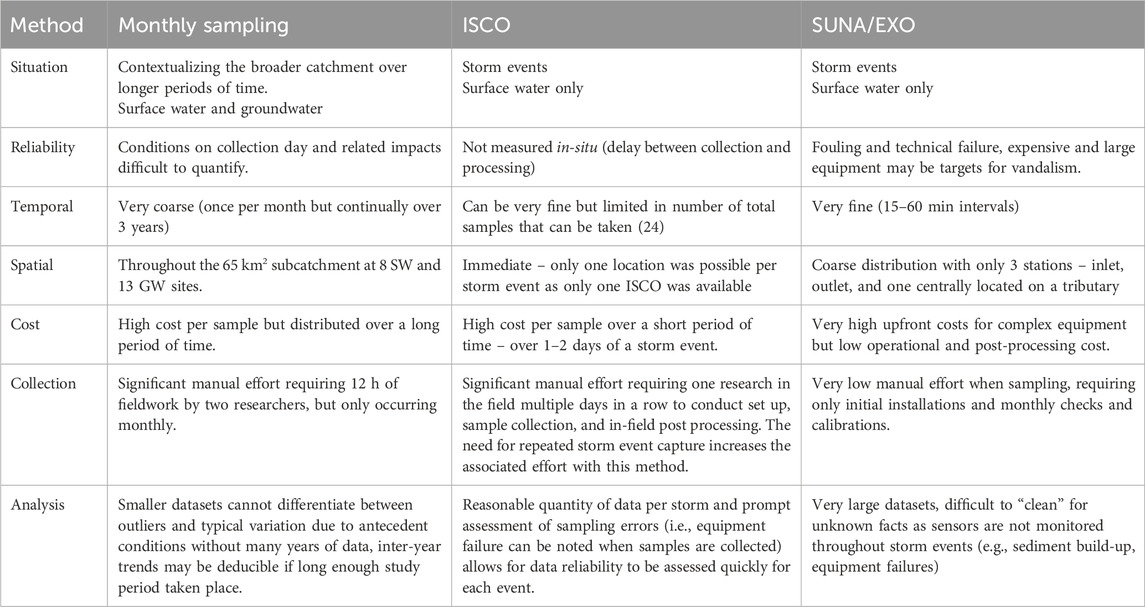
Table 5. Comparison of sampling methods conducted during the research period.
Semi-automatic sampling of events, using the ISCO autosampler, were more reliable for capturing a whole precipitation event (i.e., less susceptible to sediment fouling than the SUNA/EXO station), but the total number of samples that could be taken was limited and the time invested for each storm event campaign was significantly greater than the SUNA/EXO station. In this study, 24 samples were taken at 2-h intervals over the storm and collected at a later point, rather than in situ. Potential for negative impacts using the method (e.g., biofilm build-up in the intake line; Koopman et al., 1989) can be a concern but a recent report showed that this study offered optimal conditions for its use (i.e., small watershed, targeted event, short duration etc.) (Wilson et al., 2024). Nevertheless, time invested for each storm event campaign was significantly greater than the SUNA/EXO station.
The SUNA/EXO stations provided high frequency data, allowing for many paths of inquiry into the stream and, when paired with groundwater logger data, shallow groundwater dynamics. However, in the stream environments in which the SUNAs and EXOs were installed two distinct issues arose: 1) power failure and 2) impacts of sediment transport. Firstly, all three riparian locations available for installation of the sites were forested which reduced the efficiency of the solar panels while at the HR site the battery to be manually recharged and changed frequently. Additionally, failure of the batteries themselves was common (e.g., Figure 10: the inlet instruments during this period failed to record stream temperature while the outlet instrument was only operational during daylight hours, due to internal battery failure and solar panel charging failures respectively). Secondly, sediment transport in the stream was found to be important, rendering readings from the sensors unreliable at times. In particular, storm events fouled the equipment quickly, playing a role in the number of usable events captured (e.g., Figure 9A: NO3-N signal measured by the SUNA degrade following peak in stream level after a storm in May 2024). Both issues can be addressed by either 1) increasing the manual effort or 2) increasing costs. Manually cleaning sediment once every 2 weeks and after significant storm events reduced long periods of lost data. Installation of wipers and back-up power systems would increase system costs but reduce manual efforts. The benefits of high-frequency sampling to capture storm events are increasingly being discussed (Pellerin et al., 2016; Rozemeijer et al., 2025). These challenges are known and reported in the literature (e.g., power loss/ice, Wollheim et al., 2017; sediment build-up; Crossley et al., 2025; Miller et al., 2017).
5.4 Study limitations
The study focused on varying temporal and spatial sampling scales for NO3-N within an agricultural subcatchment with a focus on understanding storm events. Monthly grab sampling and ISCO sampling targeted water quality parameters and major anions. If the study had been conducted for a longer period, an index-based method, such as the one suggested by Ascott et al. (2017b) to associate precipitation events with groundwater flooding, could be potentially used for shallow groundwater NO3-N concentrations and precipitation. Also, tracer methods using isotopes (e.g., stable isotopes of water, radon) were not assessed, but have been shown in other studies to provide valuable information regarding NO3-N transport and should be considered in more detail for future studies (Jafari et al., 2021; Lefebvre et al., 2013; Nikolenko et al., 2018; Sukanya et al., 2022). The role of wetlands as nature-based solutions that contribute to the natural attenuation of nitrate needs to be investigated further.
The importance of tributary contribution of NO3-N to the main creek were drawn from sampling focused on a single tributary, Landon’s Creek. In the subcatchment, there are many smaller tributaries and two larger tributaries (Schofield Drain and Lewis Drain, northwest and southwest respectively) of similar scale to Landon’s Creek (Figure 2). The scope of the project did not include assessing multiple tributaries. However, differences in each due to location, soils, and topography would likely reveal differences in response and comparative studies would likely provide additional depth to conclusions. Additionally, the south side of the catchment, while showing similar hydrogeological characteristics (i.e., water table depth and material), would require further investigation since limited spatial groundwater sampling was done there.
Finally, the large datasets from high frequency sampling have the potential to reveal useful patterns in transport dynamics but can demand complex data analysis methods for cleaning and interpretation. Here, visual interpretation of spatiotemporal trends was performed. Further applications of such high frequency chemical datasets, such as with stream baseflow separation with a focus on nutrient transport (Miller et al., 2017), could better inform the relationship of loading to storm events. Significant gaps in datasets complicate such efforts, but methods for filling in gaps using predictive machine learning models could be investigated further to address the shortcomings (Crossley et al., 2025; Elsayed et al., 2024; Jones et al., 2022). Numerical models, such as SWAT-MODLFOW-RT3D (e.g., Wei et al., 2019) or HydroGeoSphere (e.g., Saleem et al., 2020), can be developed for specific sites and calibrated, using what data has been collected, to model spatiotemporal variability and test the watershed under controlled conditions.
6 Conclusion
This study has assessed NO3-N transport in a sandy sub-catchment of an agriculturally intense region in southwestern Ontario through monthly and storm event sampling while evaluating data collection methods. The field-based study in the Lower Whitemans Creek sub-catchment used three water quality monitoring methods (monthly sampling, 2-h autosampling, and in situ multiparameter instruments) varying at different spatial scales and frequency between October 2021 and November 2024 and compared these parameters with hourly records of precipitation, discharge, GW and SW water levels, as well as water and atmospheric temperature.
The results showed that groundwater-fed streams can contribute NO3-N to the main creek, indicating the need to find ways to reduce loading. The results also show that targeted storm sampling of NO3-N and water level monitoring may be helpful to quantify this NO3-N loading. High frequency sampling using autosamplers (such as the ISCO or SUNA/EXO) has been shown to be useful to capture storm-related transport of NO3-N, but some issues were identified with data collection. ISCO sampling is more time intensive but, due to the nature of collection and relative simplicity of method, the technology was found to be more reliable. In contrast, the complexity of the SUNA/EXO systems can readily collect the extensive datasets needed to assess many storm events; however, this can lead to noisy data and frequent maintenance issues, causing assessment of results to be difficult.
Bringing to the forefront some of the complications associated with sampling in an open system is a major implication of this study. This showcasing of methods for targeted storm event sampling, highlighting the advantages and disadvantages of the different approaches, needs to be emphasized for greater explanatory power of results to be achieved. The best sampling technique necessarily depends on study objective, but also depends on land use, geology, and meteorology, among other factors presenting unique conditions. Using data collection methods best suited to assess NO3-N concentration in surface and groundwater in rural areas, especially related to high-intensity rain events, should be a crucial component of any study to optimize field sampling campaigns, post treatment of datasets, and accounting for data uncertainty. Ultimately, more adapted techniques will lead to better understanding of the factors impacting NO3-N mitigation in agricultural settings. These techniques will thus contribute to identifying approaches to reduce loading and enhance natural attenuation to the advantage of the human population and of the ecosystems.
Data availability statement
The datasets presented in this article are not readily available because the raw data supporting the conclusions of this article will be made available by the authors, without undue reservation. Requests to access the datasets should be directed to Y3pldW5lckB1b2d1ZWxwaC5jYQ==.
Author contributions
CZ: Writing – original draft, Writing – review and editing, Formal Analysis, Methodology, Conceptualization, Investigation, Data curation. JL: Project administration, Validation, Supervision, Writing – review and editing, Funding acquisition, Conceptualization, Resources. ML: Supervision, Writing – review and editing, Funding acquisition, Project administration, Validation, Resources, Conceptualization.
Funding
The author(s) declare that financial support was received for the research and/or publication of this article. Ontario Agri-Food Innovation Alliance, Ontario Graduate Scholarship.
Acknowledgments
The authors would like to thank the Grand River Conservation Authority, specifically Sonja Strynatka, Jeff Pitcher, and Tim Patterson, who helped significantly with data access and collection, and Ryan Smith and Joanne Rykes from the School of Engineering, University of Guelph, for problem solving and laboratory support. And a special thank you to Floyd and Kim Davis for the invaluable support throughout the whole project. The authors wish to explicitly thank ClimateData.ca for providing the climate information used in this paper. ClimateData.ca was created through a collaboration between the Pacific Climate Impacts Consortium (PCIC), Ouranos Inc., the Prairie Climate Centre (PCC), Environment and Climate Change Canada (ECCC) Centre de Recherche Informatique de Montréal (CRIM) and Habitat7.
Conflict of interest
The authors declare that the research was conducted in the absence of any commercial or financial relationships that could be construed as a potential conflict of interest.
Generative AI statement
The author(s) declare that no Generative AI was used in the creation of this manuscript.
Any alternative text (alt text) provided alongside figures in this article has been generated by Frontiers with the support of artificial intelligence and reasonable efforts have been made to ensure accuracy, including review by the authors wherever possible. If you identify any issues, please contact us.
Publisher’s note
All claims expressed in this article are solely those of the authors and do not necessarily represent those of their affiliated organizations, or those of the publisher, the editors and the reviewers. Any product that may be evaluated in this article, or claim that may be made by its manufacturer, is not guaranteed or endorsed by the publisher.
Supplementary material
The Supplementary Material for this article can be found online at: https://www.frontiersin.org/articles/10.3389/fenvs.2025.1641345/full#supplementary-material
References
Abascal, E., Gómez-Coma, L., Ortiz, I., and Ortiz, A. (2022). Global diagnosis of nitrate pollution in groundwater and review of removal technologies. Sci. total Environ. 810, 152233. doi:10.1016/j.scitotenv.2021.152233
Acton, D. F., Alley, N. F., Baril, R., Day, J. H., Fulton, R. J., Heringa, P. K., et al. (1998). “Landform classification,” in The Canadian system of soil classification. Editor R. H. Haynes Third Edition (Ottawa, ON: NRC Research Press) 161–178.
Agriculture and Agri-Food Canada (AAFC) (2023). Data from: annual crop inventory, 2023. Ottawa, ON, Canada: Government of Canada. Available online at: https://open.canada.ca/data/en/dataset/ba2645d5-4458-414d-b196-6303ac06c1c9 (Accessed September 17, 2023).
Allan, R. P., Barlow, M., Byrne, M. P., Cherchi, A., Douville, H., Fowler, H. J., et al. (2020). Advances in understanding large-scale responses of the water cycle to climate change. Annals of the New York Academy of Sciences, 1472 (1), 49–75. doi:10.1111/nyas.14337
Anderson, M. (2021). Water quality board report GM-01-21-04. Available online at: https://www.grandriver.ca/our-watershed/water/surface-water-resources/surface-water-quality/ (Accessed February 26, 2025).
Arce-Rodriguez, J. (2024). Nitrogen dynamics conceptualization in a sand plain aquifer in the Lake Erie Basin. Guelph (ON): University of Guelph.
Ascott, M. J., Gooddy, D. C., Wang, L., Stuart, M. E., Lewis, R. S., Ward, R. S., et al. (2017a). Global patterns of nitrate storage in the vadose zone. Nat. Commun. 8, 1416. doi:10.1038/s41467-017-01321-w
Ascott, M. J., Marchant, B. P., Macdonald, D., McKenzie, A., and Bloomfield, J. (2017b). Improved understanding of spatio-temporal controls on regional scale groundwater flooding using hydrograph analysis and impulse response functions. Hydrol. Process. 31 (25), 4586–4599. doi:10.1002/hyp.11380
Bajc, A. F., and Dodge, J. E. P. (2011). Three-dimensional mapping of surficial deposits in the Brantford– Woodstock area, southwestern Ontario. Groundw. Resour. Study 10. Available online at: https://www.geologyontario.mines.gov.on.ca/publication/GRS010 (Accessed September 11, 2023).
Bhatti, A. Z., Farooque, A. A., Li, Q., Abbas, F., and Acharya, B. (2021). Spatial distribution and sustainability implications of the Canadian groundwater resources under changing climate. Sustainability 13 (17), 9778. doi:10.3390/su13179778
Biagi, K. M., Ross, C. A., Oswald, C. J., Sorichetti, R. J., Thomas, J. L., and Wellen, C. C. (2022). Novel predictors related to hysteresis and baseflow improve predictions of watershed nutrient loads: an example from Ontario’s lower Great Lakes basin. Sci. Total Environ. 826, 154023. doi:10.1016/j.scitotenv.2022.154023
Bosse, K. R., Fahnenstiel, G. L., Buelo, C. D., Pawlowski, M. B., Scofield, A. E., Hinchey, E. K., et al. (2024). Are harmful algal blooms increasing in the Great lakes? Water (Basel) 16 (14), 1944. doi:10.3390/w16141944
Boulton, A. J., Datry, T., Kasahara, T., Mutz, M., and Stanford, J. A. (2010). Ecology and management of the hyporheic zone: stream-groundwater interactions of running waters and their floodplains. J. North Am. Benthol. Soc. 29 (1), 26–40. doi:10.1899/08-017.1
Canadian Centre for Climate Services (CCCS) (2024). Data from: climate data extraction tool. Ottawa, ON, Canada: Government of Canada. Available online at: https://climate-change.canada.ca/climate-data/#/ (Accessed September 30, 2024).
Canadian Council of Ministers of the Environment (CCME) (2012). “Nitrate ion,” in Canadian water quality guidelines for the protection of aquatic life (Winnipeg: Canadian Council of Ministers of the Environment). Available online at: https://www.ccme.ca/en/resources/canadian_environmental_quality_guidelines#.
Canadian Council of Ministers of the Environment (CCME) (2017). “CCME water quality index, user’s manual – 2017 update,” in Canadian environmental quality guidelines, 1999 (Winnipeg: Canadian Council of Ministers of the Environment). Available online at: https://www.ccme.ca/en/resources/canadian_environmental_quality_guidelines#.
Canadian Soil Information Service (CanSIS) (2014). Data from: detailed soil survey (DSS) compilations. Ottawa, ON, Canada: Government of Canada. Available online at: https://sis.agr.gc.ca/cansis/nsdb/dss/v3/index.html (Accessed May 8, 2025).
Castaño-Sánchez, A., Hose, G. C., and Reboleira, A. S. P. (2020). Ecotoxicological effects of anthropogenic stressors in subterranean organisms: a review. Chemosphere 244, 125422. doi:10.1016/j.chemosphere.2019.125422
Chapman, L. J., and Putman, D. F. (1984). The physiography of southern Ontario; Ontario geological survey, special volume 2. Toronto, ON: Ontario Ministry of natural resources. Available online at: https://www.geologyontario.mines.gov.on.ca/publication/SV02.
Chapman, L. J., and Putnam, D. F. (2007). Data from: physiography of southern Ontario MRD228. Ontario.ca. Available online at: https://www.geologyontario.mines.gov.on.ca/publication/MRD228 (Accessed February 19, 2025).
Costa, D., Sutter, C., Shepherd, A., Jarvie, H., Wilson, H., Elliott, J., et al. (2022). Impact of climate change on catchment nutrient dynamics: insights from around the world. Environ. Rev. 31, 4–25. doi:10.1139/er-2021-0109
County of Brant (2023). A Simple Grand plan: the official plan for the country of brant. Available online at: https://www.brant.ca/en/planning-and-Development/official-plan.aspx (Accessed June 3, 2025).
Crossley, L. M., MacQuarrie, K. T. B., and Danielescu, S. (2025). Agricultural nitrate attenuation in a small groundwater-influenced wetland system. Front. Environ. Sci. 13, 1513704. doi:10.3389/fenvs.2025.1513704
Crossman, J., and Weisener, C. (2020). “Contaminants of the Great lakes,” in The handbook of environmental chemistry. Editors D. Barceló, and A. G. Kostianoy (Springer Chem), 101. doi:10.1007/978-3-030-57874-9
Cuartero, M., and Crespo, G. A. (2018). All-solid-state potentiometric sensors: a new wave for in situ aquatic research. Curr. Opin. Electrochem 10, 98–106. doi:10.1016/j.coelec.2018.04.004
Earthfx (2018). Whitemans creek tier three local area water budget and risk assessment: risk assessment report. Available online at: https://www.sourcewater.ca/source-protection-areas/grand-river-source-protection-area/grand-river-water-budget-studies/whitemans-creek-tier-3/ (Accessed July 30, 2024).
Elsayed, A., Rixon, S., Levison, J., Binns, A., and Goel, P. (2024). Machine learning models for prediction of nutrient concentrations in surface water in an agricultural watershed. J. Environ. Manage. 372, 123305. doi:10.1016/j.jenvman.2024.123305
Elsayed, A., Levison, J., Binns, A., Larocque, M., and Goel, P. (2025). Regression-based machine learning models for nitrate and chloride prediction in surface water in a small agricultural Sand Plain sub-watershed in southwestern Ontario, Canada. Front. Environ. Sci. 13, 1543852. doi:10.3389/fenvs.2025.1543852
Environment and Climate Change Canada (ECCC) (2013). Water sources: groundwater. Gatineau, QC, Canada: Government of Canada. Available online at: https://www.canada.ca/en/environment-climate-change/services/water-overview/sources/groundwater.html#sub5 (Accessed December 4, 2021).
Environment and Climate Change Canada (ECCC) (2024). Water level and flow. Gatineau, QC, Canada: Government of Canada. Available online at: https://wateroffice.ec.gc.ca/mainmenu/historical_data_index_e.html [Accessed April 30, 2024].
Forrest, T., Cherubini, T., Jeanneret, S., Zdrachek, E., Damala, P., and Bakker, E. (2022). A submersible probe with in-line calibration and a symmetrical reference element for continuous direct nitrate concentration measurements. Environ. Sci. Process Impacts 25, 519–530. doi:10.1039/d2em00341d
Gardner, S. G., Levison, J., Parker, B. L., and Martin, R. C. (2020). Groundwater nitrate in three distinct hydrogeologic and land-use settings in southwestern Ontario, Canada. Hydrogeol. J. 28, 1891–1908. doi:10.1007/s10040-020-02156-4
Gootman, K. S., and Hubbart, J. A. (2021). Rainfall, runoff and shallow groundwater response in a mixed-use, agro-forested watershed of the northeast, USA. Hydrol. Process 35 (8), e14312. doi:10.1002/HYP.14312
Government of Ontario (2017). Data from: well records. Available online at: https://www.ontario.ca/page/well-records (Accessed September 30, 2024).
Grant Ferris, F., Szponar, N., and Edwards, B. A. (2021). “Groundwater microbiology,” in Guelph, ON: the groundwater project.
Grand River Conservation Authority (GRCA) (2024). Data from: Grand River information network: monitoring data download. GRCA Open Data License v2.0. Available online at: https://data.grandriver.ca/downloads.html.
Gyimah, R., Lebu, S., Owusu-Frimpong, I., Semiyaga, S., Salzberg, A., and Manga, M. (2024). Effluents from septic systems and impact on groundwater contamination: a systematic review. Environ. Sci. Pollut. Res. 31, 62655–62675. doi:10.1007/s11356-024-35385-1
Health Canada (2013). “Guidelines for Canadian drinking water quality: guideline technical document — nitrate and nitrite,” in Water and air quality bureau, healthy environments and consumer safety branch. Ottawa, Ontario: Health Canada.
Hill, A. R. (2023). Patterns of nitrate retention in agriculturally influenced streams and rivers. Biogeochemistry 163, 155–183. doi:10.1007/s10533-023-01027-w
Irvine, C., Macrae, M., Morison, M., and Petrone, R. (2019). Seasonal nutrient export dynamics in a mixed land use subwatershed of the Grand River, Ontario, Canada. J. Gt. Lakes. Res. 45, 1171–1181. doi:10.1016/j.jglr.2019.10.005
Ivey, J. (2024). “GM-06-24-52 water quality in the Grand River watershed-update on nitrates,” in Hybrid meeting of the general membership - general meeting 28 June 2024. Grand River Conservation authority (Cambridge (ON): GRCA Administration Centre/Zoom Virtual Meeting).
Jafari, T., Kiem, A. S., Javadi, S., Nakamura, T., and Nishida, K. (2021). Using insights from water isotopes to improve simulation of surface water-groundwater interactions. Sci. Total Environ. 798, 149253. doi:10.1016/j.scitotenv.2021.149253
Janzen, B. (2018). Geology of the Grand River watershed: an overview of bedrock and quaternary geological interpretations in the Grand River watershed. Available online at: https://www.grandriver.ca/media/vb4p5t0i/watershed-geology_march272019.pdf (Accessed March 7, 2024).
Johnson, K. S., and Coletti, L. J. (2002). In situ ultraviolet spectrophotometry for high resolution and long-term monitoring of nitrate, bromide and bisulfide in the ocean. Deep-Sea Res. I 49 (7), 1291–1305. doi:10.1016/S0967-0637(02)00020-1
Jones, A. S., Jones, T. L., and Horsburgh, J. S. (2022). Toward automating post processing of aquatic sensor data. Environ. Model. and Softw., 151:105364. doi:10.1016/j.envsoft.2022.105364
Kaltenecker, G. (2023). Data from: provincial (stream) water quality monitoring network (PWQMN). Available online at: https://data.ontario.ca/dataset/provincial-stream-water-quality-monitoring-network.
Kehew, A. E. (2001). “Redox reactions and processes,” in Applied chemical hydrogeology (Upper Saddle River, N.J.: Prentice Hall), 129–165.
Koopman, B., Stevens, C. M., Logue, C. L., Karney, P., and Bitton, G. (1989). Automatic sampling equipment and bod test nitrification. Water Res. 23(12), 1555–1561. doi:10.1016/0043-1354(89)90121-8
Lake Erie Region Source Protection Committee (2025). “County of brant,” in Grand River source protection area approved assessment report (Cambridge, ON). Available online at: https://www.sourcewater.ca/source-protection-areas/grand-river-source-protection-area/grand-river-assessment-report/ (Accessed June 3, 2025).
Larocque, M., Levison, J., Gagne, S., and Saleem, S. (2019). Groundwater use for agricultural production - current water budget and expected trends under climate change. Final technical report for Quebec-Ontario Cooperation for Agri-Food Research Competition. Guelph, ON: OMAFRA and Québec City, QC: MAPAQ. Available online at: https://www.ouranos.ca/en/projects-publications (Accessed November 29, 2021).
Larsen, A., Larsen, J. R., and Lane, S. N. (2021). Dam builders and their works: beaver influences on the structure and function of river corridor hydrology, geomorphology, biogeochemistry and ecosystems. Earth-Science Rev. 218, 103623. doi:10.1016/j.earscirev.2021.103623
Lefebvre, K., Barbecot, F., Ghaleb, B., Larocque, M., and Gagné, S. (2013). Full range determination of ²²²Rn at the watershed scale by liquid scintillation counting. Appl. Radiat. Isotopes 75, 71–76. doi:10.1016/j.apradiso.2013.01.027
Lefebvre, K., Barbecot, F., Larocque, M., Gibert-Brunet, E., Gillon, M., Noret, A., et al. (2024). Using 222Rn to quantify wetlands interflow volume and quality discharging to headwater streams. Appl. Geochem. 169, 106037. doi:10.1016/j.apgeochem.2024.106037
Liu, W., Maxwell, B., Birgand, F., Youssef, M., Chescheir, G., and Tian, S. (2019). Multipoint high-frequency sampling system to gain deeper insights on the fate of nitrate in artificially drained fields. J. Irrigation Drainage Eng. 146 (1), 06019012. doi:10.1061/(ASCE)IR.1943-4774.0001438
Liu, J., Van Meter, K. J., McLeod, M. M., and Basu, N. B. (2021). Checkered landscapes: hydrologic and biogeochemical nitrogen legacies along the river continuum. Environ. Res. Lett. 16 (11), 115006. doi:10.1088/1748-9326/ac243c
Maxwell, M. (2020). PW-20-06 Burford water and wastewater servicing and drainage master plan. Available online at: https://engagebrant.ca/burford-servicing?tool=qanda (Accessed May 5, 2025).
May, H., Rixon, S., Gardner, S., Goel, P., Levison, J., and Binns, A. (2023). Investigating relationships between climate controls and nutrient flux in surface waters, sediments, and subsurface pathways in an agricultural clay catchment of the Great Lakes Basin. Sci. Total Environ. 864, 160979. doi:10.1016/j.scitotenv.2022.160979
Miller, M. P., Tesoriero, A. J., Hood, K., Terziotti, S., and Wolock, D. M. (2017). Estimating discharge and nonpoint source nitrate loading to streams from three end-member pathways using high-frequency water quality data. Water Resour. Res. 53, 10201–10216. doi:10.1002/2017WR021654
Ministry of the Environment, Conservation and Parks (MECP) (2023). Source protection information atlas. Available online at: https://www.lioapplications.lrc.gov.on.ca/SourceWaterProtection/index.html?viewer=SourceWaterProtection.SWPViewer&locale=en-CA (Accessed April 30, 2023).
Nikolenko, O., Jurado, A., Borges, A. V., Knӧller, K., and Brouyère, S. (2018). Isotopic composition of nitrogen species in groundwater under agricultural areas: a review. Sci. Total Environ. 621, 1415–1432. doi:10.1016/j.scitotenv.2017.10.086
Nsenga Kumwimba, M., Huang, J., Dzakpasu, M., De Silva, K., Ohore, O. E., Ajibade, F. O., et al. (2023). An updated review of the efficacy of buffer zones in warm/temperate and cold climates: insights into processes and drivers of nutrient retention. J. Environ. Manage. 336, 117646. doi:10.1016/j.jenvman.2023.117646
Ontario Ministry of Agriculture, Food and Rural Affairs (2025). Data from: tile drainage area. Ontario GeoHub. Available online at: https://geohub.lio.gov.on.ca/search?tags=agriculture.
Ontario Ministry of Natural Resources (OMNR) (2025). Aquatic resource area survey point: fisheries section, fish and wildlife branch, natural resources management division. Natural resources values information system. Peterborough, ON, Canada: Ontario GeoHub. Available online at: https://geohub.lio.gov.on.ca/datasets/lio::aquatic-resource-area-survey-point/about (Accessed May 2, 2025).
Osman, A. R. M. (2017). “Water use conflict: a characterization and water quantity study in an agriculturally stressed subcatchment in Southwestern Ontario,”. Guelph (ON): University of Guelph.
Pattrick, E., Levison, J., Binns, A., Larocque, M., and Goel, P. (2024). “Examining phosphorous transport and groundwater-surface water interactions in a Great Lakes Basin setting,” in GeoMontreal 2024 - 77th Canadian geotechnical conference and the 16th joint CGS/IAH-CNC groundwater conference. Hotel bonaventure, 15-18 september (Montreal, QC: Karma-Link Management Services Ltd. and X-CD Technologies Inc).
Pellerin, B. A., Stauffer, B. A., Young, D. A., Sullivan, D. J., Bricker, S. B., Walbridge, M. R., et al. (2016). Emerging tools for continuous nutrient monitoring networks: Sensors advancing science and water resources protection. J. Am. Water Resour. Assoc. 52 (4), 993–1008. doi:10.1111/1752-1688.12386
Pohle, I., Baggaley, N., Palarea-Albaladejo, J., Stutter, M., and Glendell, M. (2021). A framework for assessing concentration-discharge catchment behavior from low-frequency water quality data. Water Resour. Res. 57, e2021WR029692. doi:10.1029/2021WR029692
Ranalli, A. J., and Macalady, D. L. (2010). The importance of the riparian zone and in-stream processes in nitrate attenuation in undisturbed and agricultural watersheds - a review of the scientific literature. J. Hydrol. 389, 406–415. doi:10.1016/j.jhydrol.2010.05.045
Reville, F. D. (1883). “Part III: county of brant,” in The history of the county of brant, Ontario (Toronto, ON: Warner, Beers, and Co), 147–249.
Richards, G., Gilmore, T. E., Mittelstet, A. R., Messer, T. L., and Snow, D. D. (2021). Baseflow nitrate dynamics within nested watersheds of an agricultural stream in Nebraska, USA. Agric. Ecosyst. Environ. 308, 107223. doi:10.1016/j.agee.2020.107223
Rivett, M. O., Buss, S. R., Morgan, P., Smith, J. W. N., and Bemment, C. D. (2008). Nitrate attenuation in groundwater: a review of biogeochemical controlling processes. Water Res. 42 (16), 4215–4232. doi:10.1016/j.watres.2008.07.020
Rixon, S., May, H., Persaud, E., Elsayed, A., Levison, J., Binns, A., et al. (2024). Subsurface influences on watershed nutrient concentrations and loading in a clay dominated agricultural system. J. Hydrol. 645, 132140. doi:10.1016/j.jhydrol.2024.132140
Rozemeijer, J., Jordan, P., Hooijboer, A., Kronvang, B., Glendell, M., Hensley, R., et al. (2025). Best practice in high-frequency water quality monitoring for improved management and assessment; a novel decision workflow. Environ. Monit. Assess. 197, 353. doi:10.1007/s10661-025-13795-z
Saccò, M., Mammola, S., Altermatt, F., Alther, R., Bolpagni, R., Brancelj, A., et al. (2024). Groundwater is a hidden global keystone ecosystem. Glob. change Biol. 30 (1), 17066. doi:10.1111/gcb.17066
Saleem, S., Levison, J., Parker, B., Martin, R., and Persaud, E. (2020). Impacts of climate change and different crop rotation scenarios on groundwater nitrate concentrations in a sandy aquifer. Sustainability 12 (3), 1153. doi:10.3390/SU12031153
Seabird Scientific (2024). User manual SUNA V2 submersible ultraviolet nitrate analyzer - revision J. Available online at: https://www.seabird.com/nutrient-sensors/suna-v2-nitrate-sensor/family-downloads?productCategoryId=54627869922 (Accessed July 7, 2024).
Shabaga, J. A., and Hill, A. R. (2010). Groundwater-fed surface flow path hydrodynamics and nitrate removal in three riparian zones in southern Ontario, Canada. J. Hydrol. 388, 52–64. doi:10.1016/j.jhydrol.2010.04.028
Shephard, M. W., Mekis, E., Morris, R. J., Feng, Y., Zhang, X., Kilcup, K., et al. (2014). Trends in Canadian short-duration extreme rainfall: including an intensity–duration–frequency perspective. Atmosphere-Ocean 52 (5), 398–417. doi:10.1080/07055900.2014.969677
Shifflett, S., Kovacs, H., and Wong, A. (2014). Agricultural irrigation: forecasts for future water needs. Grand River Watershed Water Manag. Plan. Camb. Grand River Conservation Auth. Available online at: https://www.grandriver.ca/our-watershed/water/water-management-plan/studies-and-reports/.
Speir, S. L., Tank, J. L., Bieroza, M., Mahl, U. H., and Royer, T. V. (2021). Storm size and hydrologic modification influence nitrate mobilization and transport in agricultural watersheds. Biogeochemistry 156, 319–334. doi:10.1007/s10533-021-00847-y
Statistics Canada (2023). Data from: census profile, 2021 census of population. Stat. Can. Cat. No. 98-316-X2021001. Available online at: https://www12.statcan.gc.ca/census-recensement/2021/dp-pd/prof/index.cfm?Lang=E (Accessed August 12, 2025).
Stumm, W., and Morgan, J. J. (1996). “Oxidation and reduction; equilibria and microbial mediation,” in Aquatic chemistry: chemical equilibria and rates in natural waters, environmental science and technology (New York, NY: Wiley), 425–515.
Su, F., Wu, J., Wang, D., Zhao, H., Wang, Y., and He, X. (2022). Moisture movement, soil salt migration, and nitrogen transformation under different irrigation conditions: field experimental research. Chemosphere 300, 134569. doi:10.1016/j.chemosphere.2022.134569
Sukanya, S., Noble, J., and Joseph, S. (2022). Application of radon (222Rn) as an environmental tracer in hydrogeological and geological investigations: an overview. Chemosphere 303 (3), 135141. doi:10.1016/j.chemosphere.2022.135141
United Nations (2022). The united Nations world water development report 2022: groundwater: making the invisible visible. Paris: UNESCO.
Venkiteswaran, J. J., Schiff, S. L., and Ingalls, B. P. (2019). Quantifying the fate of wastewater nitrogen discharged to a Canadian river. Facets 4 (1), 315–335. doi:10.1139/facets-2018-0028
Walton, C. R., Zak, D., Audet, J., Petersen, R. J., Lange, J., Oehmke, C., et al. (2020). Wetland buffer zones for nitrogen and phosphorus retention: impacts of soil type, hydrology and vegetation. Sci. Total Environ. 727, 138709. doi:10.1016/j.scitotenv.2020.138709
Wang, Y., Yuan, S., Shi, J., Ma, T., Xie, X., Deng, Y., et al. (2023). Groundwater quality and health: making the invisible visible. Environ. Sci. and Technol. 57 (13), 5125–5136. doi:10.1021/acs.est.2c08061
Ward, M. H., Jones, R. R., Brender, J. D., de Kok, T. M., Weyer, P. J., Nolan, B. T., et al. (2018). Drinking water nitrate and human health: an updated review. Int. J. Environ. Res. Public Health 15 (7), 1557. doi:10.3390/IJERPH15071557
Watson, S. B., Miller, C., Arhonditsis, G., Boyer, G. L., Carmichael, W., Charlton, M. N., et al. (2016). The re-eutrophication of Lake Erie: harmful algal blooms and hypoxia. Harmful Algae 56, 44–66. doi:10.1016/j.hal.2016.04.010
Wei, X., Bailey, R. T., Records, R. M., Wible, T. C., and Arabi, M. (2019). Comprehensive simulation of nitrate transport in coupled surface-subsurface hydrologic systems using the linked SWAT-MODFLOW-RT3D model. Environmental Modelling & Software 122, 104242. doi:10.1016/j.envsoft.2018.06.012
Williams, M. R., King, K. W., and Fausey, N. R. (2015). Contribution of tile drains to basin discharge and nitrogen export in a headwater agricultural watershed. Agric. Water Manag. 158, 42–50. doi:10.1016/J.AGWAT.2015.04.009
Wilson, T. P., Miller, C. V., Lechner, E. A., and Survey, U. S. G. (2024). “Guidelines for the use of automatic samplers in collecting surface-water quality and sediment data,” in Techniques and methods 1-D12 (Reston, VA: U.S. Geological Society). doi:10.3133/tm1D12
Wollheim, W. M., Mulukutla, G. K., Cook, C., and Carey, R. O. (2017). Aquatic nitrate retention at river network scales across flow conditions determined using nested in situ sensors. Water Resour. Res. 53 (11), 9740–9756. doi:10.1002/2017WR020644
World Health Organization (2021). A global overview of national regulations and standards for drinking-water quality. second edition. Geneva: Licence: CC BY-NC-SA 3.0 IGO. Available online at: https://www.who.int/publications/i/item/9789240023642 (Accessed July 25, 2025).
Xylem, Y. S. I. (2020). EXO user manual: advanced water quality monitoring platform. YSI, a Xylem brand. 603789REF Revis. K.
Keywords: nitrate, agricultural watershed, groundwater quality, surface water quality, storm event analysis
Citation: Zeuner C, Levison J and Larocque M (2025) Insights on nitrate transport in a shallow, sandy aquifer at various temporal and spatial scales. Front. Environ. Sci. 13:1641345. doi: 10.3389/fenvs.2025.1641345
Received: 04 June 2025; Accepted: 29 August 2025;
Published: 25 September 2025.
Edited by:
Krishnaswamy Jayachandran, Florida International University, United StatesReviewed by:
Peiyue Li, Chang’an University, ChinaNadeesha Ukwattage, University of Colombo, Sri Lanka
Copyright © 2025 Zeuner, Levison and Larocque. This is an open-access article distributed under the terms of the Creative Commons Attribution License (CC BY). The use, distribution or reproduction in other forums is permitted, provided the original author(s) and the copyright owner(s) are credited and that the original publication in this journal is cited, in accordance with accepted academic practice. No use, distribution or reproduction is permitted which does not comply with these terms.
*Correspondence: Christina Zeuner, Y3pldW5lckB1b2d1ZWxwaC5jYQ==