 Jingru Chen
 Qingqing Zhou
 Shengzhen Wu
 Yabing Huang
- 1College of Arts and Design, Jimei University, Xiamen, China
- 2College of Environmental Science & Engineering, Huazhong University of Science and Technology, Wuhan, China
- 3College of Fine Arts, Minjiang University, Fuzhou, China
The network structure and connectivity of green spaces play a crucial role in ecosystem functionality. However, there are still many challenges in improving the structure of urban green space systems (GSS) through quantitative scientific methods. In particular, there is an obvious lack of how to integrate quantitative landscape pattern analysis with multi-scenario network analysis, which leads to insufficient scientific and operationalization of green space system optimization. This paper aims to present a methodological framework for planning and constructing green networks within urban green space system planning (GSSP), using the GSSP of Fuzhou as a case study. The results of the study show that: (1) 18 GPAs were classified with GPA 4 (2287.66 km2) showing the highest connectivity importance (dPC = 88.459); (2) the Min River corridor (GPA 10) and urban coastal wetlands (GPA 17) emerged as strategically vital despite spatial constraints; (3) scenario analysis identified Scenario 1 (α = 0.26, CR = 0.999) as the optimal network configuration. This research establishes a structured GSSP approach that not only addresses urban ecological continuity issues but also provides a replicable model for enhancing biodiversity and ecological health in urban settings, offering insights and implications for achieving sustainable development goals in future regions.
1 Introduction
As an integral part of the terrestrial ecosystem, green space plays a crucial role in contributing to human health, urban development, and regional ecology (Hong et al., 2025; Garcia-García et al., 2020). However, research has shown that human activities have had a significant negative impact on green space ecosystems during urbanization (Ghale et al., 2025; Hasan et al., 2020). According to statistics, the built-up area of China increases from 2.24 × 10⁴ km2 to 6.37 × 10⁴ km2 from 2000 to 2022, with an average annual growth rate of about 4.87%. This means that the previous urban construction model is becoming more and more outdated in China, which is taking the road of sustainable development, and it is urgent to actively explore the optimization of urban green space system (Jiang et al., 2022). Meanwhile, numerous studies have confirmed the critical role of green space connectivity in maintaining urban biodiversity and ecosystem services. For example, Fenoglio et al. (2020) showed that habitat fragmentation in urban areas leads to significant biodiversity loss, with insect populations in fragmented green spaces declining by as much as 40%. And Sun et al. (2024) found that increasing the connectivity and area of green spaces can achieve effective cooling. These further emphasize the importance of improving green space connectivity in building urban ecological patterns and promoting sustainable urban development.
In China, large-scale and rapid urbanization has drastically altered land use, particularly through extensive shrinkage and fragmentation of green space, leading to ecological degradation and environmental challenges (Luo et al., 2020; Kuang et al., 2020; Li et al., 2018). In recent years, China has issued a number of strategic documents, including the Strategy and Action Plan for Biodiversity Conservation and the Measures for Evaluation and Assessment of Ecological Civilization Construction Targets (Zhang et al., 2024), to actively promote the expansion of urban green space, the construction of ecological networks and the management of species conservation. Green Space System Planning (GSSP), a specialized form of urban planning in China, plays a vital role in protecting green spaces (Ministry of Housing and Urban-Rural Development, 2019). The focus of GSSP has shifted from primarily addressing urban areas to encompassing the entire city space, moving from secondary importance to a higher-level status that shapes the structure and development of cities. However, research on improving the structure of the city green space system (GSS) through quantitative scientific methods still faces many challenges. Previous studies have focused on green infrastructure and its connectivity at the urban or smaller scale (Zhao et al., 2019; Davies and Lafortezza, 2017). Moreover, converting complex assessment and calculation processes into concise and easy-to-understand image data to support planning needs further study.
This study takes the city GSSP of Fuzhou as an example, focusing on the continuity and connectivity of the GSS, addressing the critical challenge of balancing rapid urbanization with ecological conservation in coastal cities. Focusing on the continuity and connectivity of GSS, we develop an integrated framework for ecological network optimization that combines quantitative landscape analysis with spatial modeling. Firstly, green protected area (GPA) delineation based on Conefor connectivity analysis. Secondly, ecological corridors were constructed through ArcGIS minimum cumulative resistance (MCR) model and strategic nodes were identified using gravity model and network analysis. This paper seeks to answer the following questions: (1) What methods are employed in city-level GSSP? (2) Which tools and software packages can support the planning process? (3) How can assessments and calculations be transformed into clear, concise visual representations that support the planning process?
2 Study area, materials and methods
2.1 Study area
Fuzhou is located in the eastern part of Fujian Province, China, within the southeastern coastal region (Figure 1). It borders the East China Sea to the east, covering a total area of 11968 square kilometers and a coastline of 1137 km. The Min River flows through the city for 150 km, with over 30 tributaries. The city’s landscape is primarily characterized by mountains and hills, while tidal flats, plains, and basins make up approximately 30% of the total land area. The forest coverage rate in Fuzhou is approximately 45%, and its rich landscape pattern provides a complex and diverse research scenario for GSSP. However, Fuzhou, as a rapidly urbanizing coastal capital city, faces typical problems such as green space fragmentation and impaired ecological connectivity, so it is urgent to optimize its green space system.
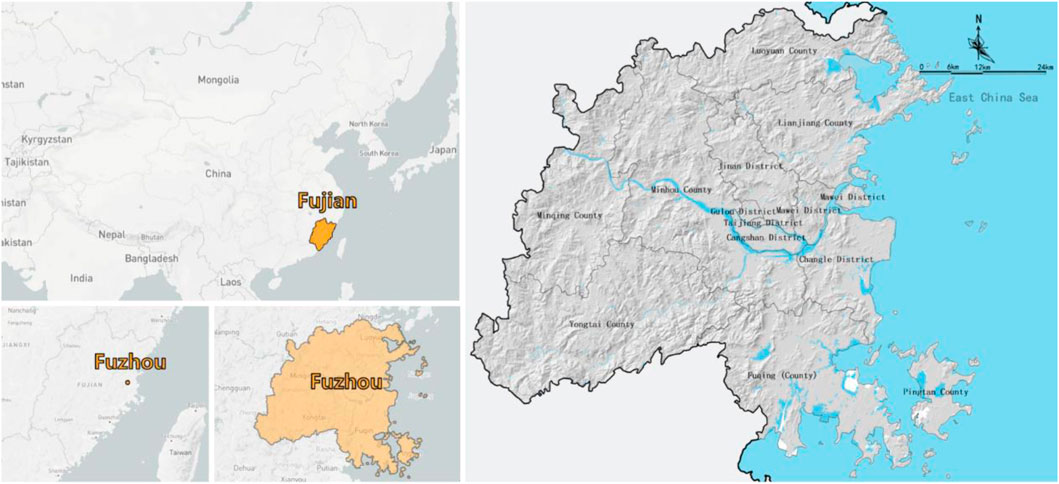
Figure 1. Location and map of Fuzhou.
2.2 Materials and methods
Primary data for the analysis were sourced from relevant platforms, including the Geospatial Data Cloud and the Geographical Information Monitoring Cloud Platform (https://www.gscloud.cn/sources/?cdataid=302&pdataid=10, http://www.dsac.cn/DataDownLoad/Search?dataID=301400). Information related to the Fuzhou Master Plan was provided by the Fuzhou Planning and Design Institute.
The analysis began with GIS preprocessing of the necessary data. Fragstats 4.4 was then employed to conduct a landscape index analysis to assess current land use patterns. Following this, Conefor 2.6 was used to evaluate connectivity and classify ecological protection areas (GPAs). The minimum cumulative resistance model (MCR) was applied to identify ecological corridors, while the gravity model and network analysis methods were utilized to define the first-level corridors. Finally, green strategic nodes were identified through the intersection of the minimum and minimum-maximum resistance corridors, establishing the “area-corridor-node” structure within the city’s GSSP (Figure 2).
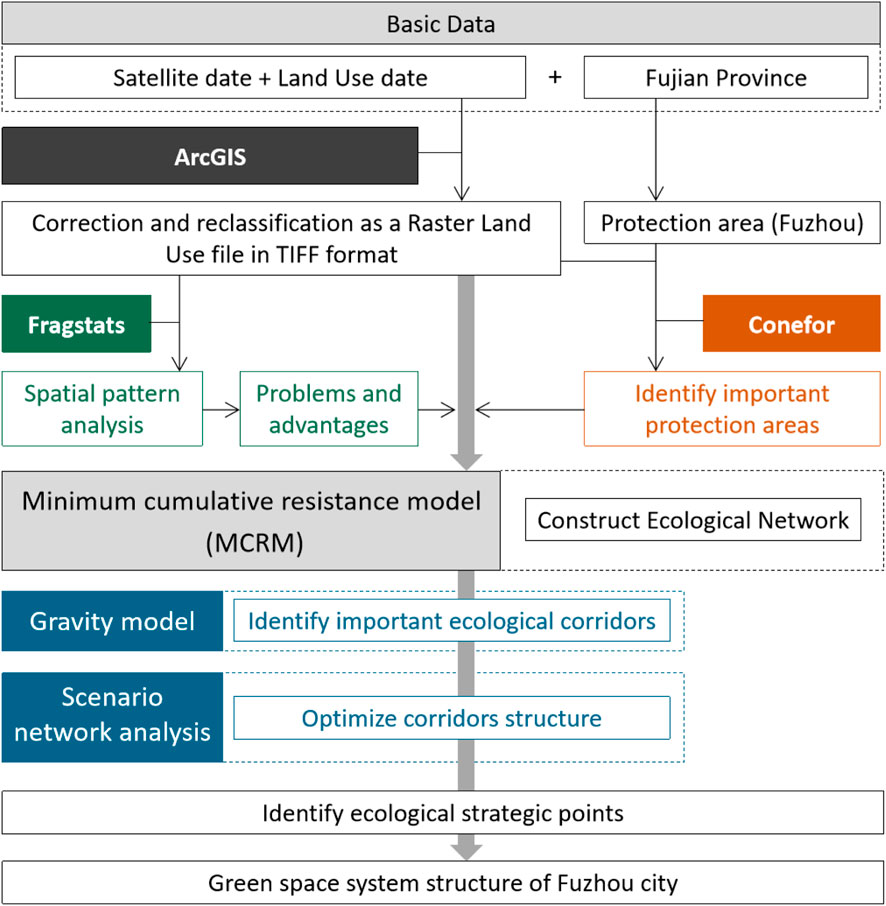
Figure 2. Visualization of the research process.
2.3 Obtaining a land use raster map
GIS was used to correct and reclassify Fuzhou’s land use status data (provided by the Fuzhou Planning and Design Institute), satellite image data, and the Master Planning. There are a total of five land use categories, including arable land, wood land, grass, waters and construction land. And then data were converted into Tiff files as the base map for the remaining analysis work, and resampling the resolution to 100 m, as shown in Figure 3.
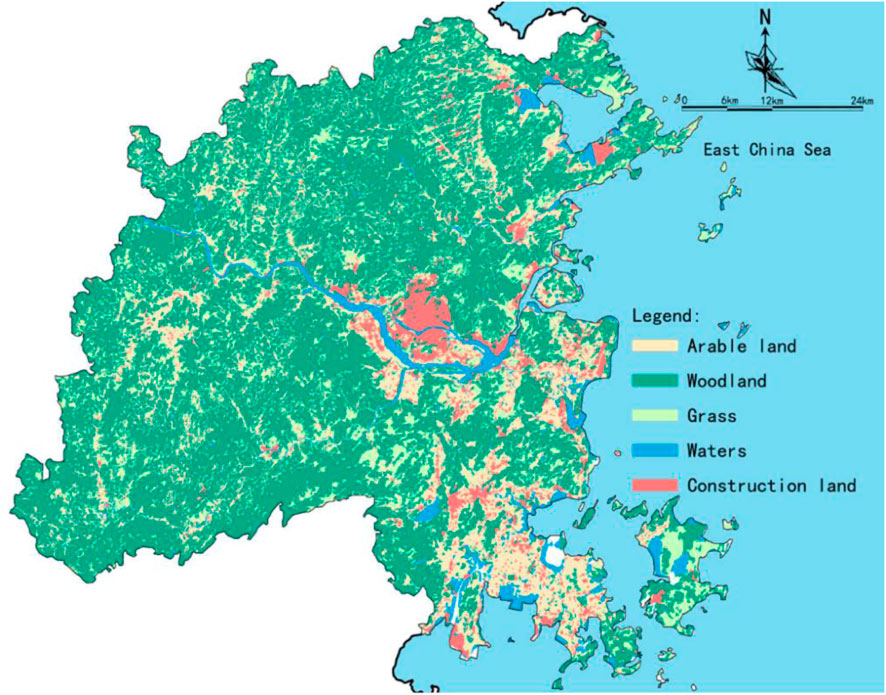
Figure 3. Fuzhou city land use status map.
2.4 Landscape pattern evaluation method
Landscape pattern index analysis is a critical method in spatial pattern analysis and is considered essential for GSSP (Qiao et al., 2024). Fragstats, one of the most widely used landscape pattern analysis software packages, operates at three analytical scales—patch, class, and landscape—and can analyze over 60 landscape indicators (Bhattacharya et al., 2024). These pattern indices reflect properties such as the type, diversity, complexity, and connectivity of landscape patches. The results from the quantitative analysis of landscape patterns can significantly assist in GSSP. In this study, land use types were categorized into five classes: woodland, grassland, arable land, water, and construction land. Additionally, 11 landscape indices closely related to GSSP were selected for analysis, including class area (CA), percent of landscape (PLAND), and number of patches (NP).
2.5 Classification method of the GPA
Based on scenic areas, nature reserves, and geologically vulnerable zones identified in the Fuzhou Master Plan, ecological land types such as woodland, grassland, and water areas were re-evaluated to delineate 18 GPAs (Figure 4).

Figure 4. Process diagram of GPA determination in Fuzhou.
Many studies have pointed out that the connection between ecological areas plays a vital role for ecological functions, the maintenance of biodiversity, and ecological vitality (Pietsch, 2018; Montis et al., 2016). We used the probability of connectivity metric (
where
2.6 Minimum cumulative resistance model
Minimum cumulative resistance model (MCR) is a model for calculating the minimum cumulative resistance from a grid-based map on which estimated dispersal resistances basic on landscape types (Guo et al., 2025; Sun et al., 2024). The calculation formula used was as follows (Equation 3):
where
Land use type was the main factor for the resistance surface of Fuzhou GSSP. Referencing related studies (Fu et al., 2020) and considering Fuzhou’s actual situation, we built the resistance value system, as shown in Table 1. According to the resistance value, GIS (Arc Toolbox - Spatial Analyst - Raster Reclass - Reclassify) was used to develop the resistance surface graphics (Figure 5).
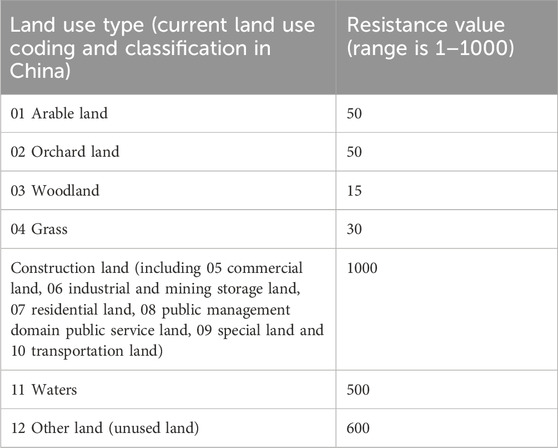
Table 1. Resistance values of different land use types in Fuzhou.
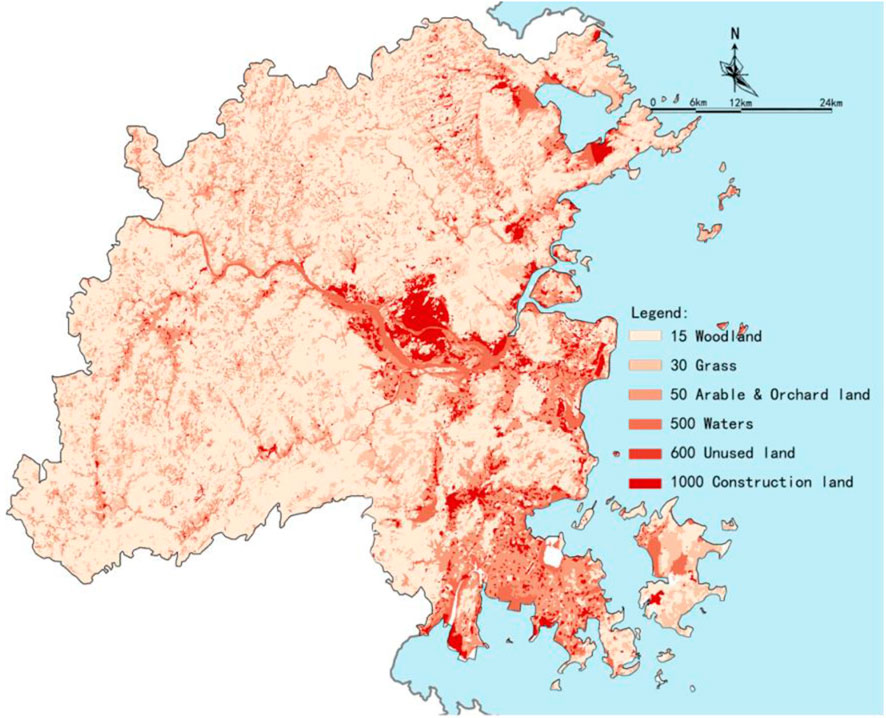
Figure 5. Resistance surface of land use in Fuzhou.
Scholars have used the MCR in the field of ecological planning, with some success (Zhu et al., 2020; Xu et al., 2018). In the Fuzhou GSSP, MCR was used to construct ecological corridors with minimal resistance and green strategic nodes.
2.6.1 Ecological corridors with minimal resistance
GIS (Data Management Tools - Features - Feature to Point) was used to turn GPAs into sources, and to execute path generation commands (Spatial Analysis - Distance - Cost distance/Cost path) to build corridors (Figure 6).

Figure 6. Schematic diagram of corridor generation, Fuzhou.
The ecological corridors of the GSS are comprehensive corridors used to prevent the problems of green space fragmentation and ecological function degradation caused by urban development. At the same time, these corridors also provide vital landscape passages (or greenways) for regional recreational activities. The corridors of Fuzhou’s GSS were based on the minimum resistance between GPAs. The corridors’ main functions determine its width (Liu et al., 2020; Peng et al., 2017), as shown in Table 2.
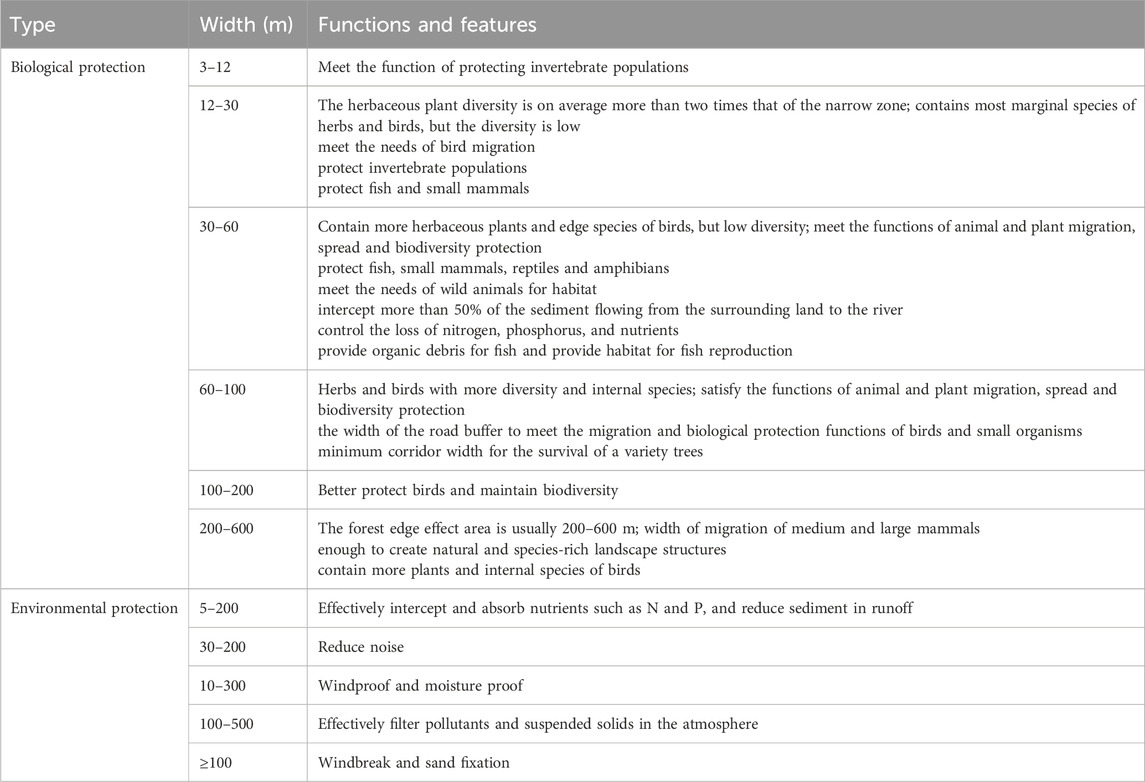
Table 2. Function-based ecological corridor width specifications.
2.6.2 Green strategic nodes
The green strategic nodes of the GSS can be divided into two categories (Yu, et al., 2018). One is the current node, which is the intersection between the minimal resistance corridors, taking protected measures. The other is the minimum-maximum node, which is in the saddle formed at the tangent part of the equivalent resistance line centered on GPA. It is the minimum-maximum value on the resistance surface, which can be regarded as an area weak in ecological function. Taking a protection patch is the primary measure, and the identification method is as shown in Figure 7.
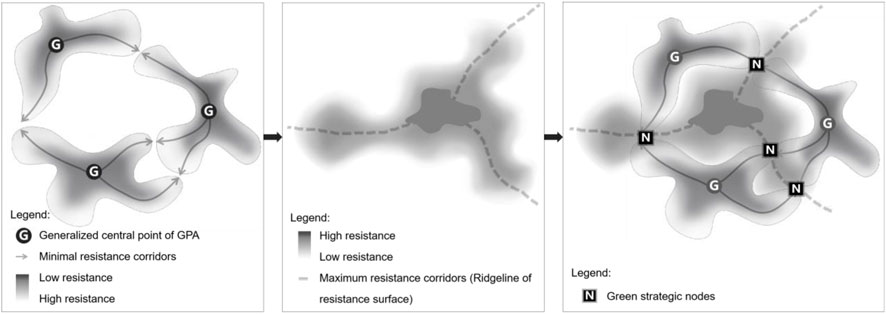
Figure 7. Recognition methods of the minimum-maximum value nodes.
For the Fuzhou GSSP, we reconstructed a new resistance value that was inversely related to the original resistance value system, and repeated the ecological corridor construction process in GIS. The resulting ecological corridors could be regarded as the maximum corridors of the original resistance surface. The intersection areas of the minimum and the minimum corridors were the green strategic nodes (Figure 8).
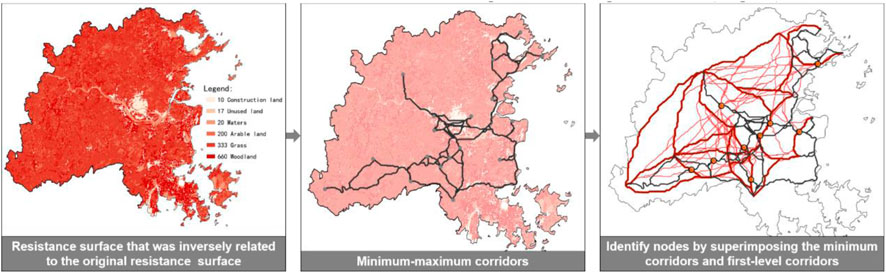
Figure 8. Diagram presenting the identification of the green strategic nodes for Fuzhou’s GSSP.
2.7 The gravity model for the selection of first-level corridors
Usually, a gravity model provides an estimate of the volume of flows of, for example, goods, services, or people between two or more locations. In recent years, some scholars have used the model in the field of ecological planning and corrected the formula to better adapt to the actual requirements of the planning (Yang et al., 2017a). The formula as shown below (Equation 4):
where
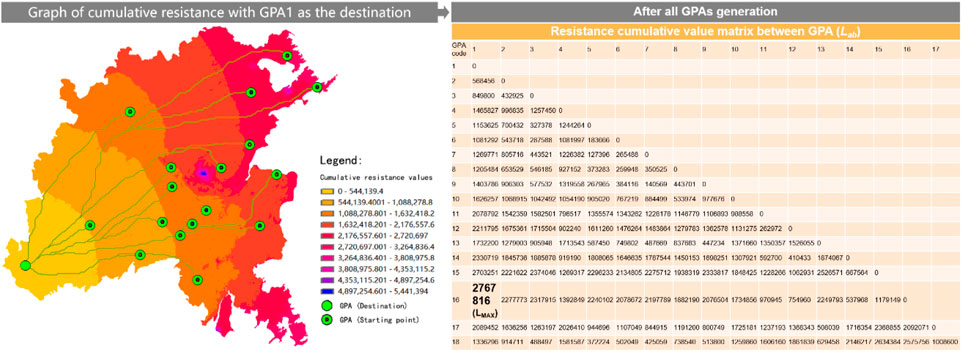
Figure 9. Schematic diagram of
2.8 Network analysis
Combining with the
where
where
where
where
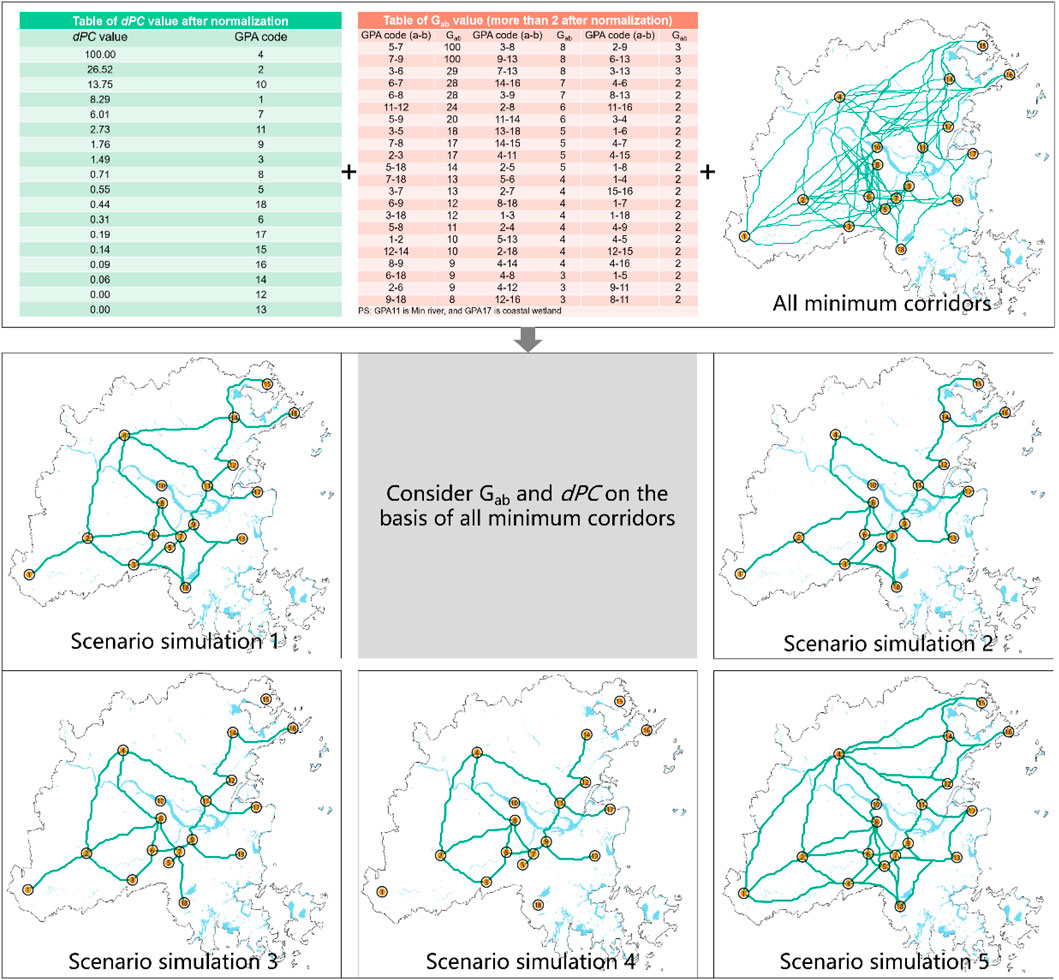
Figure 10. The scenario simulations of the first-level corridors network in Fuzhou.
3 Results
3.1 Status quo landscape indexes analysis with class-level metrics
The analysis results of landscape pattern indexes in Fragstats 4.2 are shown in Table 3. The woodland, which was the main component of the GPP, had apparent advantages compared with other types of land in terms of CA, CONNECT, AI, PLAND, and TE. The analysis showed the landscape base of Fuzhou city as well. For the GSSP, the main task was to protect the green quantity and maintain a green space structure.
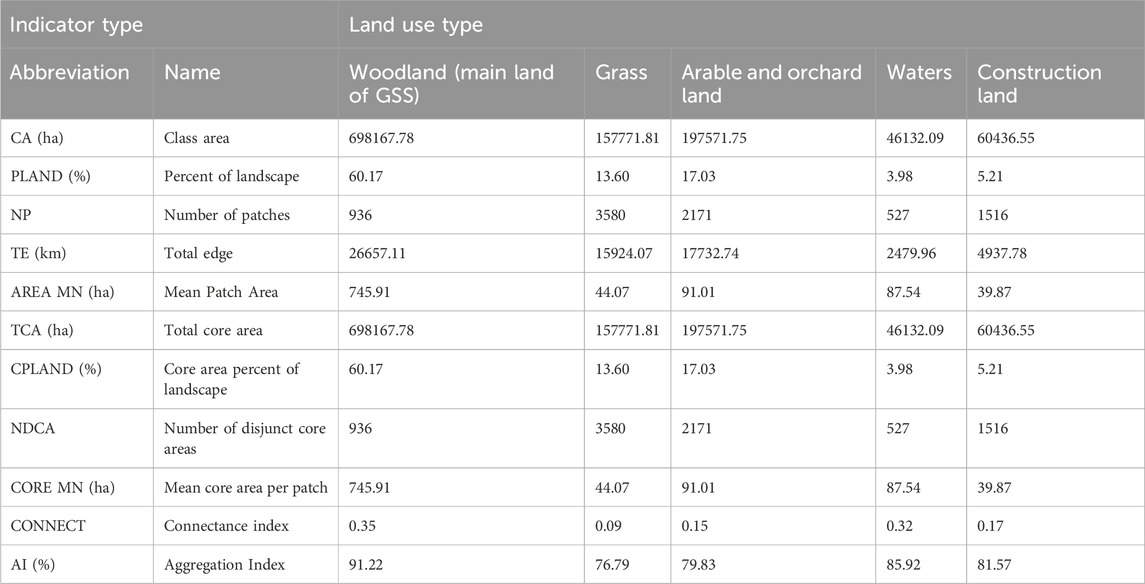
Table 3. Analysis results of Fuzhou landscape pattern indexes with class-level metrics.
3.2 Classification of the GPAs
Conefor is a software package that allows quantifying the importance of habitat areas and links for the maintenance or improvement of connectivity. We took the
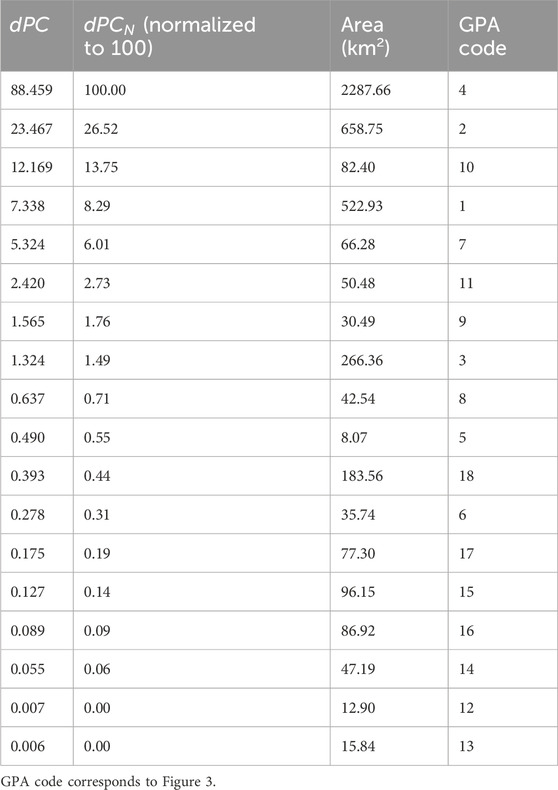
Table 4. Connectivity level of GPA in Fuzhou City.
According to the
3.3 The construction of minimum resistance corridors
As Figure 11 shows, mountains surround the north and southwest sides of the Fuzhou urban area, and the minimum resistance corridors between GPAs intersected in these areas, playing an essential role in the connectivity between GPAs and thus representing essential parts of Fuzhou’s GSS.
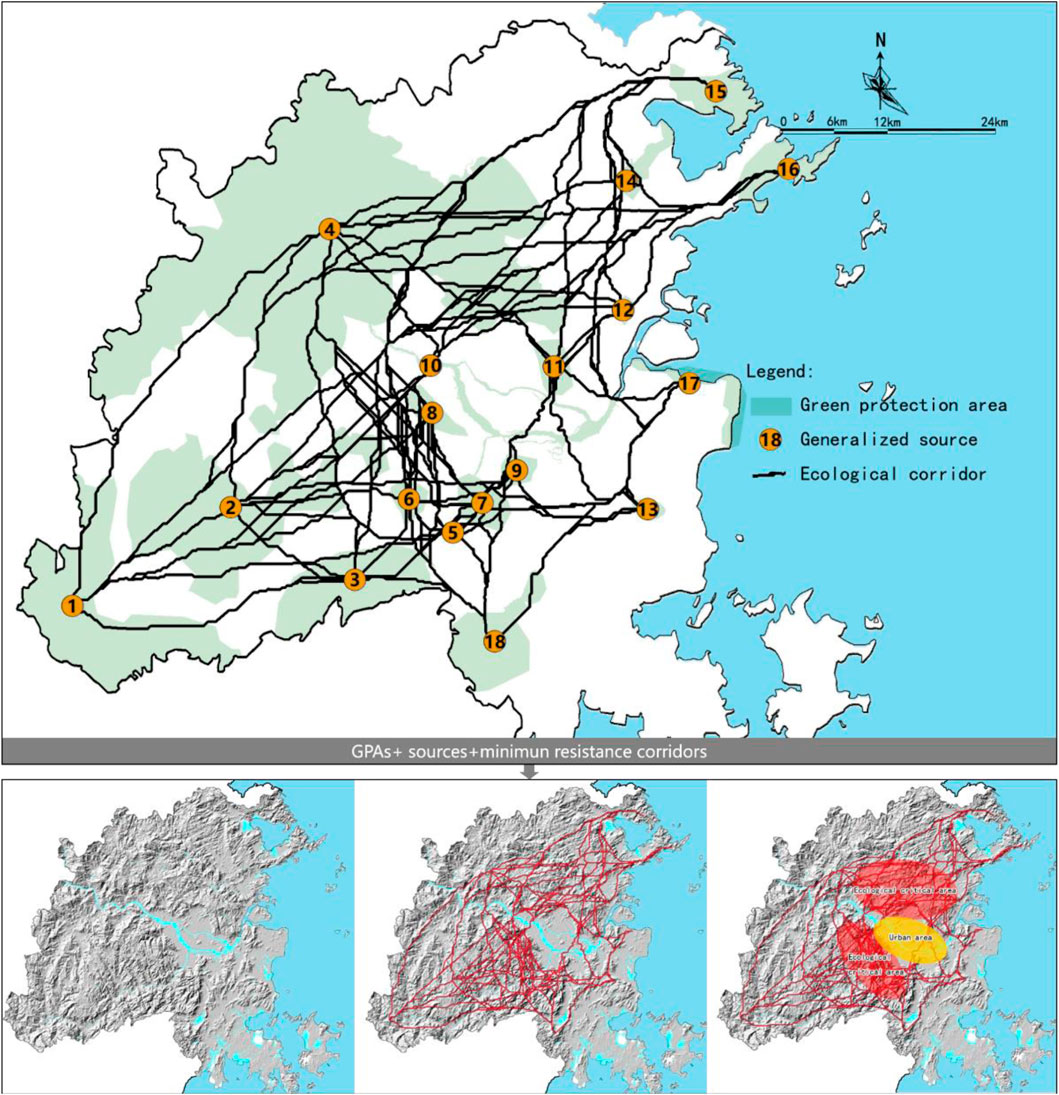
Figure 11. The minimum resistance corridors of the Fuzhou GSS.
3.4 First-level ecological corridors and network of GSS
We normalized the gravity model’s calculation results to 100,helping to identify the optimal corridors for the first-level corridors (Table 5). According to the

Table 5. Calculation results of the gravity model.
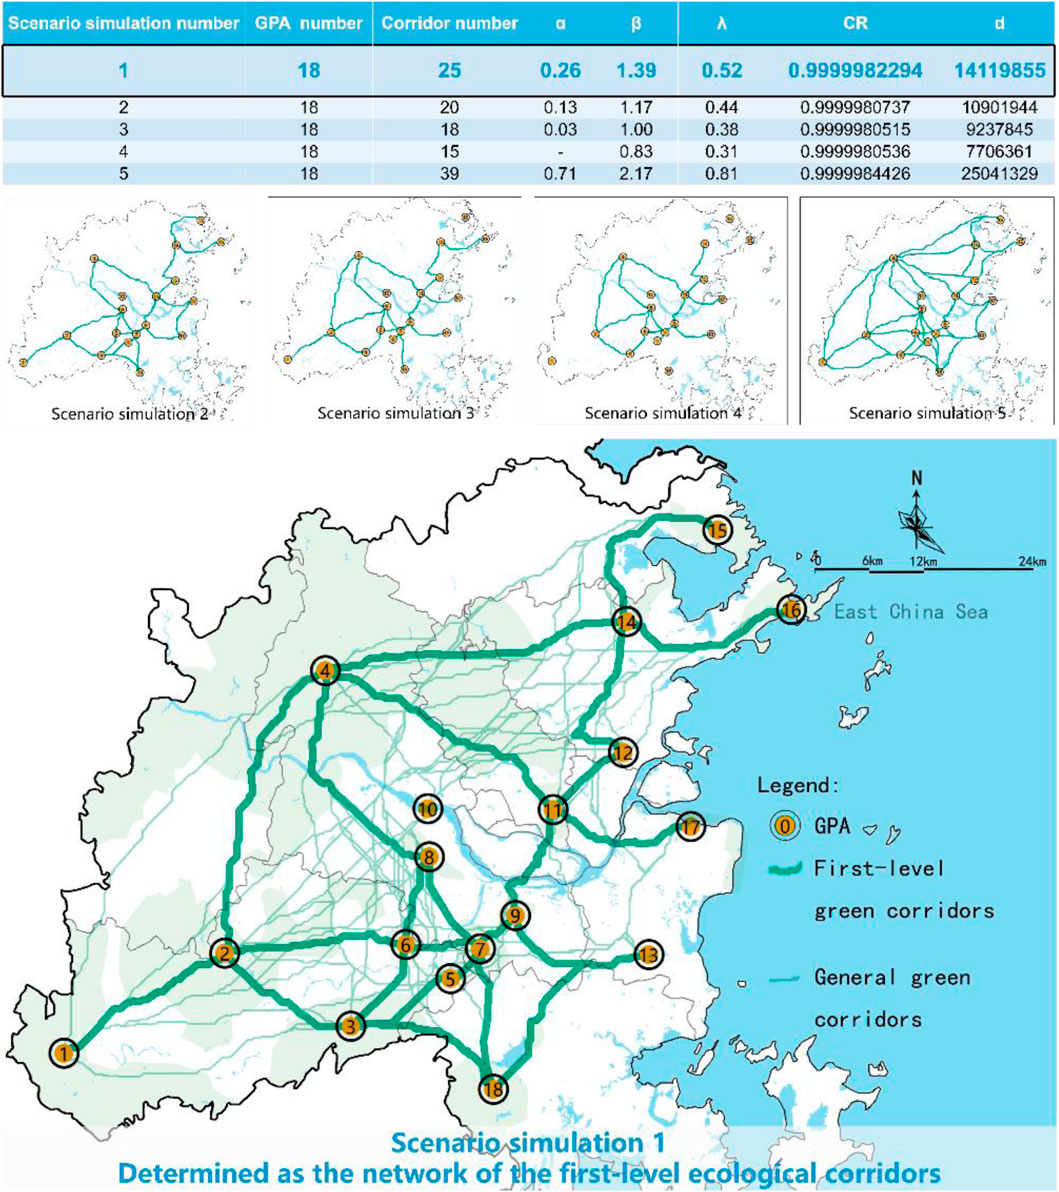
Figure 12. Network analysis results and first-level ecological network of Fuzhou GSSP.
The ecological corridor between GPA 9 and 11 was the only ecological corridor that spanned the entire urban area. It plays a crucial role in the green connection of the northern and southern urban areas, while also linking urban and suburban areas of Fuzhou. More attention should be paid to protection and construction of this vital corridor.
3.5 Green strategy nodes of GSS
As shown in Figure 13, the intersection of ecological corridors were the green strategic nodes. It was found that GPA 6, 7, 8, 9, and 11 were located at multiple intersections of ecological corridors, and played an essential role in the connectivity between GPAs. They could be regarded as GPAs of strategic importance.
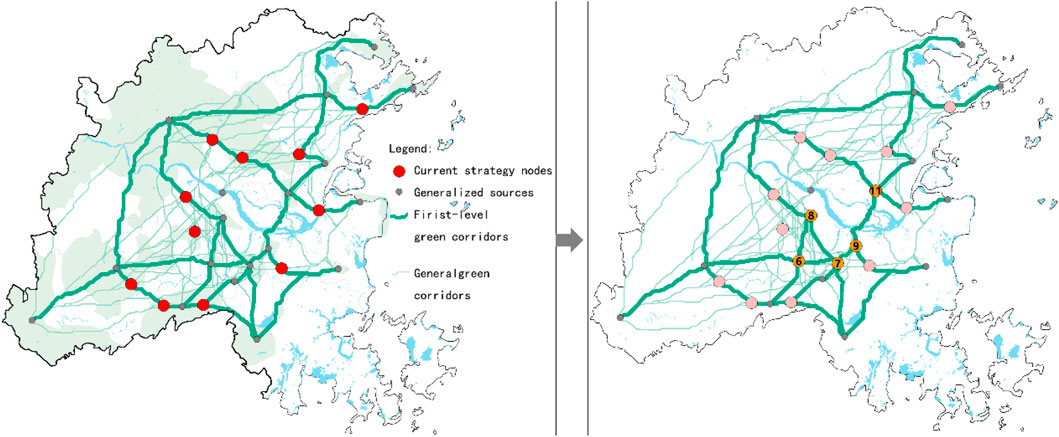
Figure 13. Current strategy nodes and GPA.
Since low-resistance woodland occupied a substantial part of Fuzhou City, the number of maximum resistance corridors generated was small, and the area where they intersected with the minimum resistance corridor is the minimum-maximum resistance strategic nodes. As shown in Figure 14, strategic nodes 1 and 2 were located in the urban area and the corridor between GPA 9 and 11, which were of strategic importance.
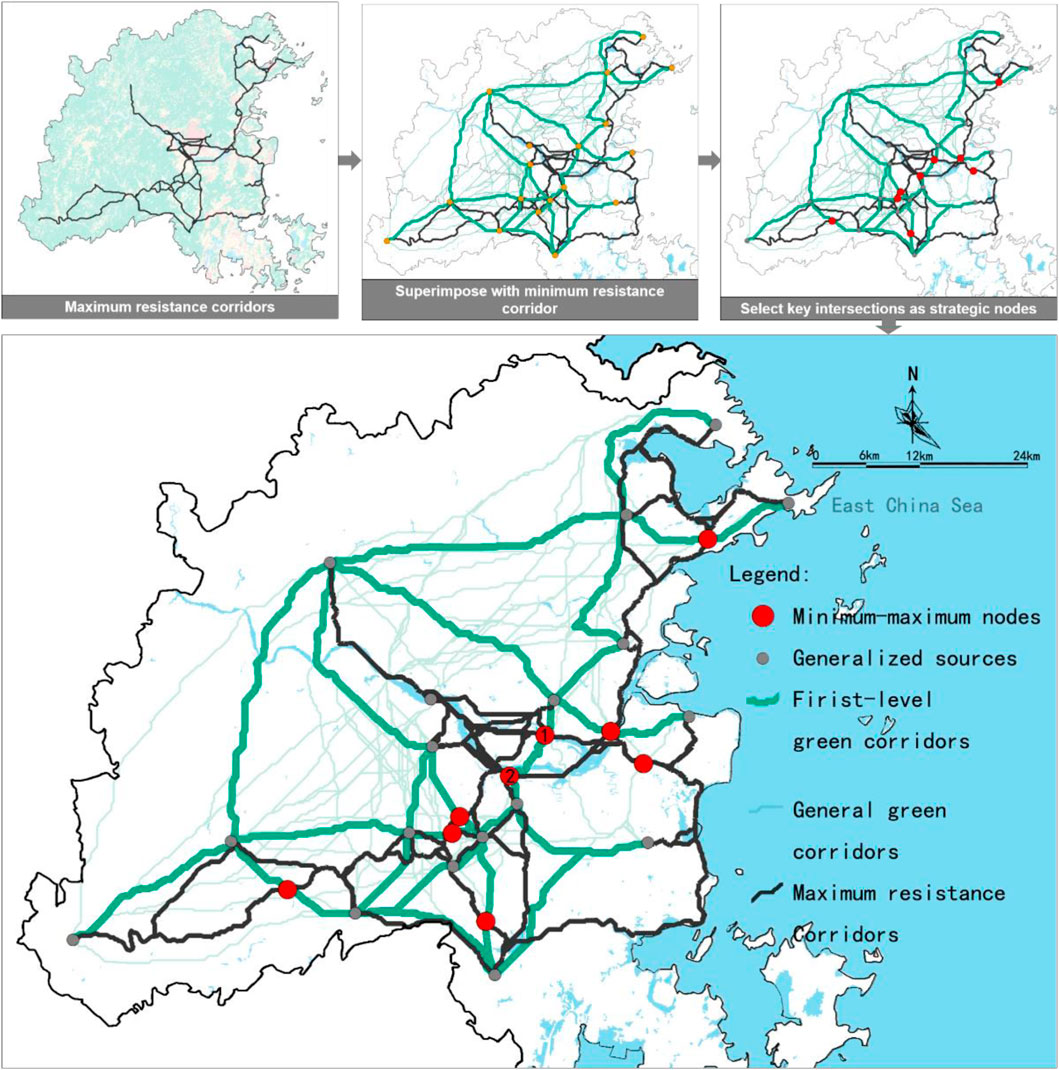
Figure 14. The minimum-maximum resistance strategic nodes of Fuzhou city.
4 Discussion
This study aimed to develop an integrated framework for optimizing green space connectivity in Fuzhou’s city-level GSSP, with particular focus on addressing ecological fragmentation in coastal urban environments. The analysis demonstrates that combining landscape pattern indices (Fragstats), connectivity metrics (Conefor), and spatial modeling (ArcGIS) effectively identifies strategic conservation areas and corridors. Notably, GPAs with high dPC values function as critical connectivity hubs, while the gravity-model-optimized network (Scenario 1) balances ecological and planning constraints. These findings advance previous green infrastructure studies by quantitatively linking landscape metrics to actionable planning decisions. At the same time, it is particularly important for the planning of green space systems in rapidly urbanizing coastal cities.
4.1 The classification of GPAs
This study uses the Conefor connectivity indicator to classify GPAs, which fits the international trend of prioritizing the protection of critical urban green spaces, while targeting the particular challenges of coastal urbanization in Fuzhou. Similar to the research of Verma et al. (2020), Kefalas et al. (2019), and Xu et al. (2018), individual diversities of GPA type and area were identified in Fuzhou. In particular, there was a significant difference between the area around the urban and suburban areas, as well as differences in functions, as also shown by the studies of García et al. (2020), and Li Collins et al., 2020. Conefor 2.6, which takes connectivity as the primary standard and characteristic, can quickly identify the importance value of a GPA (Qian et al., 2023). However, compared to the common single modeling strategy of MSPA and connectivity analysis in traditional GSSP (Xu et al., 2023), this study proposes the Fragstats- Conefor framework in the source site identification stage. Ecological sources with higher conservation priority are identified through this dual-model extraction framework.
In the analysis process for Fuzhou City, it was found that some GPAs were small in size, but their location in a prominent position resulted in high
4.2 Green network analysis
In the process of constructing ecological corridors using the minimum resistance model (Guo et al., 2025), we found that the assignment of resistance values was somewhat subjective. The range of values used in different studies varied significantly (Fu et al., 2020), which had a substantial impact on the form of the corridors. Some studies employed a multiplex resistance surface, integrating data such as DEM, land use type, and NDVI (Yang et al., 2024). For the Fuzhou GSSP, after consulting with experts from relevant planning and management departments, we used land use type as the basis for the resistance surface. By considering the actual conditions, we ensured that the corridor simulations accurately reflected the situation on the ground.
Using the gravity model to quantify the
As in the research of Lu et al. (2025) and Yang et al. (2017b), the
In terms of network structure, we introduced the loop index
4.3 Green strategic nodes
Basing on the previous research (Lu et al., 2025; Yang et al., 2024), we identified green strategic nodes of minimum-maximum resistance at the intersections of the minimum and maximum resistance corridors. Unlike the method of identifying the ridgeline of the resistance surface (Fu et al., 2022), the approach used in the Fuzhou GSSP identified fewer nodes. However, this method was more straightforward and better suited for large-scale ecological planning, such as city-level planning. During the identification process, we found that certain GPAs, such as GPA 6, 7, 8, 9, and 11, played a crucial role in the connectivity of GPAs (Figure 13). These GPAs acted as stepping stones and key building blocks for the green network, effectively linking urban green spaces with suburban green spaces, and can therefore be considered strategic GPAs.
4.4 Expansion of green space functions
This study focused solely on establishing the ecological structure of the GSS at the city level. However, to fully realize the potential of the green space system, more attention must be paid to its ecological and service functions (Cao et al., 2024). GSSP needs to integrate multiple functions with the local urban development context to ensure the rationality of the ecological structure and provide further guidance for urban GSSP.
4.5 Expansion of the use of the planning methods
The methodology adopted in the Fuzhou GSSP quantified relevant planning indicators, making the planning process more scientific and rational. The preliminary results of the green network in Fuzhou GSSP were largely consistent with the actual local conditions, providing functional guidance for future planning. However, in real-world planning projects, specific circumstances must still be considered, and adjustments should be made according to local conditions. As an ecological planning approach, this method can be applied to other planning areas such as Territorial Space Planning (Ministry of Natural Resources, 2025) and Nature Reserve System Planning, particularly in addressing landscape fragmentation. Secondly, this paper has not considered the needs of biodiversity conservation enough, and the response of different species to different environments varies. Therefore, subsequent studies can combine species distribution modeling and habitat suitability analysis to provide more precise protection for specific species in the region.
5 Conclusion
This study demonstrates a robust model for enhancing urban green infrastructure through strategic planning and implementation of the Green Space System Planning (GSSP) in Fuzhou, China. As rapid urbanization has exacerbated green space fragmentation and ecological connectivity degradation in coastal cities, this research addresses the critical gap in integrating quantitative landscape pattern analysis with spatial modeling for city-scale ecological network optimization. By combining Fragstats, Conefor, and ArcGIS-based resistance modeling, key results reveal that (1) 18 GPAs were classified with GPA 4 (2287.66 km2) showing the highest connectivity importance (dPC = 88.459), (2) the Min River corridor (GPA 10) and urban coastal wetlands (GPA 17) emerged as strategically vital despite spatial constraints, and (3) scenario analysis identified Scenario 1 (α = 0.26, CR = 0.999) as the optimal network configuration. These findings imply that the proposed framework not only resolves Fuzhou’s ecological continuity challenges but also offers a transferable methodology for coastal cities grappling with similar urbanization pressures. However, limitations include the subjectivity in resistance value assignment and the exclusion of socioeconomic factors in corridor planning. Future work should incorporate dynamic urban growth projections and multi-stakeholder preferences into the model. Ultimately, this study advances the paradigm of evidence-based ecological planning, demonstrating how scientifically grounded GSSP can reconcile urban development with biodiversity conservation, thereby paving the way for sustainable urban futures.
Data availability statement
The original contributions presented in the study are included in the article/supplementary material, further inquiries can be directed to the corresponding author.
Author contributions
JC: Writing – review and editing, Writing – original draft, Conceptualization, Funding acquisition, Visualization, Methodology. QZ: Visualization, Supervision, Writing – review and editing. SW: Writing – review and editing, Software, Visualization. YH: Software, Visualization, Writing – review and editing.
Funding
The author(s) declare that financial support was received for the research and/or publication of this article. The study was supported by Fujian Provincial Education Department Program of China, grant number: JAS24043.
Conflict of interest
The authors declare that the research was conducted in the absence of any commercial or financial relationships that could be construed as a potential conflict of interest.
Generative AI statement
The author(s) declare that no Generative AI was used in the creation of this manuscript.
Any alternative text (alt text) provided alongside figures in this article has been generated by Frontiers with the support of artificial intelligence and reasonable efforts have been made to ensure accuracy, including review by the authors wherever possible. If you identify any issues, please contact us.
Publisher’s note
All claims expressed in this article are solely those of the authors and do not necessarily represent those of their affiliated organizations, or those of the publisher, the editors and the reviewers. Any product that may be evaluated in this article, or claim that may be made by its manufacturer, is not guaranteed or endorsed by the publisher.
References
Bhattacharya, R. K., Chatterjee, N. D., and Das, K. (2024). Modelling of soil erosion susceptibility incorporating sediment connectivity and export at landscape scale using integrated machine learning, InVEST-SDR and fragstats. J. Environ. Manag. 353, 120164. doi:10.1016/j.jenvman.2024.120164
Cao, C., Luo, Y. T., Xu, L. P., Xi, Y. Y., and Zhou, Y. M. (2024). Construction of ecological security pattern based on InVEST-Conefor-MCRM: a case study of Xinjiang, China. Ecol. Indic. 159, 111647. doi:10.1016/j.ecolind.2024.111647
Dalton, R., Garlick, J., Minshull, R., and Robinson, A. (1973). Networks in geography. London: Phillip.
Davies, C., and Lafortezza, R. (2017). Urban green infrastructure in Europe: is greenspace planning and policy compliant? Land Use Policy 69, 93–101. doi:10.1016/j.landusepol.2017.08.018
Fenoglio, M. S., Rossetti, M. R., and Videla, M. (2020). Negative effects of urbanization on terrestrial arthropod communities: a meta-analysis. Glob. Ecol. Biogeogr. 29 (8), 1412–1429. doi:10.1111/geb.13107
Fu, Y., Shi, X., He, J., Yuan, Y., and Qu, L. (2020). Identification and optimization strategy of county ecological security pattern: a case study in the loess Plateau, China. Ecol. Indic. 112, 106030. doi:10.1016/j.ecolind.2019.106030
Fu, B. N., Liu, J. F., Zhang, J. J., Wu, X., and Wang, J. Y. (2022). Service accessibility of ecological nodes: an exploratory way to enhance network connectivity in a study case of Wu'an, China. Ecol. Inf. 69, 101589. doi:10.1016/j.ecoinf.2022.101589
García, A. M., Santé, I., Loureiro, X., and Miranda, D. (2020). Green infrastructure spatial planning considering ecosystem services assessment and trade-off analysis: application at landscape scale in Galicia region (NW Spain). Ecosyst. Serv. 43, 101115. doi:10.1016/j.ecoser.2020.101115
Garcia-García, M. J., Christien, L., García-Escalona, E., and González-García, C. (2020). Sensitivity of green spaces to the process of urban planning: three case studies of Madrid (spain). Cities 100, 102655. doi:10.1016/j.cities.2020.102655
Ghale, B., Gupta, K., and Roy, A. (2025). Exploring the impact of urban planning on access to hierarchical green spaces: a comparative study between planned and unplanned cities. Urban For. and Urban Green. 112, 128913. doi:10.1016/j.ufug.2025.128913
Guo, Z. Y., Zhu, C. X., Fan, X., Li, M. Y., Xu, N., Yuan, Y., et al. (2025). Analysis of ecological network evolution in an ecological restoration area with the MSPA-MCR model: a case study from ningwu county, China. Ecol. Indic. 170, 113067. doi:10.1016/j.ecolind.2024.113067
Hasan, S. S., Zhen, L., Miah, G., Ahamed, T., and Samie, A. (2020). Impact of land use change on ecosystem services: a review. Environ. Dev. 34, 100527. doi:10.1016/j.envdev.2020.100527
Hong, H. L., Chang, Q., Cheng, K. J., and Xie, X. H. (2025). Health benefit contributions and differences of urban green spaces in the neighbourhood, a case study of Beijing, China. J. Environ. Manag., 392: 126538. doi:10.1016/j.jenvman.2025.126538
Jiang, H. P., Guo, H. D., Sun, Z. C., Xing, Q., Zhang, H. S., Ma, Y. X., et al. (2022). Projections of urban built-up area expansion and urbanization sustainability in China's cities through 2030. J. Clean. Prod. 367, 133086. doi:10.1016/j.jclepro.2022.133086
Jin, W. J., Bian, Z. X., Wei, Z. Y., and Dong, Z. C. (2025). Damage mechanisms of small-to-medium-scale mines on ecological networks at watershed scale and systematic nature-based mine restoration pathways. Ecol. Eng. 216, 107638. doi:10.1016/j.ecoleng.2025.107638
Kefalas, G., Kalogirou, S., Poirazidis, K., and Lorilla, R. (2019). Landscape transition in mediterranean islands: the case of Ionian Islands, Greece 1985–2015. Landsc. Urban Plan. 191, 103641. doi:10.1016/j.landurbplan.2019.103641
Kuang, B., Lu, X., Han, J., Fan, X., and Jian, Z. (2020). How urbanization influence urban land consumption intensity: evidence from China. Habitat Int. 100, 102103. doi:10.1016/j.habitatint.2019.102103
Li Collins, A. M., Cheshmehzangi, A., and Chan, F. K. S. (2020). Identifying enablers and barriers to the implementation of the green infrastructure for urban flood management: a comparative analysis of the UK and China. Urban For. and Urban Green. 54, 126770. doi:10.1016/j.ufug.2020.126770
Li, Y., Jia, L., Wu, W., Yan, J., and Liu, Y. (2018). Urbanization for rural sustainability: rethinking China's urbanization strategy. J. Clean. Prod. 178, 580–586. doi:10.1016/j.jclepro.2017.12.273
Liu, Z., Lin, Y., De Meulder, B., and Wang, S. (2020). Heterogeneous landscapes of urban greenways in shenzhen: traffic impact, corridor width and land use. Urban For. and Urban Green. 55, 126785. doi:10.1016/j.ufug.2020.126785
Lu, Y. J., Cheng, Q., and Wang, M. Q. (2025). Construction and evaluation of the panjin wetland ecological network based on the minimum cumulative resistance model. Ecol. Model. 505, 111118. doi:10.1016/j.ecolmodel.2025.111118
Luo, W., Ren, Y., Shen, L., Zhu, M., JiangY, M. C., Zhang, P., et al. (2020). An evolution perspective on the urban land carrying capacity in the urbanization era of China. Sci. Total Environ. 744, 140827. doi:10.1016/j.scitotenv.2020.140827
Luo, J. L., Zhu, L., and Fu, H. (2024). Construction of wetland ecological network based on MSPA-Conefor-MCR: a case study of haikou city. Ecol. Indic. 166, 112329. doi:10.1016/j.ecolind.2024.112329
Ministry of Housing and Urban-Rural Development (MHURD) (2019). City green space planning standards GB/T51346-2019.
Ministry of Natural Resources (MNR) (2025). Guidelines for formulation of provincial territorial space planning (trial).
Montis, A. D., Caschili, S., Mulas, M., Modica, G., Ganciu, A., Bardi, A., et al. (2016). Urban-rural ecological networks for landscape planning. Land Use Policy 50, 312–327. doi:10.1016/j.landusepol.2015.10.004
Peng, J., Zhao, H., and Liu, Y. (2017). Urban ecological corridors construction: a review. Acta Ecol. Sin. 37 (1), 23–30. doi:10.1016/j.chnaes.2016.12.002
Pietsch, M. (2018). Contribution of connectivity metrics to the assessment of biodiversity: some methodological considerations to improve landscape planning. Ecol. Indic. 94 (2), 116–127. doi:10.1016/j.ecolind.2017.05.052
Qian, W. Q., Zhao, Y., and Li, X. Y. (2023). Construction of ecological security pattern in coastal urban areas: a case study in qingdao, China. Ecol. Indic. 154, 110754. doi:10.1016/j.ecolind.2023.110754
Qiao, E., Reheman, R., Zhou, Z., and Tao, S. (2024). Evaluation of landscape ecological security pattern via the “pattern-function-stability” framework in the guanzhong plain Urban Agglomeration of China. Ecol. Indic. 166, 112325. doi:10.1016/j.ecolind.2024.112325
Saura, S., and Torné, J. (2009). Conefor sensinode 2.2: a software package for quantifying the importance of habitat patches for landscape connectivity. Environ. Model. and Softw. 24 (1), 135–139. doi:10.1016/j.envsoft.2008.05.005
Saura, S., Vogt, P., Velázquez, J., Hernando, A., and Tejera, R. (2011). Key structural forest connectors can be identified by combining landscape spatial pattern and network analyses. For. Ecol. Manag. 262 (2), 150–160. doi:10.1016/j.foreco.2011.03.017
Sun, D. L., Wu, X. Q., Wen, H. J., Ma, X. L., Zhang, F. T., Ji, Q., et al. (2024). Ecological security pattern based on XGBoost-MCR model: a case study of the three gorges reservoir Region. J. Clean. Prod. 470, 143252. doi:10.1016/j.jclepro.2024.143252
Sun, L. W., Xie, C. K., Qin, Y. F., Zhou, R., Wu, H., and Che, S. Q. (2024). Study on temperature regulation function of green spaces at community scale in high-density urban areas and planning design strategies. Urban For. and Urban Green. 101, 128511. doi:10.1016/j.ufug.2024.128511
Verma, P., Singh, R., Bryant, C., and Raghubanshi, A. S. (2020). Green space indicators in a social-ecological system: a case study of Varanasi, India. Sustain. Cities Soc. 60, 102261. doi:10.1016/j.scs.2020.102261
Xu, L., Huang, Q., Ding, D., Mei, M., and Qin, H. (2018). Modelling urban expansion guided by land ecological suitability: a case study of changzhou city, China. Habitat Int. 75, 12–24. doi:10.1016/j.habitatint.2018.04.002
Xu, X. L., Wang, S. Y., and Rong, W. Z. (2023). Construction of ecological network in suzhou based on the PLUS and MSPA models. Ecol. Indic. 154, 110740. doi:10.1016/j.ecolind.2023.110740
Yang, H., Chen, W., and Chen, X. (2017a). Regional ecological network planning for biodiversity conservation: a case study of China’s Poyang Lake eco-economic region. Pol. J. Environ. Stud. 26 (4), 1825–1833. doi:10.15244/pjoes/68877
Yang, H., Ma, M., Thompson, J. R., and Flower, R. J. (2017b). Protect coastal wetlands in China to save endangered migratory birds. Proc. Natl. Acad. Sci. U. S. A. 114 (28), 5491–E5492. doi:10.1073/pnas.1706111114
Yang, H. H., Xu, W. Z., Chen, Z. Y., Xie, X. Q., Yu, J., Lei, X. Y., et al. (2024). Ecological network construction for bird communities in high-density urban areas: a perspective of integrated approaches. Ecol. Indic. 158, 111592. doi:10.1016/j.ecolind.2024.111592
Yu, Q., Yue, D., Wang, Y., Kai, S., Fang, M., Ma, H., et al. (2018). Optimization of ecological node layout and stability analysis of ecological network in desert oasis: a typical case study of ecological fragile zone located at deng kou county (inner Mongolia). Ecol. Indic. 84, 304–318. doi:10.1016/j.ecolind.2017.09.002
Zhang, J. W., Ge, C. Z., Duan, X. M., Wang, K., Zhou, Q., and Hao, C. X. (2024). Integrating SDGs into China’s ecological civilization construction: practical indicators and progress assessment. Ecol. Indic. 169, 112921. doi:10.1016/j.ecolind.2024.112921
Zhao, S., Ma, Y., Wang, J., and You, X. (2019). Landscape pattern analysis and ecological network planning of tianjin city. Urban For. and Urban Green. 46, 126479. doi:10.1016/j.ufug.2019.126479
Keywords: ecological corridor, green infrastructure planning, green network, minimum resistance, gravity model, network analysis
Citation: Chen J, Zhou Q, Wu S and Huang Y (2025) Green space system planning and optimization coupling landscape pattern analysis with spatial models: a case study of Fuzhou, China. Front. Environ. Sci. 13:1642739. doi: 10.3389/fenvs.2025.1642739
Received: 07 June 2025; Accepted: 11 August 2025;
Published: 01 September 2025.
Edited by:
Pedzisai Kowe, Midlands State University, ZimbabweReviewed by:
Subhanil Guha, National Institute of Technology Raipur, IndiaProduce Mukwenyi, Bindura University of Science Education, Zimbabwe
Copyright © 2025 Chen, Zhou, Wu and Huang. This is an open-access article distributed under the terms of the Creative Commons Attribution License (CC BY). The use, distribution or reproduction in other forums is permitted, provided the original author(s) and the copyright owner(s) are credited and that the original publication in this journal is cited, in accordance with accepted academic practice. No use, distribution or reproduction is permitted which does not comply with these terms.
*Correspondence: Qingqing Zhou, MTE0NTc2OTI5QHFxLmNvbQ==