 Zhou Ren
 Cancan Zhang
 Long Fan
 Xiaonan Zhao
- 1School of Civil Engineering and Architecture, Nanyang Normal University, Nanyang, China
- 2Henan Urban Planning and Design Institute Co., Ltd., Zhengzhou, China
Introduction: The process of urbanization involves all aspects of society and understanding the spatial differences in urban development is crucial to promoting sustainable urban development. However, the existing studies still lack a spatial heterogeneity analysis of the driving factors of urbanization at the prefectural-level city scale and over a long period of time.
Methods: This study uses nighttime light data, with 285 prefecture-level cities in China as the research objects. It employs spatial autocorrelation and the geographically weighted regression (GWR) model to investigate the spatial heterogeneity of the factors influencing urban development in China from 2000 to 2019.
Results: (1) The overall level of urbanization in China is on the rise. Spatially, it exhibits a distribution pattern shifting from concentration to dispersion and from a single center to multiple centers. (2) The urbanization process in China exhibits a significant spatial correlation. The hotspots are mainly concentrated in the eastern part of China along the southern coast and the northern part of the southern coast, while the coldspots are located in the southwestern, northwestern, and northeastern regions. (3) The regression coefficients of the influencing factors exhibit significant spatial imbalance. Economic development, population size, public infrastructure, and economic openness all show a positive correlation with urbanization development as a whole; the industrial structure has a negative impact on urbanization development in most regions, and its inhibitory effect is weakest in the cold spots.
Discussion: Capturing this heterogeneity is of vital importance for understanding the diverse paths of urban development and formulating differentiated policies for specific regions.
1 Introduction
Earth has become a planet of cities (Wigginton et al., 2016). According to the “2018 World Urbanization Prospects” released by official sources, the proportion of the world’s population living in urban areas is projected to increase from 55% to 68% by 2050 (Xu et al., 2021). Over the past few decades, China has undergone rapid urbanization. From 1978 to 2016, China’s urbanization rate increased from less than 20%–57.35% (Liang and Yang, 2019). Furthermore, from 1978 to 2019, the proportion of China’s urban population increased from 17.9% to 60.6% (Yang et al., 2021). Rapid urbanization has brought economic development opportunities as well as challenges, drawing increasing attention from scholars.
While China has achieved remarkable success in urbanization, it has also exhibited significant regional disparities (Chen et al., 2013; Peng et al., 2020). According to data from Fan et al. (2014), from 1994 to 2011, the imbalance in urbanization processes in China’s eastern, western, and central cities decreased by 35.26%, 29.04%, and 25.84%, respectively, but increased by 33.29% in northeastern cities. From 2009 to 2018, the urban development in China’s seven major city clusters exhibited a spatial pattern of “high in the east, low in the west, and depression in the central region” (Chen et al., 2022). Regional development imbalances may affect the spatial integration and coordinated development of cities (Liu et al., 2020). Therefore, accurately understanding the spatial differences in China’s urban development is crucial for sustainable urban development and policy-making (Yang et al., 2019; Zhang et al., 2020).
Many studies have explored the factors and driving mechanisms that influence urban development. Research has shown that both natural conditions and socioeconomic factors have certain impacts on urban development (Colsaet et al., 2018; Zhang H. et al., 2022). Some scholars have explored the correlation between natural factors and urban development from aspects such as slope, altitude (Li et al., 2013), geological conditions (He et al., 2019), and climate quality (Zhao and Li, 2022). Other scholars have investigated the correlation between socioeconomic factors and urban development from the perspective of economic growth (Li et al., 2020), population agglomeration (Zhang and Xie, 2019), urban transportation (Wang D. D. et al., 2021) and public policy (Jia et al., 2020). In addition, some studies have noted the spatial heterogeneity of factors influencing urban development. For example, Li G. D. et al. (2018) suggested that natural factors impose fewer restrictions on urban development in eastern China than in the central and western regions. Economic growth has a greater impact on urban development in northeastern China (Xu et al., 2020).
Socioeconomic statistical data have been widely used to assess the level and disparities of urban development in Chinese cities (Yang et al., 2018). Zhang et al. (2019) utilized census data to estimate urban shrinkage in China, whereas Wu and Rao (2016) conducted an empirical analysis on the relationship between urbanization and income inequality using statistical yearbook data. However, owing to continuous changes in China’s administrative boundaries, the accuracy of socioeconomic statistical data is insufficient. Moreover, socioeconomic statistical data cannot reflect spatial changes in urban development, making it difficult to utilize these data to assess the spatial characteristics of urban development in China. In terms of urban nighttime light brightness, remote sensing imagery has been widely used to monitor the spatiotemporal characteristics of evolving human activities (Levin et al., 2020; Zhao et al., 2019). For example, it monitors urban expansion (Jiang et al., 2021; Reba and Seto, 2020; Yi et al., 2014), population estimation (Song et al., 2019; Zhuo et al., 2009), and estimation factors such as GDP, energy consumption, and carbon emissions (Lv et al., 2020; Shi et al., 2016; Zhu et al., 2017). Compared with traditional socioeconomic data, nighttime light data hold significant application value and potential, especially in many underdeveloped countries where socioeconomic data are often nonexistent or unavailable. Nighttime light data can be used to monitor urbanization dynamics effectively (Small et al., 2011). Furthermore, nighttime light data are not affected by administrative boundary adjustments. Zhang and Su (2016) used DMSP/OLS NTL data to analyze urban expansion in 30 major Chinese cities from 1993 to 2012. Li H. M. et al. (2018) analyzed the relationship between land area and nighttime light from 2000 to 2013 in 36 Chinese cities using DMSP/OLS NTL data. Zheng et al. (2022) quantitatively evaluated urban expansion in the Guangdong–Hong Kong–Macao Greater Bay Area from 2012 to 2018 using NPP/VIIRS NTL data. Li et al. (2021) analyzed the spatiotemporal patterns of urbanization in the three most developed city clusters in China from 2000 to 2018 using a synthesis of DMSP/OLS NTL and NPP-VIIRS continuous nighttime light data. These studies significantly enrich the application of nighttime light data in the urban development process.
Overall, in the existing studies, scholars have generally employed methods such as kernel density analysis and spatial correlation analysis to explore the temporal and spatial distribution characteristics of urbanization development (Zhang L. G. et al., 2022; Zheng et al., 2022). The discussion on the influencing factors of urbanization development mostly employs global regression models such as OLS models and GMM models, which do not take into account spatial factors (Zhang H. et al., 2022; Shi et al., 2020). With the development of geographical economics, some scholars began to incorporate spatial factors into the research on the influencing factors of urbanization and used spatial econometric models such as SEM (Zhang and Wang, 2018), SLM (Sun et al., 2023), and SDM (Zhang L. G. et al., 2022) for regression estimation. Although previous studies have achieved considerable results, there are still some shortcomings: First, current urbanization studies suffer from fragmented scales: they focus mainly on provincial units or urban agglomerations, which can only reflect the temporal and spatial evolution characteristics of urbanization as a whole, lacking nationwide representative samples. Second, in the research on the spatial heterogeneity impact of different factors, most studies adopt global parameter estimation methods for regression analysis, failing to fully reflect the geographical spatial differentiation characteristics of the impact of each factor on urbanization development. Third, in terms of evolutionary analysis, the focus of existing research has typically been on comparing the intensity of the effects of various factors on urbanization, with relatively insufficient dynamic evolutionary analysis of the spatial heterogeneity impacts of different factors at different stages.
Therefore, based on previous studies, this paper fills these gaps by integrating 285 cities’ 20-year nighttime light data: (1) It comprehensively captured the entire process of urbanization dynamics during the key development period of China at the national scale. (2) Based on GWR spatial analysis, it was revealed that the regression coefficients of the influencing factors exhibited significant spatial non-equilibrium. (3) Empirical evidence shows that China’s urbanization process has shifted from a single-core clustering model to a multi-center network structure and has discovered the multi-center transformation patterns that challenge the traditional core-periphery model.
2 Study area and data
2.1 Study area
Since the 1980s, China has undergone rapid urbanization, yet significant economic development disparities persist across regions (Ma et al., 2017). To assess the potential of DMSP-OLS and NPP-VIIRS nighttime light imagery in characterizing heterogeneity in socioeconomic activities, we selected China’s prefecture-level cities as our study area. Considering data availability, this study focuses on 285 prefecture-level cities in China. These cities were selected based on the following criteria: (1) They had continuous, reliable and concentrated nighttime light data coverage throughout the entire study period; (2) The administrative boundaries remained relatively stable during the study period to ensure the consistency of spatial unit analysis. After excluding the samples with missing data, a total of 285 valid samples were finally determined.
To analyze regional differences, we followed the approach of Fan and Qi (2009) and divided the study area into eight regions: East Coast (EC), Central Yellow River Delta (CYRD), Central Changjiang River Delta (CCRD), Northeast (NE), Great Northwest (GNW), North Coast (NC), South Coast (SC), and Great Southwest (GSW) (Figure 1).

Figure 1. Distribution of the eight major regions in China.
2.2 Data
This study includes three main types of data. The first type is nighttime light data from the National Oceanic and Atmospheric Administration (NOAA) of the United States. The currently commonly used nighttime light data mainly include two types: the Linear Scan Operational System (OLS) carried by the Defense Meteorological Satellite Program (DMSP) satellites, and the Visible Infrared Imaging Radiometer Suite (VIIRS) carried by the Suomi National Polar-Orbiting Partnership (Suomi NPP) satellites. Due to significant differences in sensor parameters, spatial resolution, and other aspects, these two types of data cannot be directly used for analysis (Xie et al., 2019). Therefore, this study adopts the extended time series of annual nighttime light data images corrected by Chen et al. (2021). The core processing steps of this dataset are as follows: First, the DMSP-OLS nighttime light data that has undergone oversaturation correction and time-series correction is used as the input data; Second, the annual synthetic data obtained by fusing the monthly synthetic data of NPP-VIIRS is used as the validation set; next, a cross-sensor correction scheme based on autoencoder is adopted. Finally, the NPP-VIIRS data from 2013 to 2020 were appended to the “NPP-VIIRS-Like” data from 2000 to 2012, thus forming a complete long-term data set.
The second type of data is socioeconomic data, including per capita gross domestic product (GDP), population density, the proportion of urban built-up area, the share of secondary and tertiary industries in GDP, foreign investment, and green space coverage in built-up areas. These data are sourced from the “China Statistical Yearbook” and the “China City Statistical Yearbook.”
The third type of data is GIS auxiliary data. The administrative boundaries of China’s provinces, cities, and counties at a scale of 1:4,000,000,000 are sourced from the National Geomatics Center of China. Due to the lack of statistical data for Taiwan, Hong Kong, and Macau, this study focuses only on mainland China.
3 Methods
3.1 Urbanization level measurement model
Nighttime light data are widely used to represent urban development. Drawing on existing research and referencing the approach of Li et al. (2021), the average nighttime light intensity index is used as a proxy indicator for the urbanization level. The specific calculation formula can be expressed as Equation 1:
where
3.2 Spatial autocorrelation analysis
3.2.1 Global spatial autocorrelation
Global spatial autocorrelation is used to analyze whether a variable is clustered in space and generally uses
where
where
3.2.2 Hotspot Analysis
Global spatial autocorrelation describes the overall spatial clustering characteristics of urbanization levels but cannot be used to determine the specific locations of clusters.
where
3.3 Geographically weighted regression
3.3.1 OLS
Before performing GWR regression, the influencing factors of urban development are first selected step by step through OLS linear regression. The calculation formula is as follows (Equation 5):
where
3.3.2 GWR
The geographically weighted regression (GWR) model combines spatial correlation with linear regression, improving upon traditional models such as ordinary least squares (OLS). It has certain advantages because it uses local parameter estimation, reflecting the nonstationarity of regression model weights in space. This means that relationships between variables can vary with geographical location, making the regression model results more reasonable in local areas. The structure of the model can be expressed as Equation 6:
where
In the computation process, Gaussian functions are used to determine weights, and the Akaike information criterion (
In the GWR model, the estimated regression parameter
where
To estimate the parameters
where
where
If we let
Increasing the number of free parameters improves the goodness of fit.
3.3.3 Variable Selection
Guided by the urbanization theory, we selected the key indicators that represent the core dimensions driving urban development: the economic development level (usually measured by per capita GDP) is an important driving force that promotes the transfer of population from the agricultural sector to the non-agricultural sector, thereby driving urbanization (Xu et al., 2020). The urban economics theory emphasizes that the scale economy and agglomeration effect brought about by population concentration are the key factors for urban development. Meanwhile, population density is a crucial indicator for measuring the level of urbanization and its spatial efficiency (Jin et al., 2024). In this study, it is used to represent the population size. Land indicators: Moderate land expansion will accelerate the urbanization process, which is represented by the proportion of built-up area (Zhang et al., 2020). The industrial structure is the core influencing factor of urbanization, determining the spatial form, functional positioning and development quality of cities, which is measured by the proportion of the secondary and tertiary industries in GDP (Wang et al., 2019). Economic openness plays a significant and positive role in promoting urbanization development, as measured by foreign direct investment (FDI) (Chen and Paudel, 2021). Public infrastructure, measured by the green coverage rate of the built-up area, is not only a core indicator for evaluating the quality of urban environment, but also a key element in driving the transformation of urbanization from “quantity expansion” to “quality improvement” (Zhai et al., 2024). The specific description of the variables is shown in Table 1.
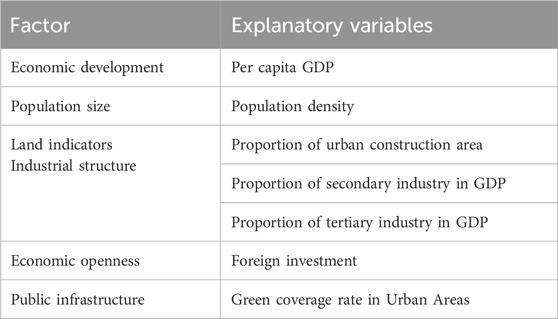
Table 1. Description of explanatory variables.
4 Results
4.1 Spatial distribution of urbanization levels
Taking into account the characteristics and policy background of China’s urbanization process, this paper selects representative years from 2000 to 2019 (2000, 2005, 2010, 2015 and 2019) for analysis. The reason for choosing this time period is as follows: (1) It covers the crucial period of rapid urbanization and profound social and economic transformation in China; (2) The 20-year time span is sufficient to reveal the long-term spatial evolution trends and heterogeneity of the urban development pattern. The key representative years during this period (2000, 2005, 2010, 2015, 2019) were selected based on a 5-year interval and their alignment with the national planning cycle (5-year plans) and socio-economic turning points, in order to examine the different stages and turning points of urbanization. In addition, the data is up to 2019 because 2019 was the last full year before the COVID-19 pandemic, avoiding abnormal interference.
It can be observed that the urbanization process in China from 2000 to 2019 exhibited significant spatial differentiation characteristics (Figure 2). Spatially, urbanization levels gradually increased from west to east, and overall levels continued to increase over time. In 2000, urbanization levels in China were generally low, with high values observed only in two cities, Shanghai and Dongguan. Subsequently, starting from Shanghai and spreading outward, urbanization expanded to the eastern coastal, northern coastal, and southern coastal regions, including provinces such as Jiangsu, Fujian, Zhejiang, Guangdong, and Shandong. Low values were concentrated in the northeast, central and upper Yangtze River regions and northwest China, including provinces such as Gansu, Ningxia, Inner Mongolia, and Heilongjiang. The urban development levels identified in this study are consistent with existing research (Li et al., 2021; Ma et al., 2012). In terms of quantity, the proportion of cities with urban development levels greater than 2 increased from 2.46% to 20%, whereas those in the range of 0.2–2 increased from 17.89% to 59.30%. The proportion of cities with urban development levels less than 0.2 decreased from 79.65% to 20.70%. These changes indicate an overall upward trend in urban development in China, but the disparity between cities gradually widened. This may be related to national policies and geographic factors. For instance, coastal regions generally have greater advantages over inland regions in terms of transportation, population, and economic environment.
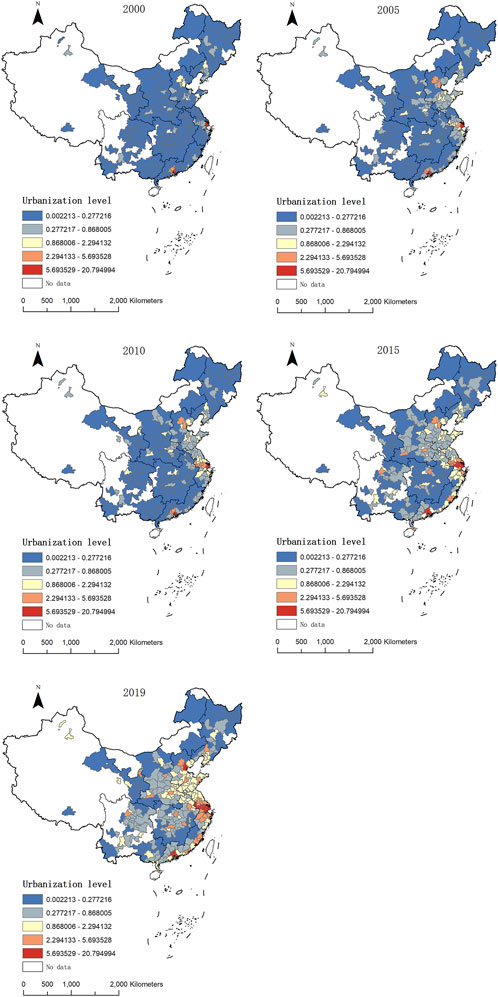
Figure 2. Spatial differentiation of urbanization development levels in China from 2000 to 2019.
4.2 Spatial autocorrelation analysis results
4.2.1 Global spatial autocorrelation
To accurately estimate the spatial distribution of urbanization levels in China, the global
Table 2 lists the global
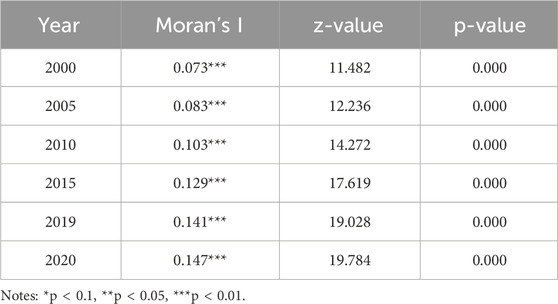
Table 2. Global Moran’s index results for 285 Chinese cities (2000–2020).
4.2.2 Local spatial autocorrelation
To analyze the overall spatial differentiation pattern of urban development levels in China, further exploration of the evolution characteristics of its local spatial clustering patterns was conducted. Using the
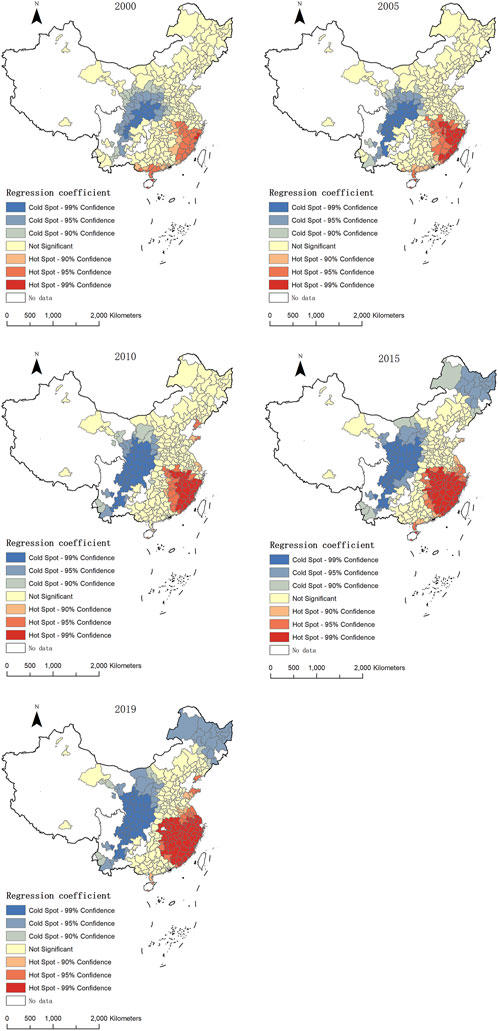
Figure 3. Hot spots and cold spots of urbanization development levels in China from 2000 to 2019.
From 2000 to 2020, the clustering trend of hotspot areas in terms of urban development levels in China decreased from southeast to northwest, and their influence expanded over time. Spatially, hotspot areas were mainly concentrated in the southern part of the eastern coastal region and the northern part of the southern coastal region of China. In 2000 and 2005, hotspot areas were primarily distributed in Zhejiang, Fujian, and Guangdong. From 2005 to 2020, they gradually spread northwestward, further expanding to some cities in Shanghai, Jiangsu, Jiangxi, and Anhui. However, as the economies of the eastern coastal, southern coastal, and central Yangtze River regions became saturated, the spread of hotspot areas in terms of urban development levels slowed. Notably, the spread of the influence range of cold spot areas was slower, and the areas with significant cold spots at the 1% level were distributed mainly in the southwestern and northwestern regions of China, involving some cities in Yunnan, Sichuan, and Ningxia. This is consistent with the conclusions of Li et al. (2019). Additionally, in 2015 and 2019, cold spot areas also appeared in the northeastern regions of Heilongjiang and Jilin.
4.3 Spatial heterogeneity of factors influencing urbanization levels
4.3.1 OLS regression of influencing factors
This paper establishes an OLS regression model, taking urbanization development as the dependent variable, and examines the influencing mechanism of urbanization development by using seven indicators from six dimensions (economic development, population size, land indicators, industrial structure, economic openness, and public infrastructure) as independent variables. However, not all variables have a significant impact on urbanization. Therefore, in this paper, we first selected five key and significant variables through stepwise regression analysis, namely, per capita GDP, population density, the proportion of the secondary industry in GDP, foreign investment, and the green coverage rate in urban areas. Furthermore, through the variance inflation factor test, it was found that there was no multicollinearity problem in the model.
First, OLS regression was used to test the impact of various explanatory variables on urban development in 2000, 2005, 2010, 2015, and 2019. The results are shown in Table 3. From 2000 to 2019, per capita GDP and population density were significantly positively correlated with urban development levels, passing the 1% level significance test except for the per capita GDP in 2005, which was significant at the 5% level. These findings indicate that the economic level and population scale are the main driving factors of urban development. Additionally, in 2000, 2010, and 2019, the proportion of secondary industry in GDP was significantly negatively correlated with urban development levels, suggesting that industrial structure adjustments are beneficial for improving urbanization levels. In 2000, 2005, and 2010, the green coverage rate of built-up areas was significant at the 1% level, with a negative correlation in 2000 and a positive correlation in 2005 and 2010. This indicates that the continuous improvement in public infrastructure is conducive to urban development. Foreign investment was significantly positively correlated with urban development, indicating that the degree of openness to foreign investment is also an influence.
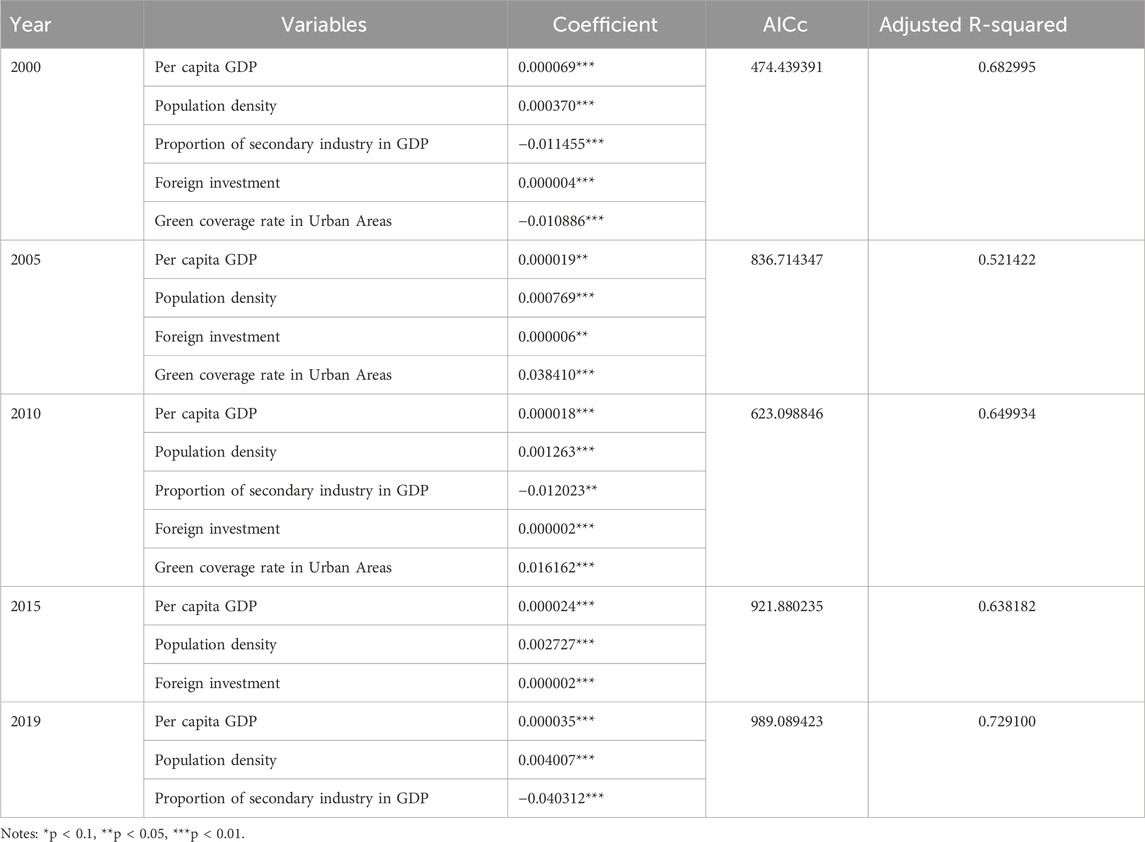
Table 3. Ols model calculation results.
4.3.2 Analysis of spatial heterogeneity of influencing factors based on the GWR model
4.3.2.1 Analysis of the GWR model regression results
The GWR model has significant advantages in spatial difference analysis (Table 4). The adjusted R2 values of the GWR model in different years are always higher than those of the OLS model, whereas the AICc values are always lower than those of the OLS model. Since a higher adjusted R2 value indicates a stronger explanatory power of the model and a lower AICc value indicates a better fit of the model, the GWR model is more suitable than the OLS model. As shown in Table 4, from the average regression coefficients of various indicators in the GWR model, per capita GDP and population density have a closer correlation with urban development, followed by foreign investment and then green coverage rate. The proportion of secondary industry in GDP is negatively correlated with urban development.
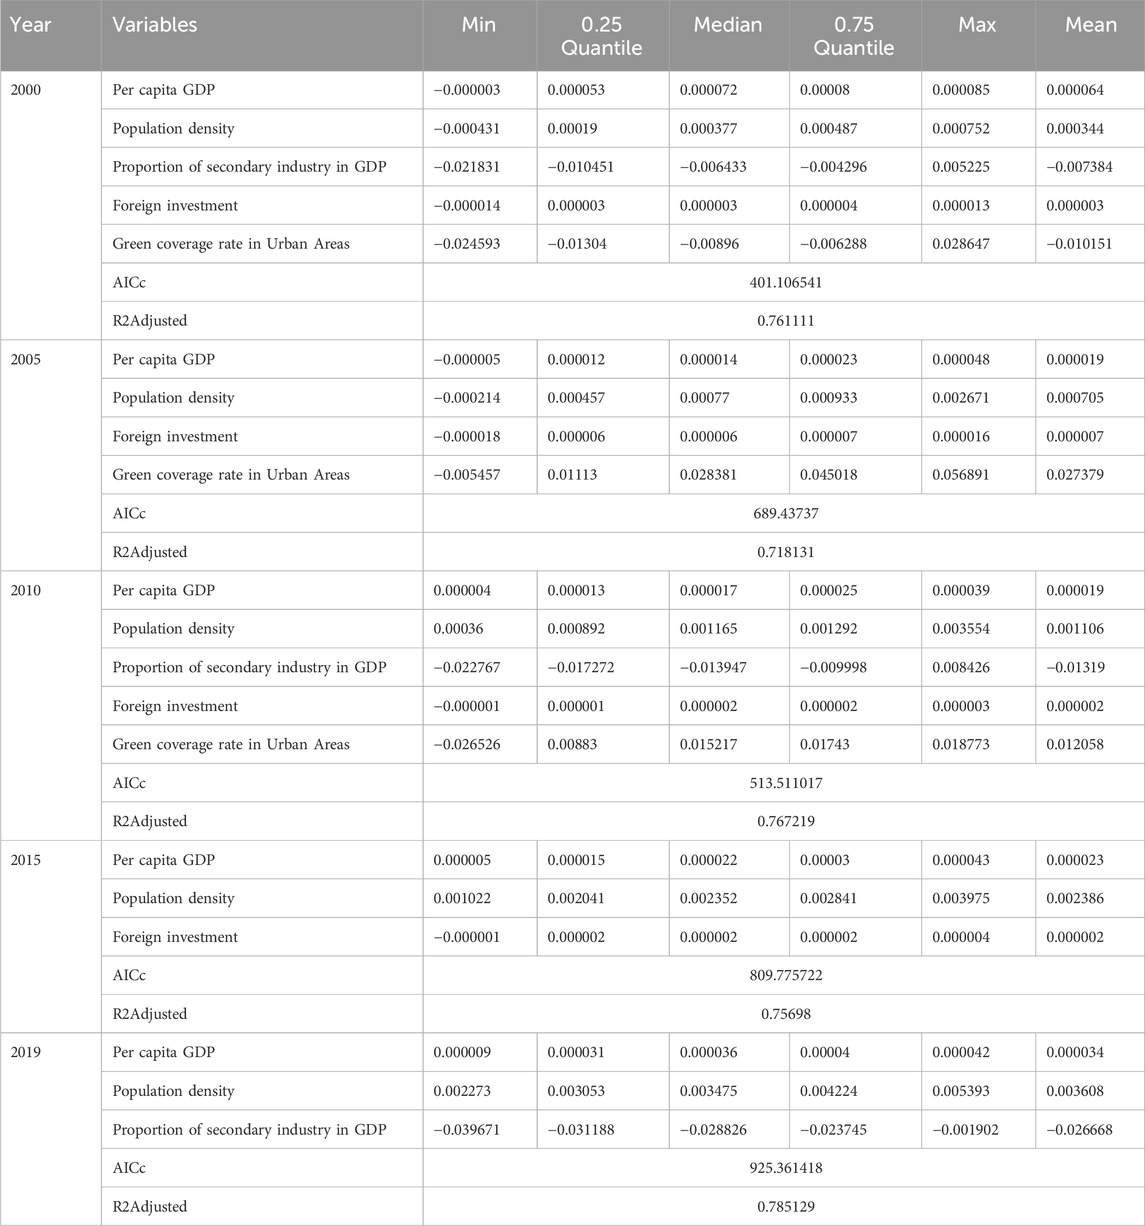
Table 4. Calculation results of GWR model.
4.3.2.2 Analysis of the spatial heterogeneity of influencing factors
This paper uses the ArcGIS natural breakpoint method to conduct spatial visualization of the GWR regression coefficients of each significant factor, and further explores the spatial differentiation of their impact on urbanization. This method independently determines the classification threshold based on the inherent distribution of the annual data, and is a commonly used criterion for revealing spatio-temporal heterogeneity (Yang et al., 2022). This method can better reveal the inherent spatial clustering and heterogeneity in the coefficient distribution of each year, thereby enabling a more accurate representation of the local spatial relationships that may evolve over time (Zhang et al., 2020; Yan et al., 2021). For the influencing factors that have statistically significant spatial relationships, we presented the visualizations of local regression coefficients in the corresponding years (Figures 4–8).
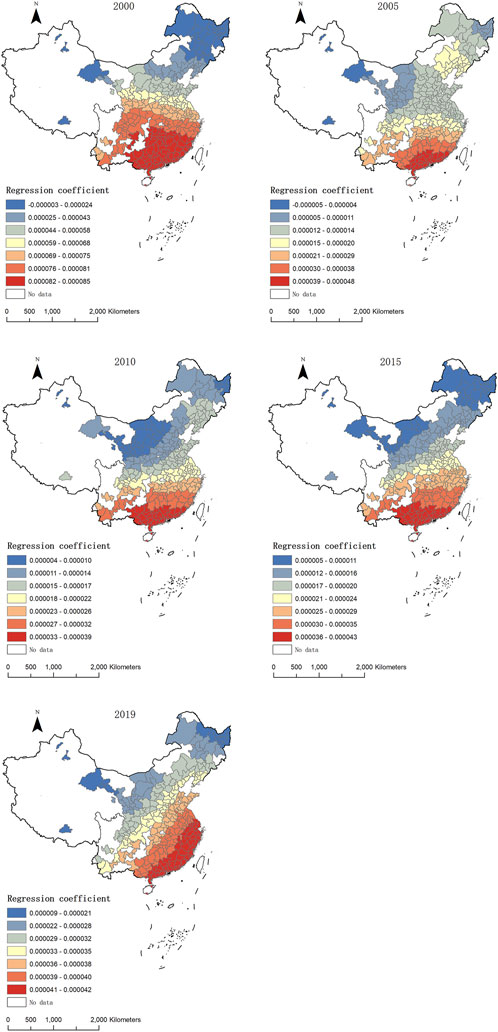
Figure 4. Spatial distribution of regression coefficients for per capita GDP.
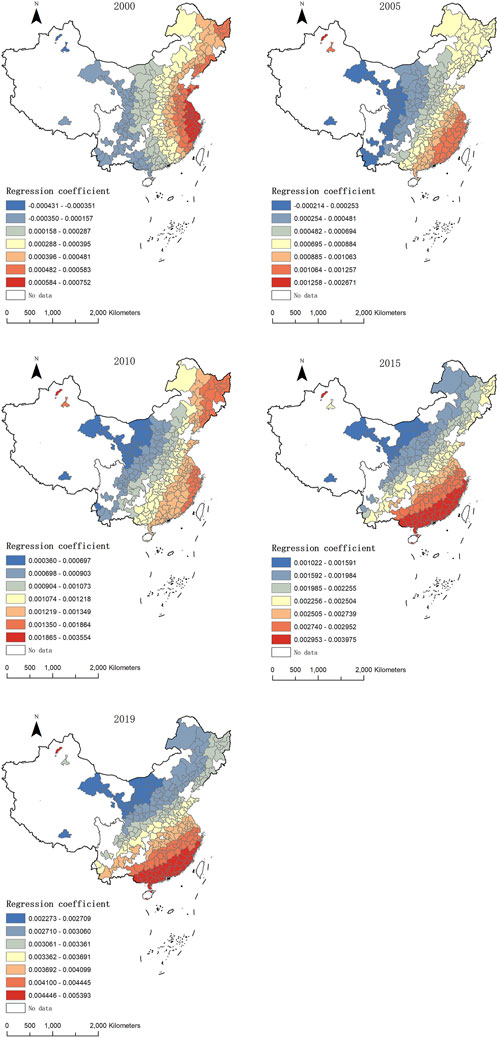
Figure 5. Spatial distribution of regression coefficients for population density.
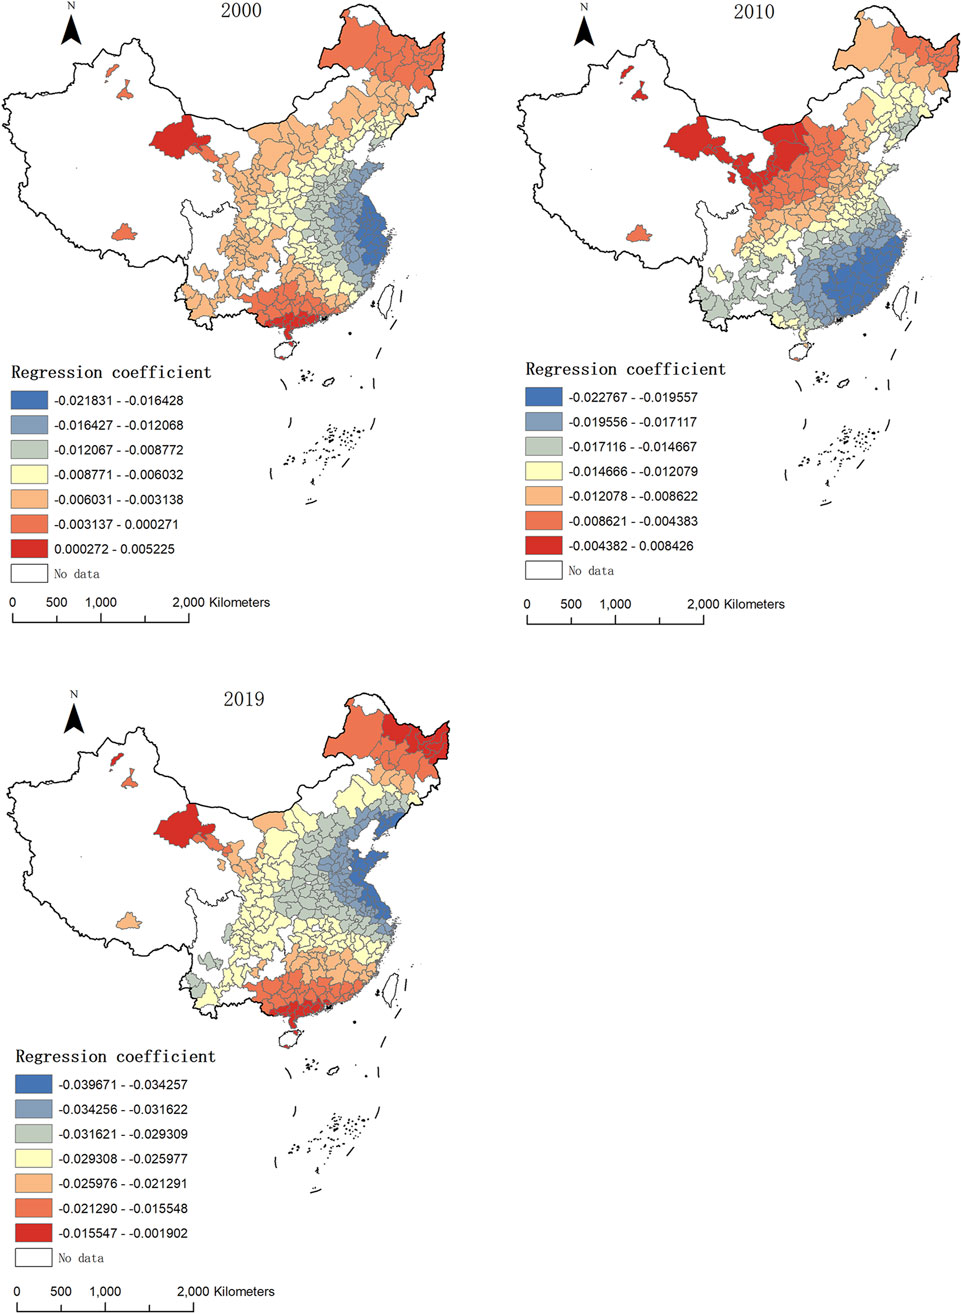
Figure 6. Spatial distribution of the regression coefficients for industrial structure.
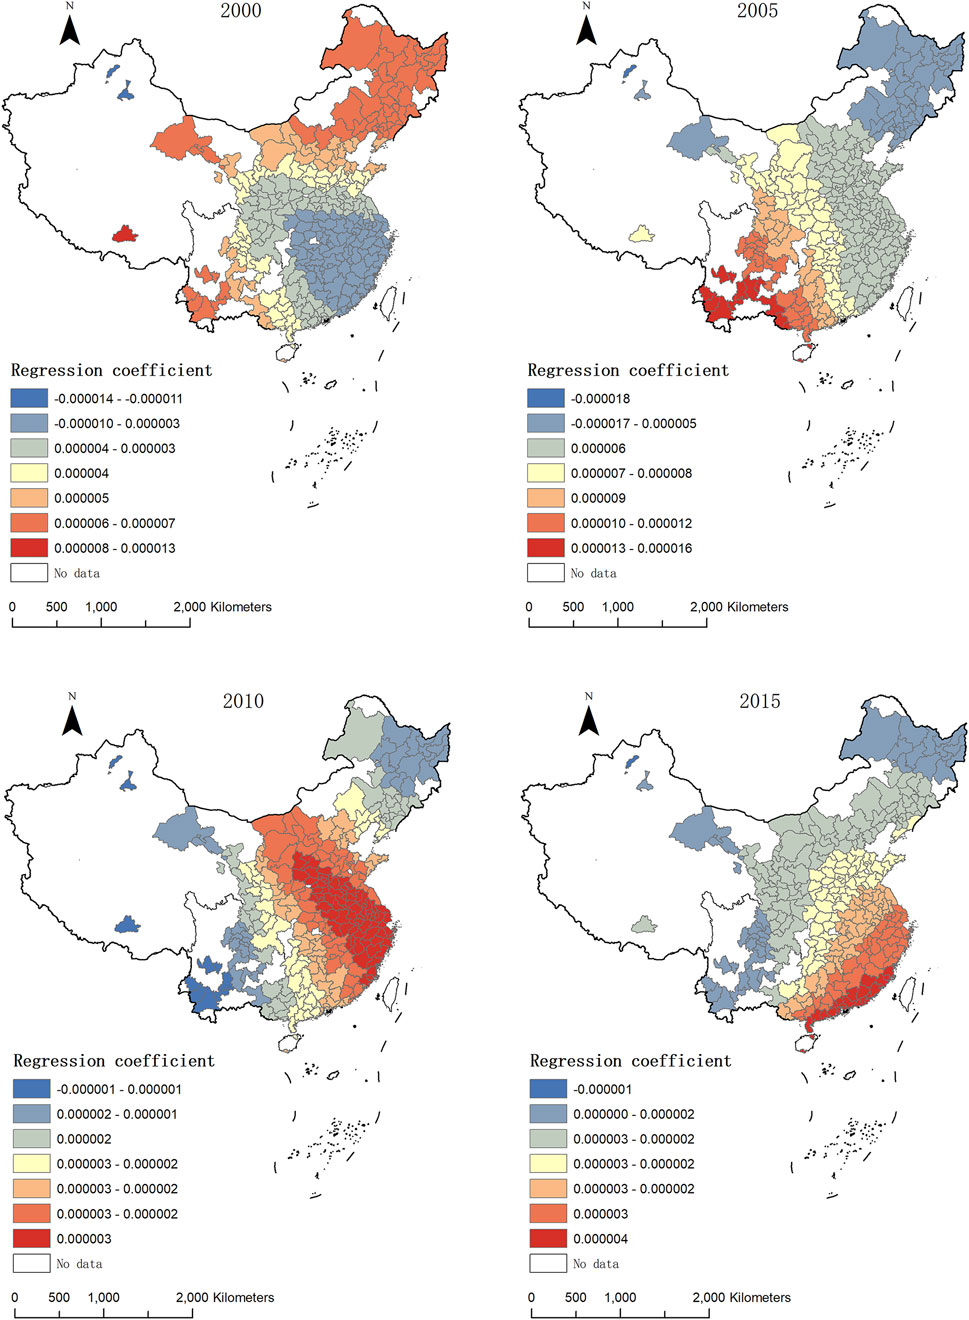
Figure 7. Spatial distribution of the regression coefficients for foreign investment.
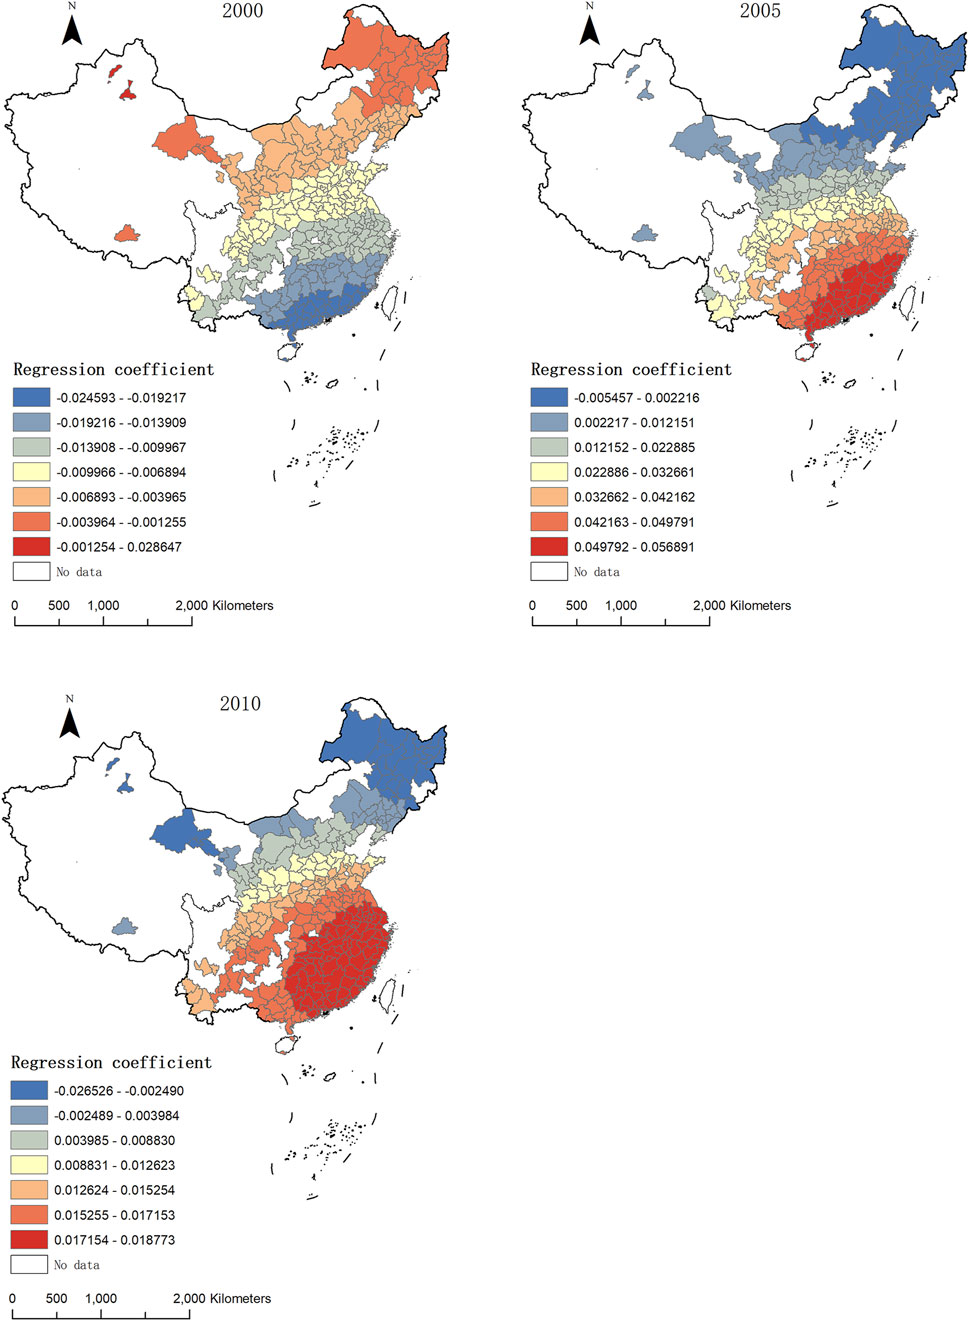
Figure 8. Spatial distribution of regression coefficients for green coverage rate in developed areas.
4.3.2.2.1 Impact of economic development on spatial heterogeneity
From 2000 to 2019, the regression coefficients of per capita GDP show an increasing trend from north to south and a decreasing trend from east to west (Figure 4). The impact of economic development on urbanization levels varies. In 2000, cities with significant influence were mainly concentrated in the southern coastal and central Yangtze River regions of China, including provinces such as Guangdong, Guangxi, Jiangxi, and Fujian. From 2005 to 2019, high values were mainly concentrated in the southern coastal areas, with their influence gradually expanding to the eastern coastal regions over time. This region’s distribution was generally consistent with the hotspot distribution during the same period, indicating that economic development had a positive impact on urban development. During this period, low values were distributed mainly in the central Yellow River and northeastern regions, including provinces such as Inner Mongolia, Gansu, and Heilongjiang. This may be due to China’s reform and opening-up, in which coastal areas have become hot spots for national economic growth, with an influx of foreign capital and people boosting rapid urbanization. In contrast, the western and northeastern regions, which are less economically developed, experienced some degree of population loss, resulting in relatively slow urban development.
4.3.2.2.2 Impact of population size on spatial heterogeneity
From 2000 to 2019, the regression coefficients of population density show a significant trend at the 1% significance level, generally increasing from north to south and decreasing from east to west (Figure 5). From 2000 to 2010, high-value areas were distributed mainly in the eastern coastal, northern coastal, and northeastern coastal regions, including Zhejiang, Shanghai, Jiangsu, Shandong, Liaoning, Jilin, and Heilongjiang. From 2010 to 2019, high-value areas gradually shifted southeastward, mainly concentrated in the southern coastal and eastern coastal regions, including Guangdong, Fujian, and Zhejiang. This may be due to the economic development of coastal areas, where an increase in population size has led to greater demand for housing, employment, and transportation, thereby promoting rapid urbanization.
4.3.2.2.3 Impact of industrial structure on spatial heterogeneity
In 2000, 2010, and 2019, the regression coefficients of the proportion of secondary industry in GDP showed significant spatial differences, decreasing from north to south and increasing from east to west. In 2000, areas with greater negative impacts were mainly concentrated in the eastern coastal region and gradually spread to the southern coastal regions, including provinces such as Shanghai, Zhejiang, Fujian, and Guangdong (Figure 6). This was exactly the opposite of the urban development hotspots during this period. This might be closely related to the extensive industrialization model adopted during this stage. In the early days, the coastal areas relied on energy-intensive and labor-intensive industries, which led to overloading of environmental carrying capacity and a decline in urban development efficiency (Zou and Ma, 2021). This contradiction also highlights the cost of the “pollute first, then clean up” development path. It was not until the process of industrial upgrading accelerated that the negative effects gradually diminished (Liu et al., 2021). By 2019, the areas with significant negative impacts were mainly concentrated in the northern part of the eastern coastal region and the southern coastal region, including provinces such as Shandong, Jiangsu, and Liaoning, with the number of affected cities decreasing. This may be due to the economically developed eastern and southern coastal regions being quick in adjusting and upgrading their industrial structures, thereby achieving significant results and gradually reducing the inhibitory effect on urban development.
4.3.2.2.4 Impact of economic openness on spatial heterogeneity
From 2000 to 2015, the regression coefficients of foreign investment were significant at the 1% level, except in 2005, when they were significant at the 5% level. The distribution of high-value areas changed significantly over time. From 2000 to 2005, regions with strong positive impacts shifted from the northeastern region to the southwestern region, and these regions were concentrated mainly in Yunnan and Guangxi. From 2010 to 2015, the high-value areas shifted from the middle reaches of the Yellow River, the middle reaches of the Yangtze River, and the eastern coastal region to the southern coastal region, mainly concentrated in Guangdong Province (Figure 7). Foreign investment can indirectly promote the level of urbanization, especially in coastal areas that are at the forefront of economic reform. Foreign investment brings capital and technology to the region, helping to upgrade the industrial structure and attract labor employment, thereby promoting urban development.
4.3.2.2.5 Impact of public infrastructure on spatial heterogeneity
In 2000, the regression coefficient of green space coverage in built-up areas was negatively correlated with urbanization levels at the 1% significance level, showing a decreasing trend from north to south (Figure 8). The regions with significant impacts were mainly concentrated in the northeast and northwest regions, including Heilongjiang, Jilin, and Gansu. The possible reason is that Northeast is an old industrial base, and the reform of state-owned enterprises has led to population outflow, resulting in a large amount of industrial land being abandoned and naturally regenerating vegetation, especially in resource-based cities such as Hegang and Fuxin, the situation is particularly severe (Han et al., 2024). Furthermore, urban shrinkage has a negative impact on the livability of cities, which further reduces community appeal, accelerates population and social capital loss, and creates a vicious cycle of “shrinkage-decline-population loss” (Jiang and Sun, 2024). This “passive greening” phenomenon is fundamentally different from the active greening efforts in the current ecological civilization construction. Such areas need to achieve sustainable development through industrial regeneration rather than merely ecological restoration. In 2005 and 2010, the regression coefficients of green space coverage in built-up areas showed an increasing trend from north to south and were positively correlated with urbanization levels at the 1% significance level. Regions with positive impacts were mainly concentrated in the southern and eastern coastal areas and gradually spread to the middle reaches of the Yangtze River, including Guangdong, Fujian, Zhejiang, Jiangsu, Anhui, and Jiangxi. This may be because the continuous improvement in public infrastructure in these developed coastal areas improved the ecological environment, thereby attracting more capital and population inflows and effectively promoting urban development.
5 Discussion
5.1 Temporal and spatial patterns of urban development
This study, which is based on DMSP-OLS and NPP-VIRRS data, provides dynamic information on the spatial and temporal evolution of urban development in China from 2000 to 2019. Previous studies on the urbanization process have focused only on dynamics before 2012 (Fu et al., 2017; Gao et al., 2015) or concentrated on typical urban agglomerations (Li et al., 2021; Zou et al., 2017). This study complements these previous findings. Research has indicated that China’s urbanization level has rapidly developed but has also exhibited significant temporal and spatial characteristics (Figures 2, 3; Table 1). From a temporal perspective, the level of urbanization in China increased continuously from 2000 to 2019. Notably, a significant acceleration in the urbanization process began in 2010 and has been mainly concentrated in the northern, eastern, and southern coastal areas (Figure 2). Spatially, China’s urban development is uneven and highly spatially correlated. Specifically, urban development trends from concentrated to dispersed and from single-center to multicenter patterns. This finding is consistent with the conclusions of Lan et al. (2019) and Peng et al. (2020). Moreover, the urbanization process in the northeastern region has been relatively slow. According to Yang et al. (2021), the most severe urban shrinkage occurred in the northeastern region from 2008 to 2013 and was characterized by declining employment, population outflow, and building vacancies, all of which severely restricted urban development. This study confirms those findings.
5.2 Factors influencing urban development
Per capita GDP, population density, the proportion of secondary industry in GDP, foreign investment, and green space coverage in built-up areas are the main indicators affecting urban development. Among these factors, per capita GDP and population density have consistently impacted urban development, although their influence has weakened. This may be because, in the early 21st century, coastal areas attracted substantial capital and population inflows at the forefront of China’s economic reform, prompting rapid urbanization. In contrast, the economic development level in the western and central regions was relatively low, leading to significant population outflow and slower urbanization (Zhang et al., 2018). However, as urbanization has reached a certain stage, China’s economy has shifted from “high-speed” to “high-quality” development, focusing more on the ecological environment and regional coordination (Chen et al., 2022), thereby reducing the impact of economic development and population size on urbanization.
The industrial structure significantly influences urban development. Urbanization is a complex process involving population, land, and economic activities (Fan et al., 2014; Song and He, 2022; Xie et al., 2007). Previous studies have shown that the development of secondary industry plays a positive role in urban expansion (Li et al., 2019; Xu et al., 2020). However, the GWR regression analysis reveals that secondary industry negatively impacts urban development in most cities (Figure 6). We hypothesize that the rapid development of secondary industry also leads to problems such as industrial structure imbalances and pollution, which inhibits urbanization. As shown in Figure 6, secondary industry has a less negative impact in the northeastern and northwestern regions, especially in the northeastern region. Perhaps it is because the decline of resource-based industries in this region has led to a reduction in industrial scale, and the population outflow has caused the expansion of built-up areas to stagnate, thereby weakening the intensity of the impact of structural changes (Wang R. L. et al., 2021). Moreover, after the implementation of the “Northeast Revitalization” policy, the structural adjustment through the elimination of backward production capacity may have also alleviated the inhibitory effect of the industrial structure on urbanization (Zhang et al., 2024).
5.3 Limitations
This study enriches urbanization research by using nighttime light data to analyze urban development in China. However, there are several limitations. First, although previous studies have shown that nighttime light data are highly correlated with human economic activities, nighttime lights are just one indicator of human economic activities, and the absence of light does not imply the absence of economic activity. Moreover, changes in nighttime light brightness can be influenced by various light sources, such as streetlights, vehicle lights, and spotlights, potentially causing deviations in human activity estimates. Second, although the influence of policy factors on urban development was recognized, due to the consistency and feasibility of policy quantification at the prefecture-level city level, this study was unable to incorporate exogenous policy variables into the core model. This might have led to the omission of some important explanatory factors. Future research could attempt to utilize text analysis, quasi-natural experiments, or a combination of case studies to explore in greater depth the specific impact mechanisms of the policies. Third, the GWR analysis in this paper focuses on the key policy nodes of urbanization that occurred over a period of 20 years. This discrete approach, although consistent with China’s 5-year planning cycle, essentially limits the detection of inter-annual variations in influencing factors. A model that is spatially continuous but temporally discrete may mask the short-term dynamic changes between observation periods. Future studies utilizing high-frequency nocturnal light data (for instance, the monthly composite data from VIIRS) can implement geographical and time-weighted regression (GTWR) to simultaneously capture the spatio-temporal non-stationarity.
6 Conclusion
Based on nighttime light data, this paper employs exploratory spatial data analysis to investigate the spatial differentiation characteristics of urban development in 285 prefecture-level cities in China from 2000 to 2019. It also uses the GWR model to explain the impact of socioeconomic factors on the heterogeneity of urban development in China. The results indicate that from 2000 to 2019, the overall level of urbanization in China showed an increasing trend, with a spatial distribution pattern shifting from concentrated to dispersed and from single-center to multicenter. Moreover, China’s urban development has exhibited strong spatial autocorrelation. Hotspots are concentrated mainly in the eastern coastal regions and the southern coastal regions, whereas cold spots are concentrated in the southwestern, northwestern, and northeastern regions. Additionally, China’s urbanization process is influenced by economic development, population size, industrial structure, degree of openness to the outside world, and public infrastructure. Different influencing factors have both positive and negative correlation effects on urban development, indicating significant spatial heterogeneity. Specifically, economic development and population size positively promote most cities. The industrial structure has a negative impact on the urbanization process in most regions. Its inhibitory effect is weakest in cold areas. Public infrastructure and economic openness have a greater promoting effect on coastal areas. These research findings are crucial for promoting regional coordinated development and sustainable urbanization. Based on the above conclusions, this paper puts forward corresponding policy implications:
(1) Implement precise targeted interventions in underdeveloped areas to break through the bottleneck of development momentum. In response to the weak driving factors in the “cold spots” of urbanization in regions such as the southwest, northwest and northeast, regional coordination policies need to adopt differentiated and precise measures. The southwestern/northwestern regions should leverage their ecological resource endowments to prioritize the development of clean energy, cultural tourism and other distinctive industries. At the same time, they should strengthen transportation and digital infrastructure to break through geographical isolation and improve public services to stabilize the population. The northeastern region should focus on the transformation of traditional industrial cities, and activate new driving forces through innovation incubators, improvement of business environment, and special policies for the return of specialized talents. By identifying the region-specific weaknesses and implementing targeted compensation, we can avoid the “one-size-fits-all” policies from exacerbating development gaps and cultivate sustainable internal driving forces.
(2) Promote the improvement and efficiency enhancement of key areas, facilitate their external expansion, and balance efficiency and fairness. The “hotspot” areas such as the eastern coastal regions have already achieved a highly coordinated agglomeration effect. Policies should be implemented in a two-way manner, namely, strengthening high-end development and promoting radiation-driven effects. On one hand, support for industrial upgrading, technological innovation and green transformation is carried out to maximize the efficiency of urban growth; on the other hand, through institutional innovation and infrastructure interconnection, guide the industrial chain links to shift gradually to the surrounding areas. This measure not only can unleash the potential of agglomeration economy, but also can alleviate the “Malthusian effect” through active spillover, embodying the strategic connotation of “leading the less developed areas to prosperity”, and achieving a dynamic balance between efficiency and fairness.
(3) Establish a multi-center networked collaborative system to promote complementary functions of various elements. Given the spatial heterogeneity of the “multi-centered” trend and driving factors of urbanization, a cross-regional linkage network needs to be established to activate the collaborative efficiency. The key lies in breaking down administrative barriers and establishing a coordination platform for urban agglomerations/economic belts, to promote the free flow of talents, technologies and capital in accordance with market rules. Based on the regional driving characteristics revealed by GWR analysis, differentiated functional nodes are strategically positioned within the national industrial chain. Through complementary functions and network collaboration, cold regions can be integrated into a broader value chain, while hot regions can expand their hinterland support, thus forming a new development pattern of “diversified coexistence and overall coordination”.
Data availability statement
The raw data supporting the conclusions of this article will be made available by the authors, without undue reservation.
Author contributions
ZR: Investigation, Writing – original draft, Software, Data curation, Formal Analysis, Conceptualization, Writing – review and editing, Methodology. CZ: Data curation, Conceptualization, Visualization, Writing – original draft. LF: Writing – original draft, Visualization, Investigation, Resources. XZ: Methodology, Writing – original draft, Conceptualization, Writing – review and editing, Formal Analysis.
Funding
The author(s) declare that financial support was received for the research and/or publication of this article. This research was funded by the Youth Project of Nanyang Normal University (2023QN015, 2023QN016); The Special Research Funds of Nanyang Normal University (No. 208208, No. 218307); The Special Cultural Research Funds of Henan Province Cultural Revitalization Project (2023XWH253).
Conflict of interest
Author LF was employed by Henan Urban Planning and Design Institute Co., Ltd.
The remaining authors declare that the research was conducted in the absence of any commercial or financial relationships that could be construed as a potential conflict of interest.
Generative AI statement
The author(s) declare that no Generative AI was used in the creation of this manuscript.
Publisher’s note
All claims expressed in this article are solely those of the authors and do not necessarily represent those of their affiliated organizations, or those of the publisher, the editors and the reviewers. Any product that may be evaluated in this article, or claim that may be made by its manufacturer, is not guaranteed or endorsed by the publisher.
References
Chen, Z. C., and Paudel, K. P. (2021). Economic openness, government efficiency, and urbanization. Rev. Dev. Econ. 25 (3), 1351–1372. doi:10.1111/rode.12766
Chen, M. X., Liu, W. D., and Tao, X. L. (2013). Evolution and assessment on China's urbanization 1960–2010: under-Urbanization or over-urbanization? Habitat Int. 38, 25–33. doi:10.1016/j.habitatint.2012.09.007
Chen, Z. Q., Yu, B. L., Yang, C. S., Zhou, Y. U., Yao, S. J., Qian, X. J., et al. (2021). An extended time series (2000–2018) of global NPP-VIIRS-like nighttime light data from a cross-sensor calibration. Earth Syst. Sci. Data 13 (3), 889–906. doi:10.5194/essd-13-889-2021
Chen, Y., Miao, Q. Q., and Zhou, Q. (2022). Spatiotemporal differentiation and driving force analysis of the high-quality development of urban agglomerations along the yellow river basin. Int. J. Environ. Res. Public Health 19 (4), 2484. doi:10.3390/ijerph19042484
Colsaet, A., Laurans, Y., and Levrel, H. (2018). What drives land take and urban land expansion? A systematic review. Land Use Policy 79, 339–349. doi:10.1016/j.landusepol.2018.08.017
Fan, P. L., and Qi, J. G. (2009). Assessing the sustainability of major cities in China. Sustain. Sci. 5 (1), 51–68. doi:10.1007/s11625-009-0096-y
Fan, J. F., Ma, T., Zhou, C. H., Zhou, Y. K., and Xu, T. (2014). Comparative estimation of urban development in china’s cities using socioeconomic and DMSP/OLS night light data. Remote Sens. 6 (8), 7840–7856. doi:10.3390/rs6087840
Fu, H. Y., Shao, Z. F., Fu, P., and Cheng, Q. M. (2017). The dynamic analysis between urban nighttime economy and urbanization using the DMSP/OLS nighttime light data in China from 1992 to 2012. Remote Sens. 9 (5), 416. doi:10.3390/rs9050416
Gao, B., Huang, Q. X., He, C. Y., and Ma, Q. (2015). Dynamics of urbanization levels in China from 1992 to 2012: perspective from DMSP/OLS nighttime light Data. Remote Sens. 7 (2), 1721–1735. doi:10.3390/rs70201721
Getis, A., and Ord, J. K. (2010). The analysis of spatial association by use of distance statistics. Geogr. Anal. 24 (3), 189–206. doi:10.1111/j.1538-4632.1992.tb00261.x
Han, J. Z., Sajadi, P., Hu, Z. Q., Zhou, K. P., Li, S. J., Feng, Z. J., et al. (2024). Exploration of the urbanization process and its impact on vegetation in 125 resource-based cities in China and comparison with other cities. Remote Sens. 16 (19), 3640. doi:10.3390/rs16193640
He, X. H., Li, Z. W., Guo, H. L., Tian, Z. H., and Wang, X. L. (2019). Analysing the consistency between built-up areas and human activities and the impacts on the urbanization process: a case study of zhengzhou, China. Int. J. Remote Sens. 40 (15), 6008–6035. doi:10.1080/01431161.2019.1587199
Jia, M. Y., Liu, Y., Lieske, S. N., and Chen, T. (2020). Public policy change and its impact on urban expansion: an evaluation of 265 cities in China. Land Use Policy 97, 104754. doi:10.1016/j.landusepol.2020.104754
Jiang, Y. H., and Sun, P. J. (2024). Does shrinkage have an impact on urban livability? An empirical analysis from northeast China. Sustain. Cities Soc. 113, 105725. doi:10.1016/j.scs.2024.105725
Jiang, S. N., Wei, G. E., Zhang, Z. K., Wang, Y., Xu, M. H., Wang, Q., et al. (2021). Detecting the dynamics of urban growth in Africa using DMSP/OLS nighttime light data. Land 10 (1), 13. doi:10.3390/land10010013
Jin, Z. X., Wang, C. X., Jiao, X. M., Yu, S. K., Yang, C., Xie, F. C., et al. (2024). Spatiotemporal pattern and influencing factors of urbanization quality in county areas of Shandong Province, China. Ecol. Indic. 163, 112132. doi:10.1016/j.ecolind.2024.112132
Lan, F., Da, H. L., Wen, H. Z., and Wang, Y. (2019). Spatial structure evolution of urban agglomerations and its driving factors in mainland China: from the monocentric to the polycentric dimension. Sustainability 11 (3), 610. doi:10.3390/su11030610
Levin, N., Kyba, C. C. M., Zhang, Q. L., Sánchez de Miguel, A., Román, M. O., Li, X., et al. (2020). Remote sensing of night lights: a review and an outlook for the future. Remote Sens. Environ. 237, 111443. doi:10.1016/j.rse.2019.111443
Li, X. M., Zhou, W. Q., and Ouyang, Z. Y. (2013). Forty years of urban expansion in beijing: what is the relative importance of physical, socioeconomic, and neighborhood factors? Appl. Geogr. 38, 1–10. doi:10.1016/j.apgeog.2012.11.004
Li, G. D., Sun, S., and Fang, C. L. (2018). The varying driving forces of urban expansion in China: insights from a spatial-temporal analysis. Landsc. Urban Plan. 174, 63–77. doi:10.1016/j.landurbplan.2018.03.004
Li, H. M., Li, X. G., Yang, X. Y., and Zhang, H. (2018). Analyzing the relationship between developed land area and nighttime light emissions of 36 Chinese cities. Remote Sens. 11 (1), 10. doi:10.3390/rs11010010
Li, M., Zhang, G. J., Liu, Y., Cao, Y. W., and Zhou, C. S. (2019). Determinants of urban expansion and spatial heterogeneity in China. Int. J. Environ. Res. Public Health 16 (19), 3706. doi:10.3390/ijerph16193706
Li, Z. Y., Luan, W. X., Zhang, Z. C., and Su, M. (2020). Relationship between urban construction land expansion and population/economic growth in Liaoning Province, China. Land Use Policy 99, 105022. doi:10.1016/j.landusepol.2020.105022
Li, Y., Ye, H. P., Gao, X., Sun, D. Q., Li, Z. H., Zhang, N. H., et al. (2021). Spatiotemporal patterns of urbanization in the three Most developed urban agglomerations in China based on continuous nighttime light data (2000–2018). Remote Sens. 13 (12), 2245. doi:10.3390/rs13122245
Liang, W., and Yang, M. (2019). Urbanization, economic growth and environmental pollution: evidence from China. Sustain Comput-Infor 21, 1–9. doi:10.1016/j.suscom.2018.11.007
Liu, Y. L., Zhang, X. H., Pan, X. Y., Ma, X. X., and Tang, M. Y. (2020). The spatial integration and coordinated industrial development of urban agglomerations in the yangtze river economic belt, China. Cities 104, 102801. doi:10.1016/j.cities.2020.102801
Liu, J. M., Hou, X. H., Wang, Z. Q., and Shen, Y. (2021). Study the effect of industrial structure optimization on urban land-use efficiency in China. Land Use Policy 105, 105390. doi:10.1016/j.landusepol.2021.105390
Lv, Q., Liu, H. B., Wang, J. T., Liu, H., and Shang, Y. (2020). Multiscale analysis on spatiotemporal dynamics of energy consumption CO(2) emissions in China: utilizing the integrated of DMSP-OLS and NPP-VIIRS nighttime light datasets. Sci. Total Environ. 703, 134394. doi:10.1016/j.scitotenv.2019.134394
Ma, T., Zhou, C. H., Pei, T., Haynie, S., and Fan, J. F. (2012). Quantitative estimation of urbanization dynamics using time series of DMSP/OLS nighttime light data: a comparative case study from China's cities. Remote Sens. Environ. 124, 99–107. doi:10.1016/j.rse.2012.04.018
Ma, X. L., Tong, X. H., Liu, S. C., Luo, X., Xie, H., and Li, C. M. (2017). Optimized sample selection in SVM classification by combining with DMSP-OLS, landsat NDVI and GlobeLand30 products for extracting urban Built-Up areas. Remote Sens. 9 (3), 236. doi:10.3390/rs9030236
Moran, P. A. P. (1950). Notes on continuous stochastic phenomena. Biometrika 37 (1-2), 17–23. doi:10.1093/biomet/37.1-2.17
Peng, J., Lin, H. X., Chen, Y. Q., Blaschke, T., Luo, L. W., Xu, Z. H., et al. (2020). Spatiotemporal evolution of urban agglomerations in China during 2000–2012: a nighttime light approach. Landsc. Ecol. 35 (2), 421–434. doi:10.1007/s10980-019-00956-y
Reba, M., and Seto, K. C. (2020). A systematic review and assessment of algorithms to detect, characterize, and monitor urban land change. Remote Sens. Environ. 242, 111739. doi:10.1016/j.rse.2020.111739
Shi, K. F., Chen, Y., Yu, B. L., Xu, T. B., Yang, C. S., Li, L. Y., et al. (2016). Detecting spatiotemporal dynamics of global electric power consumption using DMSP-OLS nighttime stable light data. Appl. Energy 184, 450–463. doi:10.1016/j.apenergy.2016.10.032
Shi, L. P., Cai, Z. Y., Ding, X. H., Di, R., and Xiao, Q. Q. (2020). What factors affect the level of green urbanization in the yellow river basin in the context of new-type urbanization? Sustainability 12 (6), 2488. doi:10.3390/su12062488
Small, C., Elvidge, C. D., Balk, D., and Montgomery, M. (2011). Spatial scaling of stable night lights. Remote Sens. Environ. 115 (2), 269–280. doi:10.1016/j.rse.2010.08.021
Song, H. P., and He, T. T. (2022). Spatio-temporal dynamics of national characteristic towns in China using nighttime light data. Remote Sens. 14 (3), 598. doi:10.3390/rs14030598
Song, J. C., Tong, X. Y., Wang, L. Z., Zhao, C. L., and Prishchepov, A. V. (2019). Monitoring finer-scale population density in urban functional zones: a remote sensing data fusion approach. Landsc. Urban Plan. 190, 103580. doi:10.1016/j.landurbplan.2019.05.011
Sun, X. S., Zhang, C. W., and Tan, Q. (2023). Factors influencing the coordinated development of urbanization and its spatial effects: a case study of beijing-tianjin-hebei region. Sustainability 15 (5), 4137. doi:10.3390/su15054137
Wang, Z. B., Liang, L. W., Sun, Z., and Wang, X. M. (2019). Spatiotemporal differentiation and the factors influencing urbanization and ecological environment synergistic effects within the beijing-tianjin-hebei urban agglomeration. J. Environ. Manage 243, 227–239. doi:10.1016/j.jenvman.2019.04.088
Wang, D. D., Wei, Y. D., and Deng, T. T. (2021). Transportation development, spatiotemporal convergence, and urban land use: study of the opening of high-speed rails in the yangtze river Delta, China. J. Urban Plan. Dev. 147 (3), 05021023. doi:10.1061/(asce)up.1943-5444.0000732
Wang, R. L., Wang, C. X., Zhang, S., and Ding, X. M. (2021). A study on the spatial and temporal evolution of urban shrinkage and its influencing factors from a multidimensional perspective: a case study of resource-based cities in China. Plos one 16 (10), e0258524. doi:10.1371/journal.pone.0258524
Wigginton, N. S., Fahrenkamp-Uppenbrink, J., Wible, B., and Malakoff, D. (2016). Cities are the future. Science 352 (6288), 904–905. doi:10.1126/science.352.6288.904
Wu, D. J., and Rao, P. (2016). Urbanization and income inequality in China: an empirical investigation at provincial level. Soc. Indic. Res. 131 (1), 189–214. doi:10.1007/s11205-016-1229-1
Xie, Y. C., Fang, C. L., Lin, G. C. S., Gong, H. M., and Qiao, B. (2007). Tempo-spatial patterns of land use changes and urban development in globalizing China: a study of beijing. Sensors 7 (11), 2881–2906. doi:10.3390/S7112881
Xie, Y. H., Weng, Q. H., and Fu, P. (2019). Temporal variations of artificial nighttime lights and their implications for urbanization in the conterminous United States, 2013–2017. Remote Sens. Environ. 225, 160–174. doi:10.1016/j.rse.2019.03.008
Xu, J. W., Zhao, J. J., Zhang, H. Y., and Guo, X. Y. (2020). Evolution of the process of urban spatial and temporal patterns and its influencing factors in northeast China. J. Urban Plan. Dev. 146 (4), 05020017. doi:10.1061/(asce)up.1943-5444.0000606
Xu, P. F., Lin, M. Y., and Jin, P. B. (2021). Spatio-temporal dynamics of urbanization in China using DMSP/OLS nighttime light data from 1992–2013. Chin. Geogr. Sci. 31 (1), 70–80. doi:10.1007/s11769-020-1169-1
Yan, D., Kong, Y., Jiang, P., Huang, R., and Ye, B. (2021). How do socioeconomic factors influence urban PM2.5 pollution in China? Empirical analysis from the perspective of spatiotemporal disequilibrium. Sci. Total Environ. 761, 143266. doi:10.1016/j.scitotenv.2020.143266
Yang, K., Zhang, S. H., Luo, Y., Xu, Q. L., and Qu, L. Q. (2018). The widening urbanization gap between the three northeast provinces and the yangtze river Delta under China’s economic reform from 1984 to 2014. Int. J. Sustain. Dev. World Ecol. 25 (3), 262–275. doi:10.1080/13504509.2017.1400478
Yang, C. S., Yu, B. L., Chen, Z. Q., Song, W., Zhou, Y. Y., Li, X., et al. (2019). A spatial-socioeconomic urban development status curve from NPP-VIIRS nighttime light data. Remote Sens. 11 (20), 2398. doi:10.3390/rs11202398
Yang, Y., Wu, J. G., Wang, Y., Huang, Q. X., and He, C. Y. (2021). Quantifying spatiotemporal patterns of shrinking cities in urbanizing China: a novel approach based on time-series nighttime light data. Cities 118, 103346. doi:10.1016/j.cities.2021.103346
Yang, W., Yang, R., and Zhou, S. (2022). The spatial heterogeneity of urban green space inequity from a perspective of the vulnerable: a case study of guangzhou, China. Cities 130, 103855. doi:10.1016/j.cities.2022.103855
Yi, K. P., Tani, H., Li, Q., Zhang, J. Q., Guo, M., Bao, Y. L., et al. (2014). Mapping and evaluating the urbanization process in northeast China using DMSP/OLS nighttime light data. Sensors 14 (2), 3207–3226. doi:10.3390/s140203207
Zhai, C., Geng, R. X., Ren, Z. B., Wang, C. C., Zhang, P., Guo, Y. J., et al. (2024). Spatiotemporal dynamics of urban green space coverage and its exposed population under rapid urbanization in China. Remote Sens. 16 (15), 2836. doi:10.3390/rs16152836
Zhang, Q. W., and Su, S. L. (2016). Determinants of urban expansion and their relative importance: a comparative analysis of 30 major metropolitans in China. Habitat Int. 58, 89–107. doi:10.1016/j.habitatint.2016.10.003
Zhang, W. J., and Wang, M. Y. (2018). Spatial-temporal characteristics and determinants of land urbanization quality in China: evidence from 285 prefecture-level cities. Sustain Cities Soc. 38, 70–79. doi:10.1016/j.scs.2017.12.011
Zhang, Y. W., and Xie, H. L. (2019). Interactive relationship among urban expansion, economic development, and population growth since the reform and opening up in China: an analysis based on a vector error correction model. Land 8 (10), 153. doi:10.3390/land8100153
Zhang, G. J., Huang, W. L., Zhou, C. S., and Cao, Y. W. (2018). Spatio-temporal characteristics of demographic distribution in China from the perspective of urban agglomeration. Acta Geogr. Sin. 73 (8), 1513–1525. doi:10.11821/dlxb201808009
Zhang, Y. J., Fu, Y., Kong, X. S., and Zhang, F. (2019). Prefecture-level city shrinkage on the regional dimension in China: spatiotemporal change and internal relations. Sustain. Cities Soc. 47, 101490. doi:10.1016/j.scs.2019.101490
Zhang, P. Y., Yang, D., Qin, M. Z., and Jing, W. L. (2020). Spatial heterogeneity analysis and driving forces exploring of built-up land development intensity in Chinese prefecture-level cities and implications for future urban land intensive use. Land Use Policy 99, 104958. doi:10.1016/j.landusepol.2020.104958
Zhang, H., Chen, M. X., and Liang, C. (2022). Urbanization of county in China: spatial patterns and influencing factors. J. Geogr. Sci. 32 (7), 1241–1260. doi:10.1007/s11442-022-1995-4
Zhang, L. G., Huang, L. C., Xia, J. L., and Duan, K. F. (2022). Spatial-temporal evolution and its influencing factors on urban land use efficiency in China’s yangtze river economic belt. Land 12 (1), 76. doi:10.3390/land12010076
Zhang, W. W., Zhang, Y. C., and Li, W. (2024). Impact of northeast revitalization policy on the industrial economy: empirical evidence from central and southern Liaoning urban agglomeration. Appl. Econ. 56 (52), 6648–6666. doi:10.1080/00036846.2023.2275223
Zhao, J., and Li, C. (2022). Investigating ecosystem service trade-Offs/Synergies and their influencing factors in the yangtze river Delta region, China. Land 11 (1), 106. doi:10.3390/land11010106
Zhao, M., Zhou, Y. Y., Li, X. C., Cao, W. T., He, C. Y., Yu, B. L., et al. (2019). Applications of satellite remote sensing of nighttime light observations: advances, challenges, and perspectives. Remote Sens. 11 (17), 1971. doi:10.3390/rs11171971
Zheng, Y. M., He, Y. R., Zhou, Q., and Wang, H. W. (2022). Quantitative evaluation of urban expansion using NPP-VIIRS nighttime light and landsat spectral data. Sustain. Cities Soc. 76, 103338. doi:10.1016/j.scs.2021.103338
Zhu, X. B., Ma, M. G., Yang, H., and Ge, W. (2017). Modeling the spatiotemporal dynamics of gross domestic product in China using extended temporal coverage nighttime light data. Remote Sens. 9 (6), 626. doi:10.3390/rs9060626
Zhuo, L., Ichinose, T., Zheng, J., Chen, J., Shi, P. J., and Li, X. (2009). Modelling the population density of China at the pixel level based on DMSP/OLS non-radiance-calibrated night-time light images. Int. J. Remote Sens. 30 (4), 1003–1018. doi:10.1080/01431160802430693
Zou, H., and Ma, X. H. (2021). Identifying resource and environmental carrying capacity in the yangtze river economic belt, China: the perspectives of spatial differences and sustainable development. Eenviron Dev. Sustain 23 (10), 14775–14798. doi:10.1007/s10668-021-01271-w
Keywords: urbanization process, geographically weighted regression, spatial heterogeneity, spatial autocorrelation, nighttime light
Citation: Ren Z, Zhang C, Fan L and Zhao X (2025) Spatiotemporal characteristics and spatial heterogeneity of influencing factors in China’s urbanization process: based on nighttime light remote sensing data. Front. Environ. Sci. 13:1643214. doi: 10.3389/fenvs.2025.1643214
Received: 08 June 2025; Accepted: 29 July 2025;
Published: 13 August 2025.
Edited by:
Zhuosen Wang, University of Maryland, United StatesReviewed by:
Fanglei Zhong, Minzu University of China, ChinaHong Zhu, Institute of Disaster Prevention, China
Copyright © 2025 Ren, Zhang, Fan and Zhao. This is an open-access article distributed under the terms of the Creative Commons Attribution License (CC BY). The use, distribution or reproduction in other forums is permitted, provided the original author(s) and the copyright owner(s) are credited and that the original publication in this journal is cited, in accordance with accepted academic practice. No use, distribution or reproduction is permitted which does not comply with these terms.
*Correspondence: Xiaonan Zhao, emhhb3huMTAwOUBueW51LmVkdS5jbg==