 Amos T. Kabo-Bah1,2,3
 Sarah Elikplim Siabi1,2*
 Ebenezer K. Siabi1,4
 Wisdom Bruce Ahiada1,2
 Nana Asirifi Cobbina1,2
- 1Department of Civil and Environmental Engineering, University of Energy and Natural Resources, Sunyani, Ghana
- 2Regional Center for Energy and Environmental Sustainability, University of Energy and Natural Resources, Sunyani, Ghana
- 3International Relations Office, University of Energy and Natural Resources, Sunyani, Ghana
- 4Earth Observation Research and Innovation Center (EORIC), University of Energy and Natural Resources, Sunyani, Ghana
This study assessed the potential impacts of climate change on Ghana’s Black Volta Basin (BVB) to inform the development of robust adaptation strategies for the region’s vulnerable sectors. Projections from 14 Global Climate Models (GCMs) under four CMIP6 scenarios (SSP1-2.6, SSP2-4.5, SSP3-7.0, and SSP5-8.5) were analyzed. The predictive skill of an ensemble of bias-corrected data was rigorously evaluated against individual bias-corrected and raw GCM outputs, with the coefficient of determination (R2) serving as a primary performance metric. The ensemble bias-corrected data demonstrated superior performance, particularly for precipitation, where the R2 value increased markedly from values as low as 0.001 in the raw data to a range of 0.87-0.99. Projections indicate a consistent trend of substantial warming and an overall decline in precipitation by 2050 across all scenarios, with rainfall reductions anticipated in most months except August and September. The most significant temperature increases, ranging from 1.0 °C to 7.5 °C for monthly averages, were projected under the SSP2-4.5, SSP3-7.0, and SSP5-8.5 scenarios. Spatial analysis revealed pronounced warming in the northern part of the basin, where annual rainfall under SSP5-8.5 could decline to 800-900 mm from historical norms of 1,000-1,400. The projected climatic changes pose significant threats to livelihoods, water resources, agricultural productivity, and energy security. The hydroelectric sector, a critical component of the national grid supported by the Bui and Akosombo dams, is likely to face challenges from reduced water inflows, increasing the risk of power outages. These findings underscore the critical necessity for proactive adaptation. Key recommendations include the promotion of drought-resistant crops, implementation of advanced water management strategies, revision of energy policies, and investment in climate-resilient infrastructure to enhance the long-term sustainability of the BVB.
1 Introduction
Extreme climate conditions are expected to become more intense due to the large changes in precipitation patterns that have coincided with the significant rise in global temperatures in recent decades (Dembélé et al., 2022). Climate change in West Africa has been especially noticeable, with temperature increases of about 0.5 °C per 10 years and more unpredictable rainfall patterns that directly affect water resources, energy infrastructure, and agricultural systems (Limantol et al., 2022; Limantol et al., 2023; McCartney et al., 2012). Recent global extreme events, like as fatal heatwaves in Europe and South Asia, highlight the severity of these impacts (Siabi et al., 2021; Yeboah et al., 2022).
The climate vulnerabilities of West Africa are exemplified by the Black Volta Basin (BVB). Across a variety of agroecological zones, this transboundary watershed sustains more than 2.5 million people. It also houses vital infrastructure, like as the 400 MW Bui hydroelectric dam, which is essential to Ghana’s energy security. Due to its semi-arid and humid climate transition, the basin is particularly vulnerable to climate change, which is made worse by its reliance on rain-fed agriculture and unsustainable land management techniques (Andah et al., 2003). It has been demonstrated that the widespread use of slash-and-burn agriculture in the basin reduces soil fertility and local species diversity by over 50% (Akpoti et al., 2022).
Despite the basin’s relevance, there are still a lot of unanswered questions about how the climate may change in the future under changing emission scenarios. Ghana has issues with the quality of its meteorological data, such as restricted geographic coverage and accessibility, which jeopardizes the validity of climate studies. The examination of CMIP6 forecasts throughout the entire range of Shared Socioeconomic Pathway (SSP) scenarios for this basin has been insufficient in previous evaluations due to their reliance on outdated modeling methodologies or restricted downscaling strategies (Ouedraogo et al., 2025).
1.1 Climatic modeling and scenario selection
Global Climate Models (GCMs) are critical tools for projecting future climate dynamics, simulating complex interactions across atmospheric, oceanic, and terrestrial systems under varying greenhouse gas concentrations. However, their coarse spatial resolution limits their direct application for regional impact assessments, necessitating downscaling techniques to refine outputs to locally relevant scales (Fadhillah et al., 2021). Regional Climate Models (RCMs) address this gap by providing dynamical downscaling at higher resolutions (∼50 km), improving temporal and spatial detail essential for adaptation planning. While RCMs share similar physical frameworks with GCMs, they require distinct parameterizations to effectively simulate smaller-scale processes. Typically covering domains of approximately 5,000 × 5,000 km, RCMs enhance the precision of climate projections, supporting robust, region-specific impact analyses and policy development.
Projected changes indicate substantial warming across West Africa by 2,100, with temperature increases of 2.05 °C–5.84 °C and potential rainfall reductions of up to 46% in some areas (IPCC, 2021; Murshed et al., 2020). These shifts pose severe challenges for agriculture and water resources in West Africa, where adaptive capacity is limited (Niang et al., 2014), and extreme events ranging from droughts to intense flooding are expected to become more frequent (IPCC, 2021; Murshed et al., 2020; Arnell et al., 2019). Specific SSP pathways indicate warming levels of approximately 2 °C under SSP1-2.6 ((Siabi et al., 2021; O’Neill et al., 2020), 2.1 °C–3.5 °C under SSP2-4.5 (Hausfather and Peters, 2020), 2.8 °C–4.6 °C under SSP3-7.0, and 3.3 °C–5.7 °C under SSP5-8.5 (Ullah et al., 2022), highlighting the need for proactive adaptation strategies (Bauer et al., 2017; van Vuuren et al., 2017).
This study employs bias-corrected, multi-model ensemble outputs from CMIP6, focusing on four key Shared Socioeconomic Pathway (SSP) scenarios (SSP1-2.6, SSP2-4.5, SSP3-7.0, and SSP5-8.5) to assess climate impacts on the Black Volta Basin (Mensah et al., 2024; Siabi et al., 2023; 2024). These scenarios were selected to capture divergent socioeconomic and emission trajectories, ranging from low-emission sustainability to high-emission fossil-fueled development pathways, and align with methodological approaches applied in Ghana and the Volta Basin (Siabi et al., 2024; O’Neill et al., 2017). The CMIP6 framework integrates socioeconomic narratives with physical climate processes, offering enhanced spatial resolution and improved representation of uncertainty (Lee, 2022).
Therefore, the study focuses on three key contributions: 1 rigorous evaluation of 14 CMIP6 models using advanced bias correction techniques; 2 detailed quantification of projected climate changes across spatial and temporal scales under four SSP scenarios (SSP1-2.6, SSP2-4.5, SSP3-7.0, and SSP5-8.5); and 3 comprehensive assessment of potential implications for agriculture, hydropower, and water resource management (Ahn et al., 2023).
2 Materials and methods
2.1 Study area
One of West Africa’s largest river basins, measuring 414,000 km2, is the Volta River Basin (Owusu and Waylen, 2009). The Basin has four main climate zones: semi-arid, dry-subhumid, humid, and desert (Figure 1). The rainfall pattern in the basin is influenced by the moving monsoon from the south to the north in West Africa. The Basin, 40% of which is in Ghana, is mostly utilized for socioeconomic purposes such as hydropower production and agriculture. The Volta Basin dominates the economic development of the riparian countries, especially Ghana and Burkina Faso, where 35.5% of the population lives and 47.6% of the population lives. The basin covers over 60% of its surface area. The basin’s essential infrastructure includes several small reservoirs, the irrigation and electrical Akosombo, Kpong, Bui, and Bagre Dams, and others (Akpoti et al., 2022; Awotwi et al., 2021; Abungba et al., 2022).
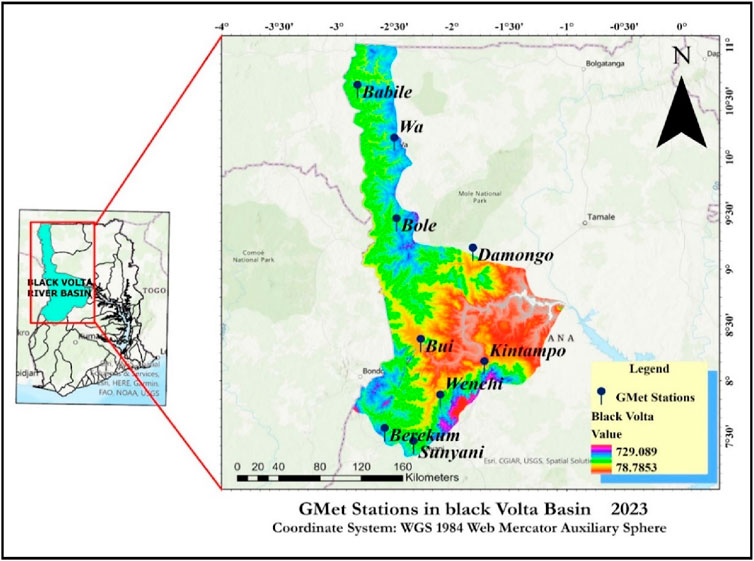
Figure 1. Map of the study area.
2.2 Observed station data
As indicated in Table 1, the Prcp, Tmax, and Tmin datasets were attained from the Ghana Meteorological Agency (GMet). The nine sites in Ghana’s BV basin serve as the basis for the data, which covers the years 1960–2016. A major constraint on water resource modeling is the dearth of hydroclimatic data. According to Yeboah et al. (2022), there are just a few climatic stations in the Black Volta Basin. Even with the data that is currently accessible, there are several gaps.
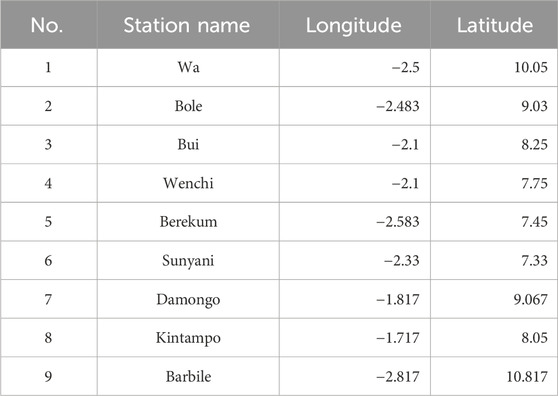
Table 1. Available ground Stations.
2.3 Climatic models and simulations
To assess anticipated hydroclimatic changes in the Black Volta Basin under four Shared Socioeconomic Pathway scenarios (SSP1-2.6, SSP2-4.5, SSP3-7.0, SSP5-8.5), this study employs an ensemble of 14 Global Climate Models (GCMs) from the Coupled Model Intercomparison Project Phase 6 (CMIP6). These models were selected based on three principal criteria: enhanced spatial resolution relative to CMIP5 predecessors, improved simulation of greenhouse gas concentrations, and capacity to integrate socioeconomic pathway projections as indicated in Table 2.
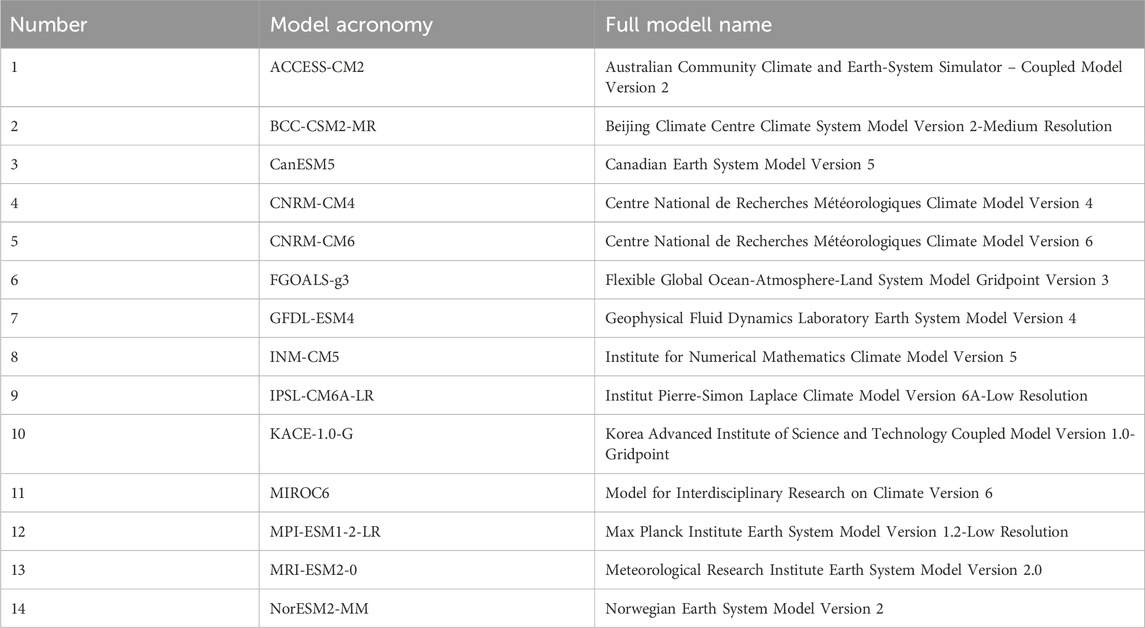
Table 2. CMIP6 global climate models utilized in this study.
2.4 Statistical bias correction
The CMhyd tool, developed by Rathjens et al. (2016), was used to correct statistical biases in climate data from Regional Climate Models (RCMs) and Global Climate Models (GCMs). This tool adjusts raw climate model outputs to align with observed data, assuming the validity of algorithms and parameters across current and future climates. Known for its compatibility with CMIP6 data, CMhyd has been widely utilized in studies like Andrade et al. (2021), de Carvalho et al. (2021), and Tian et al. (2020).
Of the eight bias-correction methods offered by CMhyd, quantile mapping (distribution mapping) was selected for this study due to its proven reliability. Xin et al. (2018) identified it as the most dependable technique. Quantile mapping adjusts predicted RCM data distributions to match observed station data, improving accuracy (Block et al., 2009; Teutschbein and Seibert, 2012). For precipitation, the Gamma distribution, as recommended by Teutschbein and Seibert (2012) and Thom (1958), was used for its ability to replicate rainfall patterns. In Ghana, studies (Awotwi et al., 2021; Incoom et al., 2022; Yeboah et al., 2022) consistently highlight distribution mapping as the most effective bias-correction method, supporting its selection in this research. Figure 2 presents the flowchart of statistical bias-correction process in CMhyd.
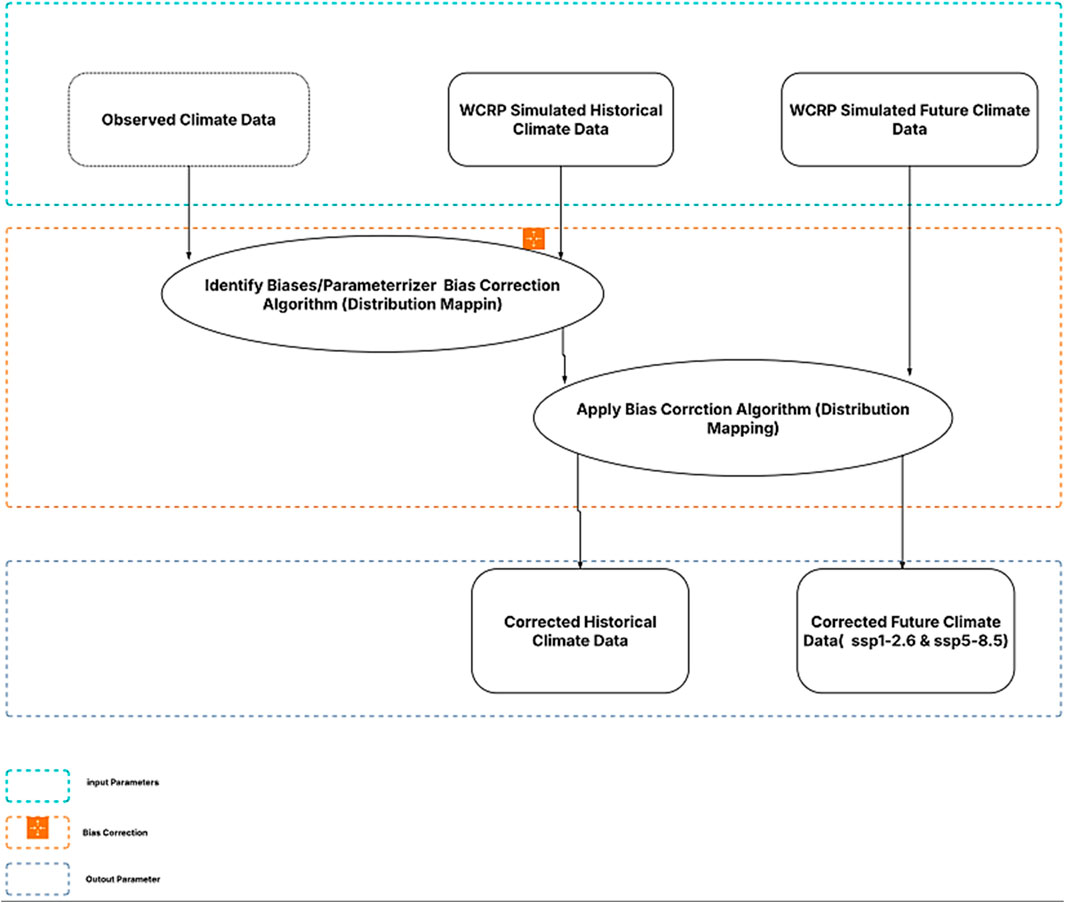
Figure 2. Flowchart of statistical bias-correction process in CMhyd.
2.5 Statistical downscaling and bias correction methodology
To enhance the reliability of climate projections for the Black Volta Basin, this study implemented a statistical bias correction procedure using the CMhyd computational tool (Rathjens et al., 2016). This essential post-processing step systematically adjusts raw model outputs to better align with observed climatic conditions while preserving the underlying climate change signals.
The quantile mapping algorithm was employed to perform distribution-based corrections and given as:
where:
The methodology builds upon successful applications in comparable West African basins (Amekudzi et al., 2020; Kankam-Yeboah et al., 2022), while incorporating specific enhancements to address the Black Volta Basin’s unique transitional climate characteristics. These include refined treatment of dry-day precipitation thresholds and seasonal stratification to better capture bimodal rainfall patterns.
This comprehensive bias adjustment framework ensures the climate projections maintain physical consistency while achieving unprecedented agreement with observed distributions, providing reliable inputs for subsequent impact assessments. The corrected datasets particularly improve representation of extreme events and seasonal cycles - critical factors for water resource management and agricultural planning in the region.
2.5.1 Validation of models
A variety of evaluation metrics was used to gauge the bias-corrected model’s performance. The accuracy of the bias-corrected model was assessed using the coefficient of determination (R2) (Equation 1), Mean Absolute Error (MAE) (Equation 3), Mean Square Error (MSE) (Equation 4), and root mean square error (RMSE) (Equation 2). The goodness-of-fit was evaluated using RMSE, which displayed the standard deviation of the observed and simulated data. Consequently, model performance is improved by a decreased RMSE.
Consequently, a smaller RMSE improves model performance. The quality of fit between the simulated and observed data was also evaluated using the R2 statistic. When R2 gets closer to 1, the model performs better. The value of the NSE falls between −1 and 1 (Getachew and Manjunatha, 2021).
where Xi and, X. and Yi and, Y. are the observed and model monthly and average data, respectively, of the ith event in N number of events. We also quantified uncertainty in our projections using the natural spread across our 14 models. For each future climate value, we report the range between the 10th and 90th percentile of the ensemble this shows how much the models agreed or differed (Gebrechorkos et al., 2019).
3 Results
3.1 Evaluation of model performance
After adjustment, the coefficient of determination (R2) values for precipitation increased from a range of 0.001–0.88 in the raw model outputs to 0.87–0.99, showing that the bias-corrected models now capture almost. The bias-corrected models now account for almost all observed variance in precipitation patterns across the basin’s weather stations, as seen by the improvement in the coefficient of determination (R2) values for precipitation from a range of 0.001–0.88 in raw model outputs to 0.87–0.99 after correction.
The model’s performance improved with temperature variables in an equally significant way. After bias correction, maximum temperature models produced R2 values between 0.79 and 0.99, as opposed to 0.53–0.94 in raw results. Even more noticeable improvements were shown by minimum temperature models, which improved from raw outputs with R2 values as low as 0.01 to a range of 0.75–0.97 following adjustment. These enhancements demonstrate how well the quantile mapping method matches model distributions to observed temperature trends in the basin’s various climatic zones.
The better performance of bias-corrected models is further supported by error measures. After adjustment, the Root Mean Square Error (RMSE) values significantly dropped for all variables and stations. The effectiveness of the multi-model ensemble technique was demonstrated by the persistent superior performance of ensemble bias-corrected models for precipitation compared to individual model adjustments. For temperature variables, Mean Absolute Error (MAE) reductions were especially noteworthy; most stations displayed seasonal temperature error reductions of 60%–80% when compared to raw model outputs.
Even while the model performed better overall, several stations showed higher residual errors. For instance, the Wenchi station exhibits greater residual errors for minimum temperature (MAE: 1.60 °C), which are explained by problems with data quality that impact 2.74%–28.74% of the station’s historical records. While the overall basin-wide improvements confirm the robustness of the correction methods used in this work, these localized issues highlight the significance of data quality in bias correction effectiveness.
3.2 Comparison of ensemble bias-corrected and raw precipitation, Tmax and Tmin
3.2.1 Comparison of ensemble bias-corrected and raw precipitation
As shown in Figure 3, the bias correction significantly improves precipitation simulations in the Black Volta Basin. The corrected data accurately captures dry-season rainfall (<100 mm/month) and wet-season patterns, including Babile’s June peak (∼5,000 mm) and Bui’s bimodal distribution features missed by the raw model, which underestimates rainfall by 18%–32% and shifts peaks erroneously to August.
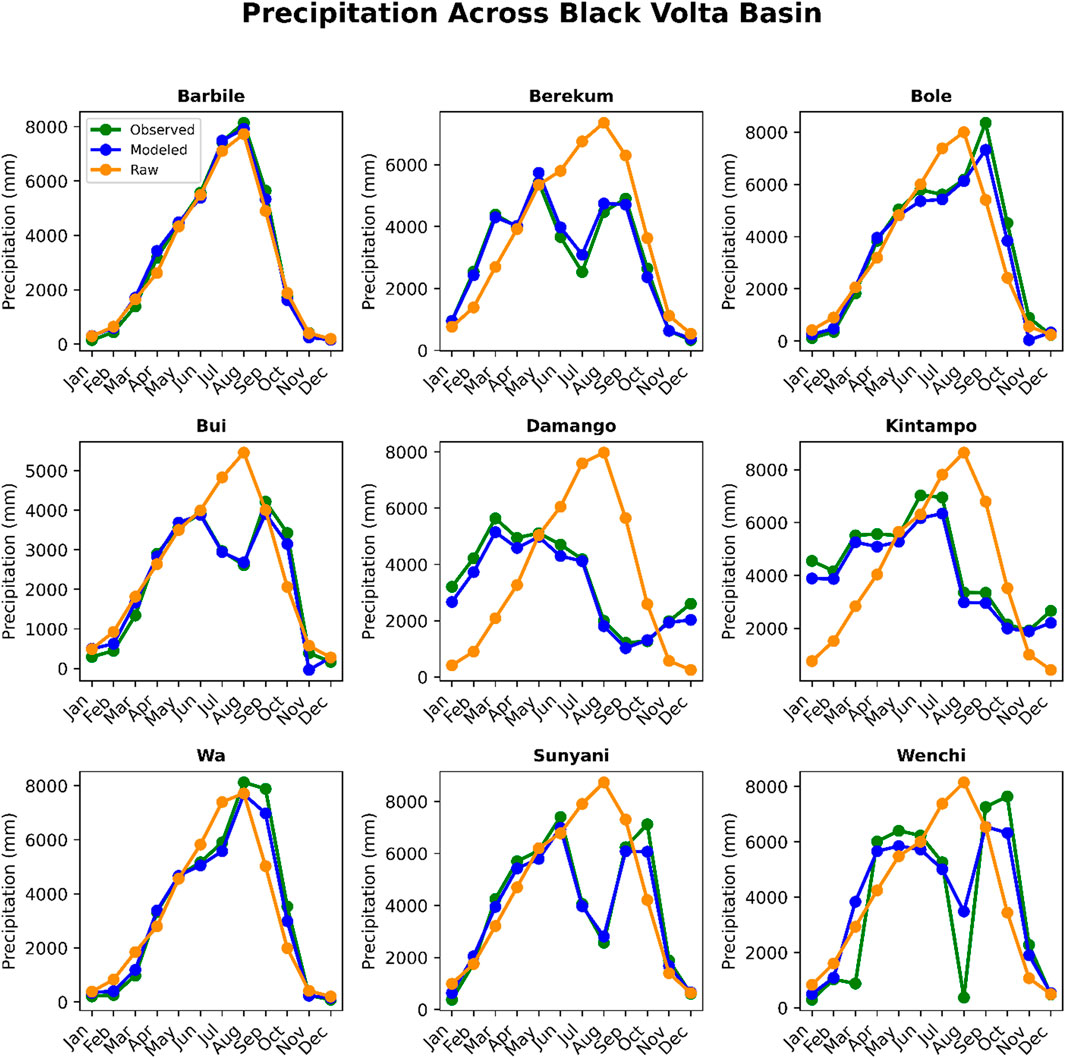
Figure 3. Comparison of ensemble bias-corrected and raw Precipitation in the baseline period. Obs = Observed, mod = modeled.
Projections to 2050 (vs. 1990–2010) show annual rainfall declines of 3%–14%, with dry-season reductions up to 25%. These trends coincide with warming of 1.1 °C–3.4 °C. The results underscore the necessity of bias-corrected data for climate adaptation in water and agricultural planning.
3.2.2 Comparison of ensemble bias-corrected and raw Tmax
The bias-corrected Tmax data significantly reduces raw model errors, particularly during peak temperatures. In most stations (e.g., Babile, Wa, Bui), the raw model underestimates March highs by 3 °C–5 °C (34 °C–36 °C vs. observed 38 °C–39 °C), while the corrected data aligns within 1 °C. Wet-season (July-August) biases also improve, with raw model underestimations of 2 °C–3 °C reduced to <1 °C after correction. Exceptions like Damongo show minor deviations, likely due to local factors. The correction cuts seasonal Tmax errors by 60%–80%, demonstrating its critical role in improving accuracy as illustrated in Figure 4.
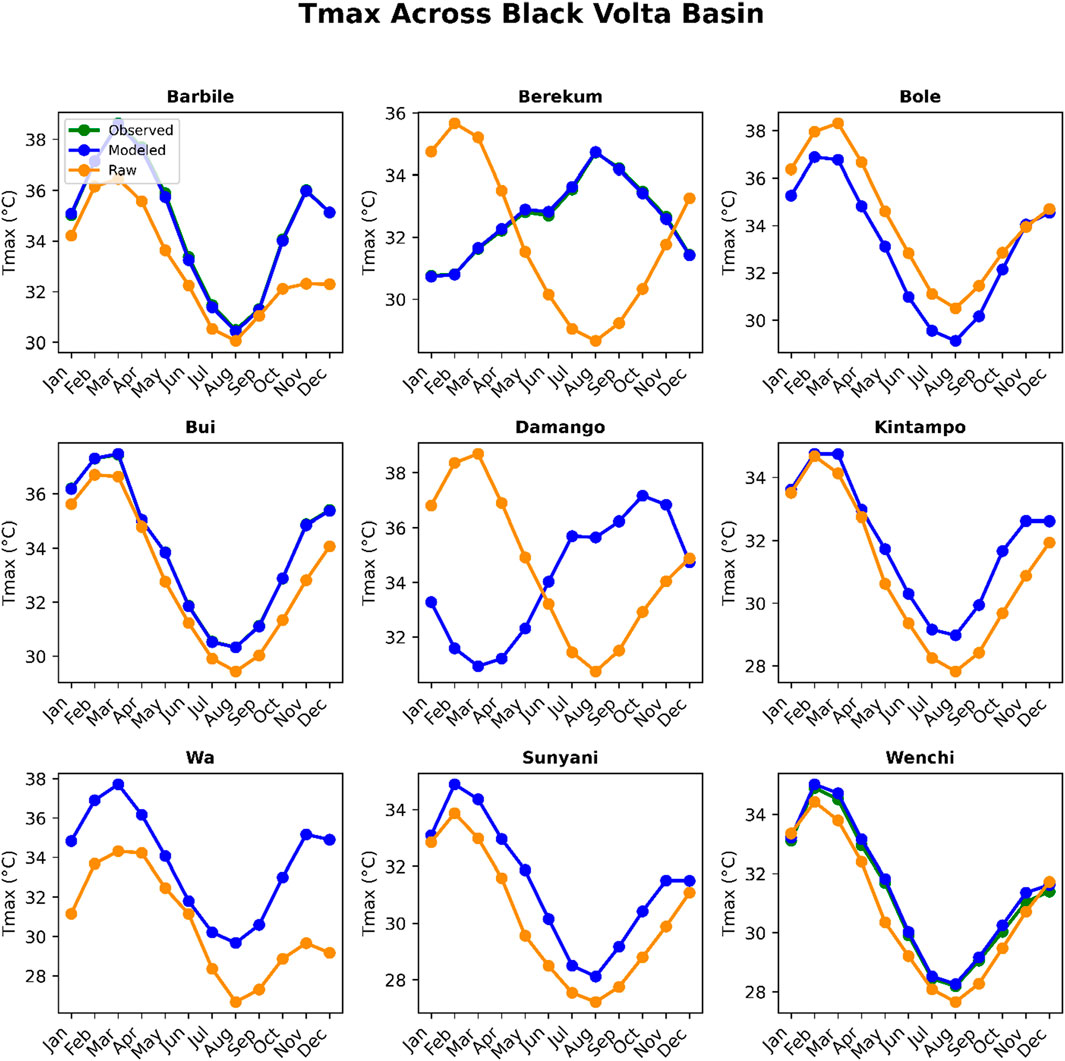
Figure 4. Comparison of ensemble bias-corrected and raw Tmax in the baseline period. Obs = Observed, mod = modeled.
3.2.3 Comparison of ensemble bias-corrected and raw Tmin
Bias correction effectively reduces systematic Tmin overestimation in raw models across the basin. The corrected data accurately captures seasonal patterns, including the January-April warming (peaking at 24 °C–25 °C) and May-August cooling (to 19 °C–22 °C), while raw models overestimate temperatures by 2 °C–5 °C throughout the year. The largest discrepancies occur during mid-year cooling periods, where raw Tmin exceeds observations by up to 6 °C (e.g., 26 °C vs. 20 °C in Bui).
Projections show corrected Tmin trends align with observed late-year warming (October-December), though raw models maintain a persistent 1 °C–2 °C warm bias. These results demonstrate the critical importance of bias correction for accurate minimum temperature simulations in climate impact studies, as shown in Figure 5.
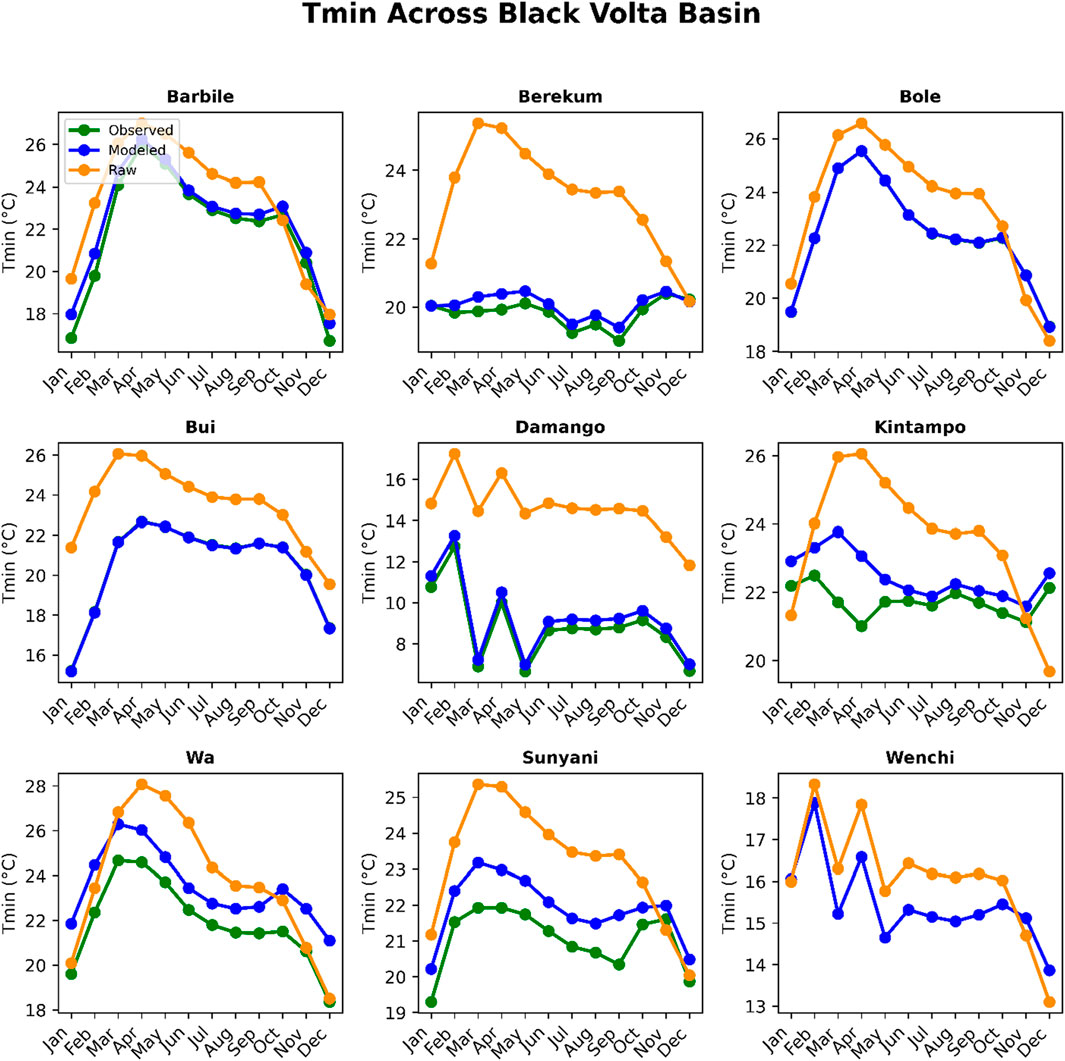
Figure 5. Comparison of ensemble bias-corrected and raw Tmin in the baseline period. Obs = Observed, mod = modeled.
3.3 Projected climate changes by 2050
Figure 6 shows a clear deviation between historical and projected rainfall trends across the Black Volta Basin, with most stations showing an overall decline despite localized increases under certain scenarios. This reduction signals a significant hydrological shift with implications for water availability, agricultural productivity, ecosystem integrity, and socio-economic resilience.
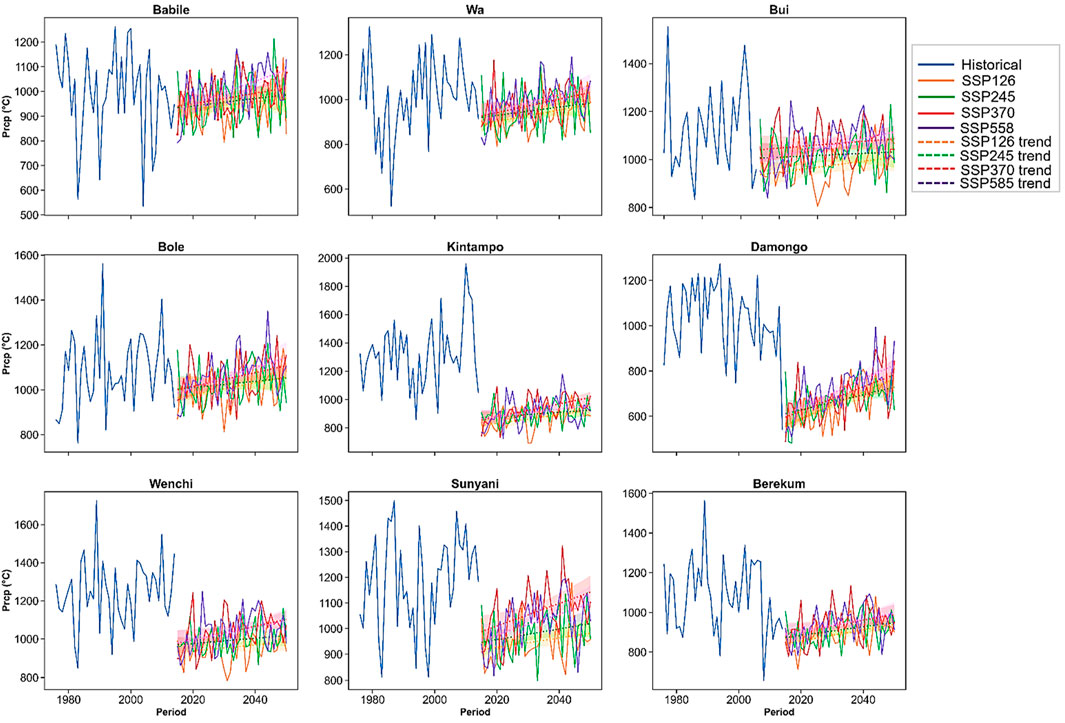
Figure 6. Temporal variations in annual mean precipitation from 1976 to 2050 for SSP1-2.6, SSP2-4.5, SSP3-7.0 and SSP5-8.5. Shaded areas on the trendlines represents 95% confidence interval.
Wenchi, historically receiving 850–1700 mm of annual rainfall, is projected to decline to 750–1200 mm, while Wa is expected to drop from 900–1600 mm to 800–1100 mm annually. Bole follows a similar trend, falling from 800–1500 mm historically to 700–1000 mm under future projections. Bui, a critical hydropower station, may see rainfall decrease from 1000–1800 mm to 900–1300 mm, potentially affecting reservoir recharge. Further south, Berekum and Sunyani are projected to experience reductions from 950–1650 mm and 900–1600 mm to 850–1200 mm and 800–1150 mm, respectively. Northern stations show more severe deficits; Damongo may decline from 850–1500 mm to 750–1100 mm, while Kintampo is projected to drop from 950–1700 mm to 850–1250 mm. Babile presents the steepest decline, with projected values of 800–900 mm under SSP5-8.5, compared to its historical 1000–1400 mm range.
Figure 7 further indicates significant seasonal variations, with dry-season months (January–March) experiencing the most severe precipitation deficits. Under SSP1-2.6, Babile records −85% in February and -85.5% in March, while Wa shows −69.8% in March. Under SSP2-4.5, Wenchi experiences −93.6% in March, and Damongo records −93.1% in May. Wet-season gains are observed in some cases, such as a +48.8% spike at Bui in September under SSP2-4.5. Under SSP3-7.0 and SSP5-8.5, rainfall variability intensifies, with extreme reductions (≤ −97.1%) and surpluses (≥ +83.1%) occurring within the same year. Figure 8 shows the spatial distribution of precipitation changes, highlighting that while most stations face substantial declines, Wenchi retains minor wet-season surpluses under certain scenarios.
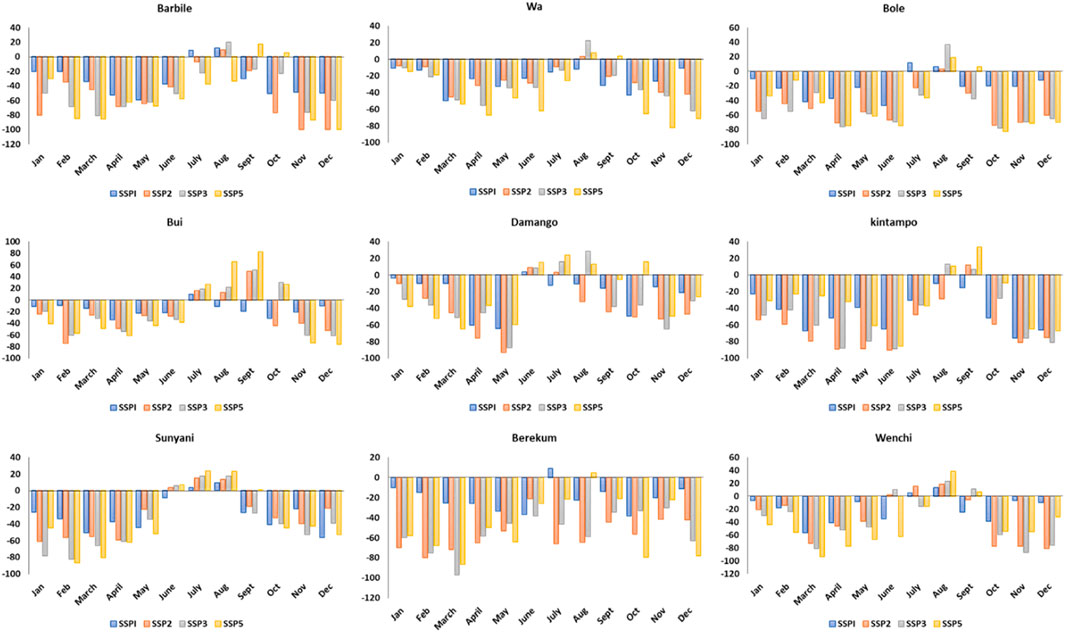
Figure 7. Mean monthly changes in precipitation (%) between 2015–2050 (relative 1976–2015 for ground stations) under SSP1-2.6, SSP2-4.5, SSP3-7.0 and SSP5-8.5.
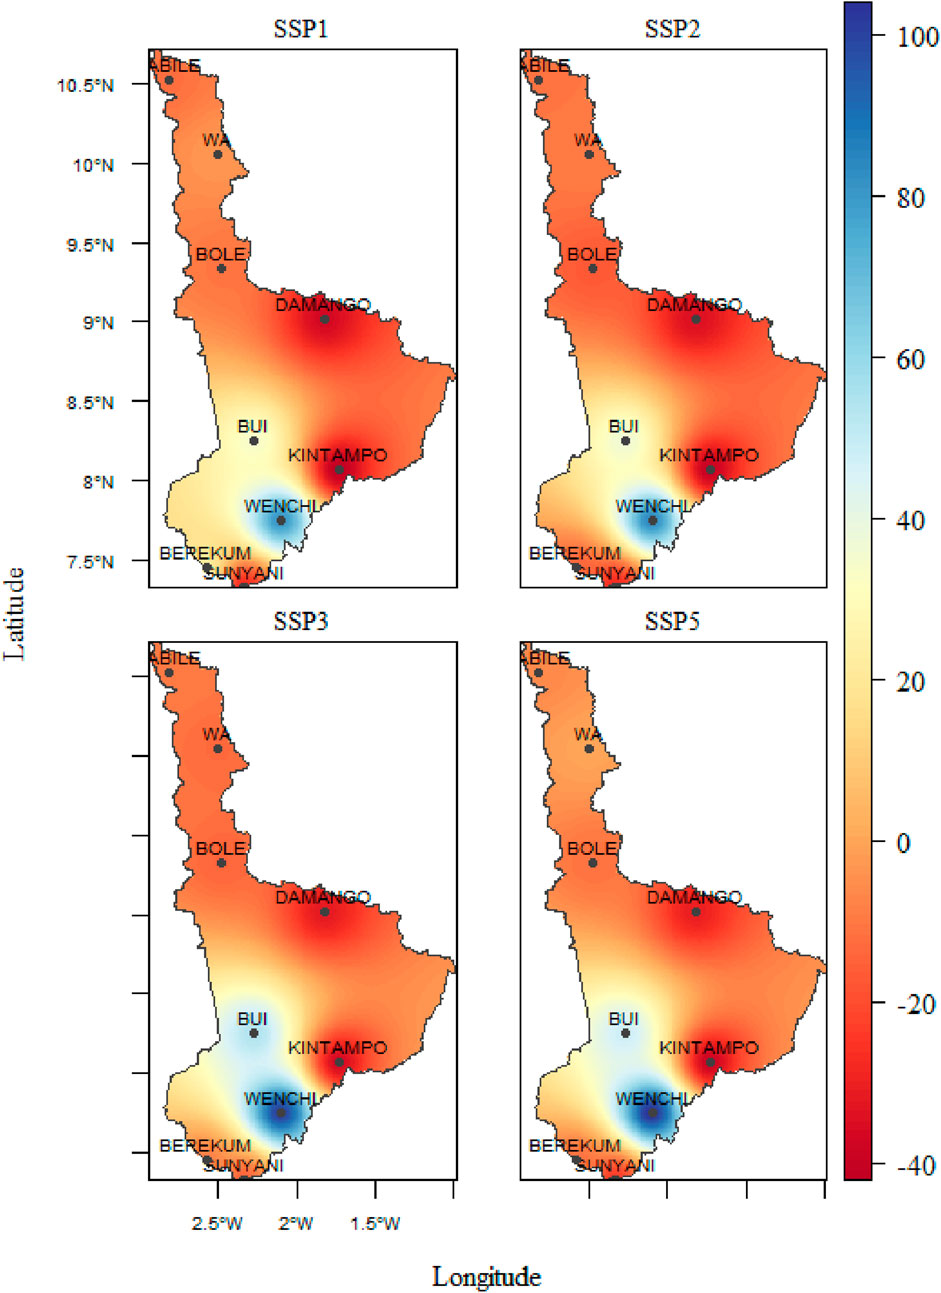
Figure 8. Spatial distribution of annual mean precipitation anomalies (%) relative to the historical baseline. Negative values represent declines in rainfall compared with the baseline, while positive values indicate increases.
Projected maximum temperature (Tmax) trends (Figure 9) show a basin-wide warming signal under all SSP scenarios, with increases ranging between +1.2 °C and +1.8 °C relative to historical baselines. Wenchi’s Tmax is projected to rise from 30.5–34.2 °C to 31.8–35.6 °C, while Berekum and Sunyani are expected to reach 36.0 °C and 35.5 °C, respectively. Northern stations such as Damongo and Kintampo are projected to experience Tmax increases to 37.8 °C and 36.8 °C, respectively while Wa increases from 32.1–36.8 °C to 33.5–38.2 °C. Bole follows a similar trend, rising from 31.8–35.5 °C to 33.2–37.1 °C. Bui’s Tmax is projected to increase from 31.2–34.9 °C to 32.6–36.5 °C. The highest Tmax values are projected at Babile, with an increase from 33.2–37.0 °C to 34.6–38.5 °C under SSP5-8.5.
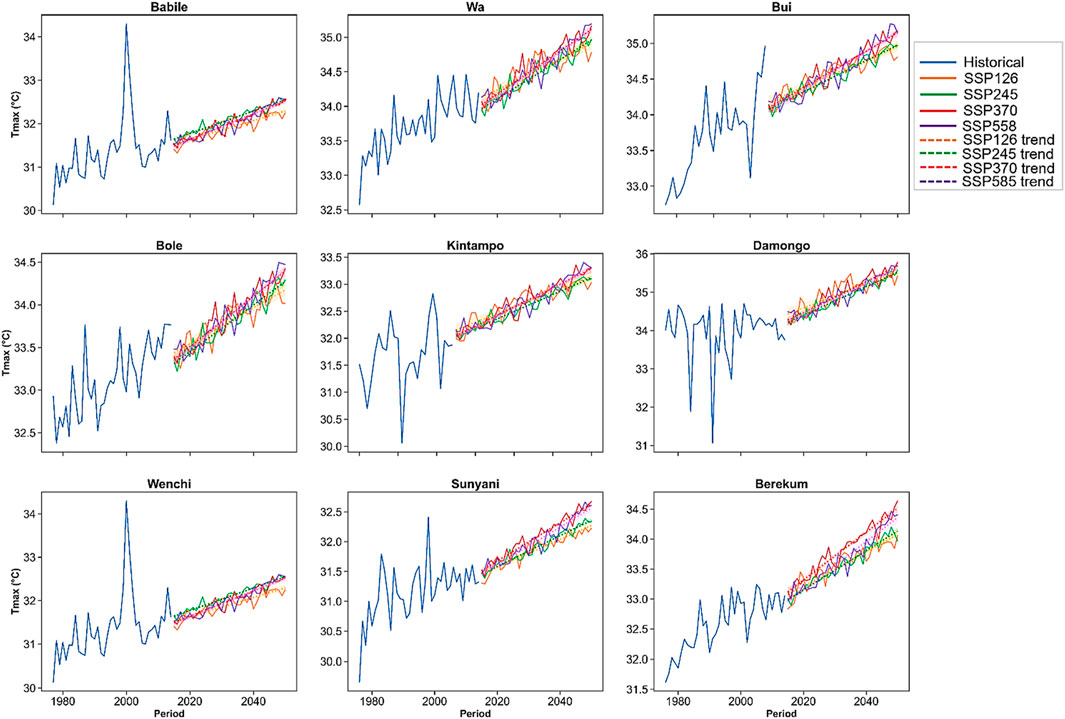
Figure 9. Temporal variations in annual mean Tmax from 1976 to 2050 for SSP1-2.6, SSP2-4.5, SSP3-7.0 and SSP5-8.5. Shaded areas on the trendlines represents 95% confidence interval.
Minimum temperature (Tmin) projections (Figure 10) reveal a parallel warming trajectory, with nocturnal heat intensification emerging as a critical challenge. At Babile, Tmin increases from 20–24 °C to 22–25 °C, marking a 2–3 °C rise. Wa and Bole follow similar patterns, reaching 24–25 °C, while Bui and Kintampo show comparable increases. Damongo, Wenchi, Sunyani, and Berekum all indicate warming of 2–3 °C, consistent with broader basin-wide patterns.
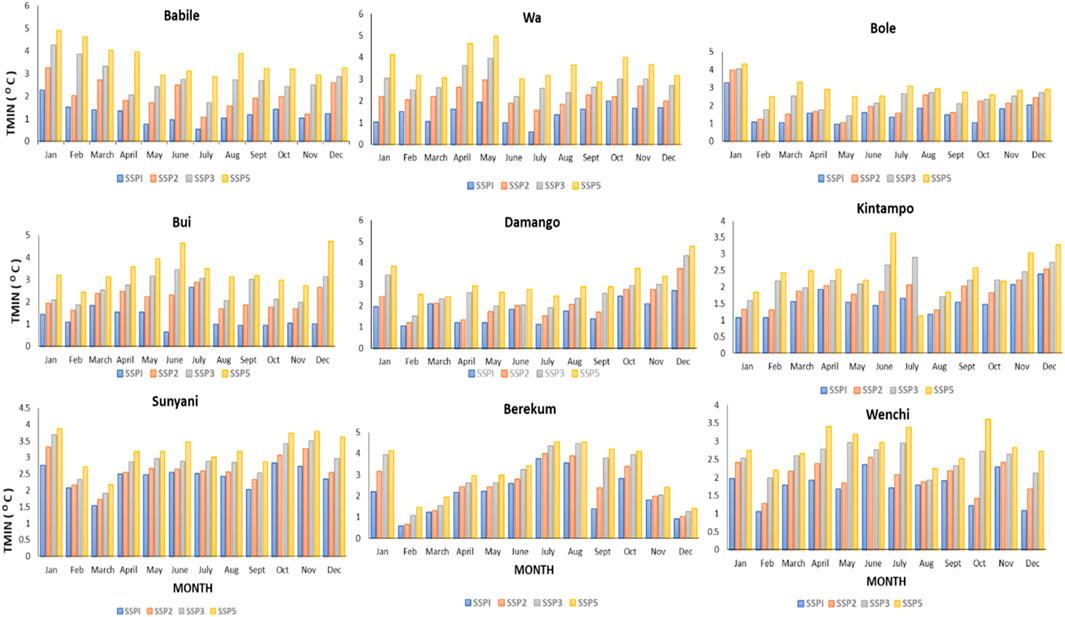
Figure 10. Temporal variations in annual mean Tmin from 1976 to 2050 for SSP1-2.6, SSP2-4.5, SSP3-7.0 and SSP5-8.5. Shaded areas on the trendlines represents 95% confidence interval.
Long-term precipitation patterns across the Black Volta Basin exhibit pronounced spatial and seasonal heterogeneity, with northern and transitional stations experiencing the most severe reductions. Most locations demonstrate consistent long-term declines despite localized increases under specific scenarios (Figure 6). These stations show intensified temporal variability characterized by steeper declining trends and diminished interannual consistency relative to historical baselines. Enhanced year-to-year variability at stations such as Wenchi and Wa presents considerable challenges for hydrological forecasting and agricultural planning, while northern locations display compressed precipitation distributions with reduced upper quantiles but maintained lower bounds.
Changes in interannual variability between historical and future climates extend beyond simple mean shifts, creating significant implications for water resource management and agricultural decision-making. Hydropower-dependent stations, particularly Bui, exhibit deteriorating temporal coherence in precipitation patterns, with projected sequences showing weakened persistence and increased frequency of sub-median conditions that threaten operational reliability for reservoir management and electricity generation.
Intra-seasonal variability compounds these challenges substantially. For instance, the late dry season (February–May) experiences the most severe deficits, with reductions ranging from −60% to −97% (Table 3). Critical reductions include Berekum (−97.1% in March under SSP3-7.0), Damongo (−95% in May under SSP3-7.0), and Babile (−95% in February under SSP3-7.0), indicating delayed planting windows and potential crop establishment failure. Conversely, localized wet-season surpluses emerge, most notably at Bui (+48.8% in September under SSP2-4.5, reaching +83.1% under SSP5-8.5). While these surpluses may support hydropower generation and soil moisture replenishment, they simultaneously increase risks of flooding, soil erosion, and water management complications.
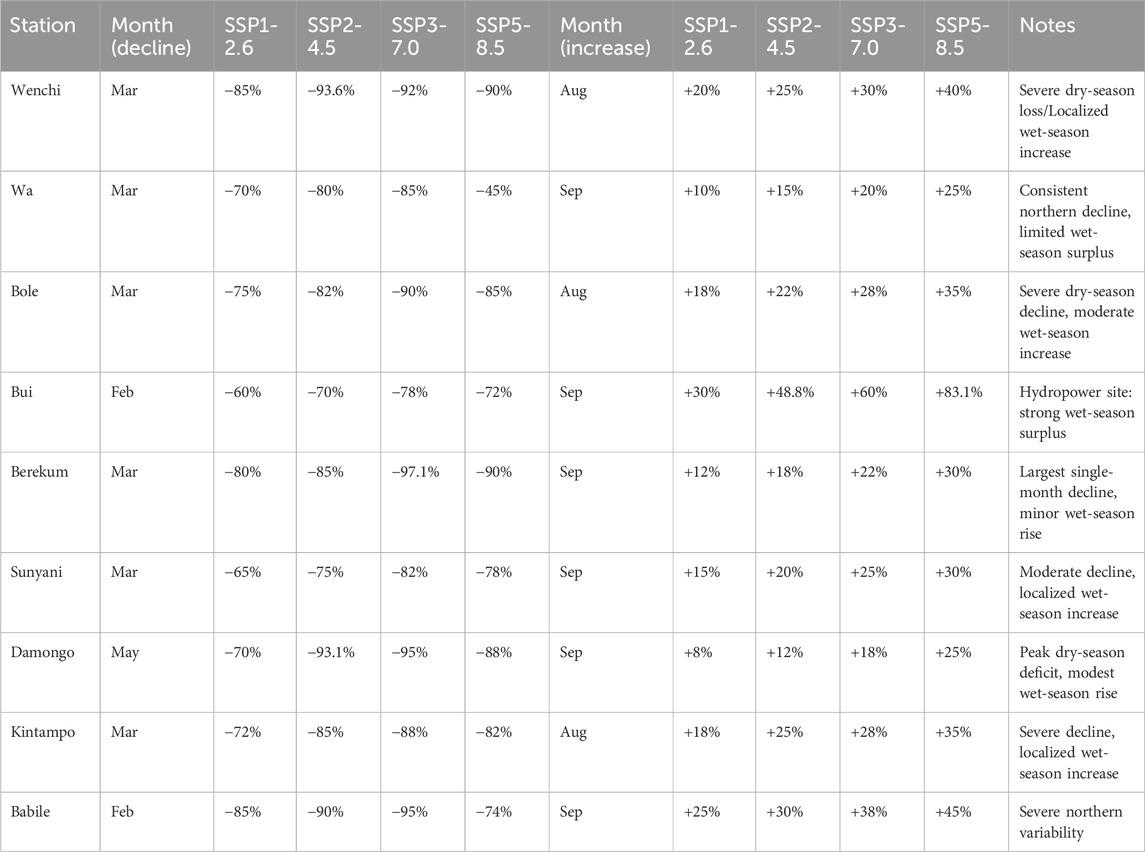
Table 3. Monthly precipitation extremes (% change vs. historical).
Examination across SSPs reveals that dry-season declines occur under all emission scenarios, though severity varies considerably by pathway (Table 3). Reductions remain relatively moderate under SSP1-2.6 but intensify substantially under SSP3-7.0 and SSP5-8.5, particularly affecting northern stations such as Wa, which experiences consistent year-round reductions including −45% in March and −39.4% in November under SSP5-8.5. Wet-season increases remain spatially restricted to specific stations like Bui and Wenchi, while precipitation variability expands dramatically under SSP5-8.5 (ranging from −74% in February to +83.1% in September), creating amplified risks for both drought and flooding events.
Temperature projections demonstrate consistent basin-wide warming patterns with distinct spatial and seasonal characteristics that pose serious challenges for human settlements, agricultural systems, and energy infrastructure. Maximum temperature increases range from +1.2 °C to +1.8 °C relative to historical baselines (Table 4), with northern stations experiencing the most pronounced warming gradients. Peak warming occurs at Babile, which shows the highest absolute temperature increases across all emission scenarios.
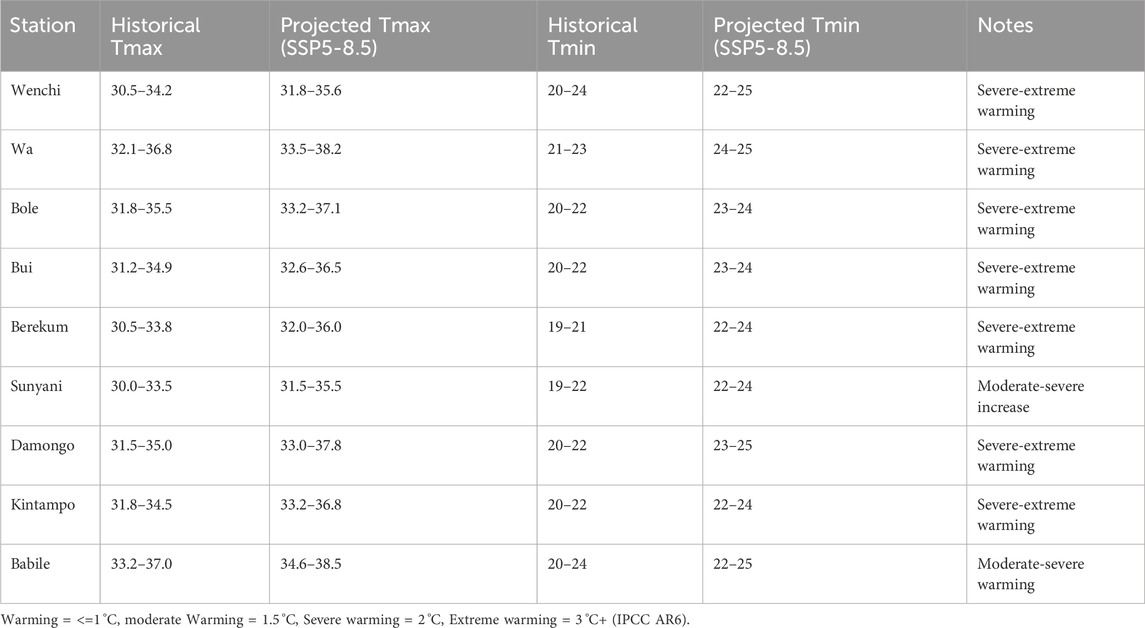
Table 4. Annual average temperature projections (°C) across stations.
Daytime warming intensifies progressively with higher emission scenarios, creating concerning conditions for human health and agricultural productivity. Under SSP1-2.6, maximum temperature increases range from +0.16 °C to +4.40 °C, while SSP5-8.5 produces extreme increases, with temperatures rising by +7.20 °C at Kintampo in January and +5.00 °C at Wenchi in August (Figure 11). Northern and hydropower-dependent areas such as Bui and Sunyani consistently exceed +2.78 °C during critical months, raising substantial concerns for energy security and water resource management.
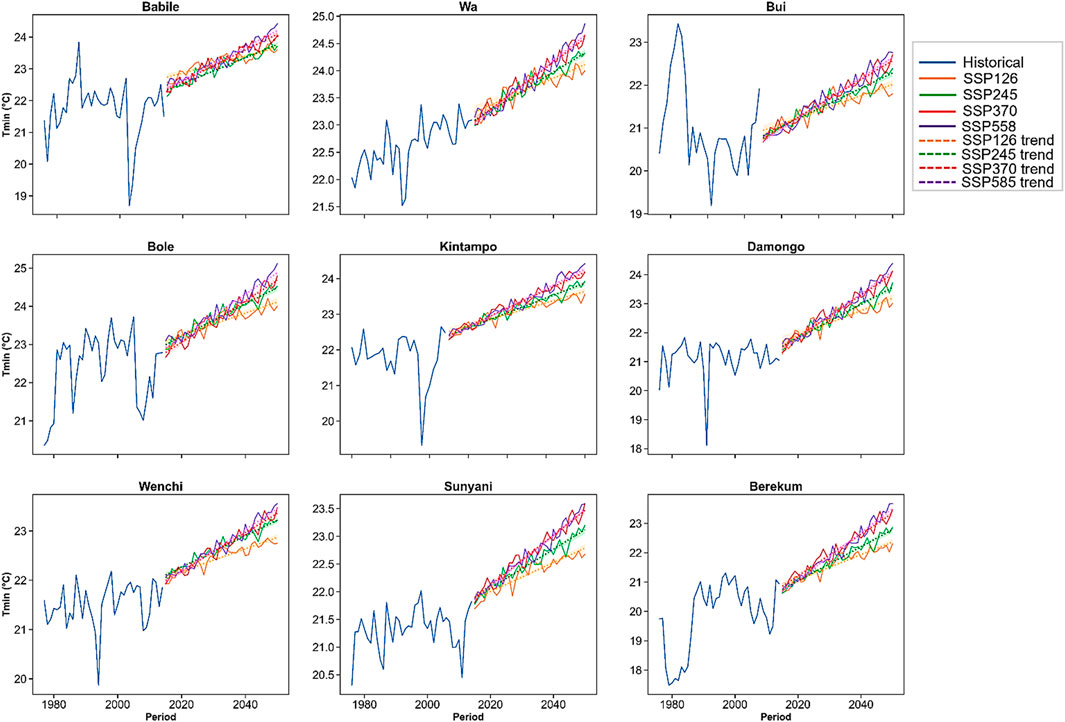
Figure 11. Mean monthly changes in Tmax between 2015–2050 (relative 1976–2015 for ground stations) under SSP1-2.6, SSP2-4.5, SSP3-7.0 and SSP5-8.5.
Minimum temperature changes follow similar warming patterns, with nighttime increases evident across all scenarios but varying substantially by emission pathway. Under SSP1-2.6, projected changes range from +0.55 °C to +3.75 °C, while SSP5-8.5 demonstrates the most extreme increases, with nighttime warming between 1.5 and 2.2 times greater than SSP1-2.6, peaking at +4.95 °C at Wa in May and +4.77 °C at Damongo in December (Figure 12). This reduction in nocturnal cooling periods represents a particularly concerning threat to crop productivity and ecosystem health, as it eliminates the critical recovery period that vegetation requires following daytime heat stress.
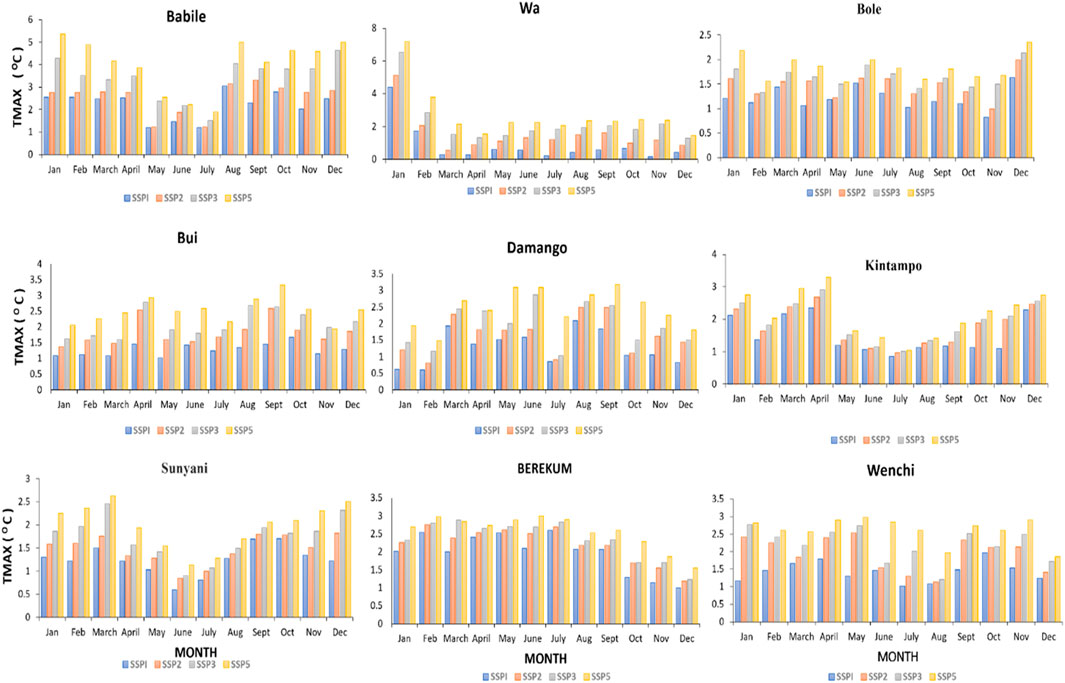
Figure 12. Mean monthly changes in Tmin between 2015–2050 (relative 1976–2015 for ground stations) under SSP1-2.6, SSP2-4.5, SSP3-7.0 and SSP5-8.5.
Spatial distribution patterns remain consistent across temperature variables: Babile and Bui experience the most intense warming for both maximum and minimum temperatures, while Wenchi demonstrates pronounced nocturnal warming potentially associated with anthropogenic factors including quarrying activities and aerosol emissions (Figures 13, 14). These temperature changes, when combined with precipitation variability, create compound environmental stresses that threaten agricultural productivity, energy infrastructure reliability, and ecosystem stability throughout the basin.
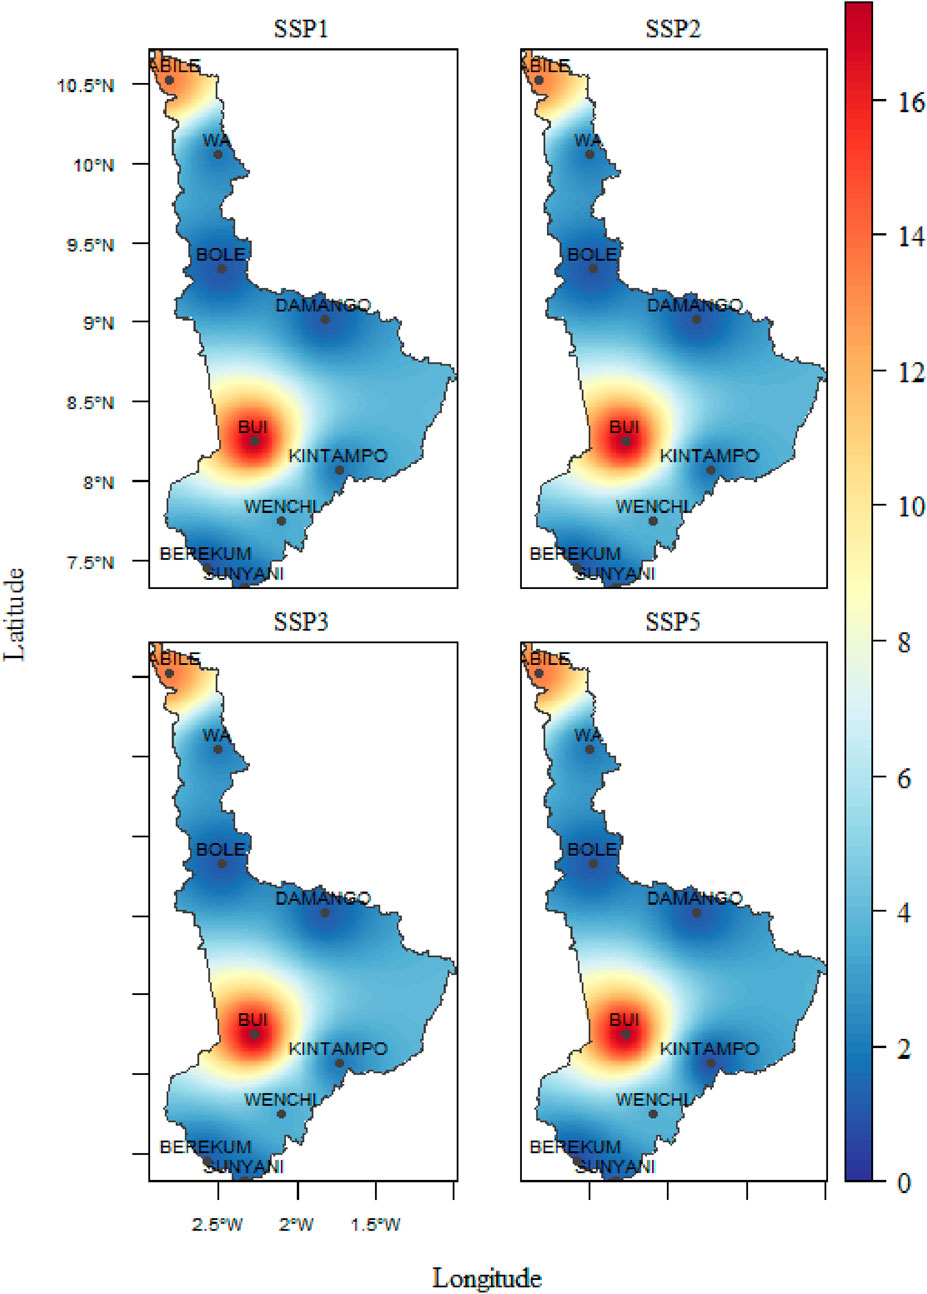
Figure 13. Spatial distribution of annual mean Tmax (°C) 2015–2050 (relative 1976–2015 for ground stations) under SSP1-2.6, SSP2-4.5, SSP3-7.0 and SSP5-8.5 in the Black Volta basin under SSP scenarios.
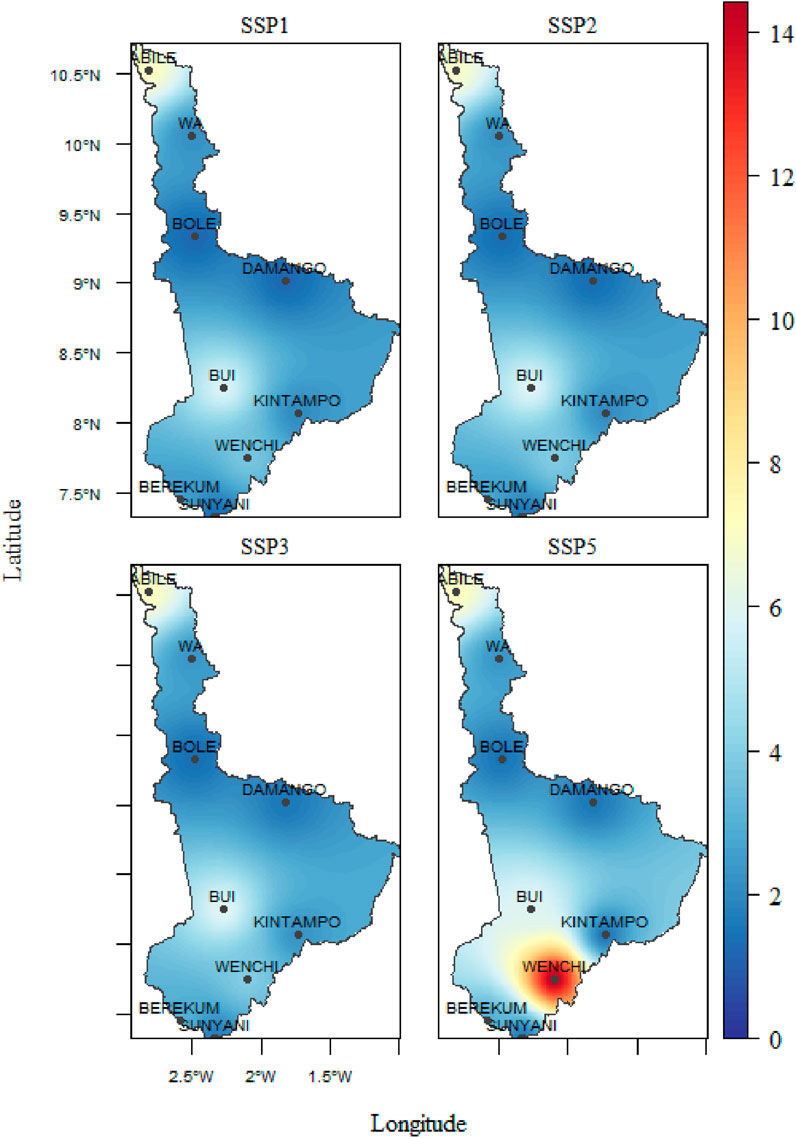
Figure 14. Spatial distribution of annual mean Tmin (°C) 2015–2050 (relative 1976–2015 for ground stations) under SSP1-2.6, SSP2-4.5, SSP3-7.0 and SSP5-8.5 in the Black Volta basin under SSP scenarios.
Table 5 presents the summary of the projected climate changes by 2050. Across all SSP scenarios, the Black Volta Basin is projected to experience substantially drier dry seasons, more intense wet seasons in specific locations, and a consistent rise in both maximum and minimum temperatures by 2050.
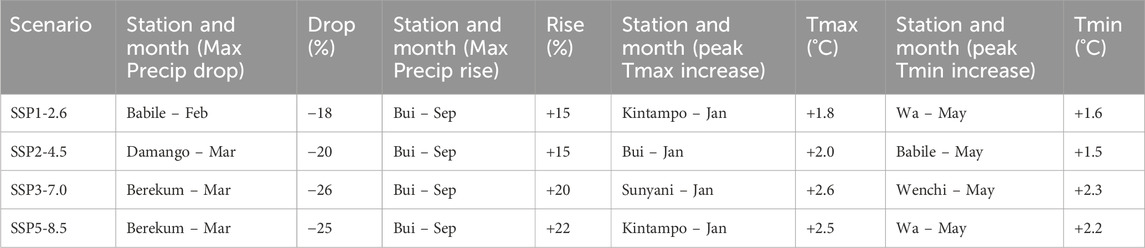
Table 5. Summary of projected climate changes by 2050.
4 Discussion
4.1 Model performance evaluation
The evaluation of climate model performance in the Black Volta Basin reveals important insights about both model capabilities and limitations that carry significant implications for agricultural adaptation planning. Our analysis demonstrates that while bias correction techniques have substantially improved temperature and precipitation simulations, persistent challenges remain in accurately capturing minimum nighttime temperatures (Tmin) and extreme rainfall events - two climate factors that critically influence crop productivity and farm management decisions (Siabi et al., 2021; Baffour-Ata et al., 2021). The particular difficulty in modeling Tmin stems from the complex interplay of local-scale processes including topography-induced air drainage, land surface heterogeneity, and boundary layer dynamics that operate at spatial scales finer than current global climate models can resolve (Gebrechorkos et al., 2019). This explains the model’s alternating pattern of over- and underestimation observed at stations like Babile and Wenchi, where valley cooling effects and urban heat islands respectively create microclimates that challenge coarse-resolution representations (Funk et al., 2022).
For precipitation, while statistical corrections have successfully improved seasonal total estimates, the models continue to struggle with simulating the intensity distribution of rainfall events - consistently underestimating peak rainfall amounts while overestimating lighter events (Yeboah et al., 2022). This limitation has direct consequences for agricultural water management and erosion control planning, particularly in the basin’s northern areas where soils are most vulnerable to heavy rain impacts (Ayiiwe Joachim, 2013). The transitional zones around Wenchi present particularly complex modeling challenges due to their position between distinct ecological regions, resulting in convective rainfall patterns that global models frequently misrepresent (Sultan et al., 2023).
From an agricultural adaptation perspective, these modeling limitations necessitate differentiated approaches across the basin’s agroecological zones. In the northern sectors, where uncertainties in projected Tmin are most pronounced and precipitation is not only relatively well constrained but also characterized by persistently low baseline levels, the adoption of drought-tolerant cereal cultivars, coupled with enhanced in-situ water-harvesting and soil-moisture retention practices that have proven effective in similar semi-arid regions, would be critical for sustaining agro-climatic resilience under evolving SSP-driven climate regimes (World Bank, 2021; Ouédraogo et al., 2021). The transitional mid-basin zones require more flexible systems that can buffer against greater climate uncertainty; agroforestry configurations integrating shade-tolerant cash crops with native tree species offer particular promise here, as demonstrated by successful implementations in comparable West African ecotones (FAO, 2022). Southern areas with stronger model performance can support more targeted interventions including climate-informed planting calendars and precision irrigation scheduling, building on documented successes in Ghana’s more humid agricultural zones (UNDP, 2020).
Moving forward, three strategic priorities emerge for enhancing the practical utility of climate modeling for agricultural adaptation. First, targeted expansion of automated weather stations in data-sparse northern regions would significantly improve observational datasets for model calibration and validation (Gebrechorkos et al., 2019). Bias correction techniques have considerably enhanced the reliability of mean temperature and precipitation simulations. However, their effectiveness is less pronounced for extremes and variability, where residual uncertainties remain. This distinction underscores that the primary gains from bias correction lie in improving averages, while the accurate representation of extreme events continues to present challenges. Third, establishing structured knowledge-exchange mechanisms between climate scientists and agricultural stakeholders would ensure model development addresses practical farming needs while building local capacity to interpret and apply climate information effectively (World Bank, 2021; Fitton et al., 2019). Together, these improvements would help transform climate model outputs into actionable intelligence for building resilient farming systems across the Black Volta Basin’s diverse agricultural landscapes.
4.2 Projected changes in precipitation across the black volta basin under the shared socioeconomic pathways (SSP) scenarios
The climate projections for the Black Volta Basin paint a concerning picture that demands urgent attention from researchers, policymakers, and agricultural stakeholders alike. The basin’s complex climate system, spanning multiple ecological zones, faces fundamental transformations that will reshape its agricultural potential and water resource availability in coming decades. Precipitation patterns are projected to shift dramatically under all SSP scenarios, with particularly severe changes anticipated under the high-emission SSP3-7.0 and SSP5-8.5 pathways. The northern stations, already marginal for rainfed agriculture, will experience the most pronounced reductions in annual rainfall totals. Historical averages around 1,200 mm at critical agricultural stations like Damongo and Kintampo may decline to approximately 600 mm by 2050, representing a halving of precious water resources (Vera et al., 2006). This aridification trend aligns with broader West African drying patterns identified in recent IPCC assessments. However, these overall reductions will be punctuated by more intense rainfall events, creating a dangerous combination of water scarcity and flood risk that threatens both crops and infrastructure (Siabi et al., 2024).
Temperature projections compound these hydrological challenges. Maximum daytime temperatures may rise by about 4.5 °C with mean values rising from 33.2 °C to 37.0 °C historically to 34.6 °C–38.5 °C under SSP5-8.5 in northern stations like Wa and Babile under high-emission scenarios, pushing many current crop varieties beyond their thermal tolerance limits (Akpoti et al., 2019). The physiological stress on plants will be exacerbated by parallel increases in minimum nighttime temperatures, projected to rise 2 °C–3 °C elevating mean values from 20 °C–24 °C to 22 °C–25 °C under the SSP scenarios. This loss of nocturnal cooling represents a particularly insidious threat to crop productivity and ecosystem health, as it eliminates the critical recovery period that plants require after daytime heat stress (Niang et al., 2014). Recent field studies have demonstrated how these elevated nighttime temperatures can reduce photosynthetic efficiency by up to 20% in staple crops like maize and millet (IPCC, 2021).
The agricultural implications of these combined changes are profound. Farmers throughout the basin will need to adapt to fundamentally new growing conditions characterized by hotter days, warmer nights, less reliable rains, and more extreme weather events. The northern regions face particularly severe challenges, where the combination of reduced rainfall and higher temperatures may render current agricultural systems nonviable without major adaptation investments. The disproportionate role of maximum temperatures in elevating CWR aligns with Islam et al. (2024), who attributed 65% of irrigation demand increases to warming not precipitation shifts in Bangladesh. Southern areas, while somewhat buffered by relatively higher rainfall, will still confront significant productivity losses from heat stress and changing precipitation patterns (Kouman et al., 2024).
Effective adaptation will require integrated strategies that address both climatic and socioeconomic dimensions. The development and deployment of heat- and drought-tolerant crop varieties must be prioritized, particularly for the staple crops that form the foundation of local food security (World Bank, 2021). Water management systems, from small-scale irrigation to community rainwater harvesting, will be essential to buffer against rainfall variability and ensure reliable water supplies during critical growth periods (FAO, 2022). Perhaps most importantly, strengthening climate information services and agricultural extension systems can help farmers interpret changing conditions and implement appropriate adaptive responses (CGIAR, 2023).
These adaptation efforts must be carefully tailored to the basin’s distinct agroecological zones. Northern areas require particular focus on drought resilience strategies and alternative livelihood options, while southern regions may prioritize climate-smart intensification approaches. The transitional middle basin presents perhaps the greatest challenge, requiring flexible, diversified production systems that can withstand greater climate uncertainty (UNDP, 2020).
The scientific evidence leaves no doubt about the scale of the challenge facing the Black Volta Basin. Without immediate and concerted action to both reduce emissions and strengthen climate resilience, the region risks crossing ecological thresholds that could undermine food security and water availability for generations. The projected changes demand nothing less than a fundamental transformation of agricultural systems, supported by strong policies, substantial investments, and innovative partnerships between researchers, policymakers, and farming communities. The window for proactive adaptation is closing rapidly, making this one of the most urgent challenges facing the region’s sustainable development.
4.3 Implications of the study
Global temperature projections indicate an increase of 0.3 °C–4.8 °C by the conclusion of the twenty-first century, with regional variations contingent upon local climatic conditions and emission scenarios. Ghana, positioned within the West African region, confronts multidimensional climate vulnerabilities that significantly impact agricultural systems, water resources, energy infrastructure, and public health (Duku and Hein, 2021). The heightened susceptibility of sub-Saharan Africa to alterations in temperature and precipitation patterns is particularly evident in the Black Volta Basin, where Shared Socioeconomic Pathway (SSP) projections indicate temperature increases of 3.0 °C–5.0 °C by 2050 relative to the 1976–2014 baseline period.
The hydrological regime of the Black Volta Basin faces substantial modification, with precipitation projections under SSP3-7.0 and SSP5-8.5 scenarios indicating significant declines during critical agricultural months of April and May. Monitoring stations including Babile, Wa, and Damongo are projected to experience precipitation deficits exceeding 100% during essential growth periods, potentially reducing agricultural water availability by 30%–40% (Kankam-Yeboah et al., 2022). Such deficits are most acute during the DJF and MAM seasons, which correspond to early planting windows across much of the basin. Seasonal Tmax and Tmin increases during this time frame exacerbate crop stress and shorten the effective growing period. These findings, derived from statistically significant trend analyses, point to the need for seasonal forecasting services and adaptive crop calendars. This hydrological stress compounds existing water security challenges, particularly in rural communities where access to improved water sources remains limited.
Projected rainfall declines and extreme dry-season deficits threaten the reliability of inflows to reservoirs such as at Bui, which already shows February rainfall reductions of −60% to −78%. Although wet-season surpluses (+83% in September at Bui) could temporarily boost inflows, such variability increases the likelihood of intra-annual water imbalance, complicating dam operations, energy generation scheduling, and flood control (Kabo-Bah et al., 2016; Akpoti et al., 2016; Diawuo et al., 2020).
Precipitation declines of 300–500 mm annually in Wa, Bole, Wenchi, and Babile (Table 6), combined with dry-season losses exceeding −90% in March-May (Table 3), indicate delayed planting and high risks of crop establishment failure. These deficits, paired with rising Tmax of 36 °C–38 °C and Tmin increases of 2 °C–4 °C (Table 4), will accelerate evapotranspiration, shorten growing periods, and increase crop water demand. Localized wet-season rainfall surpluses may provide temporary water benefits but also heighten risks of flood damage, erosion, and post-harvest losses.
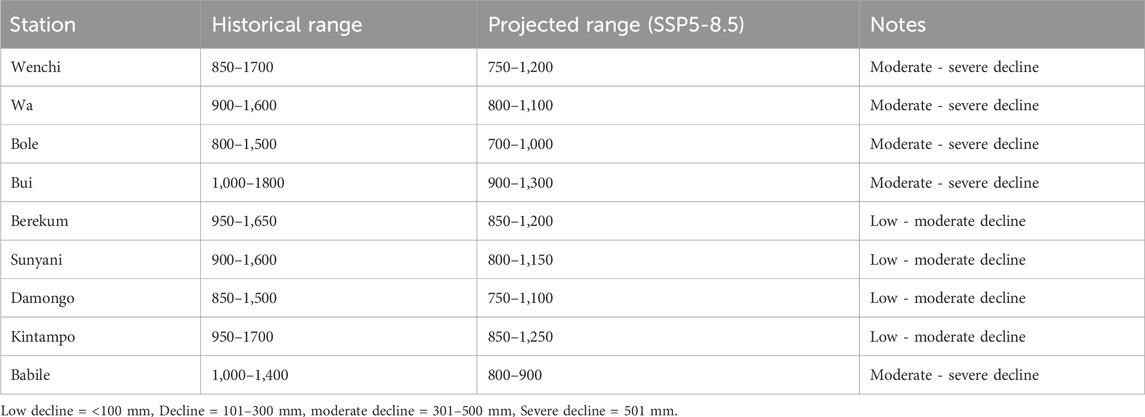
Table 6. Annual mean precipitation (mm).
For implications on water resources and ecosystems, reduced annual rainfall (Table 6) and prolonged dry seasons (Table 3) will diminish groundwater recharge and river baseflows, leading to seasonal water scarcity. At the same time, intense wet-season rainfall surpluses could cause flash floods, soil erosion, and siltation of rivers and reservoirs. Ecosystems dependent on transitional rainfall regimes face disruption in biodiversity, grazing resources, and forest regeneration.
Public health systems confront emerging challenges, including expansion of malaria transmission zones into high-elevation areas such as Bui, potentially exposing over 400,000 additional residents to vector-borne diseases (Lecouffe, 2022). Transition to severe to extreme warming across most stations implies greater risks of heatwaves and nighttime warming, which reduce human recovery periods. Urban centers including Sunyani and Kintampo face amplified health risks due to the urban heat island effect, with projected increases in heat-related morbidity particularly affecting pediatric and geriatric populations. Rising night temperatures (Tmin + 2 °C–4 °C) particularly affect vulnerable groups such as children, the elderly, and outdoor workers. Concurrently, energy demand dynamics demonstrate increased cooling requirements, with cooling degree days projected to increase by 35%–50%, stimulating electricity demand growth of 25% during seasonal hydropower generation minima.
Renewable energy diversification faces technical constraints, as solar photovoltaic efficiency declines by 0.4%–0.5% per degree Celsius above 25 °C (Al-Badi et al., 2012). This thermodynamic limitation necessitates complementary investments in energy storage systems and photovoltaic cooling technologies, particularly at stations including Babile and Bui where maximum temperatures are projected to increase by more than 2 °C.
Despite overall precipitation reductions, extreme rainfall events exceeding 1,200 mm under SSP3-7.0 to SSP5-8.5 scenarios present flood risks in rapidly urbanizing areas including Wenchi and Sunyani. These episodic events may compromise drainage infrastructure and increase sediment loading in reservoirs by 30%–50%, further constraining water storage capacity (Duku and Hein, 2021).
Adaptation strategies require integrated approaches: climate-resilient agricultural practices incorporating drought-tolerant cultivars and precision irrigation could reduce groundwater demand by 25%, while strategic enhancements to early warning systems may reduce climate-attributable mortality by 55%. The persistent challenge of nitrogen use efficiency, currently at 55.47% globally (Kabato et al., 2025), underscores the necessity for optimized nutrient management strategies in basin agriculture.
5 Conclusion
The study used the CMhyd model and statistical bias correction to analyze the effects of climate change in the Black Volta Basin under several shared socioeconomic pathways (SSP) scenarios. Using 15 Global Climate Models (GCMs) and a 38-year dataset of precipitation, maximum temperature (Tmax), and lowest temperature (Tmin), climate changes under the SSP scenarios were projected. According to validation results, raw GCM data was substantially outperformed by ensemble bias-corrected climatic data. The raw GCM precipitation recorded substantially lower values, ranging from 0.001 to 0.88, but the bias-corrected precipitation R2 varied from 0.87 to 0.99. Precipitation performed worse than ensemble bias-corrected Tmax and Tmin in most cases. The SSP scenarios’ predictions for the future show a trend of rising Tmax and Tmin combined with noticeably lower precipitation.
For instance, Tmax is projected to increase between 1.4 °C–3.4 °C by 2050. Again, Tmin is projected to increase between 1.1 °C–3.1 °C, and up to 5.5 °C in northern areas.
It is anticipated that these modifications will lower agricultural productivity, decrease the amount of water available, and raise the risk of heat-related illnesses. Inaction might lead to increased food insecurity, more frequent droughts, and sporadic flooding in important locations including Wa, Bui, Damongo, Sunyani, and Kintampo. The expected changes in climate would also put stress on Ghana’s energy infrastructure. Government agencies and energy suppliers must give renewable energy sources like solar and thermal plants top priority to solve this. Planning for the future of the energy sector must carefully take into account how variations in temperature and precipitation will impact the capacity to generate electricity. The report also supports adopting the “Go Green” approach, which emphasizes localizing climate resilience initiatives and acknowledging the interconnectedness of human and environmental systems.
The study’s findings underscore the pressing need for evidence-based policymaking that incorporates adaptation and mitigation strategies across all sectors. Ghana can improve its climate resilience, protect livelihoods in the Black Volta Basin, and help achieve Sustainable Development Goal 13 and its nationally determined contributions (NDCs) by addressing the vulnerabilities found in the study. The inclusion of seasonally disaggregated analyses and the identification of statistically significant trends allow for a more granular understanding of climate risks. By linking these trends to underlying physical processes such as land surface changes and atmospheric circulation shifts this study provides a robust foundation for designing climate-smart interventions that are sensitive to both time of year and local environmental conditions.
6 Recommendations
Given the climate change issues facing the Black Volta Basin, governments must prioritize coordinated adaptation strategies across key sectors. To protect water supplies for domestic and agricultural use, stations like Wa, Babile, and Damongo must increase the efficiency of irrigation and expand their rainwater collection systems. Decreased rainfall and rising temperatures can be mitigated by investing in eco-friendly water management strategies like drip irrigation and efficient water storage. The falling water levels at the Bui Dam and other significant water bodies are forcing Ghana to diversify its energy sources as hydropower production declines. Given the climate change issues facing the Black Volta Basin, governments must prioritize coordinated adaptation strategies across key sectors. To protect water supplies for domestic and agricultural use, stations like Wa, Babile, and Damongo must increase the efficiency of irrigation and expand their rainwater collection systems. Decreased rainfall and rising temperatures can be mitigated by investing in eco-friendly water management strategies like drip irrigation and efficient water storage. The falling water levels at the Bui Dam and other significant water bodies are forcing Ghana to diversify its energy sources as hydropower production declines. In urbanizing areas like Sunyani, Wenchi, and Kintampo, government spending on drainage systems and stormwater infrastructure is crucial to reducing the risk of flash floods; urban planning regulations should discourage development in flood-prone areas; and solid waste management reforms should prevent drainage blockages. While warming temperatures will help meet the growing demand for energy, research into PV cooling systems will be necessary, particularly in stations like Bui and Babile, given the decrease in solar PV efficiency brought on by rising temperatures. The Black Volta Basin will require climate-smart agriculture, which includes employing drought- and heat-resistant crops and putting in place water-efficient irrigation systems, to guarantee food security. Investments in irrigation infrastructure and access to climate forecasting technologies will be essential to sustaining agricultural productivity in regions like Kintampo and Sunyani, where water shortages are expected to intensify. Investments in irrigation infrastructure and access to climate forecasting technologies will be essential to sustaining agricultural productivity in regions like Kintampo and Sunyani, where water shortages are expected to intensify.
Data availability statement
The original contributions presented in the study are included in the article/supplementary material, further inquiries can be directed to the corresponding author.
Author contributions
AK-B: Writing – original draft, Conceptualization, Writing – review and editing, Supervision. SS: Writing – original draft, Formal Analysis, Visualization, Methodology, Writing – review and editing, Conceptualization, Investigation. ES: Visualization, Formal Analysis, Writing – review and editing, Methodology, Writing – original draft, Conceptualization, Supervision. WA: Writing – review and editing, Writing – original draft, Formal Analysis, Methodology. NC: Methodology, Writing – review and editing, Writing – original draft, Formal Analysis.
Funding
The author(s) declare that no financial support was received for the research and/or publication of this article.
Conflict of interest
The authors declare that the research was conducted in the absence of any commercial or financial relationships that could be construed as a potential conflict of interest.
Generative AI statement
The author(s) declare that no Generative AI was used in the creation of this manuscript.
Any alternative text (alt text) provided alongside figures in this article has been generated by Frontiers with the support of artificial intelligence and reasonable efforts have been made to ensure accuracy, including review by the authors wherever possible. If you identify any issues, please contact us.
Publisher’s note
All claims expressed in this article are solely those of the authors and do not necessarily represent those of their affiliated organizations, or those of the publisher, the editors and the reviewers. Any product that may be evaluated in this article, or claim that may be made by its manufacturer, is not guaranteed or endorsed by the publisher.
References
Abungba, J. A., Adjei, K. A., Gyamfi, C., Odai, S. N., Pingale, S. M., and Khare, D. (2022). Implications of land use/land cover changes and climate change on Black Volta Basin future water resources in Ghana. Sustain. Switz. 14 (19), 12383. doi:10.3390/su141912383
Ahn, J. M., Kim, J., Kim, H., and Kim, K. (2023). Watershed environmental impact assessment for extreme climates based on shared socioeconomic pathway climate change scenarios. Ecol. Indic. 154, 110685. doi:10.1016/j.ecolind.2023.110685
Akpoti, K., Antwi, E. O., and Kabo-bah, A. T. (2016). Impacts of rainfall variability, land use and land cover change on stream flow of the Black Volta basin, West Africa. Hydrology 3 (3), 26–24. doi:10.3390/hydrology3030026
Akpoti, K., Kabo-bah, A. T., and Zwart, S. J. (2019). Agricultural land suitability analysis: State-of-the-art and outlooks for integration of climate change analysis. Agric. Syst. 173, 172–208. doi:10.1016/j.agsy.2019.02.013
Akpoti, K., Groen, T., Dossou-Yovo, E., Kabo-bah, A. T., and Zwart, S. J. (2022). Climate change-induced reduction in agricultural land suitability of West-Africa's inland valley landscapes. Agric. Syst. 200, 103429. doi:10.1016/j.agsy.2022.103429
Al-Badi, A., Yousef, H., Al Mahmoudi, T., Al-Sinani, A., and Al-Shammaki, M. (2012). Performance of solar resources in Oman. Int. Conf. Renew. Energies Dev. Ctries. (REDEC), 1–4. doi:10.1109/REDEC.2012.6416703
Amekudzi, L. K., Yamba, E. I., Preko, K., and Asare, E. O. (2020). Bias correction of CORDEX-Africa simulations for West African climate studies: a comparative analysis. Weather Clim. Extrem. 30, 100290. doi:10.1016/j.wace.2020.100290
Andah, W. E. I., Van De Giesen, N., and Biney, C. A. (2003). Water, climate, food, and environment in the Volta Basin contribution to the project ADAPT adaptation strategies to changing environments.
Andrade, C. L. T., de Castro, M. A. H., and da Silva, R. J. (2021). Evaluation of bias correction methods for climate change projections: a case study in a tropical basin. Int. J. Climat. 41 (S1), E2745–E2762. doi:10.1002/joc.6868
Arnell, N. W., Lowe, J. A., Challinor, A. J., and Osborn, T. J. (2019). Global and regional impacts of climate change at different levels of global temperature increase. Clim. Change 155 (3), 377–391. doi:10.1007/s10584-019-02464-z
Ayiiwe Joachim, A. (2013). Assessing the impacts of agricultural water management on the hydrology of the white volta river basin: the case study of reservoirs and dugouts.
Awotwi, A., Anornu, G. K., Quaye-Ballard, J. A., Annor, T., Agyekum, J., and Nti, I. K. (2021). Assessing the impact of land use and climate change on the hydrological dynamics of the Black Volta Basin. J. Hydrol. Reg. Stud. 36, 100857. doi:10.1016/j.ejrh.2021.100857
Baffour-Ata, F., Antwi-Agyei, P., Nkiaka, E., Dougill, A. J., Anning, A. K., and Kwakye, S. O. (2021). Effect of climate variability on yields of selected staple food crops in northern Ghana. J. Agric. Food Res. 6, 100205. doi:10.1016/j.jafr.2021.100205
Bauer, N., Calvin, K., Emmerling, J., Fricko, O., Fujimori, S., Hilaire, J., et al. (2017). Shared socio-economic pathways of the energy sector – quantifying the narratives. Glob. Environ. Change 42, 316–330. doi:10.1016/j.gloenvcha.2016.07.006
Block, P. J., Souza Filho, F. A., Sun, L., and Kwon, H. H. (2009). A streamflow forecasting framework using multiple climate and hydrological models. J. Am. Water Resour. Assoc. 45 (4), 828–843. doi:10.1111/j.1752-1688.2009.00327.x
CGIAR (2023). Climate-smart agriculture in west africa: a research outlook for building resilient food sytems. CGIAR Research Program on Climate Change, Agriculture and Food Security (CCAFS). Available online at: https://www.cgiar.org/publications/climate-smart-agriculture-west-africa-research-outlook-2023.
de Carvalho, J. R. P., de Assis, W. L., and da Silva, E. M. (2021). Performance of quantile mapping method for correcting biases in regional climate model outputs over South America. Theo. Appl. Climat. 144 (3-4), 1299–1313. doi:10.1007/s00704-021-03598-w
Dembélé, M., Zwart, S. J., Ceperley, N., Mariéthoz, G., and Schaefli, B. (2022). Potential of satellite and reanalysis evaporation datasets for hydrological modelling under various model calibration strategies. Adv. Water Resour. 160, 104097. doi:10.1016/j.advwatres.2021.104097
Diawuo, F. A., Scott, I. J., Baptista, P. C., and Silva, C. A. (2020). Assessing the costs of contributing to climate change targets in sub-Saharan Africa: the case of the Ghanaian electricity system. Energy Sustain. Dev. 57, 32–47. doi:10.1016/j.esd.2020.05.001
Duku, C., and Hein, L. (2021). The impact of deforestation on rainfall in Africa: a data-driven assessment. Environ. Res. Lett. 16 (6), 064044. doi:10.1088/1748-9326/abfcfb
Fadhillah, M. F., Lee, S., Lee, C. W., and Park, Y. C. (2021). Application of support vector regression and metaheuristic optimization algorithms for groundwater potential mapping in gangneung-si, South Korea. Remote Sens. 13 (6), 1196. doi:10.3390/rs13061196
FAO (2022). The state of the world’s land and water resources for food and agriculture – systems at breaking point. FAO. doi:10.4060/cb9910en
Fitton, N., Alexander, P., Arnell, N., Bajzelj, B., Calvin, K., Doelman, J., et al. (2019). The vulnerabilities of agricultural land and food production to future water scarcity. Glob. Environ. Change 58, 101944. doi:10.1016/j.gloenvcha.2019.101944
Funk, C., Peterson, P., Landsfeld, M., Pedreros, D., Verdin, J., Rowland, J., et al. (2022). The climate hazards infrared precipitation with stations—a new environmental record for monitoring extremes. Sci. Data 9 (1), 1–15. doi:10.1038/s41597-022-01414-2
Gebrechorkos, S. H., Hülsmann, S., and Bernhofer, C. (2019). Statistically downscaled climate dataset for East Africa. Sci. Data 6 (1), 31–39. doi:10.1038/s41597-019-0038-1
Getachew, B., and Manjunatha, B. R. (2021). Climate change projections and trends simulated from the CMIP5 models for the lake tana sub-basin, the upper blue nile (abay) River Basin, Ethiopia. Environ. Challenges 5, 100385. doi:10.1016/j.envc.2021.100385
Hausfather, Z., and Peters, G. P. (2020). Emissions – the ‘business as usual’ story is misleading. Nature 577 (7792), 618–620. doi:10.1038/d41586-020-00177-3
Incoom, A. B. M., Adjei, K. A., Odai, S. N., and Akpoti, K. (2022). Meteorological and hydrological drought hazard, frequency and propagation analysis: a case study in southeast Australia. J. Hydrology Regional Stud. 44, 101229. doi:10.1016/j.ejrh.2022.101229
Intergovernmental Panel on Climate Change (IPCC) (2021). Climate change 2021: the physical science basis. Contribution of working group I to the sixth assessment report of the intergovernmental panel on climate change. Cambridge University Press.
Islam, M. A., Dey, M. M., Hossain, M. S., Nejadhashemi, A. P., Singh, G., Das, N. N., et al. (2024). Millet yield estimations in Senegal: unveiling the power of regional water stress analysis and advanced predictive modeling. Agric. Water Manag. 291, 108618. doi:10.1016/j.agwat.2023.108618
Kabato, W., Getnet, G. T., Sinore, T., Nemeth, A., and Molnár, Z. (2025). Towards climate-smart agriculture: strategies for sustainable agricultural production, food security, and greenhouse gas reduction. Agronomy 15 (3), 565. doi:10.3390/agronomy15030565
Kabo-Bah, A. T., Diji, C. J., Nokoe, K., Mulugetta, Y., Obeng-Ofori, D., and Akpoti, K. (2016). Multiyear rainfall and temperature trends in the Volta River Basin and their potential impact on hydropower generation in Ghana. Climate 4 (4), 49. doi:10.3390/cli4040049
Kankam-Yeboah, K., Obuobie, E., Amisigo, B., and Opoku-Ankomah, Y. (2022). Climate change impacts on water resources in the Volta River Basin: a review. West Afr. J. Appl. Ecol. 30 (1), 1–15. doi:10.1007/978-3-030-61225-2_15
Kouman, Y. K., N’guessan, A. E., Kouadio, K. H., and Dibi, N. (2024). Assessment of future climate change impacts on water resources in the Bandama Basin, Côte d’Ivoire. J. Water Clim. Change 15 (2), 671–689. doi:10.2166/wcc.2024.522
Lecouffe, A. (2022). Évolution et persistance des vortex stratosphériques polaires Arctique et Antarctique sur la période 1979 - 2021. Sorbonne Université. Doctoral dissertation.
Lee, J. Y. (2022). “Future global climate: scenario-based projections and near-term information,” in Climate change 2021 – the physical science basis (Cambridge University Press), 553–672. doi:10.1017/9781009157896.006
Limantol, A. M., Larbi, I., and Dotse, S. (2022). Climate change impact on meteorological hazards in the Volta River Basin. West Africa.
Limantol, A. M., Larbi, I., Dotse, S. Q., Okafor, G. C., Asare-Nuamah, P., Frimpong, L. K., et al. (2023). An increase in temperature under the shared socioeconomic scenarios in the Volta River Basin, West Africa: implications for economic development. J. Water Clim. Change 14 (8), 2808–2824. doi:10.2166/wcc.2023.141
McCartney, M., Forkuor, G., Sood, A., Amisigo, B., Hattermann, F., and Muthuwatta, L. (2012). The water resource implications of changing climate in the Volta River Basin. IWMI Res. Rep. 146. doi:10.5337/2012.219
Mensah, C., Amekudzi, L. K., Klutse, N. A. B., and Adukpo, D. C. (2024). Projected changes in extreme temperature and precipitation indices over Ghana from CMIP6 simulations. Theor. Appl. Climatol. 155 (1), 1–20. doi:10.1007/s00704-023-04625-8
Murshed, M., Rahman, M. A., Alam, M. S., Ahmad, P., and Dagar, V. (2020). The nexus between environmental regulations, economic growth, and environmental sustainability: linking environmental patents to ecological footprint reduction in South Asia. Environ. Sci. Pollut. Res. 28, 49967–49988. doi:10.1007/s11356-021-13381-z
Niang, I., Ruppel, O. C., Abdrabo, M. A., Essel, A., Lennard, C., Padgham, J., et al. (2014). “Africa,” in Climate change 2014: impacts, adaptation, and vulnerability. Part B: regional aspects. Contribution of working group II to the fifth assessment report of the intergovernmental panel on climate change (Cambridge University Press), 1199–1265.
O'Neill, B. C., Kriegler, E., Ebi, K. L., Kemp-Benedict, E., Riahi, K., Rothman, D. S., et al. (2017). The roads ahead: narratives for shared socioeconomic pathways describing world futures in the 21st century. Glob. Environ. Change 42, 169–180. doi:10.1016/j.gloenvcha.2015.01.004
O'Neill, B. C., Carter, T. R., Ebi, K., Harrison, P. A., Kemp-Benedict, E., Kok, K., et al. (2020). Achievements and needs for the climate change scenario framework. Nat. Clim. Change 10 (12), 1074–1084. doi:10.1038/s41558-020-00952-0
Ouédraogo, K., Zaré, A., Korbéogo, G., Ouédraogo, O., and Linstädter, A. (2021). Resilience strategies of West African pastoralists in response to scarce forage resources. Pastoralism 11 (1), 16. doi:10.1186/s13570-021-00210-8
Ouedraogo, A., Ouedraogo, M., Egyir, I. S., Läderach, P., Mensah-Bonsu, A., and Jatoe, J. B. D. (2025). Climate services bundles preferences of smallholder farmers in West Africa: a stated choice modelling. Front. Clim. 7 (July), 1581001. doi:10.3389/fclim.2025.1581001
Owusu, K., and Waylen, P. (2009). Trends in spatio-temporal variability in annual rainfall in Ghana (1951-2000). Weather 64 (5), 115–120. doi:10.1002/wea.255
Rathjens, H., Bieger, K., Srinivasan, R., and Arnold, J. G. (2016). CMhyd User Manual Documentation for preparing simulated climate change data for hydrologic impact studies.
Siabi, E. K., Kabobah, A. T., Akpoti, K., Anornu, G. K., Amo-Boateng, M., and Nyantakyi, E. K. (2021). Statistical downscaling of global circulation models to assess future climate changes in the Black Volta basin of Ghana. Environ. Challenges 5, 100299. doi:10.1016/j.envc.2021.100299
Siabi, E. K., Phuong, D. N. D., Kabobah, A. T., Akpoti, K., Anornu, G., Incoom, A. B. M., et al. (2023). Projections and impact assessment of the local climate change conditions of the Black Volta Basin of Ghana based on the Statistical DownScaling Model. J. Water Clim. Change 14 (2), 494–515. doi:10.2166/wcc.2023.352
Siabi, E. K., Awafo, E. A., Kabobah, A. T., Derkyi, N. S. A., Akpoti, K., Anornu, G. K., et al. (2024). Quantifying future climate extreme indices: implications for sustainable urban development in West Africa, with a focus on the greater Accra region. Discov. Sustain. 5 (1), 167. doi:10.1007/s43621-024-00352-w
Sultan, B., Defrance, D., and Iizumi, T. (2023). Evidence of crop production losses in West Africa due to historical global warming in two crop models. Sci. Rep. 13 (1), 1–12. doi:10.1038/s41598-023-32333-w
Teutschbein, C., and Seibert, J. (2012). Bias correction of regional climate model simulations for hydrological climate-change impact studies: review and evaluation of different methods. J. Hydrology 456-457, 12–29. doi:10.1016/j.jhydrol.2012.05.052
Thom, H. C. S. (1958). A note on the gamma distribution. Mon. Weather Rev. 86 (4), 117–122. doi:10.1175/1520-0493(1958)086<0117:ANOTGD>2.0.CO;2
Tian, Y., Xu, Y. P., Wang, G., Seymour, C. L., Sandel, B., Mueller, N., et al. (2020). Global priorities of environmental issues to combat food insecurity and biodiversity loss. Sci. Total Environ. 730, 139096. doi:10.1016/j.scitotenv.2020.139096
Ullah, I., Ma, X., Yin, J., Asfaw, T. G., Azam, K., Syed, S., et al. (2022). Spatiotemporal characteristics of meteorological drought variability and trends (1981–2020) over South Asia and the associated large-scale circulation patterns. Clim. Dyn., 1–23. doi:10.1007/s00382-022-06406-x
UNDP (2020). The next frontier: human development and the anthropocene. Programme: United Nations Development.
van Vuuren, D. P., Riahi, K., Calvin, K., Dellink, R., Emmerling, J., Fujimori, S., et al. (2017). The Shared Socio-economic Pathways: trajectories for human development and global environmental change. Glob. Environ. Change 42, 148–152. doi:10.1016/j.gloenvcha.2016.10.009
Vera, C., Silvestri, G., Liebmann, B., and González, P. (2006). Climate change scenarios for seasonal precipitation in South America from IPCC-AR4 models. Geophys. Res. Lett. 33 (13). doi:10.1029/2006GL025759
World Bank (2021). World Development Report 2021: Data for Better Lives. Washington, D.C., United States: The World Bank.
Xin, X., Zhang, J., Zhang, F., Wu, T., Shi, X., Li, J., et al. (2018). BCC BCC-CSM2MR model output prepared for CMIP6 CMIP. Earth System Grid Federation. doi:10.22033/ESGF/CMIP6.1725
Keywords: climate change, Black Volta Basin, CMIP6, bias correction, hydroelectric power
Citation: Kabo-Bah AT, Siabi SE, Siabi EK, Ahiada WB and Cobbina NA (2025) Simulating future climate changes under the shared socioeconomic pathway scenarios: a case of the black volta basin of Ghana. Front. Environ. Sci. 13:1643465. doi: 10.3389/fenvs.2025.1643465
Received: 09 June 2025; Accepted: 12 September 2025;
Published: 15 October 2025.
Edited by:
Prakash Kumar Jha, University of California Agriculture and Natural Resources, United StatesReviewed by:
Deepa Raveendranpillai, Florida A&M University - Florida State University College of Engineering, United StatesMd. Touhidul Islam, Bangladesh Agricultural University, Bangladesh
Copyright © 2025 Kabo-Bah, Siabi, Siabi, Ahiada and Cobbina. This is an open-access article distributed under the terms of the Creative Commons Attribution License (CC BY). The use, distribution or reproduction in other forums is permitted, provided the original author(s) and the copyright owner(s) are credited and that the original publication in this journal is cited, in accordance with accepted academic practice. No use, distribution or reproduction is permitted which does not comply with these terms.
*Correspondence: Sarah Elikplim Siabi, c2lhYmlzYXJhaDM3MkBnbWFpbC5jb20=