 Alemayehu K. Shembo1
 Addisie Geremew1
 De’Zarae M. Guthrie1
 Debra Elder1Selamawit Woldesenbet1Tony Grady2Ambar Shrestha2Ananda Amarasekara2
 Ram L. Ray1Olukayode Kuloyo3Christian Davies3Jaison Mugundan4
 Laura Carson1*
- 1Cooperative Agriculture Research Center, College of Agriculture, Food and Natural Resources, Prairie View A&M University, Prairie View, TX, United States
- 2Department of Chemistry and Physics, College of Arts and Sciences, Prairie View A&M University, Prairie View, TX, United States
- 3Shell International Exploration and Production Inc. (USA), Shell Technology Centre Houston, Houston, TX, United States
- 4Shell India Markets Private Limited, Shell Technology Center, Bangalore, Karnataka, India
Biochar (BC) is an eco-friendly soil conditioner that mitigates climate change and promotes sustainable agriculture. However, selecting the appropriate commercial biochar and its application for specific soil and crop types requires research. The present work explores the effects of two commercial biochars (BC-I and BC-II) on sorghum plants grown in sandy loam soil under greenhouse conditions. The study characterized the morphological and chemical properties of BCs, including structure, surface area, porosity, elemental composition, and functional groups. Sorghum plants were cultivated in soil amended with biochar at varying application rates of 2.5%, 5%, 10%, and 15%, corresponding to 7, 14, 28, and 42 tons per hectare, respectively. Plant performance was evaluated using chlorophyll content (SPAD), relative water content (RWC), Leaf area (LA) and biomass. Soil carbon content was analyzed using elemental and total organic carbon analysis. Macro- and micronutrients content in soils were also determined. Our findings suggest that compared to BC-II, BC-I exhibited a higher abundance of surface functional groups, greater micropore volume, and a significantly larger pore surface area, indicating its superior physicochemical properties. Except for the 2.5% application rate, all other biochar (BC) rates (namely, 5%, 10%, and 15%) significantly enhanced soil carbon content. Notably, the 5% application rate resulted in the most substantial improvement in soil nutrient levels, including calcium (Ca), potassium (K), magnesium (Mg), and phosphorus (P), compared to the other rates. Sorghum plants treated with lower application rates (2.5% and 5%) of both BC-I and BC-II exhibited significantly enhanced RWC, chlorophyll content, and shoot biomass compared to those treated with higher rates (10% and 15%). Among these, the 5% composite BC-I application demonstrated the most consistent improvement in plant physiological traits (RWC and SPAD) and growth parameters (LA and biomass). However, neither BC variants significantly improved soil nitrogen levels. Our findings indicate that a 5% application rate of composite BC-I provides the most effective balance between enhancing plant performance and improving soil quality in sandy loam soil. Future research on biochar production efforts should prioritize blending this biochar with nitrogen-rich organic fertilizers to address nitrogen limitations and further enhance soil fertility.
1 Introduction
The world population is growing at an alarming rate, making the need for food security urgent (Ranganathan et al., 2018). Accordingly, the United Nations (UN), under its Sustainable Development Goals, has emphasized the necessity to ensure sufficient and nutritious food for the growing human population (UN, 2023). However, these goals are challenged by climate change, which threatens agricultural productivity and food systems around the world (USDA, 2015). The Intergovernmental Panel on Climate Change (IPCC) has reported rising temperatures, unpredictable rainfall, and more frequent extreme weather events (IPCC, 2014). These changes are affecting crop yields, making it harder to produce enough food to meet the growing world population demand (IPCC, 2014). It is, therefore, critical to develop sustainable agricultural practices and innovative strategies that can improve food security while mitigating the negative effects of climate change.
Biochar represents an innovative approach within the circular bioeconomy, facilitating the transformation of agricultural and forestry residues into high-value soil amendments. Aligned with the principles of the circular economy (CE), this strategy emphasizes the sustainable and regenerative utilization of resources, aiming to retain their economic value while mitigating environmental degradation (Papageorgiou et al., 2022). Produced via pyrolysis under limited or no oxygen conditions, biochar exhibits enhanced nutrient density, porosity, adsorption capacity, and functional group diversity (Waheed et al., 2025).
Use of biochar, as it is a carbon-rich soil conditioner, can be a valuable strategy to mitigate climate change (Masud et al., 2023). Adding biochar to soil can capture about 50% of the carbon in plant biomass, which otherwise would be released into the atmosphere as the plants decay or are exposed to fire (Nan et al., 2022). Thus, incorporating biochar into soil increases soil carbon storage, thereby reducing the amount of carbon dioxide released into the atmosphere (IPCC, 2022). Moreover, biochar is a highly stable and resistant material that does not easily decompose in the soil (Matustik et al., 2020). Therefore, it is an effective way to store carbon for the long term, significantly enhancing soil’s potential to reduce greenhouse gas emissions (Kalu et al., 2022).
Biochar also enhances soil fertility (Mousavi et al., 2023; Nepal et al., 2023). Its porous structure allows it to absorb and store water and nutrients, increasing their availability to plants (Dokoohaki et al., 2019). This availability can lead to increased crop yields, especially in degraded and poor-quality soils (Xu et al., 2021). Moreover, biochar reduces soil acidity and increases microbial activity, promoting healthier, more productive soils (Xia et al., 2023; Waheed et al., 2025). Hence, integrating biochar into agricultural practices helps farmers pursue sustainable farming practices that support both food security and environmental protection (Kabir et al., 2023).
Extensive research on biochar has been documented in the scientific literature (Lehmann et al., 2021; Mehmood et al., 2022), with a marked increase in both study and application over the past decade. This reflects a growing global interest in its potential benefits (Dokoohaki et al., 2019; Wang et al., 2023). Studies have shown that various biochars have been developed, differing in size, production methods, and feedstock sources (Mishra et al., 2019; Amalina et al., 2022; Rajput et al., 2024).
Although several biochars have been produced, they do not equally and similarly contribute to climate mitigation and soil improvement (Verheijen et al., 2009). These differences occur mainly because the effectiveness of biochar depends on the biochar’s physical, chemical, and biological properties (Blanco-Canqui, 2017; Weber and Quicker, 2018), which are influenced by the feedstock type and production conditions (Yaashikaa et al., 2020; Khan et al., 2023). Scientific reviews show that biochars derived from different biomass sources vary in nutrient content, pH, and porosity; and influence their carbon sequestration potential and impact on soil fertility (Atkinson et al., 2010; Wang et al., 2023). Therefore, specific biochar must be characterized in detail and evaluated before application to ensure it meets the desired objectives for climate mitigation and soil improvement. In addition, it is important to determine the type of biochar suitable for specific soil and crop conditions and its optimal application rate (Lue et al., 2017; Zhang et al., 2019). The optimal application rate of biochar can depend on factors such as soil type, climate, and crop requirements (Chen et al., 2024). Considering such factors helps to identify the most effective biochar formulations and application strategies, which can significantly contribute to mitigating climate change and boosting agricultural productivity (Matustik et al., 2020).
Accordingly, for the use of biochar to be most efficient and effective, it needs to be suited to local or regional conditions (Li et al., 2024). This study, therefore, aimed to characterize some commercial biochars in United States and evaluate the effects of different application rates on soil carbon content, nutrient levels, and plant growth. Since the research was conducted in Prairie View, representing the Southeast Texas environment, the findings provide a strong foundation for biochar application across Southeast Texas in United States. In addition, this study can serve as a model for similar research in other regions.
2 Materials and methods
2.1 Biochar selection
Two commercially available biochars (BCs) were selected. To maintain ethical standards, we have avoided using their trade names and referred to them as BC- I and BC-II. BC-I was derived from pine wood pyrolysis at 500 °C, while BC-II was produced from pine wood and other tree plants combined at 450 °C. BC-I had two forms: sieved (<0.13 mm) and composite (coarse); whereas BC-II was produced in different sizes such as large (1inch or 25.4 mm-3 mm), medium (3mm-26 mesh or 0.97 mm) and small (26 mesh–50 mesh, which is equivalent to 0.97 mm–0.29 mm) (Figure 1).
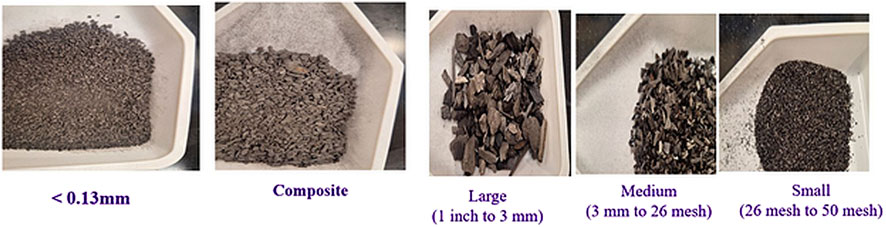
Figure 1. Types and sizes of commercially available biochar. The first two samples on the left—<0.13 mm and composite—represent the size categories used for BC-I. The remaining three samples—large, medium, and small—correspond to the size classifications for BC-II.
2.2 Method of biochar characterization
We used CHNS elemental analysis (CHNS, Elementar Americas Inc., New York) to determine the carbon, hydrogen, nitrogen, and sulfur contents of the biochars. Oxygen was not directly measured; instead, we applied a proxy method based on Budai et al. (2020), who used a reduction approach to estimate oxygen content with the formula: %Oxygen = 100% – [%CHNS + %Ash]. Moreover, The H/C and O/C ratios were used as proxies for assessing biochar’s resistance to decomposition in the soil following Budai et al. (2020). The H/C and O/C ratios are key indicators of biochar persistence in soil (Li and Tasnady, 2023).
Cation composition of each biochar was analyzed using inductively coupled plasma optical emission spectroscopy (ICP-OES, 5100-ICP-OES, Agilent Technologies). Scanning Electron Microscope (SEM) coupled with Energy Dispersive X-ray (EDX; JOEL JSM-6010LA, Japan) analysis were employed to observe the biochar’s surface morphology and elemental composition. The porosity of biochar was characterized using the Brunauer–Emmett–Teller (BET) method (Brunauer et al., 1938) by measuring nitrogen adsorption-desorption isotherms to determine surface area and pore volume. Fourier Transform Infrared (FTIR) spectrometer (JASCO/FTIR-6300, Shimadzu, Japan) was utilized to identify and analyze the functional groups on the biochar surface, using a scanning resolution of 4 cm-1 across a wavenumber range of 5,000 to 400 cm-1, providing insights into its chemical composition and potential interactions in soil.
2.3 Experimental procedure
The study was conducted in a greenhouse at the Bill and Vara Daniel Ranch and Farm, Prairie View A&M University (PVAMU), College of Agriculture, Food and Natural Resources (CAFNR), Prairie View, TX, United States. The study was conducted with Sorghum plants. Each pot was filled with 10 kg of soil and treatment mixture. The pots were arranged in a completely randomized design (CRD) in a greenhouse with 12 h of supplementary light each day and a daytime temperature ranging from 20 °C to 30 °C throughout the growing period.
The experiment consisted of 20 treatment combinations, incorporating five distinct biochar types (sieved, composite, large, medium, and small) each applied at four different rates: 2.5%, 5%, 10%, and 15% (w/w). These application rates were determined to be equivalent to approximately 7, 14, 28, and 42 t/ha, respectively. The conversion was based on measurements using a soil profile sampler with a surface area of 20 square inches and a capacity of 375 g, filled with the same soil type used in the pot experiment. Each treatment, along with a control, was replicated three times, resulting in a total of 63 experimental units.
Eight sorghum seeds (Sorghum bicolor (L.) (Moench)) from Twilley Seed Company (Hodges, SC, United States) were purchased and hand-sown in each pot. Pots were watered to field capacity (FC) every 2 days until germination and seedlings were established. Two weeks after sowing, seedlings were thinned to four plants per pot (Kaliamoorthy et al., 2024). From the seedling stage to maturation, watering occurred every 3 days.
2.4 Soil carbon content analysis
The carbon content of soil following each treatment was quantified using CHNS elemental analysis (Elementar Americana Inc., New York). Calibration of the CHNS analyzer was performed using sulfanilamide, a certified reference material from the National Institute of Standards and Technology (NIST). Additionally, total organic carbon (TOC) content was measured using a TOC analyzer (TOC-LCSH model, Shimadzu Company, Japan), calibrated with high-purity Potassium hydrogen phthalate (KHP) standards. By comparing the soil carbon content levels in the BC-treated soil to those in control pots without biochar, we were able to determine the amount of carbon stored in the soil due to the biochar application.
2.5 pH and electrical conductivity measurements
The chemical properties of soil play a critical role in influencing nutrient solubility, retention, and plant availability. Accordingly, soil pH and electrical conductivity (EC) were measured both before and after treatment applications using a portable pH meter and a PCTSTestr™ 50 Waterproof Pocket Tester (Oakton Instruments, Vernon Hills, IL, United States), following the manufacturer’s guidelines. Calibration of the pH meter was performed using standard buffer solutions at pH 4.00, 7.00, and 10.00 at room temperature. For the EC meter, a conductivity standard solution of 1,413 μS/cm was used in accordance with the manufacturer’s specifications.
2.6 Nutrient analysis
Common anionic macronutrients in soil were analyzed using ion chromatography (IC). Soil samples were initially extracted with deionized water, followed by sonication, centrifugation, and filtration prior to analysis using a Metrohm 930 Compact IC Flex system (Metrohm, United States), in accordance with the manufacturer’s instructions. Calibration of the IC system was performed using NIST-certified anion standards, including chloride (Cl−), nitrite (NO2−), nitrate (NO3−), sulfate (SO42-), and phosphate (PO43-), each specific to its respective analysis. Similarly, certified standards for cationic nutrients—such as B, Al, Ca, Cr, K, Mn, P, Zn, Cu, Fe, Hg, Mg, Na, and Pb—were used to calibrate inductively coupled plasma optical emission spectrometry (ICP-OES), following the method described by Kapadnis and Kar (2019) and the manufacturer’s guidelines.
2.7 Plant growth and physiological parameters
We measured the leaf area (LA) and biomass to assess the growth and development of sorghum plants grown on the treatments. To calculate the leaf area, we used the equation described by Stickler et al. (1961) and Maas et al. (1987) as follows (Equation 1):
where LA = leaf area (cm2); W = maximum leaf width (cm); L = leaf length (cm) and 0.74 = correction factor (the shape factor) for sorghum. The maximum average leaf width and length were measured with a ruler for each number of leaves.
In this study, leaf chlorophyll content and relative water content (RWC) were considered key physiological traits due to their relevance in assessing plant health and stress response. Chlorophyll content serves as an indicator of photosynthetic capacity and overall plant vitality, while RWC reflects the plant’s water status and its ability to tolerate drought stress and support growth (Olorunwa et al., 2021). Chlorophyll content was measured using a SPAD-502 Plus Chlorophyll Meter (Konica Minolta, Inc., Japan) on two randomly selected plants per pot, with readings taken from two leaves per plant. Measurements were conducted on the third fully expanded leaf from the top, as it represents a mature, photosynthetically active, and physiologically stable part of the plant. To ensure consistency, SPAD readings were recorded between 9:00 and 11:00 a.m. at the base, middle, and tip of each leaf lamina, following the protocol described by Geremew et al. (2021), to capture total leaf chlorophyll content.
Relative Water Content (RWC) assesses leaf hydration by comparing its fully turgid state (Frantova et al., 2024). Fresh, fully expanded leaves from four sample plants per pot were collected and stored on ice, following Barrs and Weatherley, (1962). In the lab, 2.5 cm × 2.5 cm leaf discs were cut, excluding the mid-ribs. Fresh weight (FW) was recorded before soaking leaf discs in distilled water for 24 h. After blotting dry, turgid weight (TW) was measured. Finally, the discs were oven-dried at 80 °C for 24 h to measure the dry weight (DW), and the RWC was calculated (Equation 2).
Dry biomass yield was measured after harvesting the shoots of the sorghum plants. Plants from each treatment were wrapped in aluminum foil, oven dried at 70 °C for 72 h, and weighed using a milligram (mg) sensitive electronic balance (OHAUS Compass™ CX Scale).
2.8 Statistical analysis
We used both descriptive and inferential statistics to analyze the data and draw meaningful conclusions. Descriptive analysis, including mean, standard deviation, and frequency distribution, was performed to summarize and organize the data, helping us identify patterns, trends, and relationships within the dataset. Inferential analysis was conducted using analysis of variance (ANOVA) in R version 4.5.1 (R Core Team, 2025) to assess the effects of different types and application rates of biochar (BC) on the evaluated soil and plant parameters. Prior to ANOVA, the data were tested for normality and homogeneity of variance using the Shapiro-Wilk and Levene’s tests, respectively. Where data deviated from normal distribution, log transformation was applied. Significant differences among treatments were further examined using Tukey’s Honestly Significant Difference (HSD) test for multiple mean comparisons. Data visualization was performed using the ggplot2 package in R to support clear and effective presentation of results.
3 Results
3.1 Biochar characterization
A comprehensive profile was obtained through characterizations of biochar (BC-I and BC-II), highlighting their role in soil carbon sequestration and nutrient enhancement. The following findings in this section outline the key properties of biochar and their implications for climate mitigation and agronomic performance.
The CHNS analysis revealed that carbon is the predominant element in the two biochars (Table 1). Notably, except for the sieved biochar of BC-I, the carbon content constitutes more than 50% of their intrinsic composition. Additionally, while all sizes of the two biochars exhibited a high carbon fraction, they consistently showed low levels of nitrogen and sulfur.
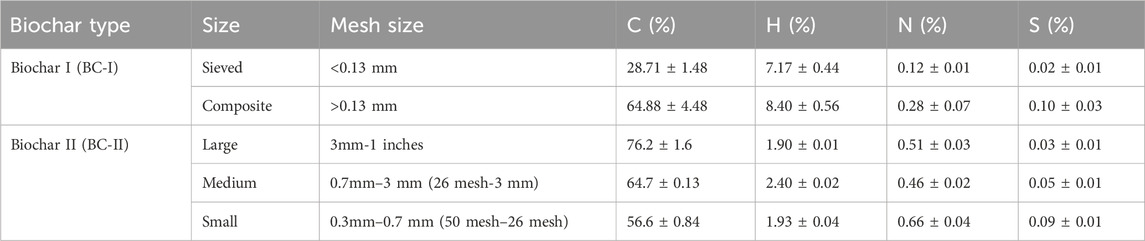
Table 1. Elemental composition of BC-I and BC-II.
3.2 Biochar surface functional groups
The FTIR spectroscopy revealed that both biochars (BC-I and BC-II) contain functional groups on their surface, such as methyl (–CH3), hydroxyl (–OH), carboxyl (–COOH), among others (Figure 2). These functional groups differ between the two biochars, suggesting variations in their chemical composition.
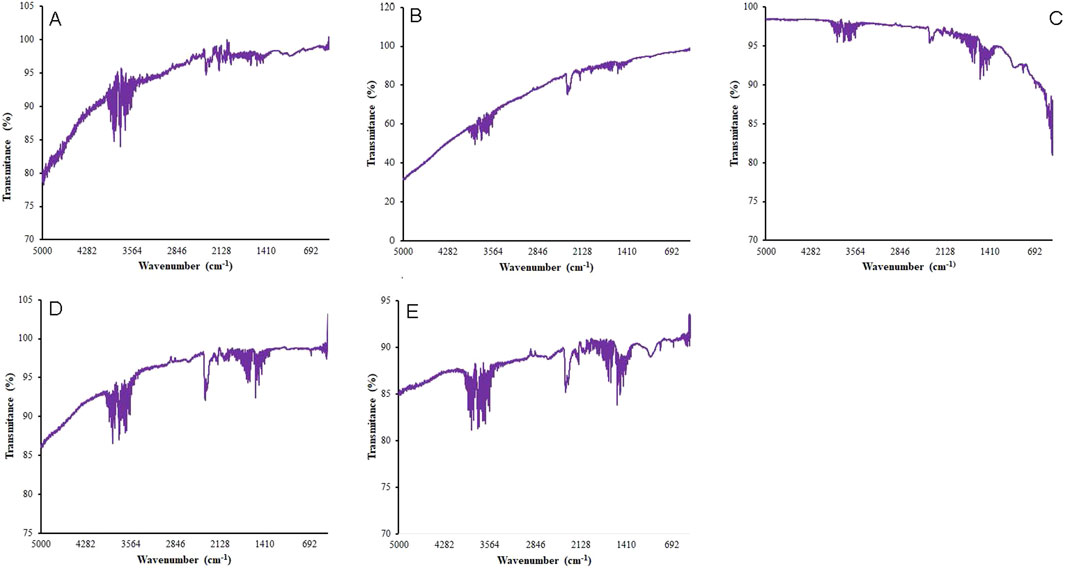
Figure 2. FTIR Spectra showing the functional groups of sieved (A) and composite (B) BC-I and Small (C), Medium (D) and Large (E) BC-II.
The functional groups of the biochars are summarized in Table 2, based on the transmittance peak band range of the compounds (v, cm-1) displayed in Figure 2.
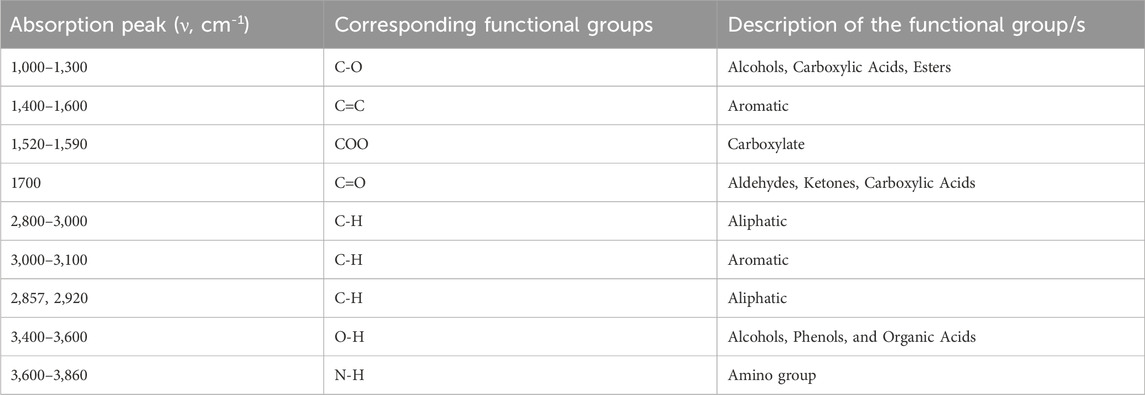
Table 2. FTIR absorption peaks and corresponding functional groups observed in the biochars.
3.3 Surface morphology of biochar
The combination of scanning electron microscope (SEM) and energy dispersive x-ray (EDX) analysis revealed both BC-I and BC-II have different morphology and elemental composition (Figure 3).
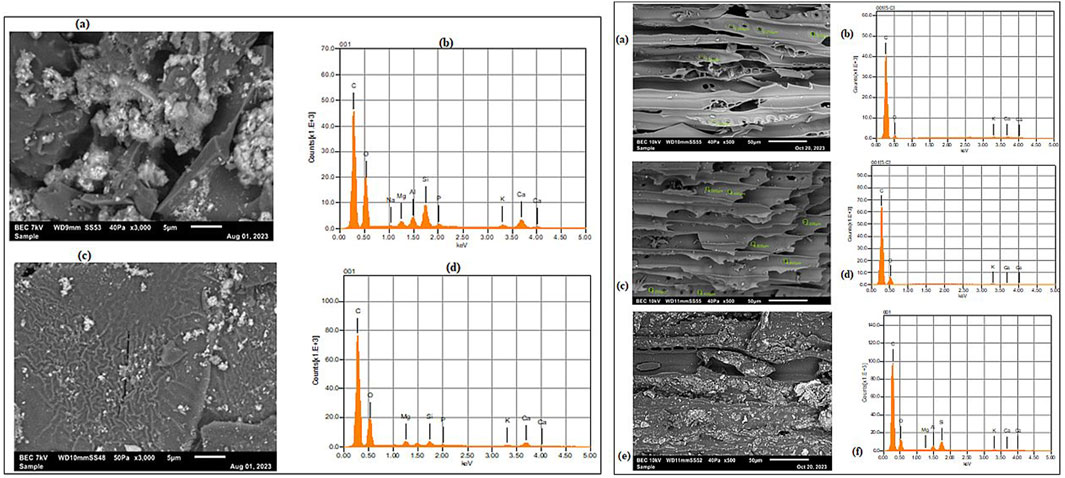
Figure 3. The left panel displays the morphology and chemical composition of sieved (a,b) and composite biochar (c,d) of BC-I, while the right panel illustrates the surface features and chemical components of large (a,b), medium (c,d), and small (e,f) sized BC-II samples, respectively. The SEM images show different biochar have different surface structure; and the peaks in the EDX spectra correspond to specific elements, and their height indicates the relative abundance of those elements.
3.4 Surface area and porosity of biochar
The results of BET analysis show that the studied biochars have different pore surface areas and volumes (Figure 4). The porosity identified in the biochars are micropores (<2 nm), mesopores (2–50 nm), and macropores (>50 nm). The micropores contributed mostly to the total surface area (BET), followed by meso and macropores. Composite BC-I had the highest micropore surface area (370 m2/g, Figure 4A) and volume (0.562 m3/g, Figure 4B) compared to the other biochars.
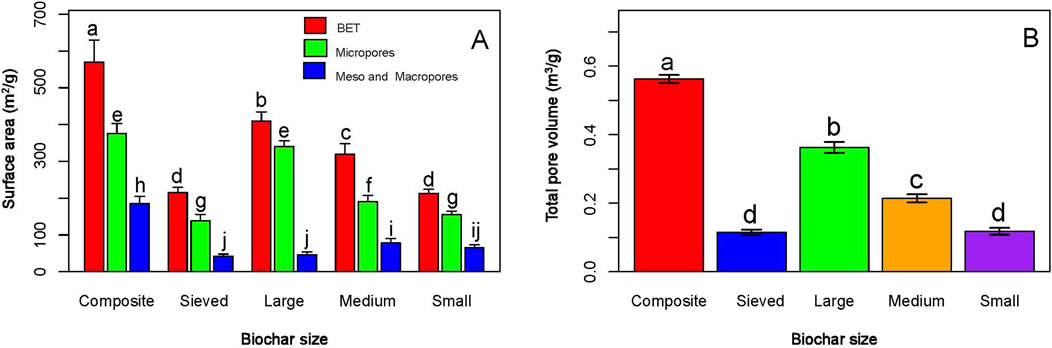
Figure 4. Surface area (A) and volume (B) of biochar pores. The graph illustrates that different biochar types exhibit varying BET surface areas, pore sizes, and pore volumes, highlighting their structural diversity.
3.5 Biochar stability
The stability of biochar assessed by the H/C ratio indicated that both BC-I and BC-II are at least moderately aromatic (Figure 5). However, the O/C ratio revealed that sieved BC-I and small-sized BC-II are chemically unstable and less persistent in soil (O/C > 0.6). In contrast, when comparing composite BC-I with the large and medium fractions of BC-II, the large BC-II exhibited higher carbon content and lower hydrogen levels (H/C < 0.1), suggesting greater aromaticity and suitability for carbon sequestration. Meanwhile, composite BC-I showed relatively high carbon content along with a moderately elevated hydrogen level (H/C = 0.13). Detailed findings for both H/C and O/C ratios are provided in Supplementary Table 1.
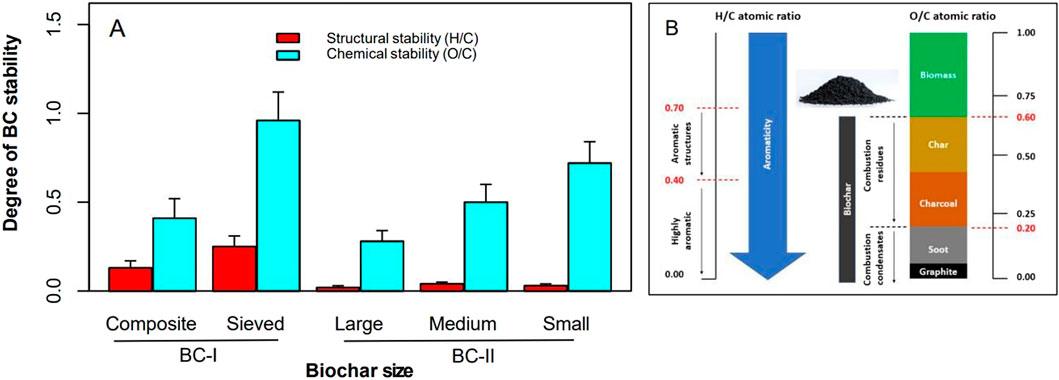
Figure 5. Stability evaluation of BC-I and BC-II (A), and comparison with standard BC stability metrics (B), based on Li and Tasnady (2023).
3.6 Nutrient contents of biochar
The detailed macro- and micro-nutrient contents of the biochars using ICP-OES analysis are provided in Supplementary Table 2. A summarized result of these nutrients is shown in Figure 6. Accordingly, it can be revealed that the biochar samples contained macro- and micronutrients of different concentrations (Figure 6). Nutrients such as B, Mn, Zn, Pb, and Cu were found in lower quantities (6–400 ppm) in both BC-I and BC-II. However, nutrients such as Al, Ca, K, Fe, and Mg were recorded in relatively larger quantities (1,100–15,000 ppm); whereas P and Na were in medium quantities (300–900 ppm) in both biochars (Figure 6). Among the analyzed elemental composition, both sizes of BC-I (Sieved BC and Composite BC) were found to have non-detectable levels of toxic metals such as Cr, Hg, and Pb; whereas all forms of BC-II (large, medium, and small) were found to contain these heavy metals (Supplementary Table 2).
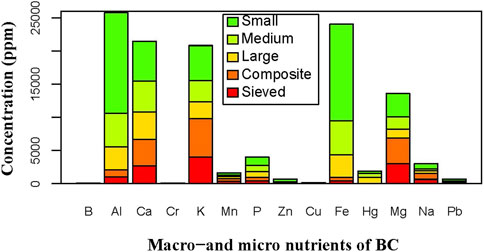
Figure 6. Nutrient content of the biochars (BC-I and BC-II). The graph illustrates that BC-I does not contain heavy metals such as chromium (Cr), mercury (Hg), and lead (Pb), in contrast to the other biochar type. Additionally, nutrients like manganese (Mn), zinc (Zn), copper (Cu), and boron (B) are present in lower concentrations, consistent with their classification as micronutrients.
3.7 Effects of biochar types and application rates on soil carbon content
Regardless of biochar type, increasing the application rate significantly improved soil carbon content compared to the control (P < 0.05; Figure 7B). Notably, higher application rates (10% and 15%) resulted in greater enhancements in soil carbon content than lower rates (Figure 7A). In addition to the carbon measurements obtained via the CHNS elemental analyzer, the TOC analyzer determined the contribution of non-recalcitrant (labile) carbon from biochar to overall soil carbon. The results demonstrated that biochar application significantly increases total organic carbon (TOC), thereby enhancing soil carbon levels (Figure 8B). Specifically, BC-I applied at 5%, 10%, and 15%, and BC-II at 10% and 15%, showed statistically significant improvements in soil carbon content (P < 0.05; Figure 8A). The results indicate that higher biochar application rates significantly increased TOC availability (Figure 8A; Supplementary Table 3) and total soil carbon content (Figure 7B).
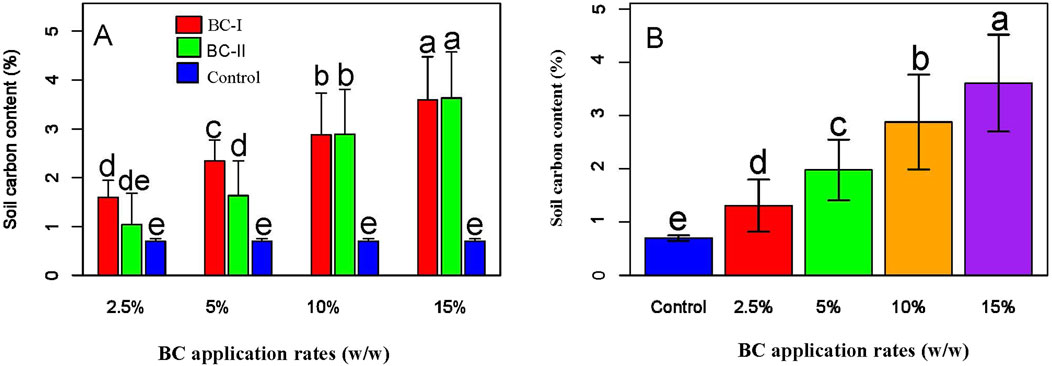
Figure 7. Effect of BC types (A) and application rates (B) on total soil carbon content. The figure illustrates that increasing biochar application rates leads to higher soil carbon content. Panel A compares the effects of different biochar types, while Panel B highlights the positive correlation between application rate and carbon accumulation in the soil.
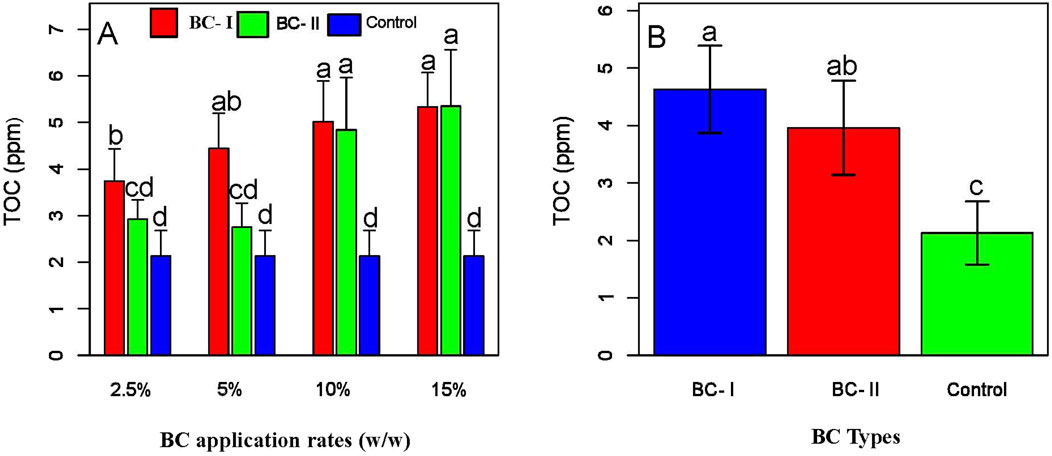
Figure 8. Effects of application rates (A) and BC types (B) on soil TOC content. The figure shows that BC-I significantly increases soil TOC compared to the untreated control, although the difference between BC-I and BC-II is not statistically significant. Within BC-I treatments, application rates of 5%, 10%, and 15% resulted in significantly higher TOC levels than the 2.5% rate and the control.
3.8 Soil pH and EC
Our findings showed that soils treated with different rates of biochar have made the soil slightly alkaline than the untreated soil (Figure 9). However, only the lower rates of biochar application (2.5% and 5%) enhanced the EC of the soil, whereas the larger rates (10% and 15%) reduced the EC of the soil (Figure 9B; Supplementary Table 4).
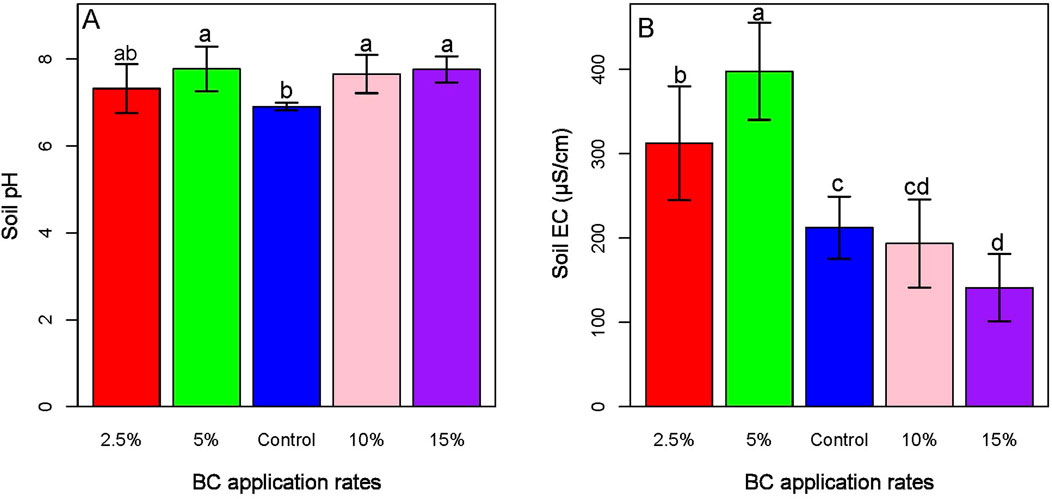
Figure 9. Impacts of biochar to soil pH (A) and EC (B). The figure demonstrates that biochar application increases soil pH, while higher application rates are associated with a reduction in soil electrical conductivity (EC).
3.9 Effects of biochar size and rates on soil nutrient
The findings of our study demonstrated that the application of BC-I generally led to a significantly greater improvement in soil cationic nutrient content compared to BC-II. For example, while soil Ca content increased by 1%–20% with BC-II, it improved substantially (by 65%–406%) when amended with BC-I. Similarly, K and Mg contents increased by 34%–190% with BC-II, but showed a much greater enhancement of 240%–700% under BC-I treatment, particularly at the 5% application rate of the composite BC-I. Additionally, our findings revealed that soils treated with BC-II contained detectable levels of heavy metals compared to the control, whereas soils treated with BC-I did not exhibit such contamination (Supplementary Table 5).
Moreover, the application of BC also influenced the levels of soil anionic nutrients, including chloride, nitrite, nitrate, phosphate, and sulfate. We found BC-I, particularly the composite form applied at a 5% rate, resulted in higher improvements. Additionally, the lower application rates (2.5% and 5%) were more effective in enhancing soil anionic nutrient content than higher rates (Table 3). However, it is noted that soil nitrate levels did not improve at any application rate with either type of biochar.
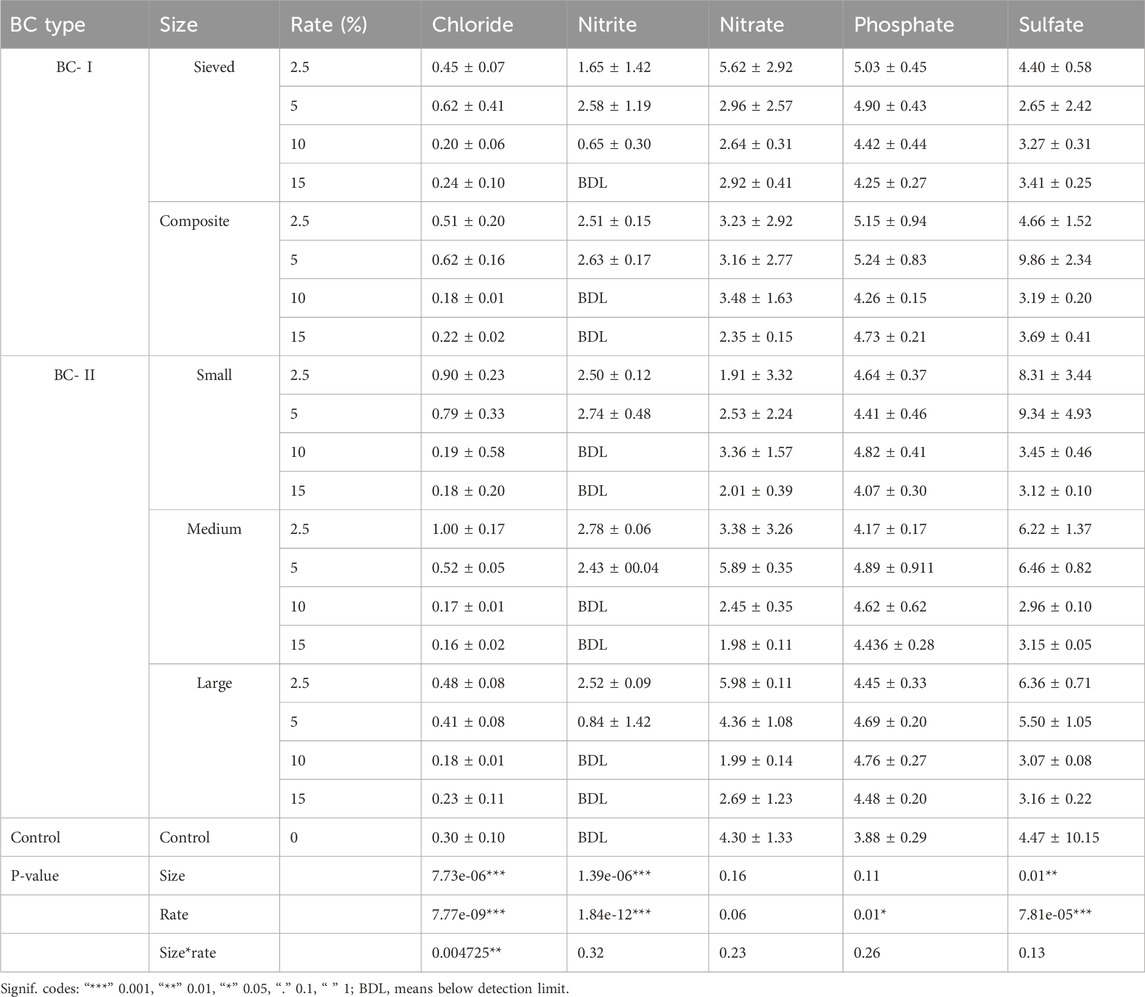
Table 3. Effects of BC-I and BC-II on the level of soil anionic nutrient content.
3.10 Effects of biochar on morpho-physiological traits and biomass of sorghum
The present study showed that biochar types and application rates significantly impact the physiological parameters (relative water content and chlorophyll content), and growth parameters (leaf area and biomass) of the sorghum plant. Lower rates of biochar application (2.5% and 5%) improved the relative water content (RWC) of plants, particularly those grown with BC-I and large BC-II (Figure 10).
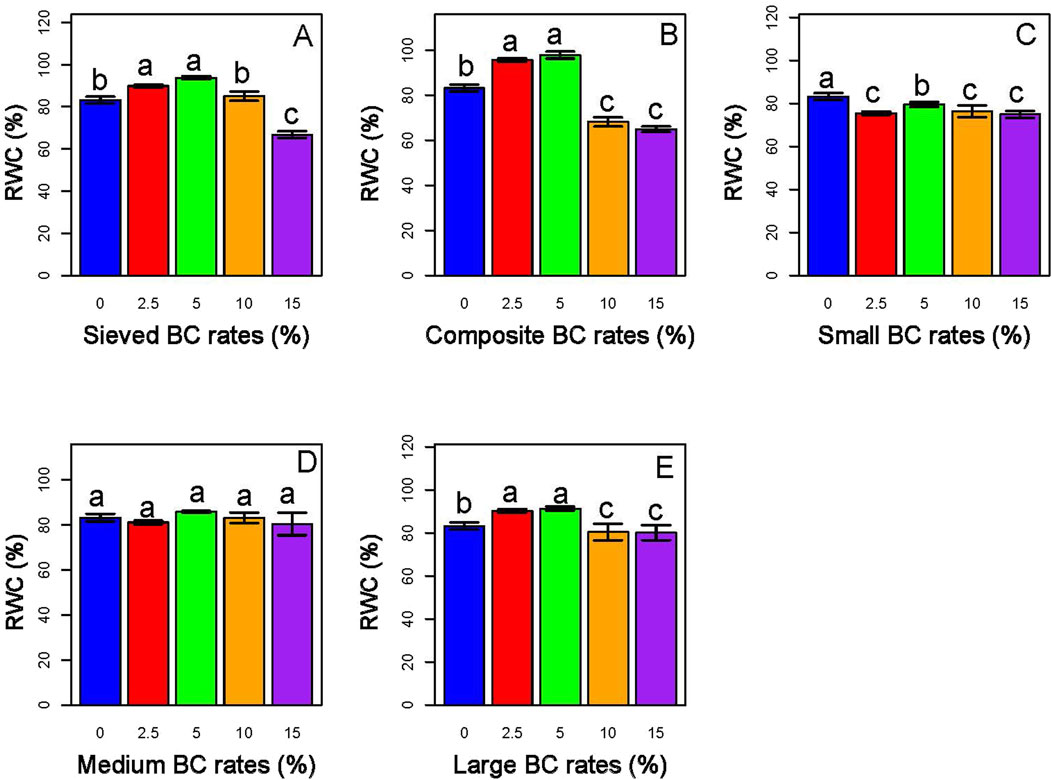
Figure 10. Panels (A,B) illustrate the impact of BC-I, while Panels (C–E) represent the effects of BC-II. Among the treatments, the 5% composite BC-I application generally resulted in the highest RWC in sorghum, indicating improved water retention and physiological response under this biochar type and rate.
Additionally, the lower rates lead plants to exhibit higher chlorophyll content compared to the control and the higher rates, as indicated by higher SPAD values. The 5% rate of composite BC-I resulted in the highest SPAD value compared to other rates (Figure 11).
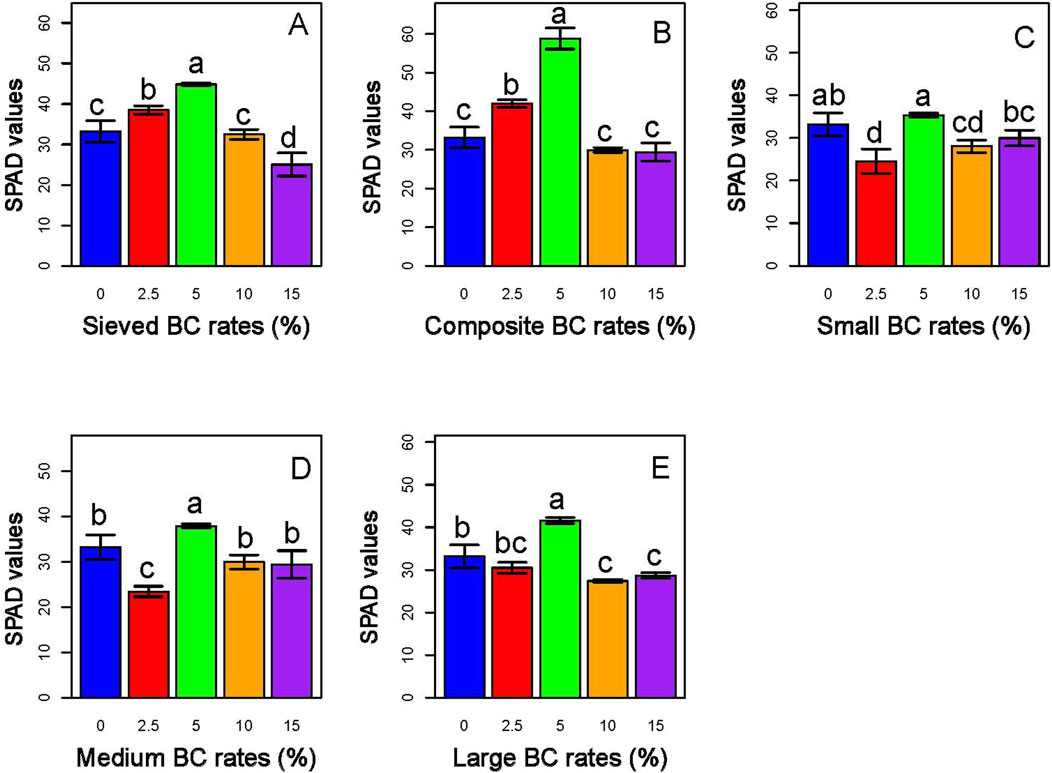
Figure 11. Effects of type and application rates of BC-I (A,B) and BC-II (C–E) on the leaf chlorophyll contents of sorghum plant. Among the treatments, the 5% composite BC-I application generally resulted in the highest chlorophyll content in sorghum, indicating enhanced photosynthetic capacity under this biochar type and rate.
Our result also showed that the lower rates significantly increased the leaf area (LA) of the sorghum plants, whereas the higher rates (10% and 15%) reduced it (Figure 12).
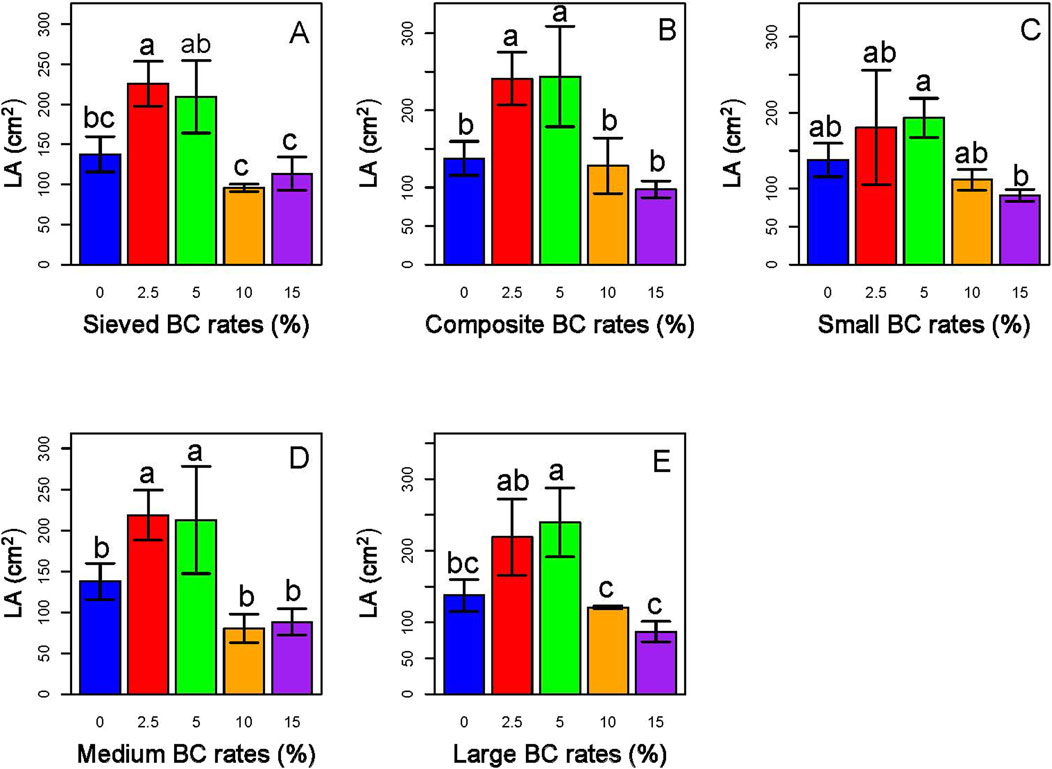
Figure 12. Effects of type and application rates of BC-I (A,B) and BC-II (C–E) on leaf area (LA) of sorghum plant. Among the treatments, the 5% composite BC-I application generally resulted in the highest leaf area, indicating enhanced vegetative growth compared to other biochar types and application rates.
Moreover, sorghum plants grown with lower BC application rates (2.5% and 5%) exhibited greater biomass accumulation than the control group and those treated with higher BC rates (10% and 15%). Notably, the highest biomass observed during the experiment was achieved with the 5% application rate of composite BC-I (Figure 13).
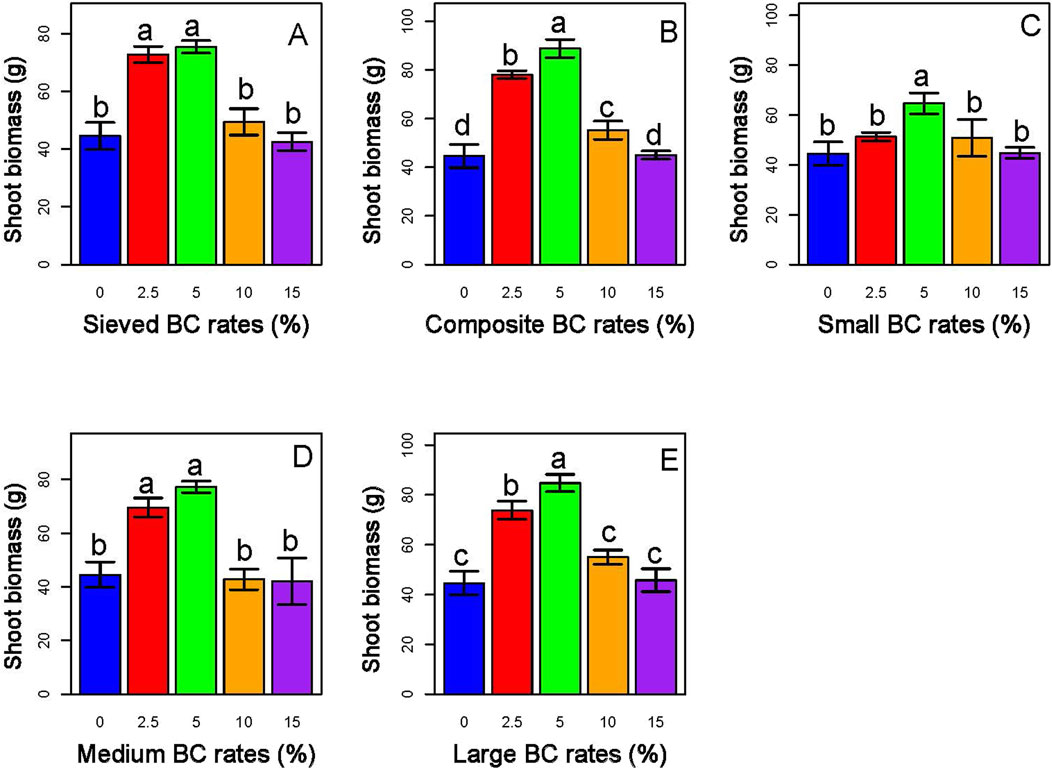
Figure 13. Effects of biochar type and application rate on shoot biomass in Sorghum. Panels (A,B) represent treatments with BC-I, while Panels (C–E) correspond to BC-II. Among the treatments, the 5% composite BC-I application resulted in the highest shoot biomass in sorghum, indicating enhanced growth performance under this biochar type and rate.
4 Discussion
4.1 Biochar properties and their implications for stability and function
Comprehensive biochar characterization is crucial for evaluating its physico-chemical properties, which determine its suitability and performance in applications such as soil enhancement, carbon sequestration, and environmental remediation (Ingle et al., 2024). In this regard, our biochar characterizations presented a detailed profile, emphasizing their role in soil carbon sequestration and nutrient enhancement.
4.1.1 Chemical composition of the biochars
The characterization results obtained from CHNS, FTIR, SEM and EDX analyses demonstrated the complex chemical composition and structural diversity of biochar. Both the CHNS and EDX analyses revealed that carbon accounted for the majority (56%–80%) of the elemental composition in all biochar samples except sieved BC-I (Table 1). This observation suggests that all forms of BC-II (large, medium, and small) and composite BC-I offer promising potential for enhancing soil carbon sequestration. Due to their high carbon content (Figure 3), these biochars are considered advantageous for promoting long-term soil health (IBI, 2015). Notably, the findings also revealed significant deficiencies in nitrogen and sulfur content across the biochars, implying that BC may not effectively supply these essential nutrients to the soil. The reduced levels of nitrogen and sulfur can likely be attributed to their volatilization and emissions from the feedstock during pyrolysis (Leng et al., 2019).
The FTIR analyses (Figure 2; Table 2) elucidated the presence of diverse organic functional groups on the surface of both biochar types, notably methyl (–CH3), hydroxyl (–OH), and carboxyl (–COOH). These groups emerge during pyrolysis through the cleavage and realignment of chemical bonds within the precursor biomass (Naeem et al., 2017; Weber and Quicker, 2018). Their occurrence points to a molecular structure with varying degrees of ordering, contributing to a highly porous architecture in the resulting biochar (Yameen et al., 2024). Moreover, these functional groups may function as electron donors or acceptors in soil environments, facilitating complex interactions with soil constituents when biochar is utilized as a soil amendment (Yuan et al., 2022). This intrinsic quality renders biochar an outstanding soil amendment material for enhancing soil physico-chemical properties (Kameyama et al., 2024).
4.1.2 Adsorption property of biochar
BET analysis revealed that composite BC-I possessed the highest adsorption potential among the biochars, with a notably greater surface area (560 m2/g) and pore volume (0.562 m3/g) than the others (Figure 4). Additionally, the composite biochar contained a higher volume of micropores (370 m3/g), which provided much of its high surface area and strong adsorption capacity (Tan et al., 2018). It has been reported that high surface area and pore size are critical characteristics of biochar, as these influence nutrient retention, adsorption capacity, and soil microbial activity (Hossain et al., 2020). A large surface area is also linked to key biochar properties like cation exchange capacity and water retention, which are vital for its agricultural applications (Nepal et al., 2023). Besides, a higher surface area implies more adsorption sites (Ambaye et al., 2021), especially when this feature is accompanied by a higher pore volume (Das, 2024). Supporting this, studies by Hossain et al. (2020), Li et al. (2021), and Zhang and Shen (2022) reported that biochar’s water retention, nutrient retention, and soil microbial activity increase linearly with its surface area and porosity. In our study, large and medium-sized BC-II showed lower surface area and pore volume compared to composite BC-I, indicating reduced nutrient adsorption capacity in soils.
4.1.3 Biochar stability
The IBI and other organizations, such as the European Biochar Certificate (EBC) and the Australia, New Zealand Biochar Initiative (ANZBI), have established standards for assessing biochar quality. According to these guidelines, a biochar with a H/C ratio of less than 0.7 is considered high quality (IBI, 2015; ANZBI, 2020; EBC, 2019). In this context, our study demonstrates that the biochar collected from commercial areas meets the standards set by IBI, EBC, and ANZBI (Supplementary Table 1). Furthermore, the low H/C and O/C ratios of all biochars studied suggest high stability and strong potential for soil carbon sequestration (Adhikari et al., 2024). This method of assessing stability is widely accepted in biochar research for its simplicity and reliability (Enders et al., 2012; Li and Tasnady, 2023).
The findings from CHNS and FTIR analyses revealed that both biochars consist mainly of carbon, with lower amounts of H and O2, thus, resulting in lower H/C and O/C ratios. The composition is largely due to the pyrolysis process, which makes biochar more aromatic (due to the loss of H) and resistant to decomposition (due to the reduced oxygen level during pyrolysis) (Altıkat et al., 2024). A lower H/C ratio (<0.4) and O/C ratio (<0.6) indicates that the carbon is more tightly bound in aromatic structures with fewer reactive functional groups (Wang et al., 2016; Arif et al., 2021). Both the structure stability and chemical stability of biochar enhances its recalcitrance, leading to longer soil residence times and reinforcing its role in soil carbon sequestration (Budai et al., 2016; Leng et al., 2018; Li and Tasnady, 2023; Rodrigues et al., 2023).
All biochar samples in this study exhibited a H/C ratio below 0.4, indicating high stability and resistance to decomposition in soil, with the potential to persist for over 1,000 years Budai et al. (2020). However, the sieved BC-I and the small-sized BC-II appeared more reactive, with O/C ratios exceeding 0.6 (Figure 5), suggesting they may degrade more rapidly, with estimated half-lives of less than 100 years (IBI, 2015). These findings clearly show that composite BC-I and the large and medium BC-II are more stable and can persist in soil for over a century. Previous 14C studies have shown that biochar with a H/C ratio below 0.4 can retain approximately 70% of the original feedstock carbon in the soil for up to 100 years (Wiedemeier et al., 2015; Xiao et al., 2016; Woolf et al., 2018). This long-term carbon retention is a key aspect of soil carbon sequestration (Mohan et al., 2018), a process that transforms plant-derived carbon into stable forms like biochar, enabling it to remain in the soil for extended periods. This contributes to reducing atmospheric CO2 levels and plays a role in mitigating climate change.
Based on the comparison of the stability analysis of composite BC-I with large and medium BC-II, it appears that the large BC-II has more carbon and less hydrogen (H/C = 0.02), indicating it is highly aromatic and therefore suited mainly for carbon sequestration rather than in agriculture. The selection of biochar depends on its intended use (Dokoohaki et al., 2019). If the primary goal is soil carbon sequestration, it is best to choose biochar that is highly aromatic and chemically stable, as these properties ensure long-term stability. On the other hand, if the aim is to enhance agronomic performance while also contributing to climate mitigation, a balance must be struck (Schmidt et al., 2021). Choosing a biochar with intermediate aromaticity and reactivity allows it to serve both purposes (Enders et al., 2012; Tomczyk et al., 2020). In this regard, our findings indicate that composite BC-I has a high carbon and relatively high hydrogen (H/C = 0.13) compared to the other biochars, suggesting a balance between carbon sequestration and soil improvement.
4.1.4 Nutrient contents of biochar
The ICP-OES analysis revealed that BC-I and BC-II contained various elements or nutrients, including essential macro- and micronutrients like Na, K, Ca, Mg, B, P, Mn, Cu, Zn, Fe, Cr, Hg, Al, and Pb (Figure 6). These findings clearly demonstrate that biochar is a nutrient-rich material that provides essential macro- and micronutrients necessary for plant growth and soil health (Mousavi et al., 2023). The presence of these nutrients further suggests that biochar can enhance soil fertility, leading to improved crop yields and supporting sustainable agricultural practices (Ullah et al., 2024). Moreover, the analysis of biochar nutrients showed relatively low levels of B, Mn, Zn, Cu, and Pb. This is likely because biochar produced from woody biomass, such as pine, typically has lower concentrations of these micronutrients than biochar derived from other sources, such as manures or agricultural residues (Hossain et al., 2020). Conversely, the higher levels of Ca, K, Fe, and Mg in both BC-I and BC-II can be attributed to the inherent composition of the pine feedstock and the pyrolysis process (Mousavi et al., 2023).
4.2 Effects on biochar types and rates on soil carbon and nutrients
4.2.1 Biochar improves soil carbon contents
This study demonstrates that both BC-I and BC-II significantly increased soil carbon content (Figure 7), underscoring the effectiveness of biochar as a soil amendment for enhancing carbon sequestration and contributing to climate change mitigation. These findings align with global meta-analyses, which report average increases in soil organic carbon (SOC) ranging from 52% to 61% following biochar application (Liu et al., 2016; Bekchanova et al., 2024).
CHNS analyses revealed that biochar application at higher rates (10% and 15%) further increased soil carbon content (Figure 7). This enhancement may be attributed to the elevated soil C\N ratio associated with higher biochar inputs, which promotes microbial nitrogen immobilization. Under such conditions, soil microbes utilize available nitrogen to build biomass, thereby contributing to the accumulation of organic carbon in the soil (Xu et al., 2021).
Among the biochars evaluated, BC-I demonstrated the greatest enhancement in soil organic carbon content (Figure 8B), likely associated with its higher non-recalcitrant (labile) carbon, which is more readily mineralized by soil microbes (Bekchanova et al., 2024). Additionally, BC-I exhibited a higher BET surface area and greater pore volume compared to BC-II, characteristics that may support increased microbial activity and accelerate the mineralization of both native soil organic matter and the labile fraction of the biochar (Mukherjee and Lal, 2013). Previous studies have shown that biochars with well-developed pore structures can improve soil aeration and water retention, thereby creating a more favorable environment for microbial communities essential to the decomposition of organic substrates, including the non-recalcitrant components of biochar (Mukherjee and Lal, 2013; Tomczyk et al., 2020).
The TOC analysis further identified the presence of total dissolved organic carbon, reflecting the labile carbon fraction derived from biochar (Liu et al., 2019; Qiu et al., 2023). These findings reinforce the role of biochar in enhancing SOC and advancing carbon sequestration efforts. Our study demonstrated that at higher application rates, both BC-I and BC-II significantly increased SOC by approximately 48% compared to their pooled lower-rate counterparts, and by 140% (including biochar-C) relative to the control soil (Supplementary Table 3). This suggests that elevated application rates are particularly effective in boosting SOC levels. Similar findings have been reported in the literature, where biochar applied at rates of higher rates such as 60 t/ha and 90 t/ha significantly enhanced soil carbon content (Dokoohaki et al., 2019; Xu et al., 2021; Ding et al., 2023).
4.2.2 Soil pH and EC
Biochar addition enhances interactions with soil fractions via van der Waals forces and hydrophobic interactions (Verheijen et al., 2009). Interactions at this scale determine the influence of biochar on soil physio-chemical properties and the interactions with cations, anions, and other organic compounds in the soil (Zhu et al., 2017). In this regard, we found that biochar-treated soils became slightly more alkaline than untreated soil (Figure 9A), with no significant difference between BC-I and BC-II. The slight increase in pH in our study occurred because BC, in general, is alkaline (Bolan et al., 2023). In line with this, research indicates that at pyrolysis temperatures above 300 °C, acidic groups like formyl, carboxyl, and hydroxyl are eliminated, enriching biochar with basic cations and increasing its alkalinity, thereby raising its pH (Naeem et al., 2017; Weber and Quicker, 2018; Singh et al., 2022). This inference is further supported by the FTIR analysis of the biochar samples in our study, which showed diminished peaks corresponding to O–H (∼3,400 cm-1), C=O (∼1700 cm-1), and C–O (∼1,200–1,300 cm-1) functional groups, compared to the more pronounced peaks observed in fresh pine wood as reported in previous studies (Emandi et al., 2011; Esteves et al., 2013).
Moreover, the alkalinity of soil due to biochar may partly result from its porous structure, which can retain water when the soil is watered during the experiment, absorb moisture from the surrounding soil, or both. These processes are expected to dissolve the organic and mineral elements on the surface of the biochar. The dissolutions provide the soil with more organic carbon, cations, and anions and enhance the soil nutrient concentration. The increase in nutrients raises the EC and pH levels of the soil. Similarly, Dokoohaki et al. (2019) have found that the pH of sandy soil from various regions in the United States increased when biochar was added.
Studies have shown that soil amendments, including compost, manure, and biochar, can increase soil EC (Nepal et al., 2023). The increases in EC that occurred at lower rates of BC application (2.5% and 5%) in our study (Figure 9B) may be attributed to improved nutrient retention. A study from the USDA found an increase in soil contents of anions and cations after the addition of biochar (USDA, 1999), which also increased soils’ EC. However, this lower rate of biochar (BC) did not cause an excessive rise in EC (>4,000 μS/cm), which indicates salinity (Wang et al., 2014) and the requirement of management practices like irrigation and drainage to reduce salt concentration (Troeh et al., 2004). Conversely, applying biochar at higher rates (10% and 15%) has been observed to reduce soil EC (Supplementary Table 4). The biochar likely provides sufficient pore space at these concentrations to adsorb and retain more nutrients, thereby decreasing the concentration of free ions in the soil solution and ultimately lowering EC (Zheng et al., 2016). This behavior suggests that biochar may function as a nutrient sink at elevated application levels. Gul and Whalen (2016) similarly described high biochar dosages as nutrient sinks, influencing the mobility and bioavailability of nutrients. Moreover, the observed slight increase in pH in neutral soils highlights the potential benefits of biochar (both BC-I and BC-II) for improving acidic soil conditions. Studies elsewhere also reported that biochar significantly raises the pH of acidic soils, has no effect on neutral soils, and lowers the pH of black soils (Zhang et al., 2019).
4.2.3 Biochar improves soil nutrients
Our findings indicate that soil amendment using biochar enhances soil nutrient content (both cations and anions, Table 3; Supplementary Table 5) that can improve crop yields and soil health (Bekchanova et al., 2024). In particular, the 5% application rate optimally boosted the nutrient levels in the soil. The increase in soil nutrient content could result either from nutrients in the biochar (Hossain et al., 2020) or through enhancement of the soil’s nutrient retention capacity (Zhu et al., 2025). Biochars’ role in improving soil nutrient retention capacity has been well addressed by various authors, who have attributed it mainly to its adsorption property (Ambaye et al., 2021) or to its porosity (Liu et al., 2017; Wong and Ogbonnaya, 2021). This inference aligns with our findings, as the biochars in our study exhibited a high surface area, providing multiple sites for nutrient adsorption and functional groups that help retain nutrients. Such characteristics of the biochars might have allowed nutrients to adhere to its surface (Hossain et al., 2020). Additionally, the porous structure of biochar is thought to significantly contribute to nutrient retention since the pores (particularly the micropores) can trap nutrients, preventing them from being washed away (Liu et al., 2017).
4.3 Biochar improves morpho-physiological traits and growth of sorghum plant
Our study’s findings demonstrate that applying composite BC-I at a 5% rate resulted in higher SPAD values (Figure 11), indicating increased chlorophyll content, which is often associated with improved plant health and greater productivity (Ngui et al., 2024). Our findings clearly demonstrate that sorghum plants treated with a lower rate of BC-I exhibited significantly elevated SPAD values. Leaf chlorophyll content is known to correlate strongly with nitrogen levels (Xiong et al., 2015). However, in our study, SPAD values remained high even when soil nitrogen content did not show a corresponding increase. This suggests that the elevated SPAD index may reflect enhanced chlorophyll content due to increased Mg availability in the soil and its subsequent plant uptake. The rise in soil Mg levels is likely attributable to the biochar added, which was rich in magnesium in both types of biochar. Mg is a crucial macronutrient and serves as the central atom in the porphyrin ring of the chlorophyll molecule, directly influencing photosynthetic capacity. Previous studies have reported a strong positive correlation between SPAD values and leaf Mg concentration (Zandonadi et al., 2016; Guan et al., 2020; Geremew et al., 2021; Shamsabad et al., 2022).
Our findings clearly indicate that biochar application enhances the water status of sorghum tissues (Figure 10), suggesting improved hydration that supports overall plant growth. This effect was particularly evident with the 5% composite BC-I treatment, which likely optimized nutrient uptake and, in turn, facilitated greater water absorption by the plant (Thakur and Teja, 2024). Additionally, the improved hydration may also be attributed to the enhanced soil water retention capacity by the porous structure of the BC (Hossain et al., 2020). These combined effects underscore the importance of applying biochar at appropriate rates to create favorable conditions to achieve better water status in sorghum plants (Li et al., 2021).
In this study, sorghum plants grown in soil amended with a lower rate of biochar-specifically the 5% composite BC-I demonstrated significantly greater LA compared to those grown in control conditions or with higher biochar doses (Figure 12). This finding highlights the critical role of moderate biochar application in improving nutrient availability and uptake, which likely contributes to enhanced leaf expansion. The increased LA observed at the 5% rate may reflect biochar’s capacity to stimulate beneficial microbial communities that accelerate the decomposition of organic matter and the mineralization of nutrients (Arif et al., 2021), thereby making essential elements more accessible for leaf development (Borchard et al., 2012; Pandit et al., 2018). Supporting this, several studies have shown that biochar, when applied at optimal levels, can significantly increase microbial activity for enhancing nutrient use efficiency in plants, ultimately leading to increased LA and improved photosynthetic potential (Xu et al., 2021; Mousavi et al., 2023; Nepal et al., 2023).
Our study demonstrates that lower application rates of BC, particularly the 5% composite BC-I treatment, significantly enhanced sorghum biomass compared to both the control and higher BC rates (Figure 13). This increase in biomass is closely associated with improved physiological traits observed at this rate, including higher RWC, elevated chlorophyll pigment concentrations, and expanded LA. These factors contribute to more efficient light capture and utilization during the light-dependent phase of photosynthesis (Nasiri et al., 2024). Furthermore, the elevated Mg availability may enhance the activation of ribulose-1,5-bisphosphate carboxylase/oxygenase (RuBisCO), a key enzyme in the Calvin cycle (Hauer-Jakli and Trankner, 2019; Shao et al., 2021), thereby promoting carbon dioxide assimilation during the light-independent (dark) reactions (Wang, 2024; Salesse-Smith et al., 2024). These improvements in photosynthetic efficiency likely underpin the observed increase in biomass accumulation under the 5% BC-I treatment. These findings are consistent with broader research showing that biochar improves crop yield by enhancing nutrient uptake, water retention, and photosynthetic activity, particularly when applied at optimal rates (Bo et al., 2023; Mousavi et al., 2023; Nepal et al., 2023).
4.4 Limitations of biochar
Our analysis revealed that all variants of BC-I (sieved and composite forms) were free from heavy metals such as chromium (Cr), mercury (Hg), and lead (Pb) (Supplementary Table 2). In contrast, all forms of BC-II (large, medium, and small-sized biochar) exhibited contamination with these heavy metals. This contamination is likely attributable to the feedstock used for BC-II, which consisted of dead wood debris and its associated biogeochemical characteristics (Jones and Quilliam, 2014). Previous studies have indicated that feedstocks like dead wood debris are prone to containing trace contaminants (Ben-Haddad et al., 2025). These findings suggest that BC-I presents a promising strategy for climate change mitigation and soil quality enhancement, whereas BC-II poses a potential risk of heavy metal contamination in agricultural soils.
Furthermore, although both biochar types of significantly improved soil nutrient levels including anions and cations demonstrated a notable effect on soil nitrate concentration (Table 3). This may be due to the limited promotion of microbial activity responsible for nitrate adsorption (Parasar and Agarwala, 2025). Additionally, biochar typically possesses a negatively charged surface (Xiao et al., 2018), which repels nitrate ions and inhibits their adsorption (Mukherjee et al., 2011). The presence of oxygen-containing functional groups on the biochar surface may further intensify this electrostatic repulsion, thereby reducing nitrate retention (Zoroufchi Benis et al., 2023). These observations are consistent with findings by Kameyama et al. (2012), who reported no significant change in soil nitrate levels following biochar application. In contrast, Jiang et al. (2022) documented substantial nitrogen retention in biochar-amended soils. This discrepancy may be due to differences in biochar feedstock and soil types, underscoring the need for further research into biochar’s nitrogen retention capacity to support soil health and plant nutrient availability.
5 Conclusion
From the study, it can be deduced that applying biochar at optimal rates not only enhanced soil nutrient content but also improved plant biomass accumulation. Moreover, the study confirmed that biochar is a promising tool for enhancing soil carbon sequestration. Specifically, applying composite BC-I at a 5% rate (w/w) optimized soil content of carbon and other applicants. Additionally, the 5% application rate of composite BC-I should be studied on different crop types, soil types, textures, and fertility conditions to develop a broad-spectrum application rate. Furthermore, field trials are necessary to identify the best biochar application rate under farm conditions. This study found that, except for nitrate, biochar increased the concentrations of several macronutrients and micronutrients in the soil. Future research should investigate the combined effects of biochar and nitrogen-rich organic amendments to address the nitrogen deficit associated with biochar.
Data availability statement
The original contributions presented in the study are included in the article/Supplementary Material, further inquiries can be directed to the corresponding author.
Author contributions
AKS: Methodology, Software, Investigation, Writing – review and editing, Formal Analysis, Visualization, Writing – original draft, Data curation. AG: Validation, Methodology, Formal Analysis, Supervision, Conceptualization, Software, Investigation, Funding acquisition, Writing – review and editing. DG: Data curation, Writing – review and editing, Methodology, Investigation. DE: Data curation, Writing – review and editing, Methodology, Validation. SW: Writing – review and editing, Validation, Methodology, Data curation. TG: Validation, Methodology, Writing – review and editing, Data curation. AmS: Validation, Data curation, Writing – review and editing, Methodology. AA: Writing – review and editing, Validation, Data curation, Methodology. RR: Project administration, Conceptualization, Funding acquisition, Writing – review and editing. OK: Funding acquisition, Project administration, Writing – review and editing. CD: Funding acquisition, Project administration, Writing – review and editing. JM: Funding acquisition, Project administration, Writing – review and editing. LC: Data curation, Resources, Conceptualization, Funding acquisition, Project administration, Validation, Investigation, Writing – review and editing, Supervision.
Funding
The author(s) declare that financial support was received for the research and/or publication of this article. Research was supported by Shell International Exploration and Production Inc., United States under grant number-M2301172.
Acknowledgments
The authors gratefully acknowledge Shell-International Exploration and Production Inc., United States for financially supporting this research.
Conflict of interest
Author JM was employed by Shell India Markets Private Limited. Authors OK and CD were employed by Shell International Exploration and Production Inc. (USA).
The remaining authors declare that the research was conducted in the absence of any commercial or financial relationships that could be construed as a potential conflict of interest.
Generative AI statement
The author(s) declare that no Generative AI was used in the creation of this manuscript.
Any alternative text (alt text) provided alongside figures in this article has been generated by Frontiers with the support of artificial intelligence and reasonable efforts have been made to ensure accuracy, including review by the authors wherever possible. If you identify any issues, please contact us.
Publisher’s note
All claims expressed in this article are solely those of the authors and do not necessarily represent those of their affiliated organizations, or those of the publisher, the editors and the reviewers. Any product that may be evaluated in this article, or claim that may be made by its manufacturer, is not guaranteed or endorsed by the publisher.
Supplementary material
The Supplementary Material for this article can be found online at: https://www.frontiersin.org/articles/10.3389/fenvs.2025.1644821/full#supplementary-material
References
Adhikari, S., Moon, E., Paz-Ferreiro, J., and Timms, W. (2024). Comparative analysis of biochar carbon stability methods and implications for carbon credits. Sci. Total Environ. 914, 169607. doi:10.1016/j.scitotenv.2023.169607
Altıkat, A., Alma, M. H., Altıkat, A., Bilgili, M. E., and Altıkat, S. A. (2024). A comprehensive study of biochar yield and quality concerning pyrolysis conditions: a multifaceted approach. Sustainability 16, 937. doi:10.3390/su16020937
Amalina, F., Abd Razak, A. S., Krishnan, S., Sulaiman, H., Zularisam, A. W., and Nasrullah, M. (2022). Advanced techniques in the production of biochar from lignocellulosic biomass and environmental applications. Clean. Mater. 6, 100137. doi:10.1016/j.clema.2022.100137
Ambaye, T. G., Vaccari, M., van Hullebusch, E. D., Amrane, A., and Rtimi, S. (2021). Mechanisms and adsorption capacities of biochar for the removal of organic and inorganic pollutants from industrial wastewater. Int. J. Environ. Sci. Technol. 18, 3273–3294. doi:10.1007/s13762-020-03060-w
ANZBI (2020). National bioenergy roadmap submission: the significant role for biochar in Australia, Australia New Zealand biochar initiative (ANZBI). Available online at: https://anzbig.org/wp-content (Accessed May 14, 2025).
Arif, S., Liu, G., Yousaf, B., Ahmed, R., Irshad, S., Ashraf, A., et al. (2021). Synthesis, characteristics and mechanistic insight into the clays and clay minerals–biochar surface interactions for contaminants removal: a review. J. Clean. Prod. 310, 127548. doi:10.1016/j.jclepro.2021.127548
Atkinson, C. J., Fitzgerald, J. D., and Hipps, N. A. (2010). Potential mechanisms for achieving agricultural benefits from biochar application to temperate soils: a review. Plant Soil 337 (1-2), 1–18. doi:10.1007/s11104-010-0464-5
Barrs, H. D., and Weatherley, P. E. (1962). A Re-examination of the relative turgidity technique for estimating water deficits in leaves. Aust. J. Biol. Sci. 15 (3), 413–428. doi:10.1071/BI9620413
Bekchanova, M., Kuppens, T., Cuypers, A., Jozefczak, M., and Malina, R. (2024). Biochar’s effect on the soil carbon cycle: a rapid review and meta-analysis. Biochar 6 (88), 88. doi:10.1007/s42773-024-00381-8
Ben-Haddad, M., Hajji, S., Abelouah, M. R., Ouheddou, M., Forero Lopez, A. D., Ait Alla, A., et al. (2025). Fine woody debris in Morocco’s coastal environment: a hidden reservoir for pollutants. Water, Air, and Soil Pollut. 236 (117), 117. doi:10.1007/s11270-025-07753-1
Blanco-Canqui, H. (2017). Biochar and soil physical properties. Soil Sci. Soc. Am. J. 81 (4), 687–711. doi:10.2136/sssaj2017.01.0017
Bo, X., Zhang, Z., Wang, J., Guo, S., Li, Z., Lin, H., et al. (2023). Benefits and limitations of biochar for climate-smart agriculture: a review and case study from China. Biochar 5 (77), 77. doi:10.1007/s42773-023-00279-x
Bolan, N., Sarmah, A. K., Bordoloi, S., Bolan, S., Padhye, L. P., Van Zwieten, L., et al. (2023). Soil acidification and the liming potential of biochar. Environ. Pollut. 317, 120632. doi:10.1016/j.envpol.2022.120632
Borchard, N., Wolf, A., Laabs, V., Aeckersberg, R., Scherer, H. W., Moeller, A., et al. (2012). Physical activation of biochar and its meaning for soil fertility and nutrient leaching- A greenhouse experiment. Soil Use Manage 28, 177–184. doi:10.1111/j.1475-2743.2012.00407.x
Brunauer, S., Emmett, P. H., and Teller, E. (1938). Adsorption of gases in multi-molecular layers. J. Am. Chem. Soc. 60, 309–319. doi:10.1021/ja01269a023
Budai, A., Rasse, D. P., Lagomarsino, A., Lerch, T. Z., and Paruch, L. (2016). Biochar persistence, priming and microbial responses to pyrolysis temperature series. Biol. Fertil. Soils 52 (5), 749–761. doi:10.1007/s00374-016-1116-6
Budai, A., Zimmerman, A. R., Cowie, A. L., Webber, J. B. W., Singh, B. P., Glaser, B., et al. (2020). Biochar carbon stability test method: an assessment of methods to determine biochar carbon stability. Int. Biochar Initiat. doi:10.13140/RG.2.2.16359.42402
Chen, Y., Van Zwieten, L., Xiao, K., Liang, C., Ren, J., Zhang, A., et al. (2024). Biochar as a green solution to drive the soil carbon pump. Carbon Res. 3 (44), 44. doi:10.1007/s44246-024-00132-1
Das, S. K. (2024). Adsorption and desorption capacity of different metals influenced by biomass derived biochar. Environ. Syst. Res. 13, 5. doi:10.1186/s40068-024-00335-w
Ding, X., Li, G., Zhao, X., Lin, Q., and Wang, X. (2023). Biochar application significantly increases soil organic carbon under conservation tillage: an 11-year field experiment. Biochar 5 (28), 28. doi:10.1007/s42773-023-00226-w
Dokoohaki, H., Miguez, F. E., Laird, D., and Dumortier, J. (2019). Where should we apply biochar. Environ. Res. Lett. 14, 044005. doi:10.1088/1748-9326/aafcf0
EBC (2019). European biochar certificate — guidelines for a sustainable production of biochar (version 8.xE, 2019). Carbon Stand. Int. (CSI), Frick, Switz.
Emandi, A., Vasiliu, C. I., Budrugeac, P., and Stamatin, L. (2011). Quantitative investigation of wood composition by integrated FTIR and Thermogravimetric methods. Cellul. Chem. Technol. 45 (9-10), 579–584.
Enders, A., Hanley, K., Whitman, T., Joseph, S., and Lehmann, J. (2012). Characterization of biochars to evaluate recalcitrance and agronomic performance. Bioresour. Technol. 114, 644–653. doi:10.1016/j.biortech.2012.03.022
Esteves, B., Velez Marques, A., Domingos, I., and Pereira, H. (2013). Chemical changes of heat-treated pine and eucalypt wood monitored by FTIR. Maderas Cienc. Tecnol. 15, 0–258. doi:10.4067/S0718-221X2013005000020
Frantova, N., Rabek, M., Porcova, L., Jovanovic, I., Sirucek, P., Lukas, V., et al. (2024). Monitoring drought tolerance mechanisms of sorghum and maize under unevenly distributed precipitation. Int. J. Plant Prod. 18, 49–67. doi:10.1007/s42106-023-00278-9
Geremew, A., Carson, L., Woldesenbet, S., Carpenter, C., Peace, E., and Weerasooriya, A. (2021). Interactive effects of organic fertilizers and drought stress on growth and nutrient content of Brassica juncea at vegetative stage. Sustainability 13 (24), 13948. doi:10.3390/su132413948
Guan, X., Liu, D., Liu, B., Wu, C., Liu, C., Wang, X., et al. (2020). Critical leaf magnesium concentrations for adequate photosynthate production of soilless cultured cherry tomato—interaction with potassium. Agronomy 10, 1863. doi:10.3390/agronomy10121863
Gul, S., and Whalen, J. K. (2016). Biochemical cycling of nitrogen and phosphorus in biochar-amended soils. Soil Biol. Biochem. 103, 1–15. doi:10.1016/j.soilbio.2016.08.001
Hauer-Jakli, M., and Trankner, M. (2019). Critical leaf magnesium thresholds and the impact of magnesium on plant growth and photo-oxidative defense: a systematic review and meta-analysis from 70 years of research. Front. Plant Sci. 10, 766. doi:10.3389/fpls.2019.00766
Hossain, M. Z., Bahar, M. M., Sarkar, B., Donne, S. W., Ok, Y. S., Palansooriya, K. N., et al. (2020). Biochar and its importance on nutrient dynamics in soil and plant. Biochar 2, 379–420. doi:10.1007/s42773-020-00065-z
IBI (2015). Standardized product definition and product testing guidelines for biochar that is used in soil. Int. Biochar Initiat. (IBI). Available online at: https://biochar-international.org (Accessed May 12, 2025).
Ingle, S. R., Kamble, B. M., and Patil, V. S. (2024). Biochar: a comprehensive review of production, properties and applications. Int. J. Adv. Biochem. Res. 8 (1), 21–29. doi:10.33545/26174693.2024.v8.i1Sa.282
IPCC (2014). in Climate change 2014: synthesis report. Contribution of working groups I, II, and III to the fifth assessment report of the intergovernmental panel on climate change (IPCC). Core writing Team. Editors R. K. Pachauri, and L. A. Meyer (Geneva, Switzerland).IPCC
IPCC (2022). in Climate change 2022: impacts, adaptation, and vulnerability. Contribution of working group II to the sixth Assessment report of the Intergovernmental panel on climate change. Editors H. O. Portner, D. C. Roberts, M. Tignor, E. S. Poloczanska, K. Mintenbeck, A. Alegríaet al. (Cambridge University Press). doi:10.1017/9781009325844
Jiang, Z.-X., Cui, S., Zhang, X., Xi, M., and Sun, D.-M. (2022). Influence of biochar application on soil nitrate leaching and phosphate retention: a synthetic meta-analysis. Huan Jing ke Xue 43 (10), 4658–4668. doi:10.13227/j.hjkx.202112314
Jones, D. L., and Quilliam, R. S. (2014). Metal contaminated biochar and wood ash negatively affect plant growth and soil quality after land application. J. Hazard. Mater. 276, 362–370. doi:10.1016/j.jhazmat.2014.05.053
Kabir, E., Kim, K.-H., and Kwon, E. E. (2023). Biochar as a tool for the improvement of soil and environment. Front. Environ. Sci. 11, 1324533. doi:10.3389/fenvs.2023.1324533
Kaliamoorthy, S., Gaddameedi, A., Murugesan, T., Gorthy, S., Sravani, B., Neelam, N., et al. (2024). Exploring genotypic diversity in sorghum breeding lines for water-saving traits to enhance drought adaptation during the post-rainy season. Crop Sci. 64 (5), csc2.21285–2651. doi:10.1002/csc2.21285
Kalu, S., Kulmala, L., Zrim, J., Peltokangas, K., Tammeorg, P., Rasa, K., et al. (2022). Potential of biochar to reduce greenhouse gas emissions and increase nitrogen use efficiency in boreal arable soils in the long-term. Front. Environ. Sci. 10, 914766. Article 914766. doi:10.3389/fenvs.2022.914766
Kameyama, K., Miyamoto, T., Shiono, T., and Shinogi, Y. (2012). Influence of sugarcane bagasse-derived biochar application on nitrate leaching in calcaric dark red soil. J. Environ. Qual. 41 (4), 1131–1137. doi:10.2134/jeq2010.0453
Kameyama, K., Miyamoto, T., and Shiono, T. (2024). Effects of biochar application on soil physical and chemical properties in agricultural fields: a meta-analysis. Agric. Ecosyst. and Environ. 362, 108405. doi:10.1016/j.agee.2024.108405
Kapadnis, G., and Kar, P. (2019). Determination of trace elements in aqueous urea solution (AUS 32) diesel exhaust fluid by ICP-OES using an Agilent 5800 radial view ICP-OES method in accordance with ISO 22241-2 standard. Santa Clara, CA, United States: Agilent Technologies. Available online at: https://www.agilent.com/cs/library/applications/application_adblue_5800_icp-oes_5994-1873en_us_agilent.pdf (Accessed July 1, 2025).
Khan, Z., Yang, X.-J., Fu, Y., Joseph, S., Khan, M. N., Khan, M. A., et al. (2023). Engineered biochar improves nitrogen use efficiency via stabilizing soil water-stable macroaggregates and enhancing nitrogen transformation. Biochar 5 (52), 52. doi:10.1007/s42773-023-00252-8
Lehmann, J., Cowie, A., Masiello, C. A., Kammann, C., Woolf, D., Amonette, J. E., et al. (2021). Biochar in climate change mitigation. Nat. Geosci. 14 (12), 883–892. doi:10.1038/s41561-021-00852-8
Leng, L., Li, J., Yuan, X., Li, J., Han, P., Hong, Y., et al. (2018). Beneficial synergistic effect on bio-oil production from co-liquefaction of sewage sludge and lignocellulosic biomass. Bioresour. Technol. 251, 49–56. doi:10.1016/j.biortech.2017.12.018
Leng, J., Huang, H., Li, H., Li, J., and Zhou, W. (2019). Biochar stability assessment methods: a review. Sci. Total Environ. 647, 210–222. doi:10.1016/j.scitotenv.2018.07.402
Li, S., and Tasnady, D. (2023). Biochar for soil carbon sequestration: current knowledge, mechanisms, and future perspectives. C (Basel). 9, 67. doi:10.3390/c9030067
Li, L., Zhang, Y. J., Novak, A., Yang, Y., and Wang, J. (2021). Role of biochar in improving sandy soil water retention and resilience to drought. Water 13, 407. doi:10.3390/w13040407
Li, X., Wu, D., Liu, X., Huang, Y., Cai, A., Xu, H., et al. (2024). A global dataset of biochar application effects on crop yield, soil properties, and greenhouse gas emissions. Sci. Data 11 (57), 57. doi:10.1038/s41597-023-02867-9
Liu, C., Wang, H., Tang, X., Guan, Z., Reid, B. J., Rajapaksha, A. U., et al. (2016). Biochar increased water holding capacity but accelerated organic carbon leaching from a sloping farmland soil in China. Environ. Sci. Pollut. Res. 23, 995–1006. doi:10.1007/s11356-015-4885-9
Liu, Z., Dugan, B., Masiello, C. A., and Gonnermann, H. M. (2017). Biochar particle size, shape, and porosity act together to influence soil water properties. Plos One 12 (6), e0179079. doi:10.1371/journal.pone.0179079
Liu, C., Chu, W., Li, H., Boyd, S. A., Teppen, B. J., Mao, J., et al. (2019). Quantification and characterization of dissolved organic carbon from biochars. Geoderma 335, 161–169. doi:10.1016/j.geoderma.2018.08.019
Maas, S. J., Arkin, G. F., and Rosenthal, W. D. (1987). Relationships between the areas of successive leaves on grain sorghum. Agron. J. 79 (4), 739–745. doi:10.2134/agronj1987.00021962007900040031x
Masud, M. A., Shin, W. S., Sarker, A., Septian, A., Das, K., Deepo, D. M., et al. (2023). A critical review of sustainable application of biochar for green remediation: research uncertainty and future directions. Sci. Total Environ. 904, 166813. doi:10.1016/j.scitotenv.2023.166813
Matustik, J., Hnatkova, T., and Koci, V. (2020). Life cycle assessment of biochar-to-soil systems: a review. J. Clean. Prod. 259, 120998. doi:10.1016/j.jclepro.2020.120998
Mehmood, T., Khan, A. U., Dandamudi, K. P. R., Deng, S., Helal, M. H., Ali, H. M., et al. (2022). Oil tea shell synthesized biochar adsorptive utilization for nitrate removal from aqueous media. Chemosphere 307 (Part 3), 136045. doi:10.1016/j.chemosphere.2022.136045
Mishra, R. K., Kumar, D. J. P., Narula, A., Chistie, S. M., and Naik, S. U. (2019). Production and beneficial impact of biochar for environmental application: a review on types of feedstocks, chemical compositions, operating parameters, techno-economic study, and life cycle assessment. Fuel 343, 127968. doi:10.1016/j.fuel.2023.127968
Mohan, D., Abhishek, K., Sarswat, A., Patel, M., Singh, P., and Pittman, C. U. (2018). Biochar production and applications in soil fertility and carbon sequestration – a sustainable solution to crop-residue burning in India. RSC Adv. 8 (1), 508–520. doi:10.1039/C7RA10353K
Mousavi, S. M., Srivastava, A. K., and Chera, M. (2023). Soil health and crop response of biochar: an updated analysis. Archives Agron. Soil Sci. 69 (7), 1085–1110. doi:10.1080/03650340.2022.2054998
Mukherjee, A., and Lal, R. (2013). Biochar impacts on soil physical properties and greenhouse gas emissions. Agronomy 3, 313–339. doi:10.3390/agronomy3020313
Mukherjee, A., Zimmerman, A. R., and Harris, W. (2011). Surface chemistry variations among a series of laboratory-produced biochars. Geoderma 163 (3–4), 247–255. doi:10.1016/j.geoderma.2011.04.002
Naeem, M. A., Khalid, M., Aon, M., Abbas, G., Tahir, M., Amjad, M., et al. (2017). Effect of wheat and rice straw biochar produced at different temperatures on maize growth and nutrient dynamics of a calcareous soil. Archives Agron. Soil Sci. 63 (14), 2048–2061. doi:10.1080/03650340.2017.1325468
Nan, H., Zhao, M., Leng, L., Patwardhan, P., Ren, S., Saddawi, A., et al. (2022). Minerals: a missing role for enhanced biochar carbon sequestration from the thermal conversion of biomass to the application in soil. Earth-Science Rev. 234, 104215. doi:10.1016/j.earscirev.2022.104215
Nasiri, S., Andalibi, B., Tavakoli, A., Delavar, M. A., El-Keblawy, A., and Mastinu, A. (2024). Jasmonates improve drought tolerance of Hordeum vulgare L. after biochar treatment. J. Soil Sci. Plant Nutr. 24, 2008–2022. doi:10.1007/s42729-024-01692-2
Nepal, J., Ahmad, W., Munsif, F., Khan, A., and Zou, Z. (2023). Advances and prospects of biochar in improving soil fertility, biochemical quality, and environmental applications. Front. Environ. Sci. 11, 1114752. doi:10.3389/fenvs.2023.1114752
Ngui, M. E., Lin, Y. H., Wei, I. L., Wang, C. C., Xu, Y. Z., and Lin, Y. H. (2024). Effects of the combination of biochar and organic fertilizer on soil properties and agronomic attributes of soybean (Glycine max L.). PLoS ONE 19 (9), e0310221. doi:10.1371/journal.pone.0310221
Olorunwa, O. J., Shi, A., and Barickman, T. C. (2021). Varying drought stress induces morpho-physiological changes in cowpea Vigna unguiculata (L.) genotypes inoculated with Bradyrhizobium japonicum. Plant Stress 2, 100033. doi:10.1016/j.stress.2021.100033
Pandit, N. R., Mulder, J., Hale, S. E., Martinsen, V., Schmidt, H. P., and Cornelissen, G. (2018). Biochar improves maize growth by alleviation of nutrient stress in a moderately acidic low-input Nepalese soil. Sci. Total. Environ. 625, 1380–1389. doi:10.1016/j.scitotenv.2018.01.022
Papageorgiou, A., Sinha, R., Azzi, E. S., Sundberg, C., and Enell, A. (2022). “The role of biochar systems in the circular economy: biomass waste valorization and soil remediation,” in The circular economy - Recent advances in sustainable waste management (chapter). Editor T. Zhang (London, United Kingdom: IntechOpen). doi:10.5772/intechopen.104389
Parasar, B. J., and Agarwala, N. (2025). Unravelling the role of biochar-microbe-soil tripartite interaction in regulating soil carbon and nitrogen budget: a panacea to soil sustainability. Biochar 7, 37. doi:10.1007/s42773-024-00411-5
Qiu, H., Hu, Z., Liu, J., Zhang, H., and Shen, W. (2023). Effect of biochar on labile organic carbon fractions and soil carbon pool management index. Agronomy 13 (5), 1385. doi:10.3390/agronomy13051385
R Core Team (2025). R: a language and environment for statistical computing. Vienna, Austria: R Foundation for Statistical Computing. Available online at: https://www.R-project.org/.
Rajput, V., Saini, I., Parmar, S., Pundir, V., Kumar, V., Kumar, V., et al. (2024). Biochar production methods and their transformative potential for environmental remediation. Discov. Appl. Sci. 6, 408. Article 408. doi:10.1007/s42452-024-06125-4
Ranganathan, J., Waite, R., Searchinger, T., and Hanson, C. (2018). How to sustainably feed 10 billion people by 2050 in 21 charts. Available online at: https://www.wri.org/insights/how-sustainably-feed-10-billion-people-2050-21-charts (Accessed July1, 2025).
Rodrigues, L., Budai, A., Elsgaard, L., Hardy, B., Keel, S. G., Mondini, C., et al. (2023). The importance of biochar quality and pyrolysis yield for soil carbon sequestration in practice. J. Soil Sci. 74, e13396. doi:10.1111/ejss.13396
Salesse-Smith, C. E., Wang, Y., and Long, S. P. (2024). Increasing Rubisco as a simple means to enhance photosynthesis and productivity now without lowering nitrogen use efficiency. New Phytologist: Advance online publication. doi:10.1111/nph.20298
Schmidt, H., Kammann, C., Hagemann, N., Leifeld, J., Bucheli, T. D., Sánchez Monedero, M. A., et al. (2021). Biochar in agriculture—a systematic review of 26 global meta-analyses. GCB Bioenergy13 13, 1708–1730. doi:10.1111/gcbb.12889
Shamsabad, M. M. R., Esmaeilizadeh, M., Roosta, H. R., Dehghani, M. R., Dąbrowski, P., and Kalaji, H. M. (2022). The effect of supplementary light on the photosynthetic apparatus of strawberry plants under salinity and alkalinity stress. Sci. Rep. 12, 13257. doi:10.1038/s41598-022-17377-8
Shao, Y., Li, S., Gao, L., Sun, C., Hu, J., Ullah, A., et al. (2021). Magnesium application promotes Rubisco activation and contributes to high-temperature stress alleviation in wheat during the grain filling. Front. Plant Sci. 12, 675582. doi:10.3389/fpls.2021.675582
Singh, H., Northup, B. K., Rice, C. W., and Prasad, P. V. V. (2022). Biochar applications influence soil physical and chemical properties, microbial diversity, and crop productivity: a meta-analysis. Biochar 4 (8), 8. doi:10.1007/s42773-022-00138-1
Stickler, F. C., Wearden, S., and Pauli, A. W. (1961). Leaf area determination in grain sorghum. Agron. J. 53 (3), 187–188. doi:10.2134/agronj1961.00021962005300030018x
Tan, Z., Zou, J., Zhang, L., and Huang, Q. (2018). Morphology, pore size distribution, and nutrient characteristics in biochars under different pyrolysis temperatures and atmospheres. J. Material Cycles Waste Manag. 20, 1036–1049. doi:10.1007/s10163-017-0666-5
Thakur, D., and Teja, S. (2024). “The role of biochar in improving soil quality and horticulture crop performance,” in Advances in postharvest and analytical Technology of horticulture crops. Editors M. Thakur,, and T. Belwal (Singapore: Springer). doi:10.1007/978-981-97-7247-6_9
Tomczyk, A., Sokołowska, Z., and Boguta, P. (2020). Biochar physicochemical properties: pyrolysis temperature and feedstock kind effects. Rev. Environ. Sci. Biotechnol. 19, 191–215. doi:10.1007/s11157-020-09523-3
Troeh, F. R., Hobbs, J. A., and Soil Donahue, R. L. (2004). Soil and water conservation for productivity and environmental protection. 4th ed. Upper Saddle River, New Jersey, USA: Prentice Hall.
Ullah, M. S., Malekian, R., Randhawa, G. S., Gill, Y. S., Singh, S., Esau, T. J., et al. (2024). The potential of biochar incorporation into agricultural soils to promote sustainable agriculture: insights from soil health, crop productivity, greenhouse gas emission mitigation and feasibility perspectives—a critical review. Rev. Environ. Sci. Bio/Technology 23, 1105–1130. doi:10.1007/s11157-024-09712-4
UN (2023). The sustainable development goals report: special edition – towards a rescue plan for people. United Nations (UN). New York, NY, United States: General Assembly Economic and Social Council. Available online at: https://digitallibrary.un.org/record/4014344.
USDA (2015). Climate change, global food security, and the U.S. food system. Washington, DC, United States: United States Department of Agriculture. Available online at: https://www.usda.gov/sites/default/files/documents/CCFS_Executive_Summary.pdf (Accessed July 1, 2025).
Verheijen, F. G. A., Jeffery, S., Bastos, A. C., van der Velde, M., and Diafas, I. (2009). Biochar application to soils: a critical scientific review of effects on soil properties, processes and functions (EUR 24099 EN). Luxembourg: Office for Official Publications of the European Communities. doi:10.2788/472
Waheed, A., Xu, H., Qiao, X., Aili, A., Yiremaikebayi, Y., Haitao, D., et al. (2025). Biochar in sustainable agriculture and climate mitigation: mechanisms, challenges, and applications in the circular bioeconomy. Biomass Bioenergy 193, 107531. doi:10.1016/j.biombioe.2024.107531
Wang, Y. (2024). Improving photosynthetic efficiency in fluctuating light to enhance yield of C3 and C4 crops. Crop Environ. 3 (4), 184–193. doi:10.1016/j.crope.2024.06.003
Wang, J. J., Provin, T., and Zhang, H. (2014). “Measurement of soil salinity and sodicity,” in Soil test methods from the southeastern United States. Southern cooperative series bulletin. Editors F. J. Sikora,, and K. P. Moore, 419.
Wang, J., Xiong, Z., and Kuzyakov, Y. (2016). Biochar stability in soil: meta-analysis of decomposition and priming effects. GCB Bioenergy 8, 512–523. doi:10.1111/gcbb.12266
Wang, L., Deng, J., Yang, X., Hou, R., and Hou, D. (2023). Role of biochar toward carbon neutrality. Carbon Res. 2 (2), 2. doi:10.1007/s44246-023-00035-7
Weber, K., and Quicker, P. (2018). Properties of biochar. Fuel 217, 240–261. doi:10.1016/j.fuel.2017.12.054
Wiedemeier, D. B., Abiven, S., Hockaday, W. C., Keiluweit, M., Kleber, M., Masiello, C. A., et al. (2015). Aromaticity and degree of aromatic condensation of char. Org. Geochem. 78, 135–143. doi:10.1016/j.orggeochem.2014.10.002
Wong, J. W. C., and Ogbonnaya, U. O. (2021). Biochar porosity: a nature-based dependent parameter to deliver microorganisms to soils for land restoration. Environ. Sci. Pollut. Res. 28, 46894–46909. doi:10.1007/s11356-021-14803-8
Woolf, D., Lehmann, J., Cowie, A., Cayuela, M. L., Whitman, T., and Sohi, S. (2018). “Biochar for climate change mitigation: navigating from science to evidence-based policy,” in Soil and climate. Editors R. Lal,, and B. A. Stewart (Boca Raton: CRC Press), 219–248.
Xia, H., Riaz, M., Babar, S., Yan, L., Li, Y., Wang, X., et al. (2023). Assessing the impact of biochar on microbes in acidic soils: alleviating the toxicity of aluminum and acidity. J. Environ. Manag. 345, 118796. doi:10.1016/j.jenvman.2023.118796
Xiao, X., Chen, Z., and Chen, B. (2016). H/C atomic ratio as a smart linkage between pyrolytic temperatures, aromatic clusters and sorption properties of biochars derived from diverse precursory materials. Sci. Rep. 6, 22644. doi:10.1038/srep22644
Xiao, X., Chen, B., Chen, Z., Zhu, L., and Schnoor, J. L. (2018). Insight into multiple and multilevel structures of biochars and their potential environmental applications: a critical review. Environ. Sci. and Technol. 52 (9), 5027–5047. doi:10.1021/acs.est.7b06487
Xiong, D., Chen, J., Yu, T., Gao, W., Ling, X., Li, Y., et al. (2015). SPAD-based leaf nitrogen estimation is impacted by environmental factors and crop leaf characteristics. Sci. Rep. 5, 13389. doi:10.1038/srep13389
Xu, H., Cai, A., Wu, D., Liang, G., Xiao, J., Xu, M., et al. (2021). Effects of biochar application on crop productivity, soil carbon sequestration, and global warming potential controlled by biochar C:N ratio and soil pH: a global meta-analysis. Soil Tillage Res. 213, 105125. doi:10.1016/j.still.2021.105125
Yaashikaa, P. R., Senthil Kumar, P., Varjani, S., and Saravanan, A. (2020). A critical review on the biochar production techniques, characterization, stability, and applications for circular bioeconomy. Biotechnol. Rep. 27, e00570. doi:10.1016/j.btre.2020.e00570
Yameen, M. Z., Naqvi, S. R., Juchelkova, D., and Khan, M. N. A. (2024). Harnessing the power of functionalized biochar: progress, challenges, and future perspectives in energy, water treatment, and environmental sustainability. Biochar 6, 25. doi:10.1007/s42773-024-00316-3
Yuan, X., Wang, J., Deng, S., Suvarna, M., Wang, X., Zhang, W., et al. (2022). Recent advancements in sustainable upcycling of solid waste into porous carbons for carbon dioxide capture. Renew. Sustain Energy Rev. 162, 112413. doi:10.1016/j.rser.2022.112413
Zandonadi, C. H. S., Albuquerque, C. J. B., and de Freitas, R. S. (2016). Chlorophyll index (SPAD) and macronutrients relation and productive performance of sorghum hybrids in different sowing dates. AJCS 10 (4), 546–555. doi:10.21475/ajcs.2016.10.04.p7354x
Zhang, M., Riaz, M., Zhang, L., El-desouki, Z., and Jiang, C. (2019). Biochar induces changes to basic soil properties and bacterial communities of different soils to varying degrees at 25 mm rainfall: more effective on acidic soils. Front. Microbiol. 10, 1321. doi:10.3389/fmicb.2019.01321
Zhang, H., Liao, W., Zhou, X., Shao, J., Chen, Y., Zhang, S., et al. (2022). Co-effect of pyrolysis temperature and potassium phosphate impregnation on characteristics, stability, and adsorption mechanism of phosphorus-enriched biochar. Bioresour. Technol. 344, 126273. doi:10.1016/j.biortech.2021.126273
Zheng, W., Holm, N., and Spokas, K. A. (2016). “Research and application of biochar in North America,”. Agricultural and environmental applications of biochar: advances and barriers. Editors M. Guo, G. He, and S. M. Uchimiya (Madison, WI, United States: SSSA Special Publications), 63, 475–494. doi:10.2136/sssaspecpub63.2014.0053
Zhu, X., Chen, B., Zhu, L., and Xing, B. (2017). Effects and mechanisms of biochar–microbe interactions in soil improvement and pollution remediation: a review. Environ. Pollut. 227, 98–115. doi:10.1016/j.envpol.2017.04.032
Zhu, Z., Zhang, Y., Tao, W., Zhang, X., Xu, Z., and Xu, C. (2025). The biological effects of biochar on soil’s physical and chemical characteristics: a review. Sustainability 17 (5), 2214. doi:10.3390/su17052214
Keywords: application rate, biochar, nutrients, soil carbon, sorghum
Citation: Shembo AK, Geremew A, Guthrie DM, Elder D, Woldesenbet S, Grady T, Shrestha A, Amarasekara A, Ray RL, Kuloyo O, Davies C, Mugundan J and Carson L (2025) Linking biochar physico-chemical traits to sorghum growth and soil carbon dynamics. Front. Environ. Sci. 13:1644821. doi: 10.3389/fenvs.2025.1644821
Received: 10 June 2025; Accepted: 22 September 2025;
Published: 13 October 2025.
Edited by:
Jose Antonio Rodriguez Martin, Instituto Nacional de Investigación y Tecnología Agroalimentaria (INIA), SpainReviewed by:
Biswajit Samal, University of Wisconsin-Madison, United StatesMurad Muhammad, Chinese Academy of Sciences (CAS), China
Copyright © 2025 Shembo, Geremew, Guthrie, Elder, Woldesenbet, Grady, Shrestha, Amarasekara, Ray, Kuloyo, Davies, Mugundan and Carson. This is an open-access article distributed under the terms of the Creative Commons Attribution License (CC BY). The use, distribution or reproduction in other forums is permitted, provided the original author(s) and the copyright owner(s) are credited and that the original publication in this journal is cited, in accordance with accepted academic practice. No use, distribution or reproduction is permitted which does not comply with these terms.
*Correspondence: Laura Carson, bGVjYXJzb25AcHZhbXUuZWR1