 Hongqi Chen
 Man-Keun Kim
 Weimin Jiang
 Yu Zhang
- 1College of Economics and Management, Nanjing Forestry University, Nanjing, Jiangsu, China
- 2Department of Applied Economics, Utah State University, Logan, UT, United States
- 3Yangtze Industrial Development Institute, Nanjing University, Nanjing, Jiangsu, China
Introduction: Examining the impact of household income on carbon emissions is pivotal for linking the national strategy of common prosperity with the country's dual carbon goals.
Methods: We develop a partially closed input-output model differentiating urban and rural household income and consumption, and explore the impact of household income on carbon emissions.
Results and discussion: The results show that from 1994 to 2018, the total carbon emissions induced by household income increased, while the carbon emissions per unit of household income decreased. In 2018, carbon emissions caused by household income accounted for 11.5% of China’s total carbon emissions (1,624 Mt). Among them, carbon emissions caused by household income in urban areas were 5.6 times that in rural areas. Apart from the energy sector, carbon emissions caused by household income are mainly concentrated in metal manufacturing, transportation, mining, agriculture, and food and tobacco industries, and carbon emissions show continuous growth trend. A comparison of open and partially closed input-output models shows that the open input-output model would over-estimate the carbon emissions caused by household income. This study provides important reference for the formulation of carbon emission reduction policies, the optimization of energy structures, and the balance between residents’ income growth and the achievement of dual carbon goals by region.
1 Introduction
Human activities have significantly contributed to global climate change (Forster et al., 2024). The burning of fossil fuels has led to the emission of greenhouse gases, primarily CO2, driving global warming (Shindell and Smith, 2019). This, in turn, has caused rising sea levels, droughts, and floods, posing severe risks to both biodiversity and human wellbeing (Garg et al., 2024). In response, many countries have implemented measures such as adopting clean energy alternatives, enhancing forest carbon sinks, and promoting international carbon emissions trading (Raman et al., 2024). However, emission reduction efforts alone are insufficient, as they often overlook the contributions of economic activities such as production and consumption to carbon emissions (Cui et al., 2021). Previous studies have confirmed that, in addition to production activities, household demand and consumption behaviors significantly influence carbon emissions (Lee et al., 2023). Moreover, according to the Keynesian consumption theory, household demand and consumption behavior are primarily driven by household income (Friedman, 1957; Ando and Modigliani, 1963). As Figure 1 illustrates, as per capita household income increases, the carbon emissions show a corresponding upward trend. This raises the question: is there a relationship between household income and carbon emissions? Indeed, numerous studies have confirmed the positive correlation between household income and carbon emissions (Tian K. et al., 2025). This effect, however, varies regionally. Household income in eastern China is generally higher than in the western regions, leading to a significantly larger carbon emissions in the eastern regions (Liang et al., 2023). Additionally, the widening urban-rural income gap results in a substantially higher carbon emissions for urban residents compared to rural residents (Wang et al., 2024). However, the aforementioned studies are all based on a causal perspective and do not further quantify the impact of household income on carbon emissions.
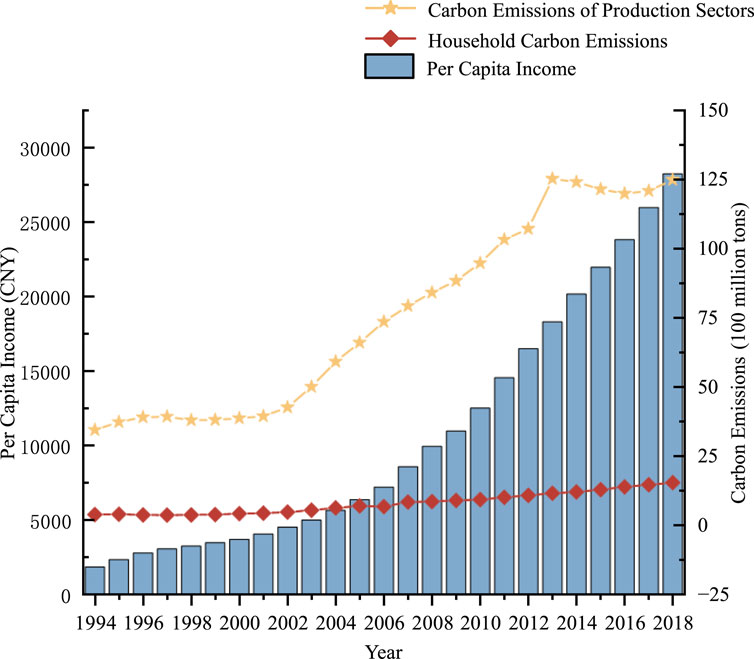
Figure 1. Changes in Household Income and Carbon Emissions from 1994 to 2018. Notes: per capita income and carbon emissions are calculated by the authors based on data from the China Statistical Yearbook and the China Energy Statistical Yearbook. “Carbon emissions of production sectors” are defined as the total CO2 emissions attributable to the direct and indirect energy consumption associated with the production of final goods by production sectors. “Household carbon emissions” are defined as the total CO2 emissions attributable to households’ direct and indirect energy consumption.
To address this, this study proposes the concept of “income carbon footprint” to quantify carbon emissions directly or indirectly induced by household income. Unlike carbon emissions as an aggregate concept, carbon footprint quantifies the carbon emissions directly or indirectly induced by activities or accumulated throughout a product’s life cycle (Shi and Yin, 2021). The income carbon footprint refers to the total (direct and indirect) carbon emissions caused by household income.
Extensive research has adopted open input-output models to estimate carbon footprints of the production sector (Li et al., 2025; Liu and Zhou, 2025; Tian P. et al., 2025), as well as the driving effect exerted by household consumption on it (Liu et al., 2022; Yu et al., 2021). However, these studies uniformly assume that the production sectors as a closed economic system, and no inherent linkage exists between the household sector and the production sector. Clearly, this assumption is restrictive, By comparison, the partially closed input-output model establishes an inherent linkage between the household and production sectors by partially endogenizing the former within the latter (Chen et al., 2010). In light of this, scholars have employed the partially closed model to investigate the quantitative relationship between the household sector and economic growth, such as the employment effects of industrial development (Bai, 2020), evaluate the impact of national policies on economic growth (Chen et al., 2010), and simulate the effects of consumption expansion on GDP growth (Chen et al., 2016). Attention has also been devoted to the household sector as a whole in driving carbon emissions (Bamisile et al., 2020; Liu et al., 2019; Pang et al., 2022; Rodrigues et al., 2020; Shi et al., 2020), as well as to individual variables, such as income (Bamisile et al., 2020; Liu et al., 2019; Shi et al., 2020) and regional distribution (Long et al., 2018; Wang et al., 2020), in their interrelationship with carbon emissions. Despite the scientific validity of the partially closed model in examining the relationship between the household and production sectors, its faces three main challenges: (1) The partially closed model has not been further developed to quantify the income carbon footprint; (2) While numerous studies recognize that open model serve as the foundation for constructing the partially closed model, current research on the partially closed models has not yet compared the differences in results between open and closed models; (3) Given the significant urban-rural disparities in income structure, consumption preferences, and population size in China, current studies have failed to distinguish between urban and rural areas in their analyses. To address these gaps, this study employs a time-series competitive input-output table from 1994 to 2018 (Zhang et al., 2021), drawing on Keynesian consumption theory. Compared with the benchmark tables published by the Chinese government, the table used in this study provides continuous annual series and incorporates adjustments for changes in monetary value, making it more suitable for long-span time-series analysis. By distinguishing between endogenous and exogenous household income and consumption (Chen et al., 2010), we develop a partially closed input-output model that accounts for urban and rural household income and consumption. The model is then applied to quantify the carbon footprint associated with urban and rural household income.
The contributions of this study are as follows: First, it introduces the concept of the “income carbon footprint” and constructs a partially closed model that differentiates between urban and rural household income, allowing for a more precise estimation of carbon emissions induced by income, thereby providing empirical references for China to achieve the goals of residents’ income growth and carbon peaking and carbon neutrality. Second, the study quantifies the income carbon footprint from 1994 to 2018, further breaking it down into urban and rural household income carbon footprints. A comparative analysis is conducted to examine the evolution trends and structural differences of these footprints, providing policy implications for carbon reduction from the consumption perspective. Third, the study compares results derived from the open model and the partially closed model, addressing gaps in previous research and demonstrating the scientific validity and practical applicability of the partially closed model in carbon footprint accounting.
2 Methods and data
2.1 From the open model to the partially closed mode
Although previous research has demonstrated the validity and accuracy of the open model for calculating the carbon footprint of production sectors, two key limitations remain: First, the model treats the production system as fully closed. Value added incorporates partial household income, while final demand includes household consumption. Both are defined as exogenous variables determined by factors external to production. Chen et al. (2010) demonstrate that this structure severs the inherent production-income-consumption-production cycle between household and production sectors. Second, for carbon footprint accounting applications, this disconnection causes the model to entirely ignore feedback effects from changes in household consumption behavior on production activities and associated carbon emissions. Consequently, carbon footprints calculated through the open model fail to capture actual impacts of household income and consumption on production sectors via internal economic system linkages. In contrast, the partially closed model establishes an analytical framework better aligned with intrinsic economic system connections. Its conceptual foundation recognizes two principles: First, as providers of production factors like labor and consumers of final products, households are not fully independent from the production system. Second, consistent with Keynesian consumption theory, households maintain basic consumption without income from production activities. Thus, not all consumption is directly governed by current production (Chen et al., 2010). This model therefore enables accounting and research on carbon footprints linked to household income.
Compared to the open model, the partially closed model demonstrates three key comparative advantages in carbon footprint accounting: First, its theoretical foundation is more robust (Chen et al., 2010; Chen et al., 2016). The partial endogenization of consumption better aligns with core consumption theories—Keynesian consumption theory and life-cycle permanent income hypothesis (Friedman, 1957; Ando and Modigliani, 1963)—which state that consumption is not entirely determined by current income. Second, it captures feedback mechanisms by fully incorporating the impact of household consumption, particularly the portion regulated by production activities (Chen et al., 2010; Chen et al., 2015), on production processes and associated carbon emissions. Third, it generates more accurate and specific accounting results. The findings of Chen et al. (2010), who compared the open and partially closed models and reported that the latter produces more accurate outcomes when analyzing the relationship between the household and production sectors. In this study, Section 2.2 will provide theoretical justification for these advantages, while Section 3.4 will validate them through comparative analysis of accounting results. Nevertheless, this does not mandate universal adoption of the partially closed model. When research focuses exclusively on closed production systems without addressing inherent household-sector linkages, the open model remains the appropriate accounting approach.
No input-output tables for the partially closed model have been compiled by existing research institutions or government agencies. Consequently, this model must be constructed based on the open model. As illustrated in Figure 2, the model construction requires the following steps: First, the household sector is treated as a production sector. Payments to the household sector from production sectors recorded in the value-added row—specifically, compensation of employees and operating surplus—along with the portion of consumption modulated by production activities, are endogenized into the production system. Second, variables for household exogenous income and household savings are introduced to ensure completeness of household sector income. The detailed construction methodology is elaborated in Section 2.2. Accounting methods for relevant ratios and variables are presented in Section 2.3.
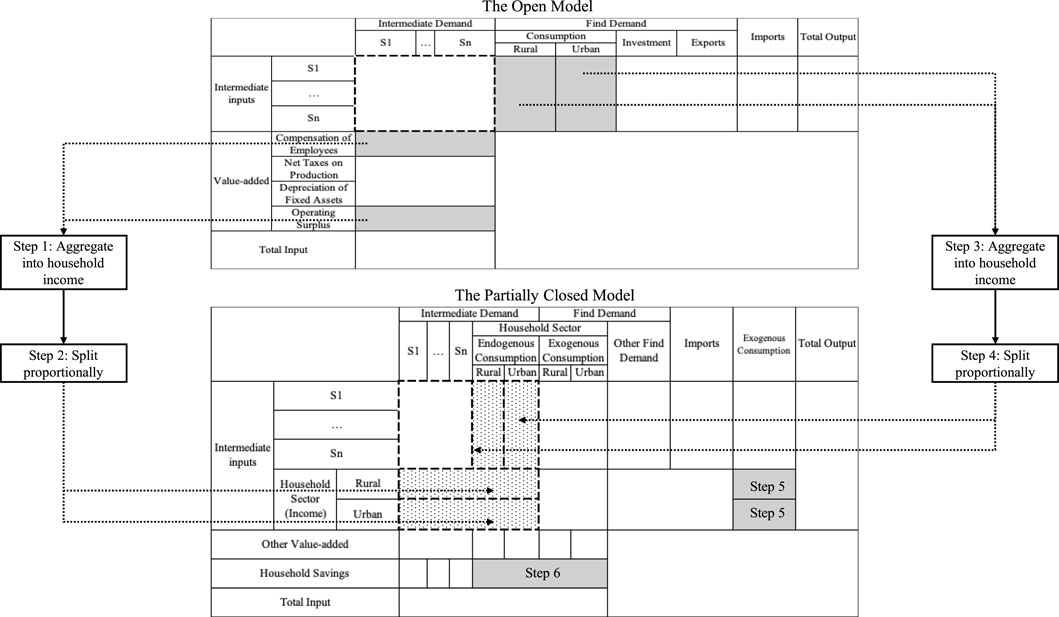
Figure 2. From the open model to the partially closed mode.
2.2 Partially closed input-output model differentiating urban and rural household income and consumption
Building upon the open input-output table, this study constructs a partially closed input-output model that differentiate urban and rural household income and consumption, as shown in Table 1. Specifically, the column representing household consumption in the final demand section of the open input-output table is disaggregated into endogenous and exogenous consumption. This consumption is further differentiated into urban and rural household sectors. A column for exogenous income is introduced. Compensation of employees and operating surplus in the value-added section are combined to form endogenous income. Both endogenous and exogenous income are then disaggregated into urban and rural household sectors. Simultaneously, net production taxes and depreciation of fixed assets are consolidated into a single line labeled “other value-added”. In addition, following the approach of Chen et al. (2010) and Chen et al. (2016), the difference between household sector income and consumption is defined as household savings. Through these adjustments, a partially closed input-output table is constructed. The accounting procedures for various types of income and consumption will be elaborated in detail in Section 2.3.
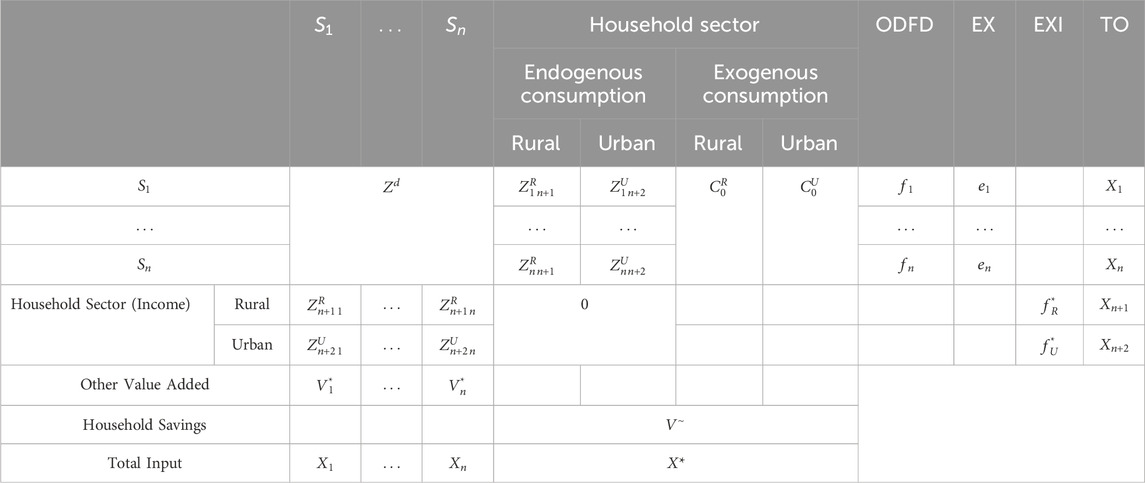
Table 1. Input-output partially closed model based on the differentiation of urban and rural household income and consumption1.
Furthermore, Table 1 is reorganized into a matrix format. The intermediate flow matrix
where
Based on
Let
Therefore, the new partially closed model can be expressed as:
Performing an identity transformation on both sides of the equation leads to Equation 4 is obtained:
To clarify the inverse matrix operation, this study partitions the inverse matrix as shown in Equation 5:
Here,
where
By substituting Equation 6 into Equations 4, 7 is obtained:
Equation 7 illustrates the relationship between exogenous variables and total output. and total income within the partially closed model, providing a foundation for further research. Unlike the open model, the partially closed model incorporates the impact of exogenous household income on both total output and household income. This adjustment strengthens the model’s alignment with economic principles and real-world conditions. Moreover, by separating the total output driven by final demand into components that are influenced and uninfluenced by household income, the model improves the accuracy of the accounting results.
Let
After rearranging the right-hand side of the equation, the matrix is expressed as:
In matrix (9), elements ①-③collectively constitute the carbon emissions of production sectors, while elements ④-⑨collectively constitute the carbon emissions from household consumption. Elements ②, ③, ⑤, ⑥, ⑧, and ⑨ represent the carbon footprint associated with household income. Specifically, ② corresponds to the carbon footprint of the production sector induced by rural household income, ⑤ denotes the carbon footprint of rural household living driven by rural household income, and ⑧ represents the carbon footprint of urban household living induced by rural household income. Collectively, these elements (②, ⑤, and ⑧) are referred to as the “carbon footprint of rural household income”. Similarly, ③ represents the carbon footprint of the production sector induced by urban household income, ⑥ denotes the carbon footprint of rural household living induced by urban household income, and ⑨ represents the carbon footprint of urban household living induced by urban household income. These elements (③, ⑥, and ⑨) are collectively referred to as the “carbon footprint of urban household income”.
It is evident that employing an open model to estimate the carbon footprint of the household sector yields inaccurate results, whether for the consumption carbon footprint or the income carbon footprint proposed in this study. This inaccuracy stems from two primary reasons. First, the open model neglects the carbon footprint of household consumption。This model assumes a completely closed production system, restricting calculated carbon emissions to production sectors only (i.e., the sum of elements ①-③), thereby excluding elements ④-⑨. Second, the intrinsic linkage between the household sector and the production system is overlooked. Calculations based on Equation 9 of the partially closed model reveal that the household sector directly drives carbon emissions within the production system solely through elements ② and ③. However, previous studies utilizing the open model have erroneously ascribed elements①-③to household-driven emissions (Kim and Tromp, 2021). This error arises from the incomplete representation of the household sector in model construction and the failure to partially endogenize it within the production system.
The derivation of Equations 1–9 reveals two key findings: First, there is a cross-effect between household income and the carbon footprint of household living. Specifically, urban household income contributes to the rural household living carbon footprint (⑥), while rural household income similarly contributes to the urban household living carbon footprint (⑧). Second, the carbon footprint of household income—defined as “the total CO2 emissions directly or indirectly caused or accumulated over the life cycle of a product”—is primarily induced by exogenous income. Although endogenous income plays a role in the process by which final demand drives carbon footprints, it does not directly or indirectly contribute to carbon emissions. Therefore, elements ①, ④, and ⑦ are excluded from the calculation of the income carbon footprint in this study.
2.3 Data sources and processing
To develop the partially closed input-output model differentiating urban and rural household income and consumption, three categories of data need to be prepared: household endogenous consumption coefficients, endogenous and exogenous income, sectoral carbon emission.
According to the study of Chen et al. (2010) and the Keynesian theory, exogenous consumption (termed “variable consumption”) refers to consumption directly tied to the production sector, arising from factors such as consumption preferences and income expectations to satisfy individualized needs. It is influenced by the output of the production sector and, in turn, exerts some impact on it; endogenous consumption (referred to here as “invariant consumption”) is linked to production only externally, serves basic household subsistence requirements, and remains unaffected by fluctuations in production and income dynamics. This study employs the household endogenous consumption coefficients to distinguish. Endogenous income is classified into wage income and operating income, and exogenous income is classified into property income and transfer income.
The data processing in this study proceeded through three main steps. First, STATA 18.0 was used to compute Equation 10 in Section 2.3.1, yielding annual exogenous and endogenous consumption data. The method outlined in Section 2.3.2 was then applied to derive annual endogenous and exogenous income data. Second, based on the income and consumption data and following the procedure illustrated in Figure 2, annual input–output tables were disaggregated in Excel to produce the locally closed–model tables. These tables were imported into MATLAB R2024a to compute Equations 1–7. Third, MATLAB R2024a was employed to compute Equations 11, 12 using their corresponding data to obtain carbon emission figures. On this basis, Equations 8, 9 were further computed in the same software to generate the results required by this paper.
2.3.1 Household endogenous consumption coefficients
This study adopts the approach proposed by Ren and Song (2021) and applies the Keynesian consumption function (see Equation 10), to quantitatively estimate both types of consumption:
where
2.3.2 Endogenous and exogenous income
Endogenous income has been endogenized in the row vectors of compensation of employees (termed “wage income”) and operating surplus (termed “operating income”) into the value-added. This study categorizes endogenous household income by rural and urban areas using historical data from the China Statistical Yearbook (National Bureau of Statistics of China, 2025a). First, multiplying per capita wage income and per capita operating income for rural and urban residents by the respective total population of each group, the total wage income and total operating income of rural and urban residents for each year can be calculated. Second, calculating the proportion of rural residents’ wage income to total wage income. This proportion is then multiplied by the “compensation of employees” in the input-output table to determine the amount of “compensation of employees” attributable to rural residents. Using the same method, the total compensation allocated to urban residents and the total operating surplus attributable to both rural and urban residents can be obtained. Third, summing the total compensation of employees and the total operating surplus for rural residents, their total endogenous income can be derived. Similarly, the total endogenous income of urban residents is calculated in the same manner.
Since household exogenous income has minimal direct connection to the production sector, it not explicitly recorded in the input-output table. Their values are estimated based on data from the China Statistical Yearbook. First, multiplying the per capita property income and transfer income of rural and urban residents, as reported in the China Statistical Yearbook, by their respective total populations to obtain the total property income and total transfer income. Second, dividing the sum of property income and transfer income by the sum of wage income and operating income, we derive the ratio of exogenous income to endogenous income. Finally, this ratio is multiplied by the total endogenous income for each group in the input-output table to calculate the respective exogenous income totals for rural and urban residents.
2.3.3 Sectoral carbon emission
The China Statistical Yearbook categorizes energy consumption data by production sectors and household sectors, providing detailed records of the standard coal equivalent (SCE) for various energy types over different years. By calculating the CO2 emissions associated with the total SCE consumption of each industry, the sectoral carbon emissions can be derived. The calculation method is outlined in Equation 11:
where
Where Q represents the carbon content of the j-th type of energy;
3 Results
3.1 Carbon footprint of household income in China (1994–2018)
This study constructs a partially closed input-output model, using Equations 1–9, to distinguish between urban and rural household income and consumption for the period 1994–2018. The total carbon footprint of household income for each year is derived from the sum of the results from ②, ③, ⑤, ⑥, ⑧, and ⑨ in Equation 9. The total carbon footprint of household income in China from 1994 to 2018, as well as its annual variation, are presented in Figures 3A, C. Figures 3A, D present the statistical results of per capita exogenous income and its annual variation for the same period. Finally, Figure 3B calculates the carbon footprint per unit of per capita exogenous income from 1994 to 2018, referred to as “household income carbon efficiency”.
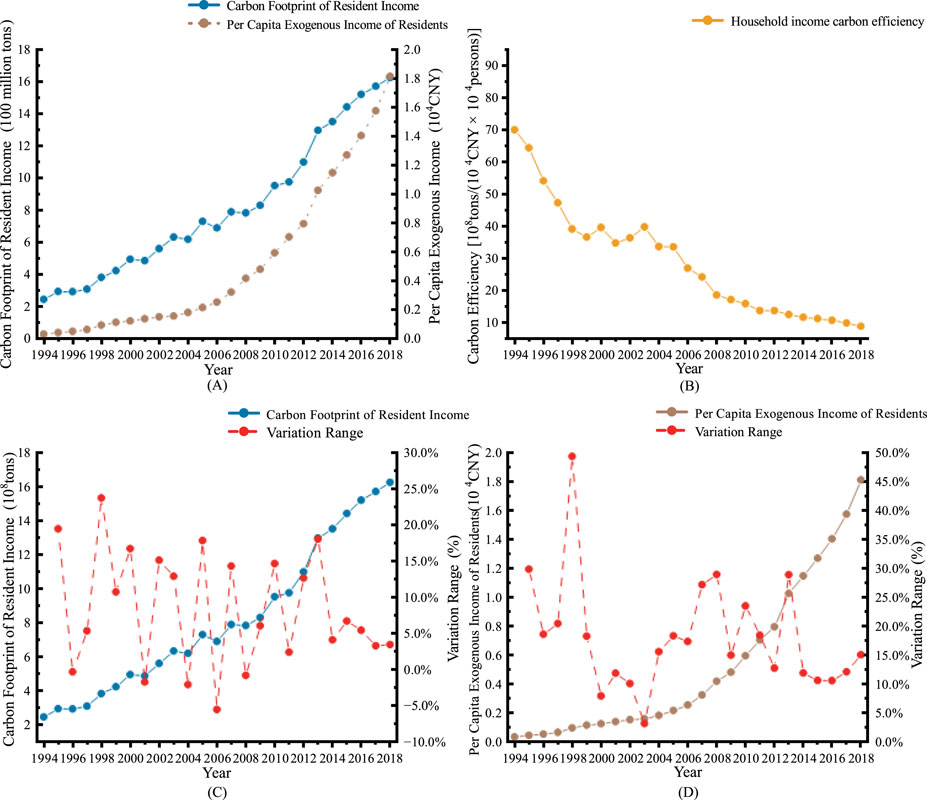
Figure 3. Total household income and carbon footprint in China from 1994 to 2018 and their evolutionary trends. (A) Shows a rise in the carbon footprint and per capita exogenous income. (B) Depicts a decline in household income carbon efficiency. (C) The trends and fluctuation ranges of the carbon footprint are presented. (D) The trends and fluctuation ranges of the per capita exogenous income.
As shown in Figure 3A, the total carbon footprint of household income in China has grown continuously and significantly, increasing from 250 million tons in 1994 to 1.62 billion tons in 2018, representing a 548% increase. Figure 3C demonstrates that this growth follows cyclical fluctuations: from 1994 to 1998, the carbon footprint of household income grew rapidly, with a peak growth rate of 23.7% in 1998; from 1999 to 2013, the annual growth rate remained above 10% in most years; and from 2014 to 2018, the growth rate slowed, with the highest rate not exceeding 7%. However, decreases of up to 6% were observed in 1996, 2001, 2004, 2006, and 2008.
The continuous increase in household income has driven the steady growth of the total carbon footprint of household income, with cyclical variations. As shown in Figure 3D, per capita exogenous income has experienced sustained and significant growth, rising from 0.04 million yuan in 1994 to 1.8 million yuan in 2018, representing a 4,400% increase. This growth also follows a cyclical pattern: from 1994 to 1998, annual growth rates mostly exceeded 20%, peaking at 49.4% in 1998; from 1999 to 2003, the growth rate slowed; from 2004 to 2013, per capita exogenous income maintained an annual growth rate of over 15% in most years; and from 2014 to 2018, the growth rate decelerated again, but remained above 10%.
As household income and the total carbon footprint of household income have continuously increased, household income carbon efficiency has steadily decreased. As indicated in Figure 3B, it declines from 6.99 billion tons per (million yuan × million people) in 1994 to 0.9 billion tons per (million yuan × million people) in 2018, an 87% reduction. This decline also exhibits cyclical patterns: a rapid decrease from 1994 to 1998; fluctuations around 3.743 billion tons per (million yuan × million people) between 1999 and 2003, with no clear downward trend; a noticeable yet unstable decline from 2004 to 2013; and a steady decrease from 2014 to 2018.
The results indicate that the continuous increase in per capita exogenous income among Chinese residents has driven the persistent rise in the total carbon footprint of household income. Simultaneously, household income carbon efficiency has gradually declined, suggesting that China is transitioning toward a cleaner development model.
3.2 Composition and trend of China’s household income carbon footprint (1994–2018)
Building on the calculation of the total household income carbon footprint, this study further decomposes the income carbon footprint by analyzing the scale and evolutionary trends of components (②, ③, ⑤, ⑥, ⑧, ⑨) as presented in Equation 9. The results are shown in Figure 4. There are three key differences in the scale of various income carbon footprint components:
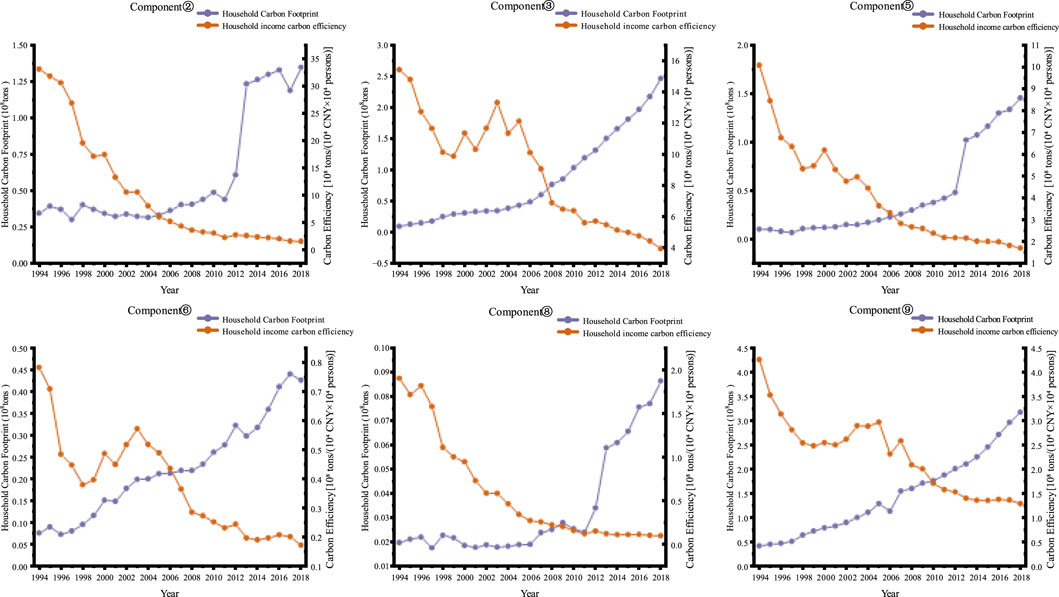
Figure 4. Decomposition and evolutionary trends of income carbon footprint from 1994 to 2018.
First, absolute scale: The carbon footprint induced by urban household income related to urban residents’ daily life (component ⑨) is consistently larger than that of the other components. For instance, in 2018, the scale of component ⑨ reached 318 million tons, surpassing the total of components ②, ③, ⑤, ⑥, and ⑧, which were 135 million tons, 246 million tons, 145 million tons, 43 million tons, and 9 million tons, respectively.
Second, urban-rural differences in the interaction effects: The driving effect of urban household income on carbon footprints is greater than that of rural household income. In 2018, urban household income induced 42.57 million tons of rural residents’ living carbon footprint, accounting for 22.63% of the total rural residential carbon footprint and 11.82% of the total carbon footprint induced by urban household income. Conversely, rural household income induced only 8.63 million tons of urban residential carbon footprint, accounting for 2.64% of the urban residential carbon footprint and 5.59% of the total residential carbon footprint induced by rural household income. This pattern holds across all years, with urban household income consistently exerting a greater influence on rural residential carbon footprints than reverse.
Third, impact on the carbon footprint of the production sector: Urban household income has a stronger driving effect on the carbon footprint of the production sector compared to rural household income. Specifically, component ③ is larger in scale than component ②. For instance, in 2018, urban household income drove 246 million tons of carbon footprint in the production sector, whereas rural household income drove only 135 million tons.
The growth trend of the rural household income carbon footprint (components ②, ⑤, ⑧) exhibits two main characteristics:
First, stable growth and explosive increase: From 1994 to 2011, growth was relatively stable. However, between 2011 and 2013, it experienced a sharp increase, followed by a period of rapid yet stable growth from 2013 to 2018. Between 1994 and 2011, component ② increased from 35 million tons to 44 million tons, a growth of 25.7%; component ⑤ rose from 11 million tons to 43 million tons, an increase of 290.91%; and component ⑧ grew from 1.9 million tons to 2.4 million tons, an increase of 26.32%. By 2013, the scale of components ②, ⑤, and ⑧ had surged to 123 million tons, 102 million tons, and 5.9 million tons, respectively, representing growth rates of 251.43%, 827.27%, and 210.53%, respectively, compared to 1994. The primary driver of this “explosive” growth was the sharp increase in per capita exogenous income among rural residents. According to the China Statistical Yearbook, rural per capita exogenous income grew from 83.72 yuan in 1994 to 929.92 yuan in 2011, a 1,010.75% increase, and further surged to 1,842.24 yuan by 2013, a 2099.39% increase relative to 1994.
Second, modest increase in the total carbon footprint: Despite the “explosive” growth in a single income component, the total household income carbon footprint showed only a modest increase. As shown in Figure 3, the total household income carbon footprint rose from 980 million tons in 2011 to 1.3 billion tons in 2013, a rise of 320 million tons (32.65%). The rural income carbon footprint contributed to 142 million tons, accounting for 44.4% of the total increase. However, between 2009-2011 and 2013-2015, the contribution of the rural income carbon footprint to the total increase in household income carbon footprint was only 4.7% and 14.8%, respectively.
The urban household income carbon footprint (components ③, ⑥, ⑨) shows a consistent upward trend, but the evolution of each component follows different paths. Component ③ exhibited slow growth before 2007, followed by stable and rapid growth afterward. Component ⑥ displayed fluctuating growth patterns from 1994 to 2018. Component ⑨ only experienced a decline in 2006, maintaining a steady growth trend in all other years.
The carbon efficiency of each income component has declined, with notable urban-rural differences: Rural household income carbon efficiency (components ②, ⑤, ⑧) followed a “rapid initial decline, followed by stabilization” pattern. From 1994 to 2004, the decline was relatively fast, while from 2005 to 2018, the rate of decline slowed and gradually stabilized. Urban household income carbon efficiency (components ③, ⑥, ⑨) experienced three phases: a rapid decline from 1994 to 1998, a period of fluctuating increases from 1999 to 2003, and a renewed downward trend from 2004 to 2018. The decline was particularly steep from 2004 to 2007, but stabilized from 2008 to 2018. This suggests that the fluctuations in household income carbon efficiency observed in Figure 3B from 1999 to 2003 were primarily driven by urban households, as no significant fluctuations were observed in rural household income carbon efficiency during this period.
By integrating the analysis of both the “total amount” and the “decomposition and trend of the total amount”, the following key conclusions can be drawn: 1) The total household income carbon footprint has shown continuous growth, while household income carbon efficiency has consistently declined. 2) Changes in individual household income have a significant impact on the total carbon footprint, influencing not only its scale but also the trends in carbon efficiency. 3) Urban-rural disparities are evident in the household income carbon footprint. Notably, the carbon footprint induced by urban household income, particularly the urban residential carbon footprint, is larger than other components. Additionally, urban households have a stronger driving effect on residential carbon footprints compared to rural households.
3.3 Sectoral analysis of China’s household income carbon footprint (1994–2018)
Building upon the decomposition of the household income carbon footprint, this section further examines the contributions of specific sectors to the household income carbon footprint, highlighting sectoral characteristics and urban-rural disparities. To assess the sectoral contributions to the household income carbon footprint, this study analyzes the 2018 data presented in Table 2.
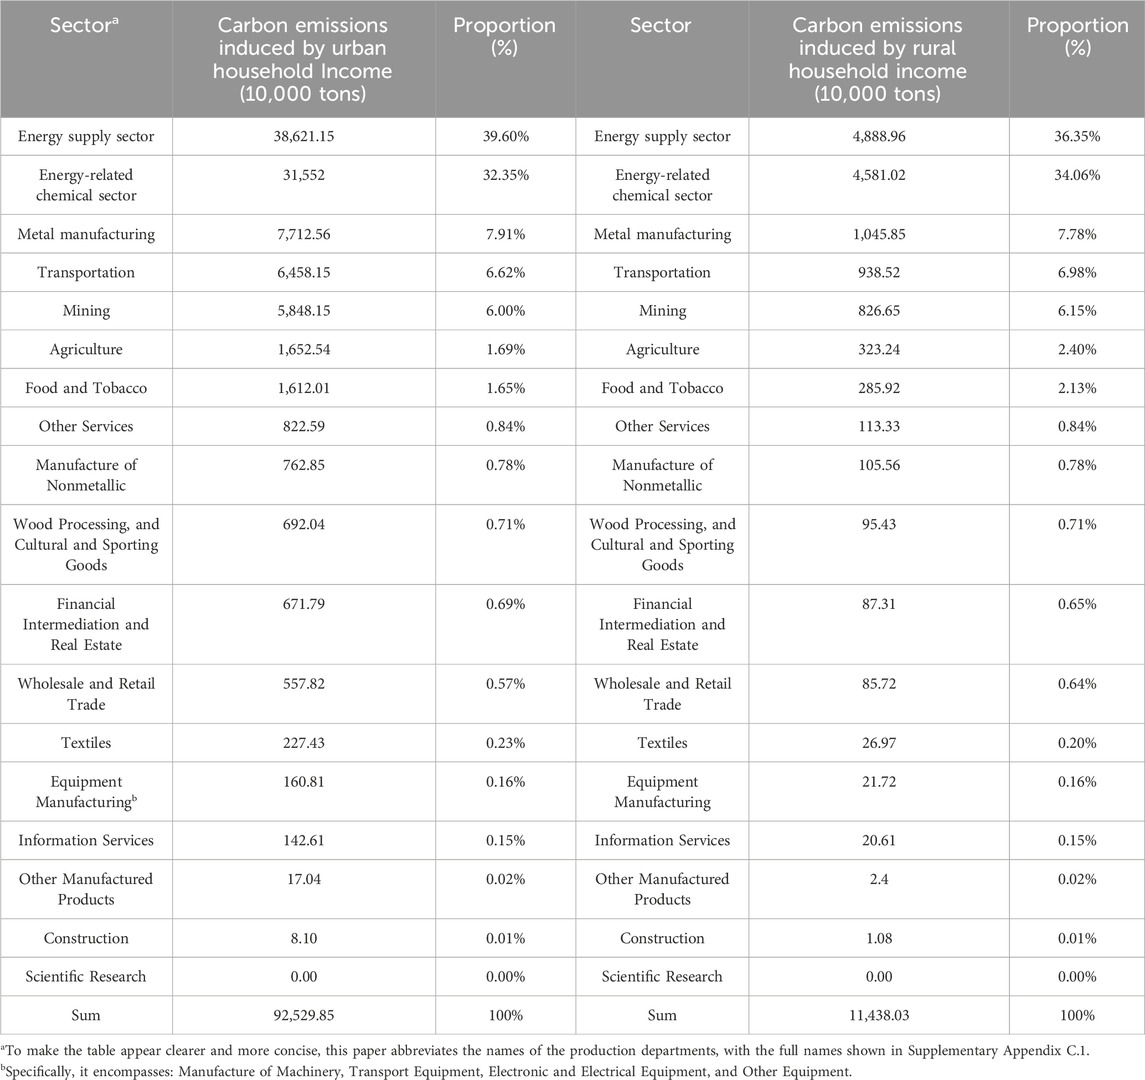
Table 2. Carbon footprint of rural and urban household income in 2018.
According to Table 2, the energy sector emerges as the largest contributor to carbon emissions, which are divided into two categories: “petroleum, coking, nuclear fuel processing, and chemical products” (referred to as the “Energy-related chemical sector”) and “Production and Supply of Electricity, Heat, Gas, and Water” (referred to as the “Energy supply sector”). These industries account for 32.35% and 39.60% of the urban household income carbon footprint, respectively, and 34.06% and 36.35% of the rural household income carbon footprint, respectively. The proportion of the energy supply sector in the rural household income carbon footprint is lower than that in the urban household income carbon footprint, indicating that rural household income has a smaller impact on energy demand fluctuations compared to urban households. This reflects the differences in energy consumption patterns between urban and rural residents.
Next, the mining sector and Metal manufacturing sectors contribute 6% and 7.91% of the urban household income carbon footprint, respectively, and 6.15% and 7.78% of the rural household income carbon footprint, respectively.
Finally, the production sectors related to daily life (referred to as the “Livelihood-related sectors”) exhibit significant carbon emissions driven by household income. Among these, Transportation and Agriculture are the most prominent contributors. These sectors account for 6.62% and 1.69% of the urban household income carbon footprint, respectively, and 6.98% and 2.4% of the rural household income carbon footprint, respectively.
From an urban-rural perspective, the carbon footprint of urban household income exceeds that of rural households in all sectors, indicating that urban household income has a stronger direct driving effect on production sector carbon emissions than rural household income. When examining the proportion of sectoral income carbon footprints within the total household income carbon footprint, rural household income has a higher in certain sectors compared to urban household income. Specifically, the shares of Agriculture (2.4%), “Food and Tobacco” (2.13%), and Transportation (6.98%) in the rural household income carbon footprint are higher than the corresponding shares of 1.69%, 1.65%, and 6.62% in the urban household income carbon footprint. This suggests that rural household income has a more impact on the carbon emissions of these sectors compared to urban household income.
Once again, focusing on sectors with significant household income carbon footprints in 2018, this study conducts a time-series analysis of their changes and urban-rural disparities from 1994 to 2018. While the energy sector is widely acknowledged for its high carbon emission, it is not the primary focus of this study. The results are presented in Figure 5.
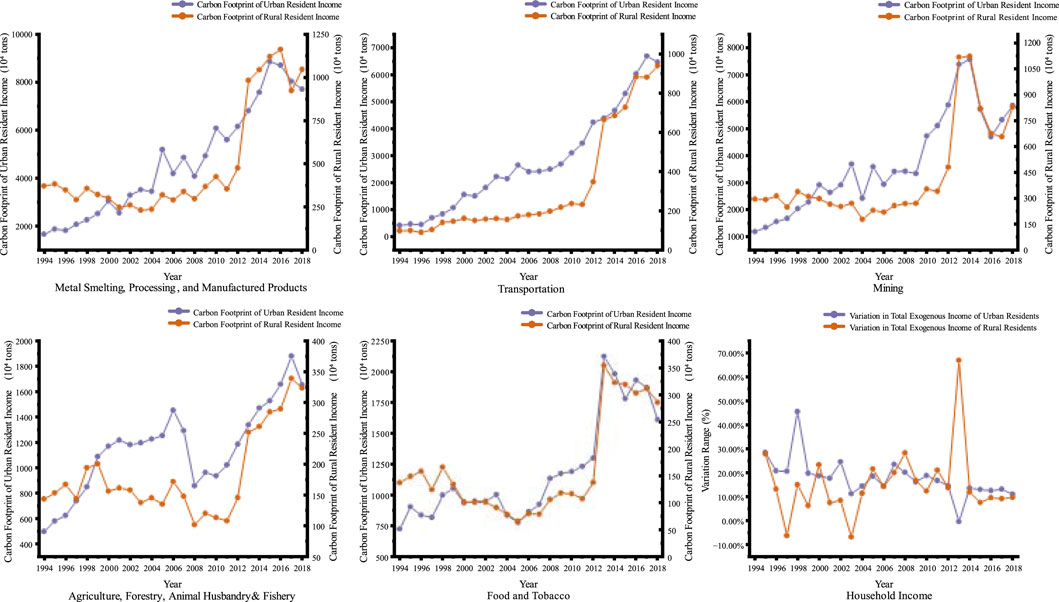
Figure 5. Changes in household income carbon footprint of key sectors and urban-rural differences from 1994 to 2018.
According to Figure 5, the analysis of changes in urban and rural household income carbon footprints across different sectors reveals the following key findings: First, decline in sectoral carbon footprint: A decrease in the total sectoral carbon footprint significantly affects both urban and rural household income carbon footprints. Between 2006 and 2008, the income carbon footprint of Agriculture experienced a sharp decline for both urban and rural household, primarily due to a substantial reduction in carbon emissions from this sector. According to the China Energy Statistical Yearbook, the sector’s carbon footprint dropped from 119 million tons in 2007 to 74 million tons in 2008, a decrease of 37.82%. This suggests that sector-wide carbon reduction and emission mitigation can suppress the growth of the household income carbon footprint.
Second, rising rural household income and impact on urban carbon footprint: An increase in rural household income can lead to a rise in the urban household income carbon footprint in the “Food and Tobacco” sector. Between 2011 and 2013, rural household income surged across all sectors. According to the China Statistical Yearbook, per capita exogenous income of rural residents increased by 70.23% from 2012 to 2013, while urban residents saw a decrease of 2.84%. Concurrently, the urban household income carbon footprint in the “Food and Tobacco” sector skyrocketed, rising from 13.832 billion tons in 2012 to 35.388 billion tons in 2013, a 155.83% increase. Meanwhile, the growth rate of urban household income carbon footprints in other sectors remained relatively stable. Previous studies (Wen et al., 2024) suggest this phenomenon is driven by increased consumption of animal-based food products due to rising rural household income. These products, which have a higher carbon footprint than plant-based ones (Qaim et al., 2024), are predominantly retailed in urban areas, thereby increasing the urban household income carbon footprint in this sector.
Third, stable household income, but sectoral variations: from 2013 to 2018, the total variation in urban and rural household exogenous income remained relatively stable. However, sectoral income carbon footprints exhibited notable temporal variations:
The income carbon footprint of the “Food and Tobacco” industry showed a significant downward trend, with urban and rural household income carbon footprints decreasing from 21.23 million tons and 3.53 million tons in 2013 to 16.12 million tons and 2.85 million tons in 2018, representing declines of 19% and 27%, respectively.
The income carbon footprint of Agriculture sector began to decline in 2017, with reductions of 12.1% and 4.7% by 2018 for urban and rural households, respectively.
The urban household income carbon footprints of the Metal manufacturing sector and the transportation industry declined in 2015 and 2017, respectively, with decreases of 13% and 3% by 2018, while no declining trend was observed in the rural household income carbon footprint.
The income carbon footprint of the mining industry for both rural and urban households declined in 2014 but exhibited an upward trend again in 2016.
Finally, this study examines the carbon efficiency of household income across the sectors and explores the urban-rural disparities in this context. The results are presented in Figure 6, which reveals three key characteristics of household income carbon efficiency:
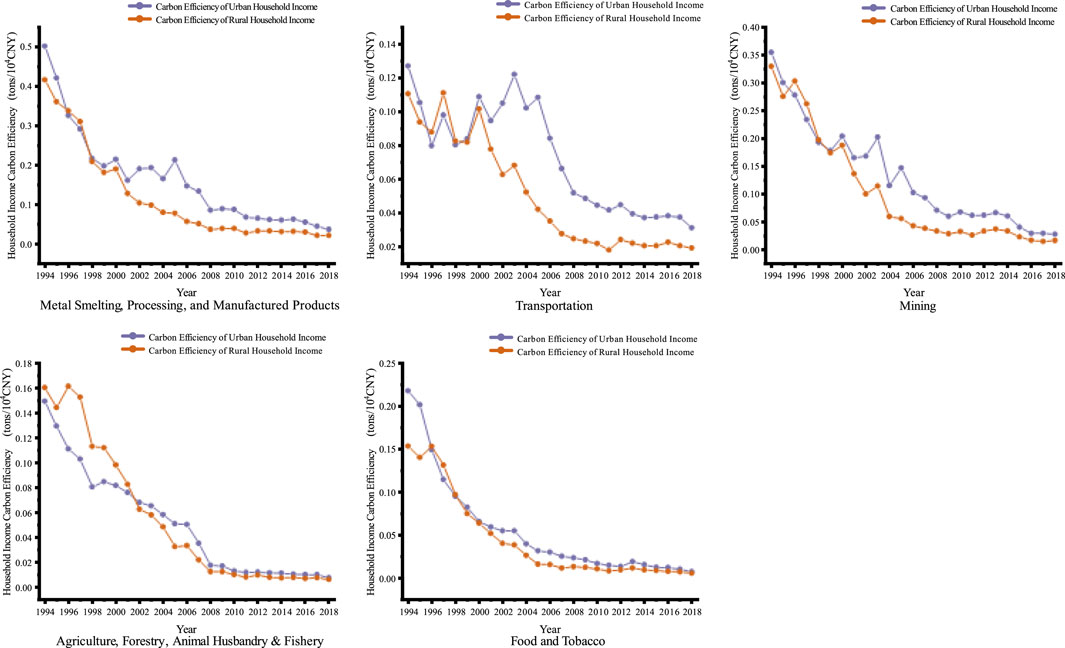
Figure 6. Changes in carbon efficiency of household income in key sectors and urban-rural differences from 1994 to 2018.
First, faster decline in rural carbon efficiency before 2010: Between 1994 and 2010, except for Agriculture sector, the decline in carbon efficiency was more pronounced in rural households compared to urban households across all other sectors. The carbon efficiency of urban and rural household income in the Metal manufacturing sector, the mining sector, the transportation sector, Agriculture sector, as well as the “Food and Tobacco” sector, showed a rapid downward trend. The average annual declines for urban households were 8.7%, 8.0%, 4.1%, 18.8%, and 14.3%, respectively, whereas for rural households, the declines were 12.8%, 11.8%, 10.1%, 14.3%, and 14.1%.
Second, greater stability in rural carbon efficiency with urban fluctuations: The decline in rural household income carbon efficiency was relatively stable over time. However, urban household income carbon efficiency fluctuated in certain sectors during specific periods: in the Metal manufacturing sector from 2001 to 2008, in the transportation sector from 1994 to 2003, and in the mining sector from 2000 to 2006. In contrast, except for the transportation sector, rural household income carbon efficiency exhibited fewer fluctuations. These fluctuations in urban household income carbon efficiency contributed to widening the urban-rural gap in income carbon efficiency during these periods.
Third, the convergence of carbon efficiency trends after 2020: After 2010, the decline in urban and rural household income carbon efficiency slowed across all sectors, and the gap between them gradually narrowed, indicating a trend toward convergence. This pattern resulted from the combined effects of slowing carbon footprint growth and rising household income. As shown in Figure 5, the carbon footprint of household income declined across all sectors, which aligns with findings from in previous studies (Wen et al., 2024). For instance, in the “food and tobacco” sector, rising household income altered food consumption patterns, narrowing the urban-rural gap in the sector’s carbon footprint (Xu et al., 2021). Additionally, the gradual integration of urban and rural economies in most regions of China curbed the growth of the carbon footprint in the Agriculture sector (Zhang and Liu, 2024). In heavy industries such as Metal manufacturing and the mining sector, the implementation of carbon taxes contributed to emission reductions (Wang et al., 2025), thereby restricting the effectively slowing sectoral carbon footprints growth. Under these constraints, household income continued to rise steadily, and the urban-rural income gap progressively narrowed (Zhong et al., 2022), leading to a gradual decline in sectoral income carbon efficiency and a corresponding reduction in urban-rural disparities.
These findings suggest that China has made significant progress in balancing the dual objectives of promoting economic development and transitioning toward a low-carbon economy while simultaneously reducing urban-rural disparities.
3.4 The differences between the results of open model and partially closed model
Compared to the open model, the partially closed model not only traces the carbon footprint of production sectors and household consumption induced by household income but also provides a more accurate estimation of the production sector’s carbon footprint driven by final demand. The results are presented in Table 3.
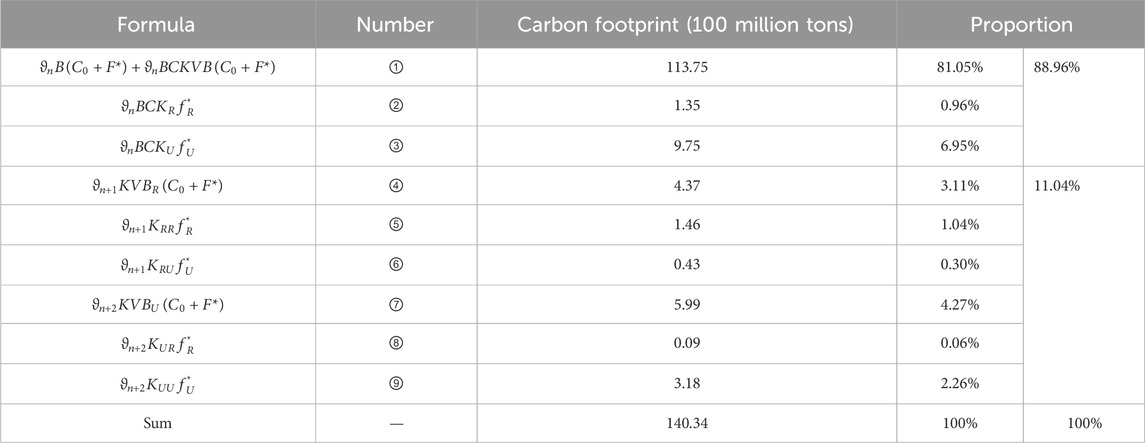
Table 3. Carbon footprint accounting in 2018.
Empirically, the results show that the carbon footprint of production sectors driven by final demand, as calculated by the partially closed model, is lower than that estimated by the open model. For instance, using 2018 data, the open model estimated the carbon footprint of production sectors driven by final demand to be ①, ②, and ③, accounting for 88.96% of the total carbon footprint, approximately 12.484 billion tons. In contrast, the partially closed model estimated this value to be only ①, accounting for 81.05% of the total carbon footprint, approximately 11.375 billion tons. Therefore, using the open model for estimation tends to overestimate the results. Additionally, the partially closed model quantified the household carbon footprint driven by final demand (④, ⑦) at 1.035 billion tons, representing 7.83% of the total carbon footprint.
4 Discussion
4.1 An appropriate input–output model should be employed for carbon footprint assessment
Section 2.2 presents a theoretical derivation, and Section 3.4 provides an empirical analysis to compare the open model with the partially closed model. This comparison not only introduces a method for constructing a partially closed model based on the open model but also clarifies the applicability of each model in carbon footprint assessment. Furthermore, it demonstrates the scientific validity and practical effectiveness of the partially closed model in assessing the carbon footprint of household income proposed in this study. Specifically, the open model should be used in carbon footprint assessments when the research scope is limited to a closed production system. For example, this applies to studies that estimate the carbon footprint of a single industrial chain without considering the impact of the household sector (Xu et al., 2025),or studies that analyze the household sector’s driving effect on the production system’s carbon footprint without accounting for the circular relationship between the household sector and the production system (Feng and Xu, 2025). It is worth noting that some recent studies have employed the MRIO open model to examine the household consumption carbon footprint within inter-country industries (Qian et al., 2025), However, the appropriateness of this approach remains questionable. This is because, interregional value flows essentially represent trade activities between national sectors (Zhang et al., 2025), rather than household consumption. Therefore, the resulting carbon footprint cannot be classified as the household consumption carbon footprint. If the research scope involves the interaction between the household and production sectors, the open model should be extended into the partially closed model. As discussed in Section 2.1, this is because the open model isolates the intrinsic linkage between the production system and the household sector, thereby failing to capture the carbon footprint embedded in this relationship.
4.2 Analysis of the mechanisms linking household income to carbon emissions
In this section, we elucidate the mechanisms by which household income affects carbon emissions through analysis of urban–rural consumption structure differences, the impact of industrial technological progress on carbon efficiency, and an integrated description of the income–consumption–production transmission chain.
With respect to urban–rural consumption structure differences, significant divergences in spending preferences and basket composition between urban and rural households not only amplify the impact of income levels on total emissions but also shape the types and sectoral distribution of those emissions. Urban residents allocate a larger share of their income to high–carbon–intensive categories, such as transportation, heating and cooling, processed foods, and modern services (Lv et al., 2024), whereas rural residents focus on self-produced agricultural goods, basic household energy, and subsistence items, which carry lower carbon coefficients (Grabher et al., 2024). Our cross–effect analysis indicates that urban income drives 6.87% of rural residents’ direct energy consumption carbon emissions, far exceeding the 0.97% reciprocal effect, demonstrating that, for equivalent income increments, divergent consumption structures channel carbon emissions preferentially across sectors (Peng et al., 2023), thereby generating pronounced urban–rural disparities in carbon emission patterns.
Regarding industrial technological progress, since 1994 most high–emission sectors, such as metal manufacturing, transportation, and energy supply, have exhibited a fluctuating decline in carbon intensity per unit of output (Işık et al., 2025), markedly improving income carbon efficiency of household income. This improvement stems both from the adoption of technological innovations (e.g., high–efficiency motors, intelligent transportation systems, clean power generation) and from structural shifts toward high–value–added manufacturing and services (Xu et al., 2023). Under this context, as shown in Figure 6, household income growth has not translated into proportionally higher emissions; instead, the marginal carbon intensity of production has declined, leading to a steady decline in overall carbon efficiency. Consequently, technological advances and structural upgrading in the industrial sector constitute a key mechanism decoupling income growth from increased carbon emissions.
With respect to the income–consumption–production transmission chain, household income affects carbon emissions through a multi–stage process: first by altering consumption volume and structure, then by driving sectoral output demand, and finally by translating into corresponding emissions. This chain can be formalized as: Here, differences in consumption structure determine the distribution of output increases across sectors, while industrial technological progress and energy efficiency improvements provide a “buffer” in the output-to-emission transformation stage, mitigating the direct emission–driving effect of income growth. Through this income–consumption–production framework, readers gain a clear, quantitative and qualitative understanding of the deep pathways by which household income influences carbon emissions.
4.3 Policy implications: integrating carbon tax measures into urbanization and rural revitalization under China’s dual-carbon strategy
The findings of this study offer valuable insights for balancing economic growth and environmental protection within the framework of the “dual carbon” strategy. A one key implication is the urgent need for carbon reduction policies to mitigate the growing household income carbon footprint. As economic development drives steady increases in household income, rising consumption subsequently amplifies carbon emissions from the production sector (Mi et al., 2020). The persistent upward trend in the household income carbon footprint highlights the importance of ensuring that emissions from the production sector decline, even as household income and consumption continue to rise. Carbon tax policies are essential in this regard. Imposing taxes on high-carbon products, such as gasoline-powered vehicles, high-emission foods like beef, and energy-intensive household appliances, while offering tax reductions or exemptions for enterprises and products that adopt renewable energy technologies, can help steer consumption and production toward more sustainable practices (Wang et al., 2023). This approach aligns with the International Energy Agency’s (IEA) emphasis on carbon pricing as a critical tool for achieving deep decarbonization across all sectors, particularly in steering consumer choices and industrial investments towards low-carbon alternatives (International Energy Agency, 2020). Particularly in the process of new-type urbanization, the guidance of consumption behaviors among the large influx of new urban residents is critically important (Fan et al., 2023). The carbon tax policy should be integrated with urbanization planning (Puustinen et al., 2025). It should coordinate efforts in urban planning, public transport development (e.g., new energy buses and subways), and housing policies (e.g., the promotion of green building standards). By means such as differentiated carbon taxation to curb private fuel-vehicle demand and subsidies for clean-energy transportation and energy-efficient household appliances, the new urban resident population is guided to adopt a low-carbon lifestyle. Meanwhile, under the rural revitalization strategy, carbon tax revenues can be allocated to support the construction of clean-energy infrastructure in rural areas (Beiser-McGrath and Bernauer, 2019), such as photovoltaic systems and biomass energy facilities. Subsidies for energy-efficient agricultural machinery and high-performance household appliances can encourage rural residents to avoid high-carbon consumption as their incomes rise and to choose more sustainable products.
4.4 Sustained optimization of the energy mix and continuous enhancement of energy efficiency
A second key implication is the need to continuously optimize the energy structure and enhance energy efficiency. Given that the energy sector is the largest contributor to the household income carbon footprint, transitioning from fossil fuels to non-fossil energy sources, such as wind, solar, and hydropower, is crucial (Kabeyi and Olanrewaju, 2022). At the macro level, the government should promote energy substitution through policy guidance, curb irrational energy consumption, and expand the supply of and financial support for clean energy projects to boost their market competitiveness (Duan et al., 2024). Meanwhile, the rapid advancement of new-type urbanization has created a critical window for large-scale deployment of low-carbon technologies and optimization of the energy structure (Wang and Li, 2025). In urban development, high energy-efficiency standards and renewable resource utilization must be established as core requirements for both new town development and existing city renewal (Dai et al., 2025). Suggested measures include guiding the installation of rooftop photovoltaics and promoting district heating. At the industry level, sectors should focus on advancing low-carbon production processes, adopting energy-saving technologies, increasing the use of electrified equipment, and leveraging digital solutions to enhance energy efficiency (Andrei and Johnsson, 2025). Improving energy efficiency across all sectors is universally recognized, as evidenced by its prominence in IEA scenarios and UNFCCC discussions, as one of the most cost-effective and readily available measures to reduce emissions (International Energy Agency, 2022; UNFCCC, 2014). In the construction sector, prioritizing energy efficiency retrofitting, optimizing building material production, using low-carbon materials, and encouraging green recycling are essential (Chen et al., 2023). Similarly, in the transportation sector, the emphasis should be on advancing electrification and adopting new energy technologies to improve energy efficiency (Chen et al., 2023). This directly pertains to the resolution of urban traffic congestion and the mitigation of pollution.
4.5 Integrating household income carbon footprints into fiscal policy to address regional disparities
Incorporating the impact of household income on regional carbon emissions into fiscal policy is essential to address urban-rural disparities. As household income increases, the regional household income carbon footprint also rises, emphasizing the need for fiscal policies that promote income growth while simultaneously reducing regional carbon emissions. The formulation of fiscal policy must be deeply integrated into the strategy for coordinated regional development (Zhou and Lin, 2025). The interactive relationship between new-type urbanization and rural revitalization should be fully considered. Support is increased through tax incentives, targeted transfer payments, and green finance instruments. This support fosters green industries in underdeveloped and rural areas, including ecological agriculture, ecotourism, and carbon sink industries. Local green employment opportunities are created (Tang et al., 2023). These measures prevent forced expansion of high-carbon industries and labor outflow driven by income growth. Such outcomes could otherwise exacerbate regional imbalances. Meanwhile, fiscal policy should guide a healthier and more orderly progression of new-type urbanization (Lin and Zhu, 2021). Mechanisms such as ecological compensation and the return of revenues from carbon trading can be employed. These measures encourage economically developed regions or cities that receive population inflows to support less developed or rural source areas. Such support aids in protecting and enhancing their ecological carbon sequestration capacity. Shared responsibility for carbon emissions and coordinated regional development are thereby achieved.
In summary, this study offers a thorough analysis of the relationship between household income and carbon footprints in China, highlighting the crucial role of carbon reduction policies, energy structure optimization, and fiscal policy integration in fostering sustainable economic growth while minimizing carbon emissions. Although empirical constraints were imposed by limitations in data availability and the impact of the pandemic, this study is limited to data through 2018. However, significant and observable economic transformations have occurred in China following the COVID-19 pandemic, particularly in response to macro-level policies implemented in typical regions such as Wuhan. It remains highly valuable for future scholars to conduct research on the income carbon footprint in this context. Specifically, these macro-level policies guided production systems to adjust their industrial structures, resulting in corresponding changes in household income composition and consumption behaviors. Modeling this scenario and conducting policy simulations based on future officially published input–output data can provide deeper insights into the impacts of major public health emergencies on the income carbon footprint and its transmission pathways. Combining these research outcomes with China’s carbon peaking and carbon neutrality policies can effectively illustrate how such public health shocks affect household income carbon footprints and interact with dual-carbon strategies, thereby offering a scientific basis for policy formulation aimed at coordinating economic recovery and low-carbon transition in the post-pandemic era.
5 Conclusion
This study develops a partially closed input-output model that distinguishes between urban and rural household income and consumption to estimate China’s household income carbon footprint. It examines the total carbon footprint and its components from 1994 to 2018, investigates the sectoral distribution and urban-rural disparities in income carbon footprints, and compares the outcomes derived from open and closed models. The key findings are as follows:
China’s household income carbon footprint has shown continuous and substantial growth, rising from 250 million tons in 1994 to 1.62 billion tons in 2018, reflecting a 548% increase. This growth exhibits a cyclical pattern primarily driven by increasing household income. As income level has risen and carbon footprints have expanded, household income carbon efficiency has consistently decline. A decomposition of the total household income carbon footprint reveals six components, corresponding to items (②, ③, ⑤, ⑥, ⑧, and ⑨) in Equation 9, with component ⑨ emerging as the largest contributor.
Significant disparities exist between urban and rural households in the interaction between household income and the carbon footprint of household consumption. The driving effect of urban household income on the carbon footprint is more pronounced than that of rural households, with urban household income exerting a stronger influence on the carbon footprint of production sectors. Although all components of the urban household income carbon footprint have shown upward trends, these trends follow distinct trajectories. In contrast, the growth of the rural household income carbon footprint can be divided into three phases: steady growth from 1994 to 2011, an “explosive” increases from 2011 to 2013, and moderate growth from 2013 to 2018. Regarding household income carbon efficiency, urban household income carbon efficiency has undergone three distinct phases: a sharp decline from 1994 to 1998, a period of fluctuating increase from 1999 to 2003, and a renewed downward trend from 2004 to 2018. In contrast, rural household income carbon efficiency has followed a pattern of “rapid initial decrease followed by a gradual slowdown.” Moreover, urban-rural disparities in income carbon footprints have been evident across different industrial sectors.
From a sectoral perspective, the primary contributors to the household income carbon footprint include the energy-related chemical sector, metal smelting, processing and manufacturing, transportation, mining, Agriculture sector, and “the food and tobacco” sectors. Analyzing urban and rural household income carbon footprints across these sectors reveals three key insights: First, a decline in a sector’s total carbon footprint has a significant impact on both urban and rural household income carbon footprints. Second, an increase in rural household income leads to a rise in the urban household income carbon footprint within the food and tobacco industry. Third, from 2013 to 2018, the temporal patterns of changes in urban and rural household income carbon footprints varied across different sectors. Notably, the downward trend in rural household income carbon efficiency remained relatively stable. Additionally, after 2010, the decline in urban and rural household income carbon efficiency slowed across all sectors, and the gap between the two gradually narrowed, indicating a trend toward convergence.
A comparison of model results highlights that the partially closed input-output model not only captures the carbon footprint generated by household income through both the production sector and household consumption but also offers a more precise estimation of the production sector’s carbon footprint driven by final demand. Consequently, this model provides a more accurate assessment of the carbon footprint induced by household income.
Data availability statement
The original contributions presented in the study are included in the article/Supplementary Material, further inquiries can be directed to the corresponding author.
Author contributions
HC: Conceptualization, Validation, Funding acquisition, Methodology, Formal Analysis, Software, Visualization, Data curation, Resources, Writing – original draft. M-KK: Visualization, Conceptualization, Supervision, Formal Analysis, Writing – review and editing. WJ: Writing – original draft, Software, Validation, Conceptualization, Methodology, Data curation, Supervision. YZ: Formal Analysis, Supervision, Data curation, Writing – review and editing, Software, Conceptualization, Investigation, Validation, Methodology.
Funding
The author(s) declare that financial support was received for the research and/or publication of this article. This study was funded by the National Office for Philosophy and Social Sciences Fund project 23&ZD103 and the National Natural Science Foundation of China (72403115). These projects have provided strong financial and technical support for this paper.
Conflict of interest
The authors declare that the research was conducted in the absence of any commercial or financial relationships that could be construed as a potential conflict of interest.
Generative AI statement
The author(s) declare that no Generative AI was used in the creation of this manuscript.
Any alternative text (alt text) provided alongside figures in this article has been generated by Frontiers with the support of artificial intelligence and reasonable efforts have been made to ensure accuracy, including review by the authors wherever possible. If you identify any issues, please contact us.
Publisher’s note
All claims expressed in this article are solely those of the authors and do not necessarily represent those of their affiliated organizations, or those of the publisher, the editors and the reviewers. Any product that may be evaluated in this article, or claim that may be made by its manufacturer, is not guaranteed or endorsed by the publisher.
Supplementary material
The Supplementary Material for this article can be found online at: https://www.frontiersin.org/articles/10.3389/fenvs.2025.1645056/full#supplementary-material
Footnotes
1Resident income
2The data for
References
Ando, A., and Modigliani, F. (1963). The “life cycle” hypothesis of saving: aggregate implications and tests. Am. Econ. Rev. 17 (1), 1880–1881. Available online at: https://www.jstor.org/stable/1817129.
Andrei, M., and Johnsson, S. (2025). Advancing maturity in the adoption of digital technologies for energy efficiency in manufacturing industry. J. Manuf. Technol. Manag. 36 (9), 114–133. doi:10.1108/JMTM-09-2024-0482
Bai, S. K. (2020). Study on employment effects of industrial development and factors influencing employment in China from a low-carbon perspective. Dalian: Dalian University of Technology. doi:10.26991/d.cnki.gdllu.2020.002564
Bamisile, O., Obiora, S. C., Huang, Q., Huang, Q., Yimen, N., Idriss, I. A., et al. (2020). Impact of economic development on CO2 emission in Africa; the role of BEVs and hydrogen production in renewable energy integration. Int. J. Hydrogen Energy 46, 2755–2773. doi:10.1016/j.ijhydene.2020.10.134
Beiser-McGrath, L. F., and Bernauer, T. (2019). Could revenue recycling make effective carbon taxation politically feasible? Sci. Adv. 5 (9), eaax3323. doi:10.1126/sciadv.aax3323
Chen, Q., Dietzenbacher, E., Los, B., and Yang, C. (2010). “Partilly endogenized consumption: a new method to incorporate the household sector into input-output models,” in The Eighteenth International Input-output Conference.
Chen, Q., Dietzenbacher, E., and Los, B. (2015). Structural decomposition analyses: the differences between applying the semi-closed and the open input–output model. Environ. Plan. A Econ. Space 47 (8), 1713–1735. doi:10.1177/0308518X15597101
Chen, Q., Dietzenbacher, E., Los, B., and Yang, C. (2016). Modeling the short-run effect of fiscal stimuli on GDP: a new semi-closed input-output model. Econ. Model. 58, 52–63. doi:10.1016/j.econmod.2016.05.016
Chen, L., Huang, L., Hua, J., Chen, Z., Wei, L., Osman, A. I., et al. (2023). Green construction for low-carbon cities: a review. Environ. Chem. Lett. 21 (3), 1627–1657. doi:10.1007/s10311-022-01544-4
Cui, J., Wang, C., Zhang, J., and Zheng, Y. (2021). The effectiveness of China’s regional carbon market pilots in reducing firm emissions. Proc. Natl. Acad. Sci. 118 (52), e2109912118. doi:10.1073/pnas.2109912118
Dai, J., Mehmood, U., and Nassani, A. A. (2025). Empowering sustainability through energy efficiency, green innovations, and the sharing economy: insights from G7 economies. Energy 318, 134768. doi:10.1016/j.energy.2025.134768
Duan, Y., Xi, B., Xu, X., and Xuan, S. (2024). The impact of government subsidies on green innovation performance in new energy enterprises: a digital transformation perspective. Int. Rev. Econ. Finance 94, 103414. doi:10.1016/j.iref.2024.103414
Fan, J., Wang, J., Qiu, J., and Li, N. (2023). Stage effects of energy consumption and carbon emissions in the process of urbanization: evidence from 30 provinces in China. Energy 276, 127655. doi:10.1016/j.energy.2023.127655
Feng, N., and Xu, P. (2025). Understanding the carbon footprint of Chinese agriculture: an analysis of consumption-driven environmental impact. Pol. J. Environ. Stud. doi:10.15244/pjoes/196746
Forster, P. M., Smith, C., Walsh, T., Lamb, W. F., Lamboll, R., Hall, B., et al. (2024). Indicators of global climate change 2023: annual update of key indicators of the state of the climate system and human influence. Earth Syst. Sci. Data 16 (6), 2625–2658. doi:10.5194/essd-16-2625-2024
Friedman, M. (1957). A theory of the consumption function. Princeton, USA: Princeton University Press.
Garg, A. P., Chaudhary, M., and Garg, C. (2024). “Global impact of carbon emissions and strategies for its management,” in Quality of life and climate change: impacts, sustainable adaptation, and social-ecological resilience (Hershey, Pennsylvania: IGI Global), 75–107. doi:10.4018/978-1-6684-9863-7.ch004
Grabher, H. F., Erb, K., Singh, S., and Haberl, H. (2024). Household energy systems based on biomass: tracing material flows from source to service in rural Ethiopia. Ecol. Econ. 217, 108057. doi:10.1016/j.ecolecon.2023.108057
International Energy Agency (2020). Putting a price on carbon – an efficient way for Thailand to meet its bold emission target. Available online at: https://www.iea.org/articles/putting-a-price-on-carbon-an-efficient-way-for-thailand-to-meet-its-bold-emission-target (Accessed July 12, 2025).
International Energy Agency (2022). The value of urgent action on energy efficiency. Available online at: https://www.iea.org/reports/the-value-of-urgent-action-on-energy-efficiency (Accessed July 12, 2025).
Işık, C., Yan, J., and Ongan, S. (2025). Energy intensity, supply chain digitization, technological progress bias in China's industrial sectors. Energy Econ. 145, 108442. doi:10.1016/j.eneco.2025.108442
Kabeyi, M. J. B., and Olanrewaju, O. A. (2022). Sustainable energy transition for renewable and low carbon grid electricity generation and supply. Front. Energy Res. 9, 743114. doi:10.3389/fenrg.2021.743114
Kim, T.-J., and Tromp, P. (2021). Analysis of carbon emissions embodied in South Korea's international trade: production-based and consumption-based perspectives. J. Clean. Prod. 320, 128839. doi:10.1016/j.jclepro.2021.128839
Lee, J., Shigetomi, Y., and Kanemoto, K. (2023). Drivers of household carbon footprints across EU regions, from 2010 to 2015. Environ. Res. Lett. 18 (4), 044043. doi:10.1088/1748-9326/acc95e
Li, Y., Wu, J., Pei, X., and Zhu, Q. (2025). The impact of digital industries on carbon emission in China: input-output and structural decomposition analysis. World Dev. Sustain. 6, 100208. doi:10.1016/j.wds.2025.100208
Liang, L., Chen, M., and Zhang, X. (2023). Measuring inequality of household carbon footprints between income groups and across consumption categories in China. J. Clean. Prod. 418, 138075. doi:10.1016/j.jclepro.2023.138075
Lin, B., and Zhu, J. (2021). Impact of China's new-type urbanization on energy intensity: a city-level analysis. Energy Econ. 99, 105292. doi:10.1016/j.eneco.2021.105292
Liu, X., and Zhou, X. (2025). Determinants of carbon emissions from road transportation in China: an extended input-output framework with production-theoretical approach. Energy 316, 134493. doi:10.1016/j.energy.2025.134493
Liu, X., Wang, X. e., Song, J., Wang, H., and Wang, S. (2019). Indirect carbon emissions of urban households in China: patterns, determinants and inequality. J. Clean. Prod. 241, 118335. doi:10.1016/j.jclepro.2019.118335
Liu, M., Wang, J., Wen, J., He, G., Wu, J., Chen, H., et al. (2022). Carbon emission and structure analysis of transport industry based on input-output method: china as an example. Sustain. Prod. Consum. 33, 168–188. doi:10.1016/j.spc.2022.06.021
Long, Y., Dong, L., Yoshida, Y., and Li, Z. (2018). Evaluation of energy-related household carbon footprints in metropolitan areas of Japan. Ecol. Model. 377, 16–25. doi:10.1016/j.ecolmodel.2018.03.008
Lv, J., Liu, B., and Chai, L. (2024). Comparing the determinants of household carbon footprints between rural and urban: evidence from China household survey data. China Agric. Econ. Rev. 16 (1), 154–180. doi:10.1108/CAER-04-2023-0076
Mi, Z., Zheng, J., Meng, J., Ou, J., Hubacek, K., Liu, Z., et al. (2020). Economic development and converging household carbon footprints in China. Nat. Sustain. 3 (7), 529–537. doi:10.1038/s41893-020-0504-y
National Bureau of Statistics of China (2025a). China statistical yearbook 1994–2019. Beijing: China Statistics Press. Available online at: https://navi.cnki.net/knavi/detail?p=bVFRkQhh0EJ8RJ0no0bY5C5Bs0WhhKXnS_FtR5q-X5t3raF7mb_KDhIkNBQJf5smmtEQUCR01CNSw_xgSlYown8x2JY-nvoFUB7-5Cr5c5E=&uniplatform=NZKPT (Accessed July 12, 2025).
National Bureau of Statistics of China (2025b). China energy statistical yearbook 1995–2019. Beijing: China Statistics Press. Available online at: https://navi.cnki.net/knavi/detail?p=bVFRkQhh0ELn48Ga4J0fzwtw-N_k4aPVSnCjobRZQTUH2TZsuwGCfMx9rX8RX61ubOR0K-OvO2YOowHU_MlQGqXeLiTWyzJmwIQ6uNQfdjU=&uniplatform=NZKPT (Accessed July 12, 2025).
Pang, Q., Dong, X., Peng, S., and Zhang, L. (2022). Sector linkages and driving forces of Chinese household CO2 emissions based on semi-closed input–output model. Environ. Sci. Pollut. Res. 29, 35408–35421. doi:10.1007/s11356-021-18039-4
Peng, S., Wang, X., Du, Q., Wu, K., Lv, T., Tang, Z., et al. (2023). Evolution of household carbon emissions and their drivers from both income and consumption perspectives in China during 2010–2017. J. Environ. Manag. 326, 116624. doi:10.1016/j.jenvman.2022.116624
Puustinen, T., Falkenbach, H., Ekroos, A., and Junnila, S. (2025). Integrating climate policy objectives into municipal land policies: from conceptualization to empirical evidence from Finland. Int. J. Urban Regional Res. 49 (1), 69–94. doi:10.1111/1468-2427.13294
Qaim, M., Barrangou, R., and Ronald, P. C. (2024). Sustainability of animal-sourced foods and plant-based alternatives. Proc. Natl. Acad. Sci. 121 (50), e2400495121. doi:10.1073/pnas.2400495121
Qian, W., Yao, L., and Zhan, W. (2025). Redefining responsibility for China energy-related methane emission reductions: an embodied perspective driven by consumption. Energy Policy 203, 114646. doi:10.1016/j.enpol.2025.114646
Raman, R., Manalil, S., Dénes, D. L., and Nedungadi, P. (2024). The role of forestry sciences in combating climate change and advancing sustainable development goals. Front. For. Glob. Change 7, 1409667. doi:10.3389/ffgc.2024.1409667
Ren, G., and Song, Y. C. (2021). Research on the changes of the consumption structure of Chinese residents——based on the statistical data of urban residents and rural residents. Lanzhou Acad. J. (03), 33–45.
Rodrigues, J. F. D., Wang, J., Behrens, P., and De Boer, P. M. C. (2020). Drivers of CO2 emissions from electricity generation in the european union 2000–2015. Renew. Sustain. Energy Rev. 133, 110104. doi:10.1016/j.rser.2020.110104
Shi, S., and Yin, J. (2021). Global research on carbon footprint: a scientometric review. Environ. Impact Assess. Rev. 89, 106571. doi:10.1016/j.eiar.2021.106571
Shi, X., Wang, K., Cheong, T. S., and Zhang, H. (2020). Prioritizing driving factors of household carbon emissions: an application of the LASSO model with survey data. Energy Econ. 92, 104942. doi:10.1016/j.eneco.2020.104942
Shindell, D., and Smith, C. J. (2019). Climate and air-quality benefits of a realistic phase-out of fossil fuels. Nature 573 (7774), 408–411. doi:10.1038/s41586-019-1554-z
Tang, X. F., Hao, G. Z., Wang, Y. H., Li, D., and Luo, Y. (2023). Research on an equilibrium development model between urban and rural areas of Henan including carbon sink assets under the dual carbon goal. Front. Environ. Sci. 10, 1037286. doi:10.3389/fenvs.2022.1037286
Tian, K., Zhang, Y., Meng, J., Zhang, Z., Shan, Y., Zheng, H., et al. (2025a). Leveraging multinational enterprises to reduce the escalating regional carbon inequality in China. Nat. Commun. 16 (1), 6603. doi:10.1038/s41467-025-61968-8
Tian, P., Ma, H., Zhang, Z., Yu, Y., and Li, D. (2025b). China's current carbon inequality is predominantly determined by capital disparity. Ecol. Econ. 230, 108515. doi:10.1016/j.ecolecon.2024.108515
UNFCCC (2014). Governments hear inspiring examples of energy efficiency. Available online at: https://unfccc.int/news/governments-hear-inspiring-examples-of-energy-efficiency (Accessed July 12, 2025).
Wang, X., and Li, X. (2025). Towards a green world: how new urbanization affects green total factor carbon productivity. Front. Environ. Sci. 12, 1522259–2024. doi:10.3389/fenvs.2024.1522259
Wang, Q., Lin, J., Zhou, K., Fan, J., and Kwan, M.-P. (2020). Does urbanization lead to less residential energy consumption? A comparative study of 136 countries. Energy 202, 117765. doi:10.1016/j.energy.2020.117765
Wang, T., Umar, M., Li, M., and Shan, S. (2023). Green finance and clean taxes are the ways to curb carbon emissions: an OECD experience. Energy Econ. 124, 106842. doi:10.1016/j.eneco.2023.106842
Wang, Q., Yang, R., Zhang, Y., Yang, Y., Hao, A., Yin, Y., et al. (2024). Inequality of carbon emissions between urban and rural residents in China and emission reduction strategies: evidence from Shandong Province. Front. Ecol. Evol. 12, 1256448. doi:10.3389/fevo.2024.1256448
Wang, X., Liu, J., Liu, Y., Hu, X., Wu, H., Zhou, Y., et al. (2025). Regional disparities in carbon tax effectiveness: a multi-regional CGE analysis of provincial production and freight emissions in China. Environ. Impact Assess. Rev. 114, 107943. doi:10.1016/j.eiar.2025.107943
Wen, P., Zhu, N., and Jia, M. (2024). Changes in food consumption and nutrition intake of rural residents in central China. Heliyon 10 (16), e36523. doi:10.1016/j.heliyon.2024.e36523
Xu, X., Sharma, P., Shu, S., Lin, T.-S., Ciais, P., Tubiello, F. N., et al. (2021). Global greenhouse gas emissions from animal-based foods are twice those of plant-based foods. Nat. food 2 (9), 724–732. doi:10.1038/s43016-021-00358-x
Xu, J., Yu, Y., Zhang, M., and Zhang, J. Z. (2023). Impacts of digital transformation on eco-innovation and sustainable performance: evidence from Chinese manufacturing companies. J. Clean. Prod. 393, 136278. doi:10.1016/j.jclepro.2023.136278
Xu, S., Song, Y., and Yang, Y. (2025). Embedded carbon emissions in the inter-industrial sectors of China: a new analysis of total factor productivity and capacity utilization. J. Environ. Manag. 388, 125970. doi:10.1016/j.jenvman.2025.125970
Yu, Y., Li, S., Sun, H., and Taghizadeh-Hesary, F. (2021). Energy carbon emission reduction of China’s transportation sector: an input–output approach. Econ. Analysis Policy 69, 378–393. doi:10.1016/j.eap.2020.12.014
Zhang, Y., and Liu, Y. (2024). The impact of rural industrial integration on agricultural carbon emissions evidence from China provinces data. Sustainability 16 (2), 680. doi:10.3390/su16020680
Zhang, H. X., Xia, M., Su, R. J., and Lin, C. (2021). The compilation of the time series input-output tables in China: 1981-2018. Stat. Res. 38 (11), 3–23. doi:10.19343/j.cnki.11-1302/c.2021.11.001
Zhang, X., Chen, J., Lenzen, M., Brunet-Navarro, P., Dias, A. C., Shao, S., et al. (2025). Carbon balance of China-made wood products assessed using a trade-linked approach. Environ. Sci. Technol. 59, 10227–10238. doi:10.1021/acs.est.4c09208
Zhong, S., Wang, M., Zhu, Y., Chen, Z., and Huang, X. (2022). Urban expansion and the urban–rural income gap: empirical evidence from China. Cities 129, 103831. doi:10.1016/j.cities.2022.103831
Keywords: input-output analysis, partially closed model, carbon emissions, household income, urban-rural income disparity
Citation: Chen H, Kim M-K, Jiang W and Zhang Y (2025) Exploring the link between Chinese household income and carbon emissions from 1994 to 2018: a partially closed input-output model approach. Front. Environ. Sci. 13:1645056. doi: 10.3389/fenvs.2025.1645056
Received: 11 June 2025; Accepted: 29 August 2025;
Published: 18 September 2025.
Edited by:
Xu Zhao, Shandong University, Weihai, ChinaReviewed by:
Sanglin Zhao, Hunan University of Finance and Economics, ChinaSi Wu, China University of Geosciences (Wuhan), China
Copyright © 2025 Chen, Kim, Jiang and Zhang. This is an open-access article distributed under the terms of the Creative Commons Attribution License (CC BY). The use, distribution or reproduction in other forums is permitted, provided the original author(s) and the copyright owner(s) are credited and that the original publication in this journal is cited, in accordance with accepted academic practice. No use, distribution or reproduction is permitted which does not comply with these terms.
*Correspondence: Yu Zhang, emhhbmd5dTk2QG5qdS5lZHUuY24=