 Liming Yao
 Dongyu Xu
 Weijin Qian
- Business School, Sichuan University, Chengdu, China
Driven by the digital economy, China’s Information and Communication Technology (ICT) industry has significantly intensified water and carbon pressures. By employing the Environmentally Extended Multi-Regional Input-Output (EE-MRIO) model in conjunction with the Tapio decoupling model and Structural Decomposition Analysis (SDA), this study quantifies interprovincial virtual water-carbon flows and their economic-environmental coupling from 2012 to 2017. The findings reveal a spatial imbalance characterized by “eastern agglomeration–western burden”, as well as a transition from unidirectional outflows to hub-based resource interactions. Decoupling trajectories exhibit regional variations: Jiangsu has achieved strong decoupling, Beijing remains heavily coupled, while Jiangxi and Yunnan demonstrate significant water decoupling. The SDA results indicate that structural expansion continues to be the primary driver: from 2012 to 2017, per capita demand contributed +2.06 and final demand structure +0.54 to the average growth in carbon footprint. Regarding the water footprint, the final demand structure contributed +0.085. Although reductions in intensity have provided localized mitigation, the persistence of structural pressures suggests that path dependence has not been entirely overcome. This study expands the analytical framework for measuring environmental footprints and decoupling within the ICT industry, providing valuable insights for decision-making towards regional green transformation and ecological responsibility reconstruction.
1 Introduction
The ICT sector is characterized by a pronounced cross-regional production network (Zhang and Li, 2019), where raw material extraction, component manufacturing, equipment assembly, software services, and data processing occur across various provinces. This results in frequent virtual transfers of water resources and carbon emissions between regions (Zhang et al., 2019). Concurrently, significant differences in regional economic development levels, industrial structures, and resource endowments lead to notable coupling and decoupling conditions regarding water-carbon resource efficiency and ecological carrying capacities across regions (Liu et al., 2020; Lv et al., 2024). As a growth-oriented strategic sector, the ICT industry generates high economic value while exhibiting intensive resource consumption and environmental emissions (Charfeddine et al., 2023; Wang Q. et al., 2023; Siddik et al., 2021), manifesting a typical “high-carbon, high-water, high-impact” profile. Consequently, identifying the spatial flow patterns of water-carbon footprints within the ICT industry and evaluating their decoupling from economic growth is of both theoretical and practical significance for advancing green industrial transformation.
The Water Footprint (WF) and Carbon Footprint (CF) indicators, initially proposed by Hoekstra and Hung (2003) and Wiedmann and Minx (2008), have been extensively utilized to quantify the hidden resource burdens within supply chains. These indicators are also commonly known as virtual water and embodied carbon, respectively, highlighting the fact that resource consumption and pollution emissions can be geographically transferred through supply chains and international trade. These metrics are crucial in uncovering the hidden environmental burdens associated with products and in influencing discussions on global resource allocation and ecological responsibility (Allan, 1997; Peters et al., 2011; Jägerskog and Lundqvist, 2022).
Currently, the Input-Output model has been widely used to analyze the virtual transfer pathways of resource consumption and environmental burdens across regions. A growing body of research has employed this analytical framework to quantify carbon footprint (Liang et al., 2024), water footprint (Shen and Yao, 2023), land use (Costello et al., 2011), pollutant emissions (Sun et al., 2021), and energy consumption (Qian et al., 2025), thereby revealing the hidden ecological and environmental costs embedded in trade activities at the national (Fang et al., 2024), provincial (Li W. et al., 2023; Xu et al., 2024), and regional (Li et al., 2024; Yuan et al., 2022) levels. In the ICT sector, however, estimating and quantifying its environmental impacts remains a challenging yet compelling topic (Freitag et al., 2021). To date, only a limited number of studies have evaluated the sector from the perspectives of embodied energy use (Shi et al., 2022) and carbon footprints (Zhou et al., 2019; Wang et al., 2022). Moreover, identifying region-specific emission pathways and their structural drivers is critical for formulating differentiated and equitable environmental policies (Xu et al., 2024). This analytical perspective is equally relevant to the ICT sector, where extended supply chains and strong cross-regional linkages call for a deeper understanding of its resource-environment-economic interactions at the subnational level.
At the same time, the ICT industry provides a clear example for decoupling analysis, as some provinces enhance environmental efficiency while others continue to experience an increase in their environmental footprint. Structural decomposition analysis (SDA) and the Tapio decoupling model have proven effective in distinguishing the roles of scale, structural, and intensity changes (Shimotsuura, 2025; Oladunni et al., 2024; Zheng and Hu, 2025). However, current research still lacks a comprehensive investigation into the interprovincial dynamics of water-carbon footprint flows within China’s ICT industry and their decoupling from economic growth. Few studies have integrated the water and carbon dimensions within a unified framework, nor have they addressed the sector’s spatial heterogeneity and underlying drivers.
To bridge these gaps, this study integrates the Environmentally Extended Multi-Regional Input-Output (EE-MRIO) model, Structural Decomposition Analysis (SDA), and the Tapio decoupling model to systematically examine the spatial flow characteristics, evolutionary trends, and decoupling patterns of water and carbon footprints within China’s ICT industry from 2012 to 2017. By identifying the spatial distribution of water-carbon pressures, virtual resource transfer pathways, and key driving factors, this study aims to provide theoretical insights and policy guidance for regionally tailored green transitions. The findings are expected to advance the methodological integration of footprint accounting and decoupling analysis and to contribute constructively to environmental governance in industry and regional contexts.
2 Method and data
2.1 Environmentally extended multi-regional Input−Output analysis
This study utilizes an EE-MRIO model to quantify the interprovincial transfers of water and carbon footprints linked to China’s ICT industry between 2012 and 2017. Previous research has extensively used Input-Output Analysis to characterize economic relationships between sectors, relying on input-output tables. By integrating environmental extensions into the conventional Multi-Regional Input-Output model, the EE-MRIO framework captures the embodied environmental impacts associated with the trade of goods and services. The fundamental formulation is as follows:
The model structure incorporates a total economic output matrix
By incorporating the sectoral water withdrawal parameter wand direct carbon emission parameter
Here,
Additionally, the export-driven water and carbon footprints for province
Through the introduction of transpose matrices, the ICT industry's water and carbon footprints in interprovincial trade for province r can be derived as shown in Equation 5:
The study employs a static MRIO framework for comparative analysis across selected years. While it does not capture dynamic intertemporal feedbacks or adaptive adjustments, it remains a widely adopted approach for assessing structural drivers of environmental pressures over time. The comparability and sectoral consistency across benchmark years make it suitable for evaluating medium-term transitions, although temporal policy responsiveness may be limited. Although the EE-MRIO framework provides comprehensive accounting of embodied environmental flows across sectors and regions, it is not exempt from uncertainty arising from harmonization of inter-regional data, sectoral concordances, and coefficient assumptions. Prior studies (Lenzen et al., 2010; Wiedmann et al., 2011; Chen J. et al., 2018; Perez-Valdes et al., 2025) have systematically assessed the propagation and sources of uncertainty in MRIO model.
2.2 Decoupling analysis
Decoupling analysis is a method used to determine whether industrial development is synchronized with resource consumption and environmental changes. The status of decoupling indices provides a means to evaluate the sustainability of industrial development (Wang et al., 2018). In this study, we select the value-added of ICT trade along with water and carbon footprints as key indicators, applying the Tapio elasticity-based decoupling model for analysis. The aim is to assess the relationship between the growth rates of carbon (or water) footprints and the trade value-added (VA). If the footprint growth is lower than that of VA, it indicates a trend of decoupling, suggesting reduced environmental pressure alongside economic growth; otherwise, it reflects coupling.
The production-side decoupling, formally defined in Equation 6, reflects the relationship between local production activities and environmental pressure, while the consumption-side decoupling, given in Equation 7, represents the environmental burden induced by local final consumption.
As shown in Equations 8, 9,
According to Tapio (2005), elasticity can be classified into eight decoupling states, as illustrated in Table 1. In this framework, the elasticity range of 0.8–1.2 is used to represent a coupling state, where the environmental pressure (e.g., water or carbon footprint) changes approximately in proportion to economic output. This interval accounts for normal statistical variation and measurement uncertainty in annual data and has been widely adopted in subsequent decoupling studies to ensure consistency and comparability across regions and years (Magazzino et al., 2024; Chen X. et al., 2018; Wu et al., 2018).
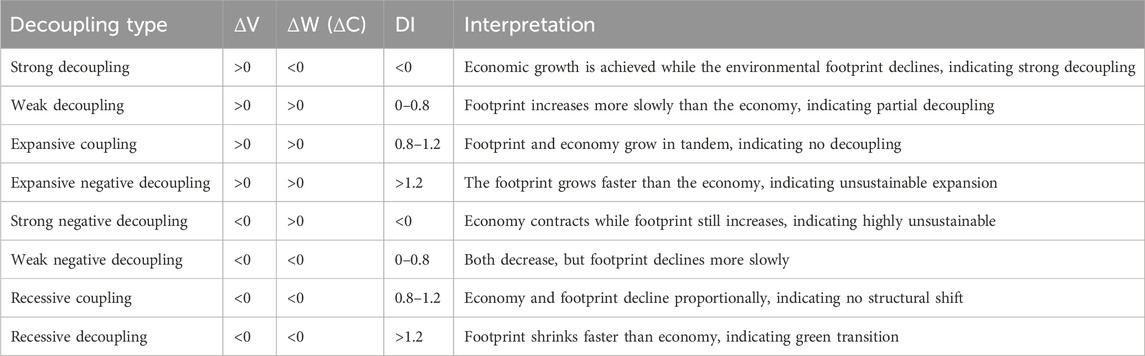
Table 1. Classification of decoupling types.
2.3 Structural decomposition analysis
To identify the driving forces behind the ICT sector’s water and carbon footprints, we adopt Structural Decomposition Analysis (SDA), a method widely used in energy and emission studies (Su and Ang, 2012; Li Y. et al., 2023).
We assume that the water (or carbon) footprint in the base year and year
In Equation 10, each of the five terms represents the contribution of a single factor to the footprint change, assuming all other variables remain constant. To approximate the average of all possible decompositions, we apply the average of two polar decompositions.
This results in the simplified expression shown in Equation 11, where the change in the consumption-based footprint of provincial ICT sectors is attributed to five drivers:
In Equation 11,
2.4 Data source
The MRIO tables and carbon emissions data for China in 2012, 2015, and 2017 are sourced from the China Emission Accounts and Datasets (CEADs), which cover 31 provinces and 42 socio-economic sectors (Zheng et al., 2021; Shan et al., 2020). Although the use of three cross-sectional years may limit the inference of long-term dynamic trends, these selected years span key phases in China’s ICT development—covering the expansion of digital infrastructure, the implementation of national green policies, and the gradual transition toward service-oriented trade. Moreover, while incremental structural changes occurred in China’s economy during this period, the overall industrial composition and regional trade patterns did not undergo disruptive transformation. Therefore, these three data points can still reliably reflect medium-term decoupling behavior and spatial shifts in environmental burden. Similar time-window settings have been applied in other MRIO-based footprint studies in China (Yang et al., 2025; Jiang et al., 2023).
Water consumption data were compiled from multiple sources. Provincial-level water consumption statistics (spanning agricultural, industrial, domestic, ecological, and total usage) were extracted from the China Statistical Yearbook, while household water consumption was obtained from the China Urban and Rural Construction Statistical Yearbook.
To match the sectoral resolution adopted in this study, all raw data were preprocessed and reallocated as follows. Agricultural water use, including irrigation for farmland, orchards, pastures, fishponds, and livestock, was directly assigned to the agricultural sector; Industrial water use refers to water withdrawn by mining and manufacturing enterprises (excluding internal recycling), and was distributed across sectors using province-level water intensity coefficients from the 2008 China Economic Census Yearbook; Domestic water use encompasses household, tertiary sector, and construction activities. Construction water intensity was derived from the 2011 National Water Census (Ministry of Water Resources), with efficiency improvement projected backward to 2008 and forward to 2017 under a conservative 6% annual gain rate (Zhang and Anadon, 2014). The 6% is the binding target for the industrial sector in the 11th Five-Year Plan (National Development and Reform Commission’s 11th Five-Year Plan for the Construction of a Water-saving Society), and the construction industry, as a high-water consumption industry, needs to meet the standards simultaneously. Tertiary sector water use was disaggregated based on the intermediate input shares of the water production and supply sector to various service industries (Zhang and Anadon, 2014; Sun et al., 2017). Household water use was allocated to the water production and supply sector, while ecological water use was assigned to public utility management (Han et al., 2015). This study focuses on blue water-surface and groundwater withdrawals, excluding rainfall due to its non-competitive nature and measurement challenges. Similarly, grey water, defined as the volume of freshwater required to dilute pollutants, was omitted due to data unavailability.
3 Results
3.1 Analysis of water–carbon footprints of the ICT sector from production and consumption perspectives
3.1.1 Assessment of ICT sector water and carbon footprints
Table 2 systematically presents the dynamic evolution of production-based and consumption-based water footprints (PBWF, CBWF) and carbon footprints (PBCF, CBCF) associated with China’s ICT industry across six major regions in the years 2012, 2015, and 2017.
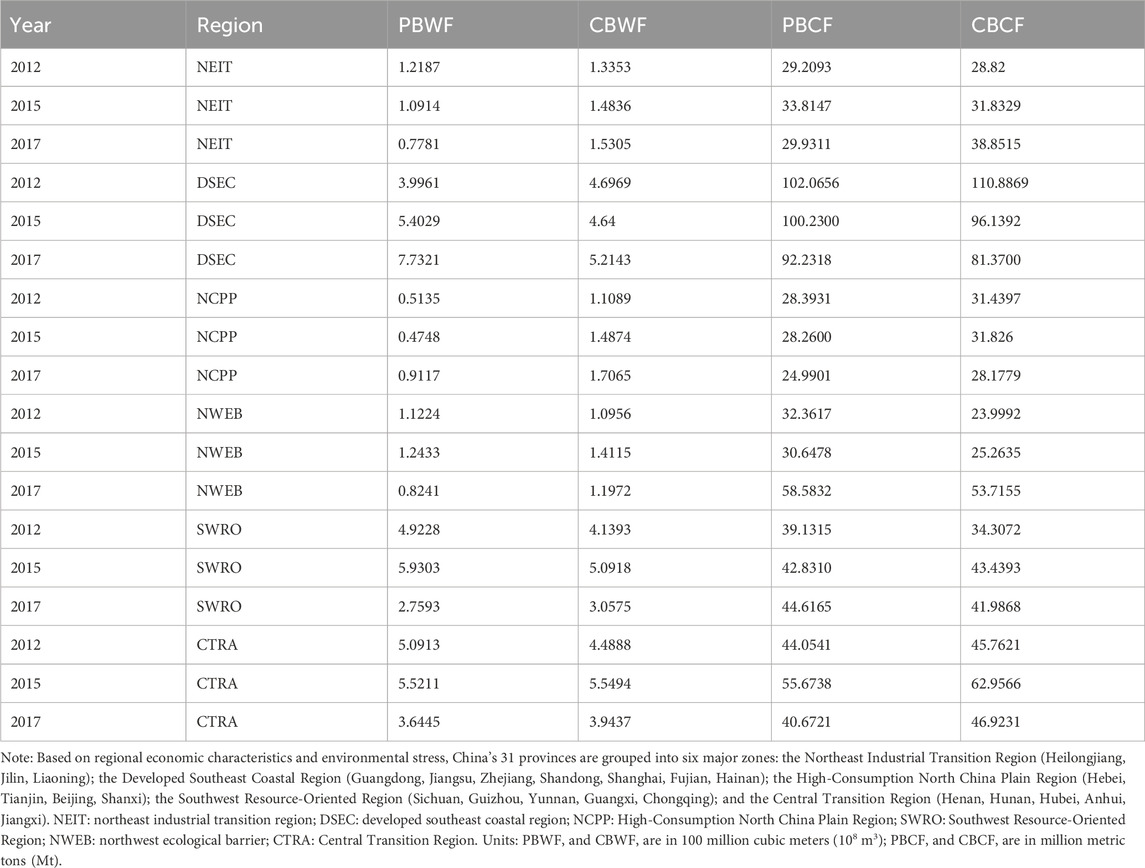
Table 2. Water and carbon footprints of China’s ICT sector by region.
From a macro perspective, the production-side water footprint of China’s ICT industry increased from 1.686 billion m3 in 2012 to 1.966 billion m3 in 2015 but subsequently declined to 1.665 billion m3 by 2017, effectively returning to the 2012 level. This trend reflects a contraction in water use following a brief period of industrial expansion. However, regional variations in this trend are pronounced. Notably, the southeastern coastal region, which hosts China’s most advanced ICT manufacturing capabilities, witnessed its production-side water footprint soar from 399.61 million m3 in 2012 to 773.21 million m3 in 2017, representing growth exceeding 90%. Its share of the national total climbed from less than one-quarter to nearly one-half, underscoring its growing dominance in ICT manufacturing. Conversely, both the southwestern resource-based region and the central transitional region experienced significant declines in their production-side water footprints after peaking in 2015, falling to 275.93 million m3 and 364.45 million m3, respectively, by 2017—a reduction of nearly 50%. This decline suggests substantial structural adjustments in production scale or efficiency within these resource-intensive regions.
Regarding the consumption-side water footprint, the aggregated trend across regions paralleled that of the production side—initially rising and then declining—though notable regional disparities persist. For example, in the northeastern industrial transition region, the production-side water footprint steadily decreased, while the consumption-side footprint increased from 133.53 million m3 in 2012 to 153.05 million m3 in 2017. This indicates growing ICT product demand despite diminishing local production capacity, characterizing the region as a “net importer.” Similarly, the North China Plain high-consumption region saw its consumption-side water footprint rise from 110.89 million m3 in 2012 to 170.65 million m3 in 2017—outpacing the growth on the production side—indicating its rising significance as a major ICT consumption market.
The evolution of the carbon footprint displays a more complex pattern. The production-side carbon footprint of the national ICT industry rose significantly from 275.22 Mt in 2012 to 291.46 Mt in 2015, followed by a slight decline to 291.02 Mt in 2017, indicating a consistently high level of emissions. Regionally, the developed southeastern coastal region remained the largest contributor to carbon emissions; however, its emissions declined from 102.07 Mt in 2012 to 92.23 Mt in 2017, a reduction of around 10%, suggesting improved carbon efficiency. In stark contrast, the northwestern ecological region saw a dramatic surge in carbon footprint, reaching 58.58 Mt in 2017, an increase of over 80% from 2012, highlighting the westward shift of resource-intensive ICT production and the associated ecological burden. The central transitional region also experienced a decline in emissions, dropping from a 2015 peak of 55.67 Mt to 40.67 Mt in 2017, indicating a phase of industrial optimization and restructuring.
The consumption-side carbon footprint also remained elevated nationwide, albeit with fluctuations. In the southeastern coastal region, the footprint dropped significantly from 110.89 Mt in 2012 to 81.37 Mt in 2017, yet it still ranked first nationally, underscoring the region’s sustained prominence in ICT product demand. Conversely, the northeastern region exhibited a rising trend, with its consumption-side carbon footprint increasing from 28.82 Mt in 2012 to 38.85 Mt in 2017. Against a backdrop of contracting local production, the continued growth in consumption indicates a rising share of final ICT product use, intensifying dependence on externally sourced high-carbon goods.
In summary, the spatial distribution and temporal evolution of water and carbon footprints in China’s ICT industry reveal marked regional disparities. The eastern coastal region continues to serve as a production-oriented export hub, while the western region is increasingly assuming the role of a resource-based production base. Meanwhile, the central and northeastern regions are gradually transitioning into consumption-oriented areas. This spatial restructuring not only reflects the reconfiguration of functional zones within the ICT industry but also highlights the mechanisms of cross-regional transfers of resource pressures and environmental burdens.
3.1.2 Spatiotemporal patterns of water and carbon footprints in the ICT sector
Based on the spatial heatmaps presented in Figures 1, 2, the provincial-level water and carbon footprints of China’s ICT sector from 2012 to 2017 demonstrated significant heterogeneity across both production and consumption dimensions. Distinct patterns emerged in terms of spatial distribution, temporal evolution, and interregional linkages.
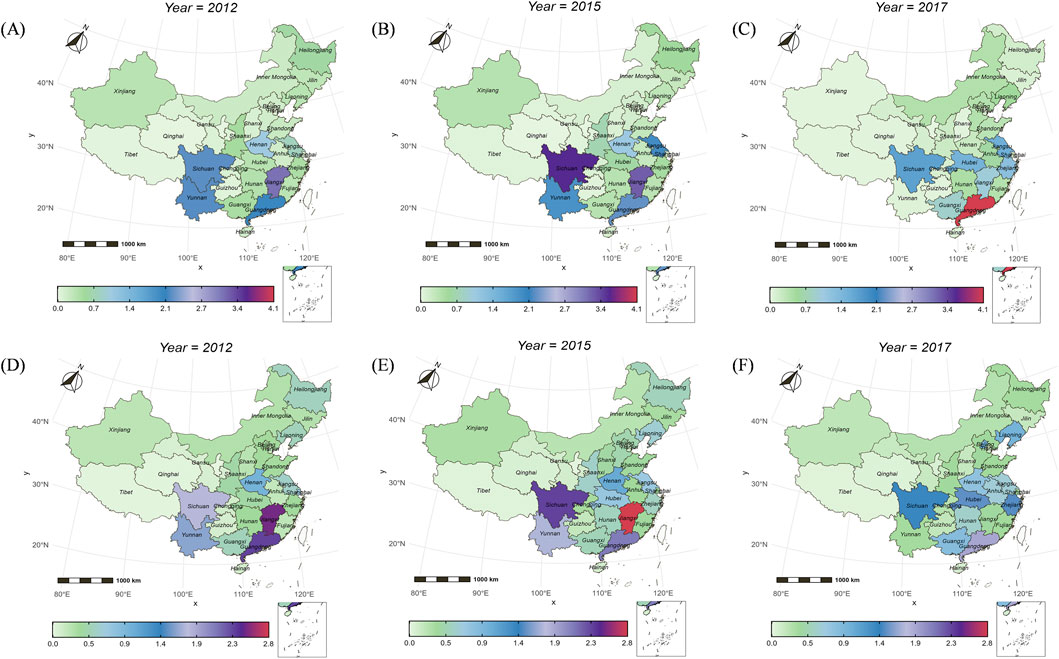
Figure 1. Spatial distribution of water footprints in China’s ICT sector, 2012–2017. (A–C) Show production-based water footprints for 2012, 2015, and 2017, respectively; (D–F) show consumption-based water footprints for the corresponding years. The heatmaps reflect regional heterogeneity and temporal changes in water footprint agglomeration and transfer patterns.
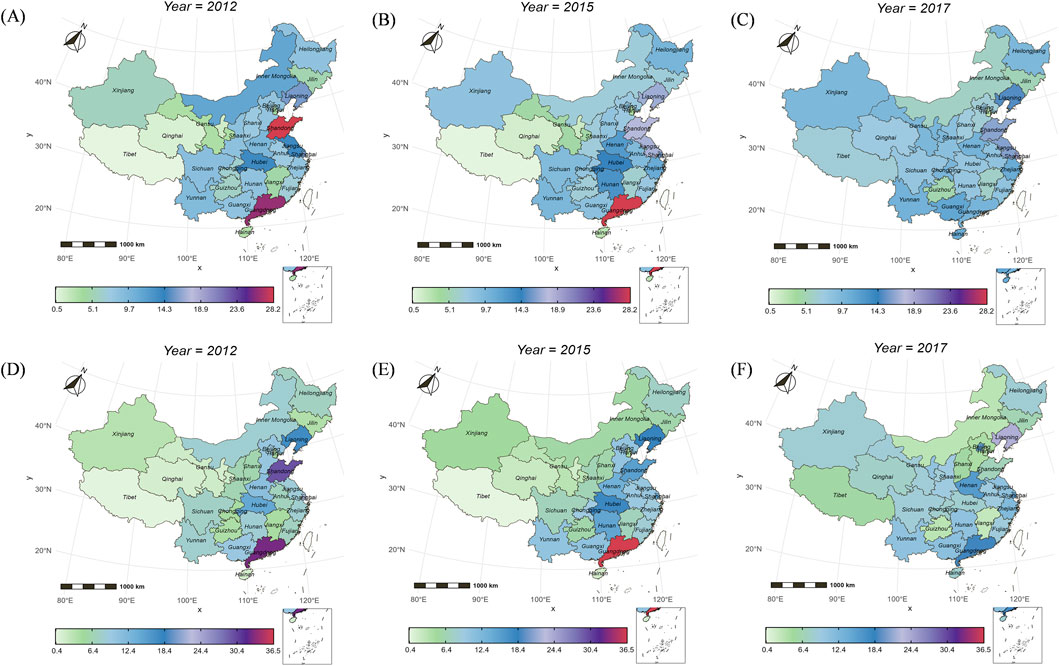
Figure 2. Spatial distribution of carbon footprints in China’s ICT sector, 2012–2017. (A–C) Show production-based carbon footprints for 2012, 2015, and 2017, respectively; (D–F) show consumption-based carbon footprints for the corresponding years. The heatmaps illustrate dynamic shifts in carbon emission hotspots and spatial imbalance characteristics.
Regarding water footprints, the spatial configuration of production-based footprints underwent substantial restructuring between 2012 and 2017. As illustrated in Figure 1A, in 2012, production-side water footprints were predominantly concentrated in Jiangxi (315.64 million m3), Sichuan (217.64 million m3), Yunnan (215.66 million m3), Guangdong (199.16 million m3), and Henan (103.21 million m3). This concentration reflects high levels of ICT manufacturing activity and water-intensive processes in these provinces. By 2015 (Figure 1B), this pattern intensified, with darker shading observed in Sichuan and Yunnan; notably, Sichuan’s water footprint increased to 358.64 million m3, ranking first nationwide. However, by 2017 (Figure 1C), the shading in western regions lightened considerably, as Sichuan’s footprint decreased to 168.71 million m3. Conversely, Guangdong and Jiangsu emerged as new hotspots, with Guangdong leading at 410.98 million m3—accounting for over half of the southeastern coastal region’s total (773.2 million m3). This shift indicates enhanced industrial agglomeration in eastern China, likely driven by improvements in water-use efficiency or the spatial relocation of water-intensive production activities.
In contrast, consumption-based water footprints showed stronger and more persistent clustering in coastal and densely populated areas (Figures 1D–F), alongside a steady upward trend. In 2012 (Figure 1D), Jiangxi (251.85 million m3) and Guangdong (234.90 million m3) already stood out above neighboring provinces. By 2015 (Figure 1E), high consumption levels extended along the southeastern coast and into interior provinces such as Hunan, Sichuan, and Henan. In 2017 (Figure 1F), Guangdong remained the top consumption region, reaching 256 million m3, reflecting ongoing expansion in ICT-related end use. Unlike the more dynamic spatial shifts seen on the production side, the consumption-based configuration remained relatively stable, with eastern provinces increasingly dependent on virtual water imports to meet ICT demand.
The spatial distribution of carbon footprints exhibits pronounced dynamic shifts across provinces from 2012 to 2017. As shown in Figure 2A, the production-side carbon footprint in 2012 was heavily concentrated in Shandong (28.18 Mt) and Guangdong (26.28 Mt), forming two major emission centers. In 2015 (Figure 2B), Guangdong’s emissions peaked at 28.16 Mt, while eastern provinces remained dominant. By 2017 (Figure 2C), however, a marked decline occurred in the east, with Guangdong’s footprint dropping sharply to 10.05 Mt. In contrast, provinces such as Shaanxi and Gansu in the northwest exhibited substantial increases, e.g., Shaanxi rose from 7.3 Mt in 2012 to 15.5 Mt in 2017. This shift in shading from green to dark blue signals an ongoing westward relocation of ICT-related industrial activities, consistent with western China’s resource endowments and coal-based energy structure.
On the consumption side (Figures 2D–F), carbon footprints formed persistent hotspots in coastal economic hubs and gradually diffused inland. In 2012 (Figure 2D), Guangdong (32.88 Mt), Shandong, and Shanghai led in consumption-based emissions. By 2015 (Figure 2E), this pattern persisted, with Guangdong reaching 36.45 Mt. Despite a notable decline to 18.74 Mt by 2017 (Figure 2F), Guangdong remained the highest-consuming province, indicating sustained demand-side pressure. Overall, consumption-side carbon footprints were more stable and continued to reflect strong regional imbalances in final ICT usage.
3.2 Virtual water-carbon flows in the ICT sector
With the ICT industrial chain deeply embedded in regional economic structures, the associated environmental burdens exhibit pronounced spatial flows across provinces. Based on Table 4, Figures 3, 4, a typical three-stage flow pattern “resource outflow, resource transfer, and value consumption” can be identified. This pattern reveals the implicit logic of resource migration underlying ICT production and trade.
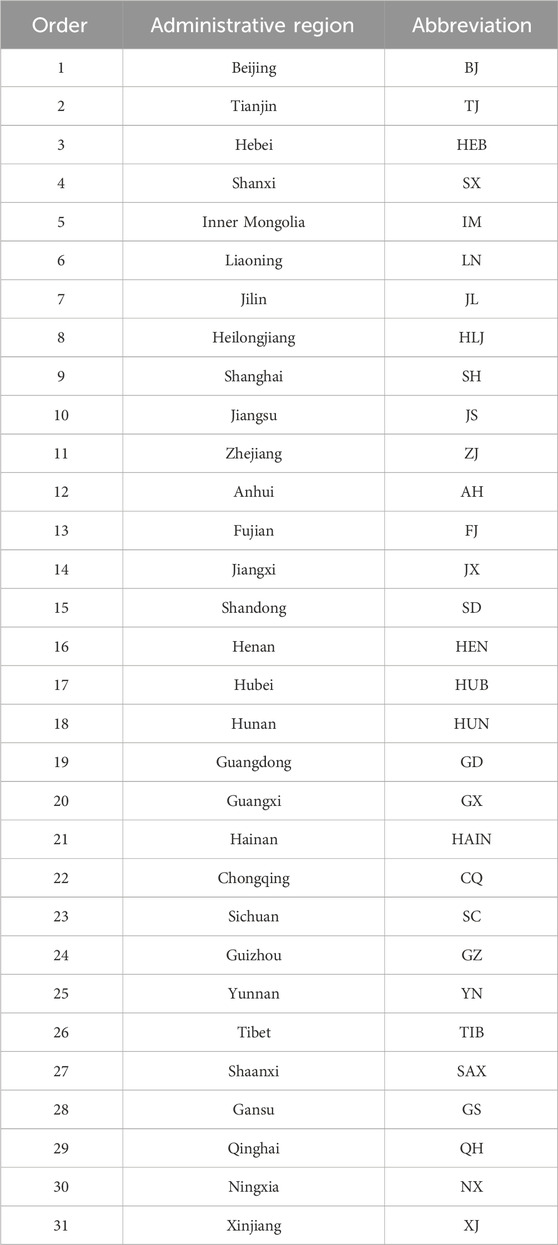
Table 3. Abbreviation standards for China’s provincial administrative regions.
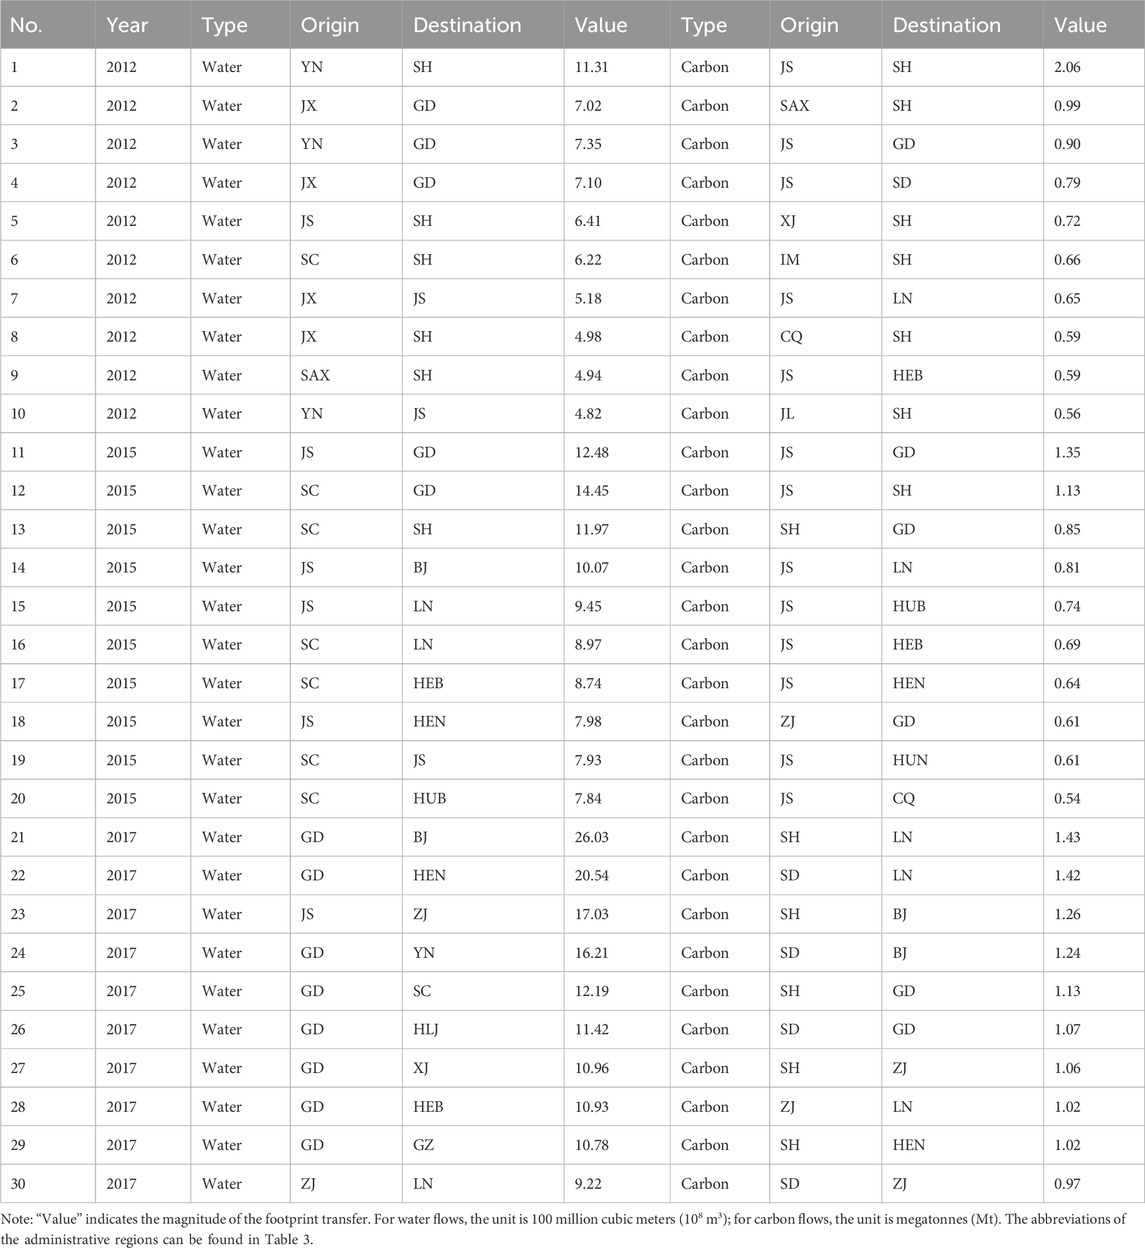
Table 4. Top 10 interprovincial virtual water and carbon footprint transfer pathways of China’s ICT sector.
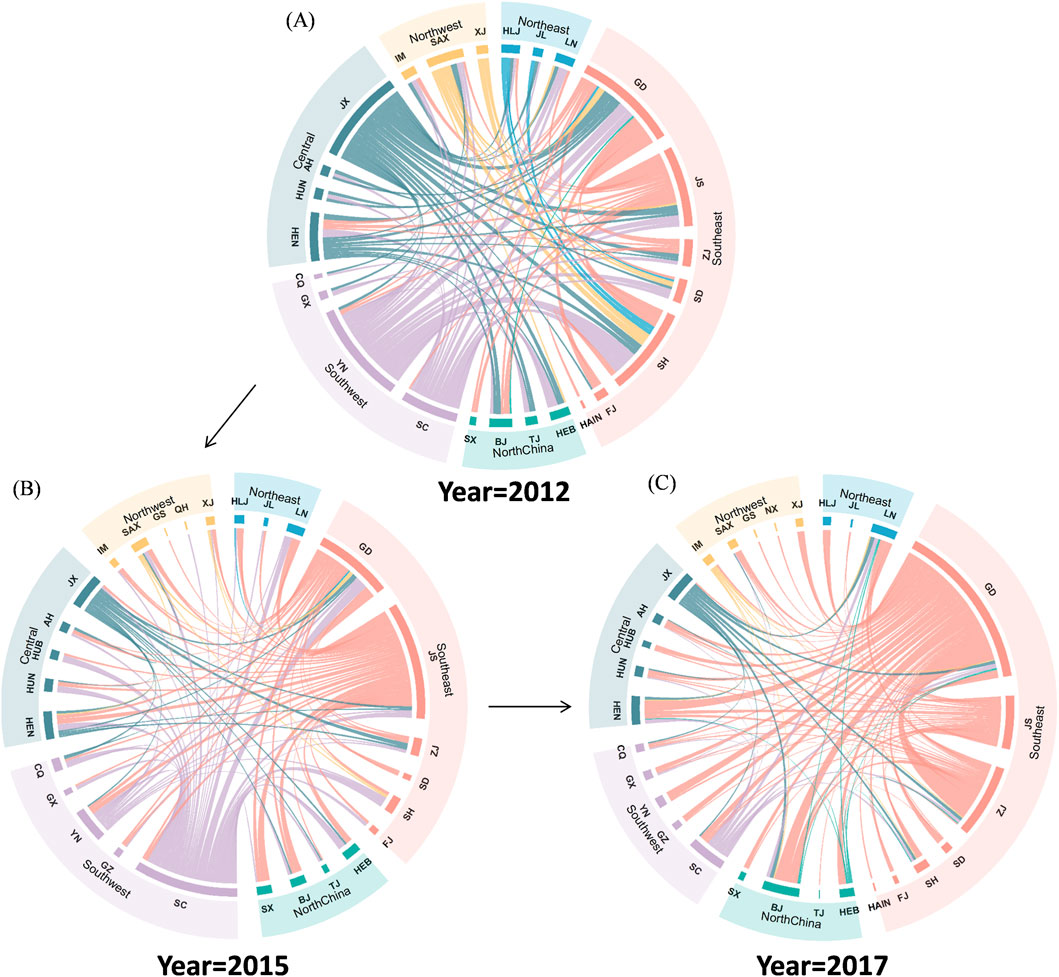
Figure 3. Interprovincial water footprint flows in China’s ICT sector. (A–C) Depict water footprint transfer networks for 2012, 2015, and 2017, respectively. The maps reflect the direction, magnitude, and structural changes of virtual water flows between provinces, including the transition from west-to-east outflows to hub-based interactions.
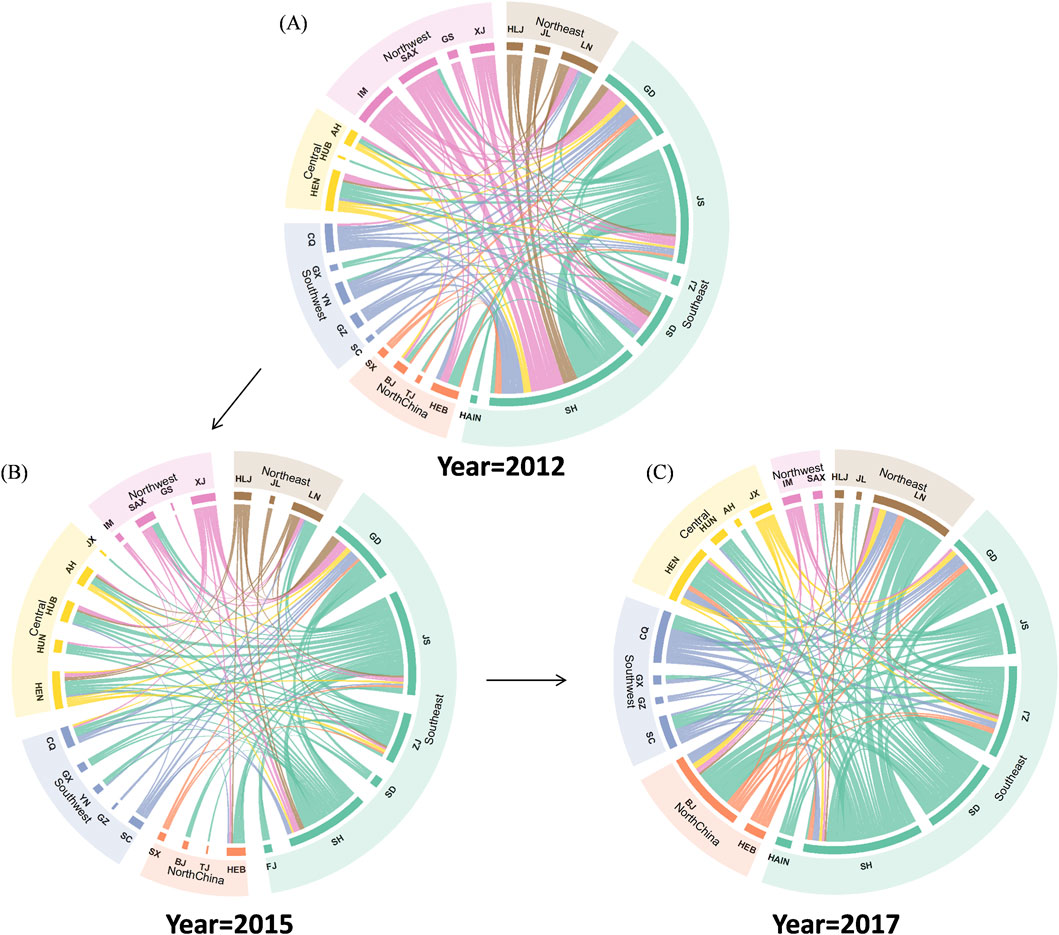
Figure 4. Interprovincial carbon footprint flows in China’s ICT sector. (A–C) Depict carbon footprint transfer networks for 2012, 2015, and 2017, respectively. The maps reflect the direction, magnitude, and structural shifts of embodied carbon flows between provinces, including the westward relocation of high-carbon production segments and the role of eastern hubs in externalizing emissions.
From the perspective of water footprints (Figure 3), in 2012 virtual water predominantly flowed from the resource-rich but economically less developed southwestern provinces to the economically advanced southeastern coastal consumption hubs. For example, Yunnan exported 11.31 million cubic meters of water footprint to Shanghai, while Jiangxi and Sichuan exported over 7.00 and 6.60 million cubic meters, respectively, to Guangdong and Jiangsu. In 2015, Jiangsu had become the largest exporter of virtual water, sending 12.48 million cubic meters to Guangdong. Meanwhile, Sichuan’s exports to Guangdong and Shanghai reached 14.45 and 11.97 million cubic meters, respectively. In 2017, a notable structural reversal occurred: Guangdong emerged as the top exporter of water footprints, sending 26.03, 20.54, and 16.21 million cubic meters to Beijing, Henan, and Yunnan, respectively. This indicates that, alongside its increasing role in midstream ICT production, Guangdong began to externalize its local water pressures. Consequently, the Guangdong–Hong Kong–Macao Greater Bay Area began to exhibit characteristics of a “resource-exporting hub.”
From the perspective of carbon footprints (Figure 4), the early-stage coal power–driven manufacturing path—from energy-intensive northern provinces such as Shanxi, Inner Mongolia, and Gansu to manufacturing-intensive eastern coastal regions—remained dominant in 2012. Notably, Jiangsu exported 2.06 Mt of carbon footprint to Shanghai, marking the largest carbon transfer pathway that year. By 2015, Jiangsu’s dominance further intensified, with substantial carbon flows to Guangdong (1.35 Mt), Shanghai (1.13 Mt), and Liaoning (0.81 Mt). This reflects Jiangsu’s pronounced role in bearing the high-energy-consuming segments of ICT manufacturing activities. By 2017, the center of carbon footprint outflows shifted to Shanghai and Shandong. Shanghai alone exported 1.43 Mt of carbon to Liaoning and 1.26 Mt to Beijing, illustrating the externalization of carbon emissions by core eastern cities as they retained and restructured segments of their manufacturing bases.
From the perspective of water-carbon coupling, provinces such as Guangdong, Jiangsu, and Sichuan simultaneously act as both exporters and importers of water and carbon footprints, positioning them as pivotal resource hubs within the ICT industrial chain. For instance, in 2017, Guangdong exported significant volumes of water footprint to multiple regions while simultaneously importing high-intensity carbon footprint from cities such as Shanghai, forming a typical bidirectional resource exchange structure. By contrast, provinces like Jiangxi and Yunnan primarily serve as resource-exporting regions, with water footprint outflows far exceeding local consumption footprints. This indicates their role as low-end carriers in the ICT industrial value chain, characterized by resource-intensive production and limited value retention.
3.3 Regional pressure analysis of water-carbon footprints in the ICT sector
In Figure 5, A series of bubble charts is used to visualize and compare the performance of Chinese provinces in 2012, 2015, and 2017. In the visualizations, the x-axis represents the magnitude of the water footprint, the y-axis denotes the carbon footprint, bubble size corresponds to the trade value added, and color indicates the province’s relative economic rank on a national scale. This framework enables a multidimensional assessment of regional characteristics from the interconnected perspectives of resource input, environmental cost, and economic output.
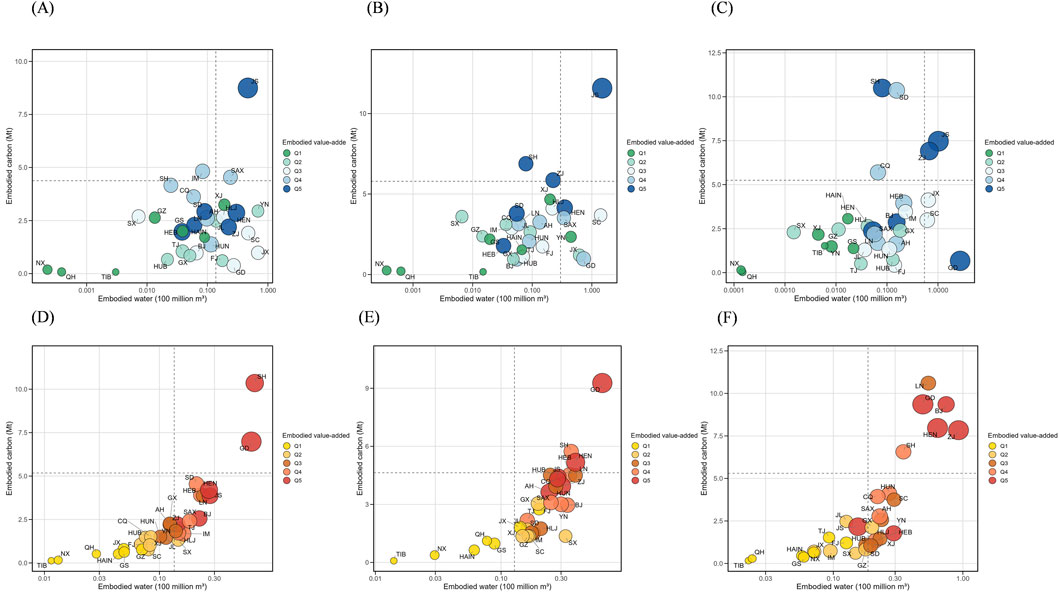
Figure 5. Regional pressure of China’s ICT sector. (A–C) Represent export-based analyses for 2012, 2015, and 2017, respectively; (D–F) represent import-based analyses for the corresponding years. The x-axis denotes water footprint, y-axis denotes carbon footprint, bubble size corresponds to trade value-added, and color indicates provincial economic rank.
The export perspective unveils the fundamental structure of environmental pressures externalized through local production activities. This viewpoint is crucial for guiding the design of green supply chains and optimizing the spatial layout of resource-intensive industries. From an export perspective, Jiangsu consistently falls into Quadrant I (high water and high carbon footprints with high value added) across all 3 years, highlighting its dominant position as a national ICT manufacturing hub. Shaanxi and Zhejiang also appeared in Quadrant I in 2012 and 2015, respectively, with moderately high trade value added, albeit lower than Jiangsu. These provinces are characterized by energy-intensive operations such as hardware production and integrated assembly. Although they occupy upper segments of the value chain, their resource and environmental costs remain significant. Over time, the bubble representing Jiangsu expanded significantly from 2012 to 2017, indicating substantial growth in trade value added. However, its water and carbon metrics did not decline correspondingly, reflecting a lag in eco-efficiency improvements relative to economic output. This may be attributed to a continued reliance on conventional energy systems and resource-intensive production modes.
Quadrant II (low water, high carbon) includes provinces such as Shandong, Chongqing, Shanghai, Inner Mongolia, and Zhejiang. These regions exhibit moderate water use but disproportionately high carbon emissions, often due to coal-based energy reliance and a dominance of primary electronics processing industries. Targeted policies for energy system decarbonization and efficiency upgrades should be prioritized in these areas.
Quadrant III (low water, low carbon) is predominantly occupied by non-core central and western provinces such as Ningxia, Qinghai, and Tibet, which have relatively small bubble sizes. This reflects a limited scale of ICT exports and correspondingly low environmental impact. While the ecological burden is minimal, these regions face risks of industrial marginalization. Investment in digital infrastructure or the development of low-carbon data centers could help integrate them into greener value chains.
Quadrant IV (high water, low carbon) includes provinces with clean energy advantages such as Yunnan and Jiangxi. Owing to their substantial reliance on hydropower, ICT manufacturing in these areas involves significant water use but maintains relatively low carbon emissions, reflecting a deliberate strategy of substituting water for carbon in energy sourcing.
In contrast to the export perspective, import-based footprints—both virtual water and carbon—are primarily associated with final consumption activities within the province. This highlights the externalization of environmental responsibility on the consumption side.
Quadrant I continues to be dominated by high-consumption provinces such as Guangdong and Shanghai, indicating that the externalized water and carbon footprints induced by ICT consumption are concentrated in these regions. Their consumption behavior serves as a major driver of interprovincial resource flows and carbon emissions. For instance, Guangdong remained in the high-water–high-carbon quadrant in both 2015 and 2017, with a notable increase in bubble size. This reflects its robust final demand capacity, which drives nationwide ICT product inflows and results in the externalization of water and energy pressures to other provinces.
Notably, no provinces fall into Quadrant II (low water, high carbon) in any of the three observed years. This suggests that carbon-intensive yet water-efficient consumption patterns have not emerged in China’s ICT product demand. Instead, high carbon inputs are often accompanied by high water footprints, indicating the absence of a consumption-side trend toward resource decoupling.
Notably, no provinces fall into Quadrant II (low water, high carbon) in any of the three observed years. This suggests that carbon-intensive yet water-efficient consumption patterns have not emerged in China’s ICT product demand. Instead, high carbon inputs are often accompanied by high water footprints, indicating the absence of a consumption-side trend toward resource decoupling. This pattern implies that the early-stage manufacturing phases of ICT products still exhibit a pronounced resource coupling effect.
Overall, in contrast to the more varied distribution seen in the export-based analysis, the import-centric bubble plots exhibit a greater concentration, mainly in Quadrants I, III, and IV. Furthermore, the spatial distributions of embodied water and carbon are tightly correlated across regions. For instance, apart from Guangdong and Shanghai, the majority of provinces are situated in the low-water to low-carbon or high-water to low-carbon quadrants. This suggests that their overall ICT consumption levels are relatively moderate or that they import products from regions with clean energy production. This indicates that the environmental impacts of ICT consumption in China are primarily shouldered by a handful of high-consumption areas, which then transfer resource pressures to production zones through interprovincial trade networks.
3.4 Decoupling analysis
We selected key provinces representing three typical categories for analysis: export-oriented manufacturing provinces, high-consumption resource-importing provinces, and resource-intensive transitioning provinces. These categories reflect the resource efficiency and ecological transition characteristics of different segments of China’s ICT supply chain.
To assess the decoupling performance of key provinces in China’s ICT industry, we applied the Tapio elasticity model and the classification of decoupling types based on the DI. Figure 6 shows the Seven representative provinces: Jiangsu (JS), Guangdong (GD), Beijing (BJ), Shanghai (SH), Jiangxi (JX), Sichuan (SC), and Yunnan (YN), which were analyzed across two periods (2012–2015 and 2015–2017), covering both production-based and consumption-based perspectives for water and carbon footprints.
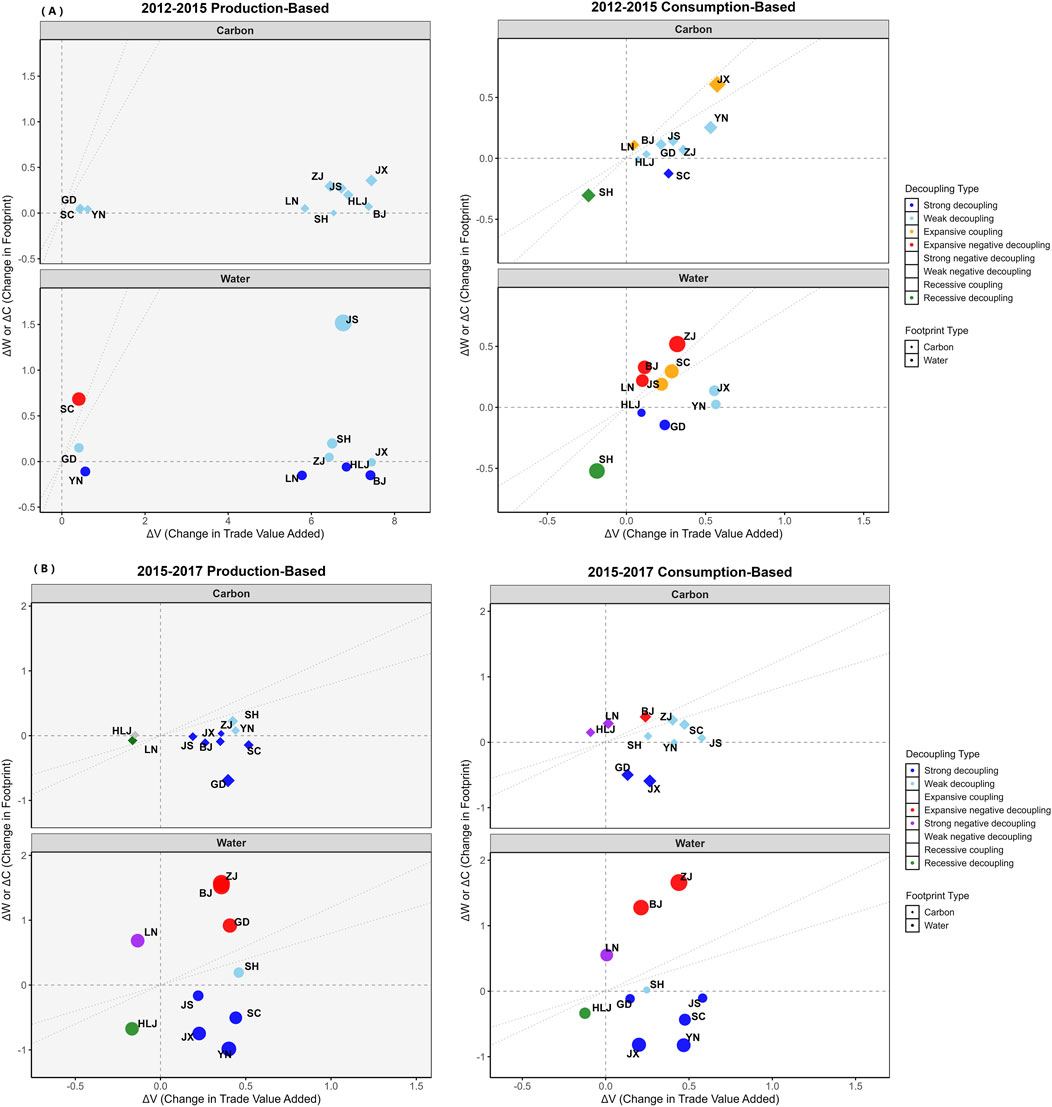
Figure 6. Decoupling patterns of water and carbon footprints in China’s ICT sector. (A) Shows decoupling trends from 2012 to 2015, distinguishing between production-based (left) and consumption-based (right) perspectives; (B) shows trends from 2015 to 2017 with the same differentiation. Symbols and colors represent different provinces (abbreviations in Table 3), and the legend classifies decoupling types.
Export-oriented manufacturing provinces such as Jiangsu and Guangdong exhibited contrasting trends. Jiangsu transitioned from an expansive negative decoupling status in 2012–2015 (Water DI = 4.52, Carbon DI = 26.61) to a clearly strong decoupling in 2015–2017 (Water DI = −1.11, Carbon DI = −0.31), indicating substantial improvements in resource efficiency alongside trade growth. Guangdong, by contrast, remained within the expansive coupling zone in 2015–2017 (Water DI = 0.01, Carbon DI = 0.03), suggesting that its production-side footprints grew nearly in tandem with economic output, though notable strong decoupling was observed on the consumption side during the same period.
Resource-intensive consumer provinces, including Beijing and Shanghai, demonstrated divergent decoupling pathways. Beijing’s consumption-based indicators remained in expansive negative decoupling across both periods (Water DI = 3.10 and 5.24), reflecting growing external water and carbon pressures driven by high ICT product demand. In contrast, Shanghai showed a positive shift from expansive coupling (2012–2015) to weak decoupling (2015–2017). DI values for both water and carbon footprints declining below 0.8, suggesting early signs of a green consumption transition.
Resource-transition provinces, including Jiangxi, Sichuan, and Yunnan, exhibited marked improvements in environmental efficiency. Jiangxi achieved consistent strong decoupling from 2015 to 2017., with water and carbon DI values dropping below zero. Sichuan and Yunnan also exhibited strong water decoupling, but their carbon decoupling was less pronounced, suggesting that advancements in water use efficiency preceded changes in the energy mix.
Overall, the decoupling trajectories across provinces reveal pronounced regional disparities. Export hubs such as Jiangsu have begun to decouple economic growth from environmental pressure, while high-consumption centers like Beijing remain resource-dependent. Western and central provinces show encouraging progress, particularly in reducing water footprints. These patterns highlight the urgent need for differentiated regional strategies. For instance, provinces exhibiting weak or expansive coupling (e.g., Guangdong and Beijing) should adopt targeted regulatory mechanisms such as water pricing reforms or embedded carbon taxation in ICT-related procurement. Meanwhile, strong-decoupling regions like Jiangsu and Jiangxi may serve as policy demonstration zones, where performance-based incentives (e.g., green finance credits, clean tech subsidies) are applied to consolidate and extend gains in decoupling. In this sense, the decoupling typology provides an operational foundation for allocating differentiated ecological responsibilities and designing region-specific governance instruments.
4 Discussion
4.1 Water-carbon pressure and spatial imbalance in China’s ICT sector
This study evaluates the characteristics of water and carbon footprints in China’s ICT industry from both production-based and consumption-based perspectives for the period 2012–2017. By integrating analyses on spatiotemporal distribution, virtual resource flow pathways, regional environmental pressure, and decoupling performance, we establish a theoretical feedback loop linking “regional resource endowments—industrial division of labor—environmental pressure.” The results reveal that the ICT sector in China exhibits significant spatial imbalances and structural mismatches in resource utilization and environmental burden, a condition exacerbated by regional development disparities and intensified industrial specialization.
From a spatiotemporal perspective, the water-carbon footprints of the ICT industry display a pronounced “east-high, west-low” gradient, with strong coastal agglomeration, particularly evident on the production side. Provinces such as Guangdong, Jiangsu, and Zhejiang demonstrate persistently high resource input intensities due to their manufacturing dominance, whereas consumption hotspots like Beijing and Shanghai rely heavily on imported virtual water and carbon through interregional trade.
The mapping of interprovincial virtual water–carbon flows highlights a spatial shift from “resource outflow” regions to “value consumption” regions. Resource-rich provinces in central and western China—such as Jiangxi, Sichuan, and Yunnan—act as environmental load bearers, exporting substantial embodied water and carbon to economically advanced eastern provinces. This pattern reflects a classic case of environmental outsourcing, whereby affluent regions externalize ecological costs to underdeveloped areas via trade mechanisms (Zhang et al., 2018; Wang P. et al., 2023; Zhai et al., 2024). It also reinforces existing findings on the disruptive impact of virtual resource flows on ecological equity (Weinzettel et al., 2013).
A comparative analysis of regional environmental pressure and economic output reveals that core manufacturing provinces such as Jiangsu continue to experience significant ecological stress. This persists despite their high economic contributions, indicating that advancements in green efficiency have not yet sufficiently mitigated the entrenched impacts of traditional, resource-intensive production models. In contrast, provinces such as Jiangxi and Yunnan represent “high-water, low-carbon” zones that leverage hydropower to support ICT manufacturing, illustrating the potential of clean energy pathways.
The decoupling analysis further underscores growing spatial disparities in water and carbon resource efficiency. While eastern manufacturing provinces have made notable progress in decoupling carbon emissions from economic growth, water resource pressures continue to rise. Consumption-driven provinces such as Beijing and Shanghai exhibit strong environmental coupling, with ecological costs highly externalized. Meanwhile, resource-based western provinces are undergoing structural contraction rather than proactive green transformation, indicating that ecological transition remains in its nascent stage. Overall, China’s ICT industry has not yet achieved a systemic green transition, and spatial mismatches in resource pressure remain significant. This calls for the establishment of more coordinated responsibility-sharing frameworks and robust ecological compensation mechanisms (Feng et al., 2022).
4.2 Structural decomposition analysis of driving forces and mitigation pathways
To further elucidate the underlying mechanisms behind changes in the ICT sector’s water and carbon footprints, this study applies the Structural Decomposition Analysis method to five representative provinces: Guangdong, Jiangsu, Beijing, Sichuan, and Jiangxi. The analysis covers two periods, 2012–2015 and 2015–2017, and decomposes changes in footprints into five contributing factors: resource intensity (Df), trade structure (DL), final demand structure (DS), per capita final demand (DC), and population size (DP).
In Figure 7, the results reveal marked heterogeneity in the dominant driving forces across provinces, reflecting their distinct structural profiles and stages of industrial transformation. Specifically, some provinces are primarily influenced by technological improvements (declines in Df), while others exhibit footprint changes driven by economic expansion (increases in DC or DP) or shifts in trade orientation. This divergence highlights the importance of designing differentiated ecological mitigation pathways tailored to each region’s resource base, industrial function, and development trajectory. The statistically significant impact of final demand and trade structure has also been confirmed in broader ICT decarbonization studies, reinforcing the validity of these decomposition drivers (Oladunni and Olanrewaju, 2022).
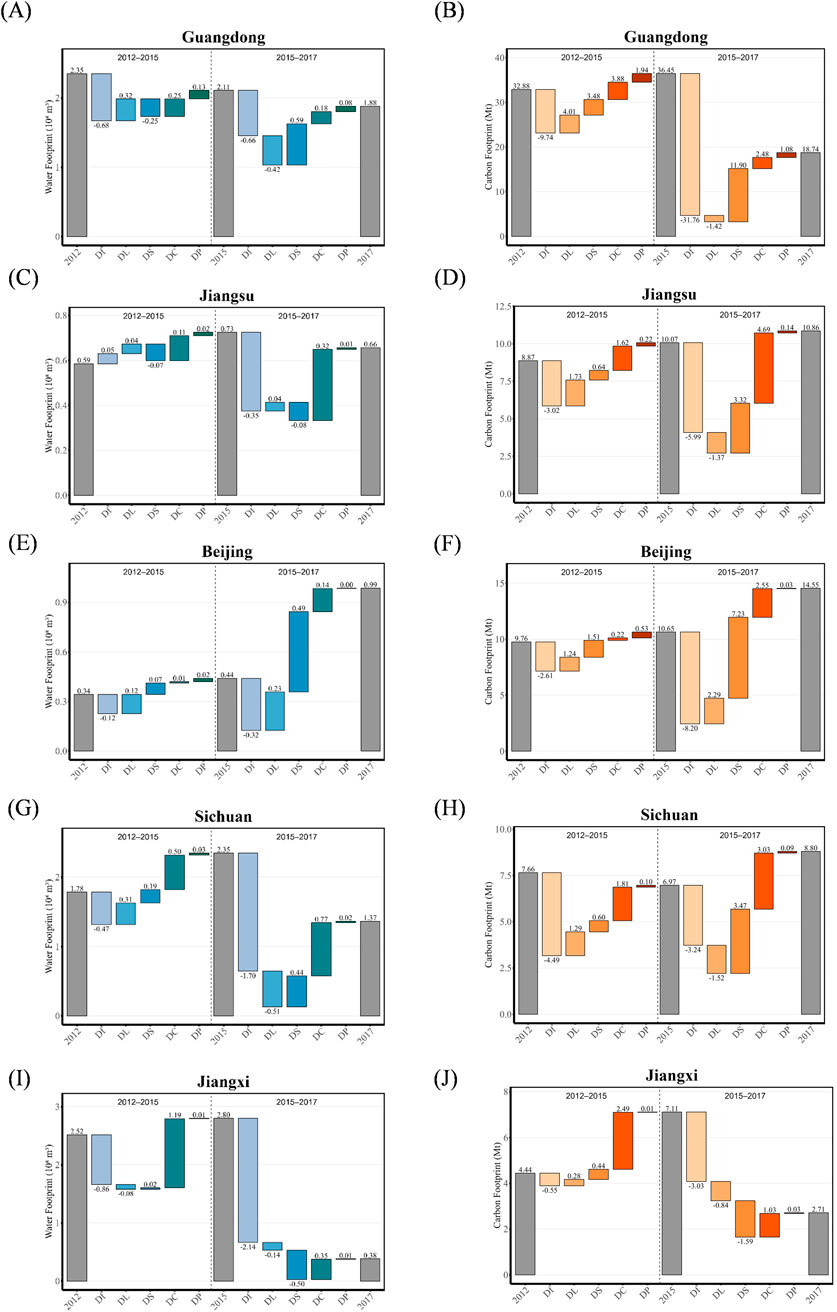
Figure 7. Structural decomposition analysis of driving factors for water and carbon footprints in China's ICT sector. Left panels (A, C, E, G, I) show water footprint drivers, while right panels (B, D, F, H, J) display carbon footprint drivers across five provinces: (A-B) Guangdong, (C-D) Jiangsu, (G-H) Sichuan, (E-F) Beijing, and (I-J) Jiangxi during 2012-2015 and 2015-2017. Colored bars represent contributions of key drivers, with gray bars indicating total footprint values.
Guangdong consistently exhibited high water and carbon footprints during both periods. The SDA results indicate that between 2012 and 2015, the primary drivers of its carbon footprint increase were the rise in per capita final demand (DC, contributing +3.88) and changes in final demand structure (DS, +3.48), reflecting significant expansion in terminal consumption. In contrast, carbon emission intensity contributed a strong negative effect (−9.74), suggesting that improvements in energy structure and technological advancements substantially mitigated carbon emissions. This trend persisted from 2015 to 2017, with Df declining further to −12.33, confirming its role as the core factor in carbon footprint control. For the water footprint, Df also emerged as the dominant negative contributor, although positive contributions from trade structure and final demand remained notable. These findings underscore the dual challenges that Guangdong faces in simultaneously addressing production-side efficiency and consumption-side expansion.
Overall, Guangdong should continue to strengthen green supply chain constraints and focus on promoting low-carbon and water-saving products among end consumers. Developing a consumption-oriented resource governance framework will be essential to managing both environmental pressure and regional sustainability responsibilities.
As a typical production-oriented province with concentrated resource usage, Jiangsu demonstrated a consistent pattern of declining carbon emission intensity, with contributions of −3.02 and −4.53 in the two respective periods. However, the positive effects of trade structure and per capita final demand remained substantial, with DL contributing +1.73 and +0.73, and DC contributing +1.62 and +2.00, respectively. A similar trend was observed for water footprints: although water-use intensity continued to decline, the driving forces from DL and DC were still prominent. Notably, DL’s contribution reached +1.25 during 2015–2017, indicating that Jiangsu’s export-oriented industrial chain has yet to achieve effective improvements in resource efficiency.
These findings suggest that Jiangsu should prioritize the green upgrading of high-carbon and high-water intermediate production segments. Tiered environmental standards, relocation subsidies, and targeted tax incentives for green R&D could further accelerate this structural shift while maintaining industrial competitiveness.
As a resource-importing city, Beijing’s growth in both water and carbon footprints has been primarily driven by increases in per capita demand and final demand structure. For carbon footprints, the combined contribution of DS and DL reached +2.75 during 2012–2015, while the reduction effect of Df was −2.61. In terms of water footprints, both DS (+1.07) and DC (+1.91) contributed significantly to the increase.
These results suggest that Beijing remains heavily dependent on external resources to support its digital consumption upgrading, particularly in areas such as data center services and smart device usage, thereby transferring water and carbon pressures across regions. To address this challenge, policy instruments such as green procurement regulations and consumption-oriented footprint accountability schemes should be strengthened. In particular, establishing a comprehensive water–carbon labeling system for ICT products, alongside carbon neutrality certification mechanisms for service providers, would enhance transparency regarding environmental impacts and enable informed purchasing decisions. These tools can function as levers to decouple resource demand from consumption growth at the end-user level.
As a representative of resource-intensive transitioning provinces, Sichuan held the highest water footprint nationwide in 2012, which declined significantly by 2017, indicating a typical pattern of strong water decoupling. SDA results confirm that water-use intensity was the dominant suppressing factor, contributing −4.56 and −3.21 in the respective periods. This suggests that substantial progress was made through local technological investments and sectoral regulation. However, the reduction in carbon footprint was relatively modest, with DL and DC consistently contributing positive values. This indicates that carbon-intensive segments, such as electricity-driven ICT manufacturing, have not yet undergone sufficient technological upgrading.
These findings point to the need for region-specific industrial policy tools, such as targeted subsidies for clean electricity transition and export tax rebates conditional on low-carbon process certifications to facilitate the decoupling of emissions from industrial scale.
Jiangxi has long served as a major exporter of virtual water through its role in the national ICT supply chain. SDA results indicate that changes in its water footprint were strongly driven by trade structure (DL, contributing +1.30 and +0.66) and per capita final demand (DC, +1.64 and +1.83). Although water-use intensity contributed negatively (−2.14 and −2.35), its suppressing effect was insufficient to offset the underlying structural burden. For carbon footprints, DC was the dominant growth factor during 2012–2015 (+2.49), while DL emerged as the main contributor in 2015–2017 (+1.56).
These trends reflect a lack of technological thresholds in Jiangxi’s industrial layout, which has led to a concentration of resource-intensive segments during the province’s engagement in upstream ICT manufacturing. Based on the SDA results, where DL and DC are primary growth drivers, policy efforts should emphasize reorientation of the production structure via fiscal tools, such as ecological compensation mechanisms and differentiated industrial tax policies to internalize virtual resource burdens. Promoting downstream, high-value-added ICT segments would also help decouple environmental impacts from trade expansion.
4.3 Research progress, limitations, and future directions
This study employs an EE-MRIO model combined with the Tapio decoupling framework to systematically quantify the water and carbon footprint dynamics of China’s ICT industry from 2012 to 2017. Despite its contributions, several limitations remain that warrant attention in future research.
First, regarding model construction, while the MRIO table offers strong systemic consistency and cross-year comparability, its static nature limits the capacity to reflect intertemporal feedbacks, industrial restructuring, and technological progress. Furthermore, although the EE-MRIO framework comprehensively captures embodied environmental flows across sectors and regions, it is not exempt from uncertainty due to harmonization of regional input-output data, sectoral concordance mismatches, and assumptions on technical coefficients.
Second, in terms of data processing, several region- and year-specific environmental intensity coefficients, particularly for water use and carbon emissions, were estimated or calibrated using multisource datasets, which introduces potential bias. The current study focuses on direct blue water and CO2 emissions, while grey water and rainfall components are excluded due to data unavailability. We recognize that grey water is particularly relevant for certain ICT-related activities, such as data center operations. Due to the lack of consistent grey water data, this study does not include such components, which may result in a partial representation of the sector’s total water-related impacts.
Third, although the Tapio decoupling model helps clarify the coupling relationship between resource consumption and economic output, it inherently assumes elasticity constancy and does not distinguish between intrinsic growth and structural transfer mechanisms. Capturing behavioral drivers, institutional dynamics, and technological shifts requires deeper integration of explanatory variables.
Fourth, the rapid growth of final demand in high-consumption provinces such as Beijing, Guangdong, and Shanghai may be partially driven by behavioral-economic transitions. These include rising digital lifestyles, growing demand for ICT-enabled services, and increased dependence on virtual infrastructure such as cloud computing and smart terminals. While such socio-behavioral dynamics are inherently difficult to isolate within this framework, future extensions may consider integrating proxy variables, such as ICT device penetration rate, digital service subscriptions, or e-commerce transaction density to better capture the underlying behavioral drivers of environmental footprint expansion.
Future research should address these gaps in several ways: (1) developing high-resolution ICT-specific environmental datasets to improve coefficient accuracy; (2) incorporating dynamic or temporal MRIO models to better capture feedback effects and structural changes over time. Integration with CGE models may also help simulate behavioral and policy responses, improving assessment of decoupling strategies under future scenarios; (3) expanding footprint indicators to include grey water, land use, and other ecological pressures, as well as extending geographical coverage to transnational value chains such as the Belt and Road Initiative and RCEP; and (4) exploring regionalized policy tools such as ecological compensation, carbon border adjustments, and green supply chain coordination to balance decarbonization with equitable responsibility sharing.
5 Conclusion and policy implications
This study investigates the spatiotemporal patterns, virtual transfer pathways, and decoupling mechanisms of water and carbon footprints in China’s ICT industry during the period from 2012 to 2017. A multidimensional analytical framework was developed, integrating an EE-MRIO model with SDA and the Tapio decoupling approach. The results reveal that water and carbon footprints exhibit significant spatial heterogeneity across provinces, with eastern regions maintaining high values at both the production and consumption ends, forming pronounced dual-intensity agglomerations. The pattern of virtual water–carbon flows has shifted from a unidirectional west-to-east transfer to a more complex bidirectional network, in which provinces like Guangdong and Jiangsu have emerged as key intermediate hubs playing dual roles in both importing and exporting embodied resources.
Decoupling analysis reveals marked regional divergence across China’s ICT industry. Jiangsu transitioned from strong coupling to strong decoupling in both water and carbon footprints, indicating significant gains in resource efficiency. In contrast, Guangdong’s production-side footprints remained in an expansive coupling state, though strong decoupling was observed on the consumption side. High-consumption provinces like Beijing continued to exhibit negative decoupling, highlighting rising external environmental pressures. Shanghai showed early signs of transition toward weak decoupling. Resource-transition regions such as Jiangxi, Sichuan, and Yunnan achieved strong water decoupling, with Jiangxi also demonstrating carbon decoupling. These results suggest that while some provinces have improved resource use efficiency, structural transformation remains uneven. SDA results further show that per capita final demand and final demand structure are the dominant drivers of footprint growth. Although reductions in water and carbon intensity have had localized effects in several provinces, they have not yet reversed the structural path dependence. These findings are consistent with prior research suggesting that consumption-oriented regions tend to externalize environmental burdens through trade (Weinzettel et al., 2013; Wang et al., 2022), and also align with recent insights into carbon dynamics in China’s ICT sector (Wang et al., 2024).
In light of these findings, several targeted policy recommendations are proposed in Table 5. At the regional governance level, it is necessary to establish a stratified and differentiated ecological compensation system based on virtual footprint transfer pathways. For industrial hubs such as Guangdong and Jiangsu, water intensity evaluations should be integrated into existing carbon mitigation plans, and a joint water–carbon management checklist should be developed to balance resource efficiency constraints with environmental responsibility allocation. The issuance of unified product carbon footprint labeling standards in 2025 by the Certification and Accreditation Administration of China provides a policy foundation for integrating such metrics into manufacturing evaluation systems (CNCA, 2025).
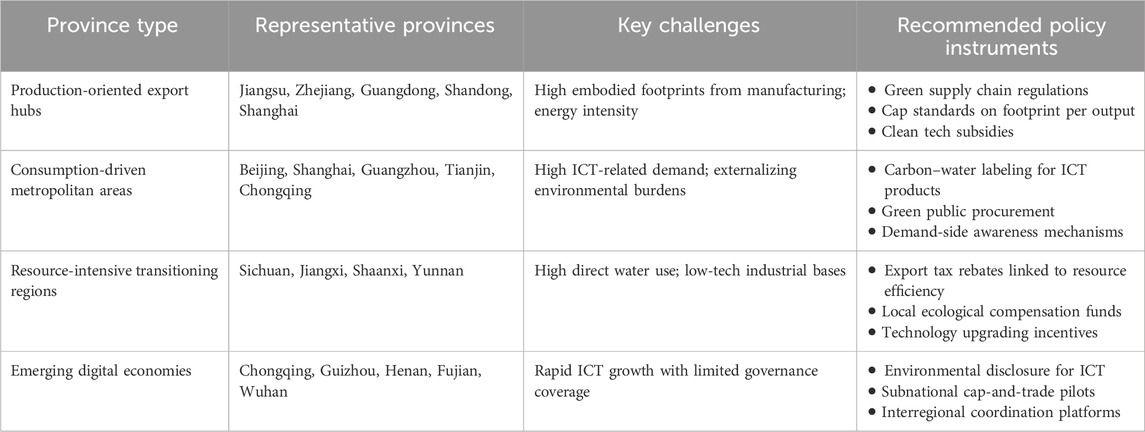
Table 5. Tailored policy instruments for different province types.
Resource-exporting provinces like Jiangxi and Sichuan should pilot compensation mechanisms that link virtual footprint outputs to physical resource allocations, incorporating them into interregional fiscal transfers or green financial instruments. Prior research has emphasized the potential of ecological payment schemes and watershed eco-compensation frameworks in addressing interregional environmental inequalities (Wang et al., 2016; Song et al., 2018).
In high-consumption metropolitan areas such as Beijing and Shanghai, it is recommended to promote a water–carbon labeling scheme and integrate it with green public procurement initiatives. This aligns with existing trends in environmental disclosure and the use of sustainability labels to shift institutional purchasing behavior (Zheng et al., 2023).
At the industrial level, green upgrading of core ICT manufacturing segments should be prioritized through the establishment of water–carbon footprint cap standards, fostering a vertically integrated transition path that encompasses source reduction, cleaner processes, and end-use substitution. Additive manufacturing, for instance, offers a viable pathway to reduce embodied emissions and material intensity in ICT production (Oladunni et al., 2025). For major interprovincial footprint corridors, such as Jiangsu to Guangdong and Guangdong to Zhejiang—the development of a virtual footprint trading scheme should be explored, using footprint intensity as a market-based instrument to facilitate cross-regional governance and align environmental responsibilities with economic benefits (Liu et al., 2019). Existing subnational pilots such as the Shenzhen Emission Trading Scheme offer valuable insights into quota design, market monitoring, and regional enforcement mechanisms (ICAP, 2023). Incorporating intelligent forecasting platforms may further enhance the adaptability of such governance systems under shifting resource dynamics (Xu et al., 2025). Such schemes could use footprint intensity as a market-based instrument to facilitate cross-regional governance and align environmental responsibilities with economic benefits.
From a policy instrument perspective, differentiated strategies should be developed in accordance with dominant driving factors across provinces. In regions where decoupling is primarily driven by intensity reduction—such as Jiangxi and Yunnan—targeted green technology investment subsidies and the introduction of high–value-added chain segments are essential. In contrast, for provinces like Jiangsu and Shandong, where per capita demand and demand structure are key drivers, it is advisable to incorporate environmental footprint indicators into resource and value-added tax adjustments. This could help promote a shift in demand toward low-footprint, high-value-added consumption and production structures.
Data availability statement
Publicly available datasets were analyzed in this study. This data can be found here: https://www.ceads.net.cn/.
Author contributions
LY: Supervision, Funding acquisition, Resources, Writing – review and editing, Project administration. DX: Data curation, Methodology, Writing – original draft, Formal Analysis, Investigation. WQ: Data curation, Investigation, Supervision, Project administration, Writing – review and editing, Methodology.
Funding
The author(s) declare that financial support was received for the research and/or publication of this article. The work was supported by the National Natural Science Foundation of China [Grant No. 71771157], the National Social Science Foundation of China (Funding agency: National Office of Philosophy and Social Sciences) [Grant No. 23AGL030], the Environmental Planning Institute of the Ministry of Ecology and Environment of China [ Grant No. ZDSYS202501].
Conflict of interest
The authors declare that the research was conducted in the absence of any commercial or financial relationships that could be construed as a potential conflict of interest.
Generative AI statement
The author(s) declare that no Generative AI was used in the creation of this manuscript.
Any alternative text (alt text) provided alongside figures in this article has been generated by Frontiers with the support of artificial intelligence and reasonable efforts have been made to ensure accuracy, including review by the authors wherever possible. If you identify any issues, please contact us.
Publisher’s note
All claims expressed in this article are solely those of the authors and do not necessarily represent those of their affiliated organizations, or those of the publisher, the editors and the reviewers. Any product that may be evaluated in this article, or claim that may be made by its manufacturer, is not guaranteed or endorsed by the publisher.
References
Allan, J. A. (1997). ‘Virtual water’: a long term solution for water short Middle Eastern economies? (vol. 5145). London, UK: School of Oriental and African Studies, University of London.
Charfeddine, L., and Umlai, M. (2023). ICT sector, digitization and environmental sustainability: a systematic review of the literature from 2000 to 2022. Renew. Sustain. Energy Rev. 184, 113482. doi:10.1016/j.rser.2023.113482
Chen, J., Wang, P., Cui, L., Huang, S., and Song, M. (2018). Decomposition and decoupling analysis of CO2 emissions in OECD. Appl. energy 231, 937–950. doi:10.1016/j.apenergy.2018.09.179
Chen, X., Griffin, W. M., and Matthews, H. S. (2018). Representing and visualizing data uncertainty in input-output life cycle assessment models. Resour. conservation Recycl. 137, 316–325. doi:10.1016/j.resconrec.2018.06.011
CNCA (2025). Guojia renwei guan fabu chanpin tanzujibiao shiren zheng tongyong shishi guize (shixing) de gonggao [Announcement on issuing the general implementation rules for product carbon footprint label certification (trial)] (Announcement No. 8, 2025), Available online at: https://www.cnca.gov.cn/zwxx/gg/2025/art/2025/art_5fc5d46ee1fc4ae7bbfbd55b11572496.html. (Accessed July 29, 2025).
Costello, C., Griffin, W. M., Matthews, H. S., and Weber, C. L. (2011). Inventory development and input-output model of US land use: relating land in production to consumption. Environ. Sci. and Technol. 45 (11), 4937–4943. doi:10.1021/es104245j
Fang, G., Huang, M., Zhang, W., and Tian, L. (2024). Exploring global embodied carbon emissions transfer network—An analysis based on national responsibility. Technol. Forecast. Soc. Change 202, 123284. doi:10.1016/j.techfore.2024.123284
Feng, H., Yang, M., Zeng, P., Liu, Y., Sun, F., Wang, K., et al. (2022). Transprovincial water quality impacts and the environmental inequity of grey water footprint transfer in China. Conservation Recycl. 186, 106537. doi:10.1016/j.resconrec.2022.106537
Freitag, C., Berners-Lee, M., Widdicks, K., Knowles, B., Blair, G. S., and Friday, A. (2021). The real climate and transformative impact of ICT: a critique of estimates, trends, and regulations. Patterns 2 (9), 100340. doi:10.1016/j.patter.2021.100340
Han, M. Y., Chen, G. Q., Mustafa, M. T., Hayat, T., Shao, L., Li, J. S., et al. (2015). Embodied water for urban economy: a three-scale input–output analysis for beijing 2010. Ecol. Model. 318, 19–25. doi:10.1016/j.ecolmodel.2015.05.024
Hoekstra, A. Y., and Hung, P. Q. (2003). Virtual water trade. Proc. Int. expert Meet. virtual water trade 12, 1–244.
International Carbon Action Partnership (ICAP) (2023). China - shenzhen pilot ETS. Available online at: https://icapcarbonaction.com/en/ets/china-shenzhen-pilot-ets.
Jägerskog, A., and Lundqvist, J. (2022). Water wars, conflict and cooperation–how the virtual water concept helped change the discourse. Water Int. 47 (6), 901–904. doi:10.1080/02508060.2022.2118388
Jiang, M., Huang, Y., Bai, Y., and Wang, Q. (2023). How can Chinese metropolises drive global carbon emissions? Based on a nested multi-regional input-output model for China. Sci. Total Environ. 856, 159094. doi:10.1016/j.scitotenv.2022.159094
Lenzen, M., Wood, R., and Wiedmann, T. (2010). Uncertainty analysis for multi-region input–output models–a case study of the UK’s carbon footprint. Econ. Syst. Res. 22 (1), 43–63. doi:10.1080/09535311003661226
Li, P., He, C., Qi, T., and Wang, Y. (2024). Embodied carbon flows in resource-based cities based on multiregional input–output model: a case study of hohhot-baotou-ordos-yulin urban agglomeration in China. Clean Technol. Environ. Policy 27, 2289–2303. doi:10.1007/s10098-024-02974-0
Li, W., Wang, Q., Jin, B., Li, G., and Su, B. (2023). Multiregional input–output analysis of carbon transfer in interprovincial trade and sectoral strategies for mitigation: case study of Shanxi province in China. J. Clean. Prod. 391, 136220. doi:10.1016/j.jclepro.2023.136220
Li, Y., Zhong, H., Shan, Y., Hang, Y., Wang, D., Zhou, Y., et al. (2023). Changes in global food consumption increase GHG emissions despite efficiency gains along global supply chains. Nat. Food 4 (6), 483–495. doi:10.1038/s43016-023-00768-z
Liang, J., Wang, S., Liao, Y., and Feng, K. (2024). Carbon emissions embodied in investment: assessing emissions reduction responsibility through multi-regional input-output analysis. Appl. Energy 358, 122558. doi:10.1016/j.apenergy.2023.122558
Liu, X., Du, H., Zhang, Z., Crittenden, J. C., Lahr, M. L., Moreno-Cruz, J., et al. (2019). Can virtual water trade save water resources? Water Res. 163, 114848. doi:10.1016/j.watres.2019.07.015
Liu, L., Yin, Z., Wang, P., Gan, Y., and Liao, X. (2020). Water-carbon trade-off for inter-provincial electricity transmissions in China. J. Environ. Manag. 268, 110719. doi:10.1016/j.jenvman.2020.110719
Lv, Y., Li, Y., Zhang, Z., Luo, S., Feng, X., and Chen, X. (2024). Spatio-temporal evolution pattern and obstacle factors of water-energy-food nexus coupling coordination in the yangtze river economic belt. J. Clean. Prod. 444, 141229. doi:10.1016/j.jclepro.2024.141229
Magazzino, C., Pakrooh, P., and Abedin, M. Z. (2024). A decomposition and decoupling analysis for carbon dioxide emissions: evidence from OECD countries. Environ. Dev. Sustain. 26 (11), 28539–28566. doi:10.1007/s10668-023-03824-7
Oladunni, O. J., and Olanrewaju, O. A. (2022). Effects of the impact factors on transportation sector’s CO2-eq emissions: panel evaluation on south Africa’s major economies. Atmosphere 13 (10), 1705. doi:10.3390/atmos13101705
Oladunni, O. J., Olanrewaju, O. A., and Lee, C. K. (2024). The environmental Kuznets Curve (EKC) Hypothesis on GHG emissions: analyses for transportation industry of South Africa. Discov. Sustain. 5 (1), 302. doi:10.1007/s43621-024-00518-6
Oladunni, O. J., Lee, C. K., Ibrahim, I. D., and Olanrewaju, O. A. (2025). Advances in sustainable additive manufacturing: a systematic review for construction industry to mitigate greenhouse gas emissions. Front. Built Environ. 11, 1535626. doi:10.3389/fbuil.2025.1535626
Perez-Valdes, G. A., Wiebe, K. S., and Werner, A. T. (2025). Uncertainty in dynamic econometric input-output models: a Norwegian case study. Econ. Syst. Res. 37 (2), 223–243. doi:10.1080/09535314.2024.2413552
Peters, G. P., Minx, J. C., Weber, C. L., and Edenhofer, O. (2011). Growth in emission transfers via international trade from 1990 to 2008. Proc. Natl. Acad. Sci. 108 (21), 8903–8908. doi:10.1073/pnas.1006388108
Qian, W., Yao, L., and Zhan, W. (2025). Redefining responsibility for China energy-related methane emission reductions: an embodied perspective driven by consumption. Energy Policy 203, 114646. doi:10.1016/j.enpol.2025.114646
Shan, Y., Huang, Q., Guan, D., and Hubacek, K. (2020). China CO2 emission accounts 2016–2017. Sci. data 7 (1), 54. doi:10.1038/s41597-020-0393-y
Shen, R., and Yao, L. (2023). A holistic analysis of China’s consumption-based water footprint (2012–2017) from a multilevel perspective. J. Clean. Prod. 429, 139593. doi:10.1016/j.jclepro.2023.139593
Shi, J., Li, C., and Li, H. (2022). Energy consumption in China’s ICT sectors: from the embodied energy perspective. Renew. Sustain. Energy Rev. 160, 112313. doi:10.1016/j.rser.2022.112313
Shimotsuura, T. (2025). A comprehensive structural decomposition analysis of CO2 emissions from vessels: a case study of Japan. Energy Econ. 148, 108674. doi:10.1016/j.eneco.2025.108674
Siddik, M. A. B., Shehabi, A., and Marston, L. (2021). The environmental footprint of data centers in the United States. Environ. Res. Lett. 16 (6), 064017. doi:10.1088/1748-9326/abfba1
Song, B., Zhang, Y., Zhang, L., and Zhang, F. (2018). A top-down framework for cross-regional payments for ecosystem services. J. Clean. Prod. 182, 238–245. doi:10.1016/j.jclepro.2018.01.203
Su, B., and Ang, B. W. (2012). Structural decomposition analysis applied to energy and emissions: some methodological developments. Energy Econ. 34 (1), 177–188. doi:10.1016/j.eneco.2011.10.009
Sun, S., Fang, C., and Lv, J. (2017). Spatial inequality of water footprint in China: a detailed decomposition of inequality from water use types and drivers. J. Hydrology 553, 398–407. doi:10.1016/j.jhydrol.2017.08.020
Sun, H., Ni, S., Zhao, T., and Huang, C. (2021). The transfer and driving factors of industrial embodied wastewater in China’s interprovincial trade. J. Clean. Prod. 317, 128298. doi:10.1016/j.jclepro.2021.128298
Tapio, P. (2005). Towards a theory of decoupling: degrees of decoupling in the EU and the case of road traffic in Finland between 1970 and 2001. Transp. policy 12 (2), 137–151. doi:10.1016/j.tranpol.2005.01.001
Wang, H., Dong, Z., Xu, Y., and Ge, C. (2016). Eco-compensation for watershed services in China. Water Int. 41 (2), 271–289. doi:10.1080/02508060.2015.1138023
Wang, Q., Jiang, R., and Li, R. (2018). Decoupling analysis of economic growth from water use in City: a case study of Beijing, Shanghai, and Guangzhou of China. Sustain. Cities Soc. 41, 86–94. doi:10.1016/j.scs.2018.05.010
Wang, J., Dong, X., and Dong, K. (2022). How digital industries affect China’s carbon emissions? Analysis of the direct and indirect structural effects. Technol. Soc. 68, 101911. doi:10.1016/j.techsoc.2022.101911
Wang, J., Yang, S., Dong, K., and Nepal, R. (2024). Assessing embodied carbon emission and its drivers in China’s ICT sector: Multi-regional input-output and structural decomposition analysis. Energy Policy 186, 114008. doi:10.1016/j.enpol.2024.114008
Wang, P., Li, H., and Huang, Z. (2023). The inter-provincial trade inequality in China: an assessment of the impact of changes in built-up land and carbon storage. Ecol. Econ. 206, 107749. doi:10.1016/j.ecolecon.2023.107749
Wang, Q., Huang, N., Chen, Z., Chen, X., Cai, H., and Wu, Y. (2023). Environmental data and facts in the semiconductor manufacturing industry: an unexpected high water and energy consumption situation. Water Cycle 4, 47–54. doi:10.1016/j.watcyc.2023.01.004
Weinzettel, J., Hertwich, E. G., Peters, G. P., Steen-Olsen, K., and Galli, A. (2013). Affluence drives the global displacement of land use. Glob. Environ. Change 23 (2), 433–438. doi:10.1016/j.gloenvcha.2012.12.010
Wiedmann, T., and Minx, J. (2008). A definition of ‘carbon footprint. Ecol. Econ. Res. trends 1 (2008), 1–11.
Wiedmann, T., Wilting, H. C., Lenzen, M., Lutter, S., and Palm, V. (2011). Quo Vadis MRIO? Methodological, data and institutional requirements for multi-region input–output analysis. Ecol. Econ. 70 (11), 1937–1945. doi:10.1016/j.ecolecon.2011.06.014
Wu, Y., Zhu, Q., and Zhu, B. (2018). Decoupling analysis of world economic growth and CO2 emissions: a study comparing developed and developing countries. J. Clean. Prod. 190, 94–103. doi:10.1016/j.jclepro.2018.04.139
Xu, Z., Zheng, Y., and Wu, Y. (2024). Paving the way for sustainable agriculture: an analysis of evolution and driving forces of methane emissions reduction in China. Conservation Recycl. 202, 107392. doi:10.1016/j.resconrec.2023.107392
Xu, Z., Lee, C. K. M., and Wong, C. N. (2025). A novel fault diagnosis method based on deep stable learning for bearings with imbalanced data samples. Expert Syst. Appl. 281, 127634. doi:10.1016/j.eswa.2025.127634
Yang, Y., Yang, Q., Zhang, J., Chen, J., Ma, S., and He, Y. (2025). Temporal-spatial evolution of bilateral carbon emissions and driving factors in 30 Chinese provinces during 2012-2017: an analysis based on MRIO-SDA method. Environ. Dev. Sustain., 1–31. doi:10.1007/s10668-025-06534-4
Yuan, X., Sheng, X., Chen, L., Tang, Y., Li, Y., Jia, Y., et al. (2022). Carbon footprint and embodied carbon transfer at the provincial level of the yellow river basin. Sci. total Environ. 803, 149993. doi:10.1016/j.scitotenv.2021.149993
Zhai, G., Li, K., Cui, H., Wang, Z., Wang, L., Yu, S., et al. (2024). Ecological unequal exchange: evidence from imbalanced cropland soil erosion and agricultural value-added embodied in global agricultural trade. Land Use Policy 147, 107378. doi:10.1016/j.landusepol.2024.107378
Zhang, C., and Anadon, L. D. (2014). A multi-regional input–output analysis of domestic virtual water trade and provincial water footprint in China. Ecol. Econ. 100, 159–172. doi:10.1016/j.ecolecon.2014.02.006
Zhang, Y., and Li, Z. (2019). Research on spatial correlation network structure of inter-provincial electronic information manufacturing industry in China. Sustainability 11 (13), 3534. doi:10.3390/su11133534
Zhang, W., Liu, Y., Feng, K., Hubacek, K., Wang, J., Liu, M., et al. (2018). Revealing environmental inequality hidden in China’s inter-regional trade. Environ. Sci. and Technol. 52 (13), 7171–7181. doi:10.1021/acs.est.8b00009
Zhang, S., Taiebat, M., Liu, Y., Qu, S., Liang, S., and Xu, M. (2019). Regional water footprints and interregional virtual water transfers in China. J. Clean. Prod. 228, 1401–1412. doi:10.1016/j.jclepro.2019.04.298
Zheng, J., and Hu, Y. (2025). City-level transport decarbonization in China: a novel two-dimensional decoupling pathway analysis model. J. Clean. Prod. 504, 145451. doi:10.1016/j.jclepro.2025.145451
Zheng, H., Bai, Y., Wei, W., Meng, J., Zhang, Z., Song, M., et al. (2021). Chinese provincial multi-regional input-output database for 2012, 2015, and 2017. Sci. data 8 (1), 244. doi:10.1038/s41597-021-01023-5
Zheng, L., Omori, A., Cao, J., and Guo, X. (2023). Environmental regulation and corporate environmental performance: evidence from Chinese carbon emission trading pilot. Sustainability 15 (11), 8518. doi:10.3390/su15118518
Keywords: interprovincial trade, ICT sector, water footprint, carbon footprint, multi-regional input-output model, structural decomposition analysis
Citation: Yao L, Xu D and Qian W (2025) Virtual flows and decoupling effects of water-carbon footprints in China’s ICT sector: analysis based on multi-regional input-output and decoupling models. Front. Environ. Sci. 13:1645434. doi: 10.3389/fenvs.2025.1645434
Received: 12 June 2025; Accepted: 12 August 2025;
Published: 29 August 2025.
Edited by:
Keng Yuen Foo, University of Science Malaysia, MalaysiaReviewed by:
Ying Zhu, Xi’an University of Architecture and Technology, ChinaOluwole Joseph Oladunni, Durban University of Technology, South Africa
Copyright © 2025 Yao, Xu and Qian. This is an open-access article distributed under the terms of the Creative Commons Attribution License (CC BY). The use, distribution or reproduction in other forums is permitted, provided the original author(s) and the copyright owner(s) are credited and that the original publication in this journal is cited, in accordance with accepted academic practice. No use, distribution or reproduction is permitted which does not comply with these terms.
*Correspondence: Weijin Qian, cWlhbndlaWppbkAxNjMuY29t