 Jana Enking
 Stefano Cucurachi
 Raoul Meys
 Arnold Tukker
- 1Institute of Environmental Sciences (CML), Leiden University, Leiden, Netherlands
- 2Institute for Technical Thermodynamics (LTT), RWTH Aachen University, Aachen, Germany
- 3Carbon Minds GmbH, Cologne, Germany
- 4Netherlands Organisation for Applied Scientific Research (TNO), The Hague, Netherlands
Emission reduction in the petrochemical industry is essential to meet climate targets, as the chemical industry is a major contributor to industrial greenhouse gas emissions. Life Cycle Assessment (LCA) allows for assessing the environmental impacts of alternative production pathways. Still, interlinked industries, such as the petrochemical industry, are difficult to assess in LCA due to the so-called multifunctionality problem. To this end, there are at least two options in LCA to assess industry-wide emissions: a products-wise approach and a product basket-wise approach. Here, we show that optimized technology decisions differ between the two approaches. Optimizing supply chains product-wise leads to 20%–155% higher greenhouse gas emissions compared to a product basket-wise optimization due to (1) a higher amount of by-products, (2) increased raw material need and processing, and (3) suboptimal technology decisions in the supply chain. In contrast to that, a product basket-wise approach is able to adapt in response to changes in demand. Therefore, this approach has advantages over a product-wise assessment due to its possibility to simultaneously assess multifunctional processes. On the other hand, it might also require a complex model and more data.
1 Introduction
The chemical industry is the largest industrial energy consumer and third largest industrial emitter of direct carbon dioxide (CO2) emissions, resulting in 925 Mt CO2 emissions in 2021 (IEA, 2022). This makes the chemical industry an important potential contributor to emission reduction targets. Thus, it is essential to address environmental burdens caused by the chemical industry to achieve emission reduction targets such as the European Green deal or those defined by the parties that signed the Paris agreement (European Commission, 2019; UNFCCC, 2015). To achieve such ambitious targets in the chemical sector, the industry needs to shift towards raw materials and technologies with lower environmental burdens. In this context, a comparison between raw material and technology alternatives is essential to take well-informed decisions that can contribute to emission reduction targets.
The methodology of choice to assess alternative technologies from an environmental perspective is life cycle assessment (LCA), which is standardized in ISO 14040/44 (International Organization for Standardization, 2020a; International Organization for Standardization, 2020b). Analysts have been using LCA to assess the environmental performance of alternative chemical technologies. Examples include (Chisalita et al., 2020; Chen et al., 2019; Davidson et al., 2021; Thonemann and Pizzol, 2019; Von Der Assen and Bardow, 2014).
The goal of such studies is generally to support decision-making for sustainability in a context in which there are multiple options to fulfill a specific function and deliver a product to the market. Let us imagine, for example, that a decision-maker has tasked the LCA analyst to assess alternative options to produce styrene. Styrene can either be a product of the chemical reaction between benzene and ethylene or be derived from the C4-fraction, which itself is a mixture of hydrocarbon molecules with four carbon atoms and a by-product of catalytic cracking of naphtha or natural gas (Boustead, 2005; James and Castor, 2005; see Supplementary Material (SI), Supplementary Table S1). The analyst could opt to assess the system one alternative at a time, using a so-called product-wise optimization (see Figure 1, left panel).

Figure 1. Concepts of product-wise optimization and product basket-wise optimization.
The advantage of the product-wise option is that optimizing one product at a time limits the size of the LCA model for all the alternatives considered. On the other hand, the product-wise optimization might also limit the possibility to display connections between different products and their supply chains. In the case of the styrene production, thermal cracking of natural gas or naphtha not only produces components of the C4-fraction, but to also large volumes of economically-valuable ethylene and propylene. Thus, the supply chain of styrene is at least connected to the supply chains of ethylene, propylene and their derivatives. As a result, the analyst would face the well-known challenge in LCA of multifunctionality (Heijungs et al., 2021; Moretti et al., 2020). A process is called multifunctional if more than one valuable output is produced (Heijungs and Guinée, 2007) or if a waste flow is treated while a valuable output is produced (Heijungs and Suh, 2002). The latter one being a characteristic of a standard recycling process. LCA practitioners face the so-called multifunctionality problem when they have to partition environmental burdens caused by a multifunctional process between functional flows (Heijungs and Guinée, 2007). Multifunctionality is an inextricable feature of product-wise optimization (we refer the reader to Guinée et al., 2021 for an in-depth discussion on the challenge of multifunctionality).
An alternative option that the LCA analyst could use to assess the environmental profile of styrene would be the product basket-wise or industry-wide optimization (Figure 1, right panel). Here, the LCA analyst considers all relevant raw materials and technology alternatives to produce all chemical products of interest, i.e., all bulk chemicals of the petrochemical industry (including styrene). Using an optimization routine, the analyst would simultaneously choose all the supply chains for the basket of products considered, which would lead to the least environmental burdens not only for styrene, but also for the entire system of products. The advantage of this option would be the possibility to display connections between different supply chains. On the other hand, the LCA analyst would typically need to develop a model of a significantly greater product system, with broader system boundaries, and a more detailed data-collection. Yang et al. (2024) performed such a system wide assessment for the case of a large Chinese refinery. They applied a carbon flow-tracking and LCA framework across process units and using the results to identify optimization strategies that lower carbon emissions and other environmental impacts across the system.
While the approaches that we described are different, both options should lead to a similar quality of decision-making. This is the case for simple and theoretical product systems with a limited number of outputs and functions. In reality, the product-wise approach may lead to suboptimal decisions, due to the interlinked nature of supply chains and the sheer number of alternatives in raw material and technologies that exist in the system.
For the purpose of this work, we compare the results of product-wise optimization and product basket optimization and estimate the GHG emissions resulting from the two modelling options. To model both systems, we use the Technology Choice Model (TCM, Kätelhön et al., 2016). TCM allows including multiple technology options in all steps of the supply chain as well as multifunctional processes, and simultaneously optimizing all the available options. We base our calculations on a case study from the petrochemical industry as an example of a highly interlinked production system with various technology alternatives. In the current study, we consider a total of 24 petrochemicals and 293 processes.
2 Data and methods
We follow the notation and computational structure for such standard LCA models introduced by Heijungs and Suh (2002), thus model the LCA system as a system of linear equations. We extend the notation by Heijungs and Suh (2002) to TCM, and model both the product basket-wise optimization as well as the product-wise optimization (Kätelhön et al., 2016).
2.1 Product basket-wise optimization
TCM is an extension of the economic input-output rectangular choice-of-technology (RCOT) model (Duchin and Levine, 2011). We indicate the production system as the technology matrix
where
We follow Kätelhön et al. (2016) and describe the optimization problem of the TCM as in:
The objective function Z represents the costs determined for the production of the final demand
We can calculate the environmental impacts
The elementary flow matrix
The form of the TCM just described uses monetary optimization to choose the combination of technologies from a range of alternatives to produce a predefined final demand. In this work, we use the modified objective function of Kätelhön et al. (2019) to minimize GHG emissions associated with the production of a predefined final demand. We describe the new system of equations as follows:
The elementary flow matrix
2.2 Product-wise optimization
A product-wise optimization of technology alternatives equals the approach that uses standard computational structure of LCA (see Equation 1), in which different options to produce one product or provide one service are compared. Equation 1 is solved multiple times, with different technologies considered in each calculation. As indicated, difficulties might arise when one or more processes are multifunctional. Multifunctional processes connect the supply chains of different products. To disconnect supply chains one has to solve the so-called multifunctionality problem. To solve the multifunctionality problem, the ISO norm standardizing LCA, ISO 14044 (International Organization for Standardization, 2020a), prescribes a three-step procedure:
1. Avoid allocation by (a) subdividing the process or (b) system expansion.
2. Partitioning based on underlying physical relationships.
3. Allocation reflecting the relationship between different co-products.
To perform a product-wise optimization for the same case study, we continue to use the TCM, but allocate multifunctional processes by using an allocation procedure proposed by Jung et al. (2014), therefore applying step 3 of the allocation procedure. Thereby we disconnect supply chains and are able to optimize production routes per product separately. Following Jung et al. (2014), we allocate multifunctional processes to create a second version of the production system that only consists of single output processes. Since multifunctional processes have more than one functional flow, a column in the technology matrix
First, a transformation matrix
2.3 Calculation procedure and comparison
To compare technology decisions between a product basket-wise and a product-wise optimization, our procedure involves solving the TCM with defined matrices
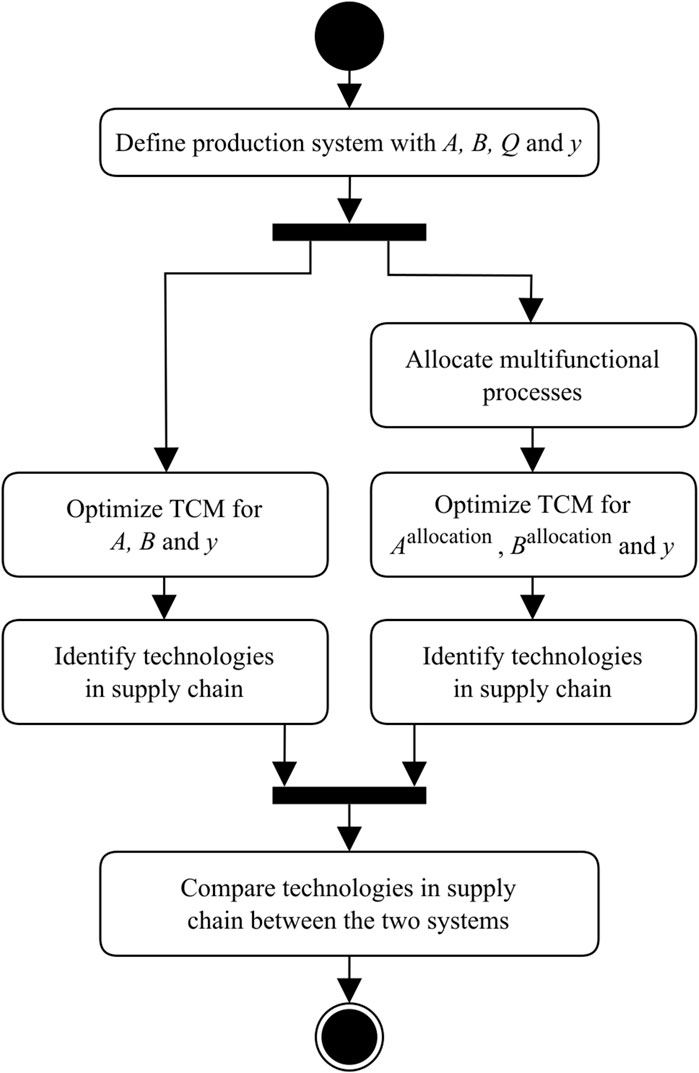
Figure 2. Calculation procedure to compare technology decisions between a production-wise optimization and a product basket wise optimization.
For the product basket-wise optimization, the TCM is solved for the final demand
To optimize technology decisions for products individually, the TCM is solved for the same final demand
With the scaling vectors
2.4 Case study and data
In the current study, we use the DECHEMA report (International Energy Agency et al., 2013), thus representing the majority of the petrochemical industry. We include thermal steam cracking of naphtha with ethylene, propylene, pyrolysis gas, and the C4-fraction as main intermediate products and catalytic cracking of naphtha producing aromatic compounds like benzene, toluene, and xylenes. Additionally, we consider further processes in the process chains of ethylene and aromatic compounds. Further process chains of propylene and C4-fraction are only included if they are necessary for considered derivatives of ethylene and aromatic compounds. Therefore, acrylonitrile and propylene oxide are not included in our study.
We consider a total of 24 products and 293 processes (see details on products and processes in SI_01, Chapter 2 and Supplementary Table S1, respectively). Figure 3 shows a simplified flowchart of the production system under study. In addition to the raw material naphtha, we include natural gas-based technologies for the production of methanol, ammonia, ethylene, and propylene.
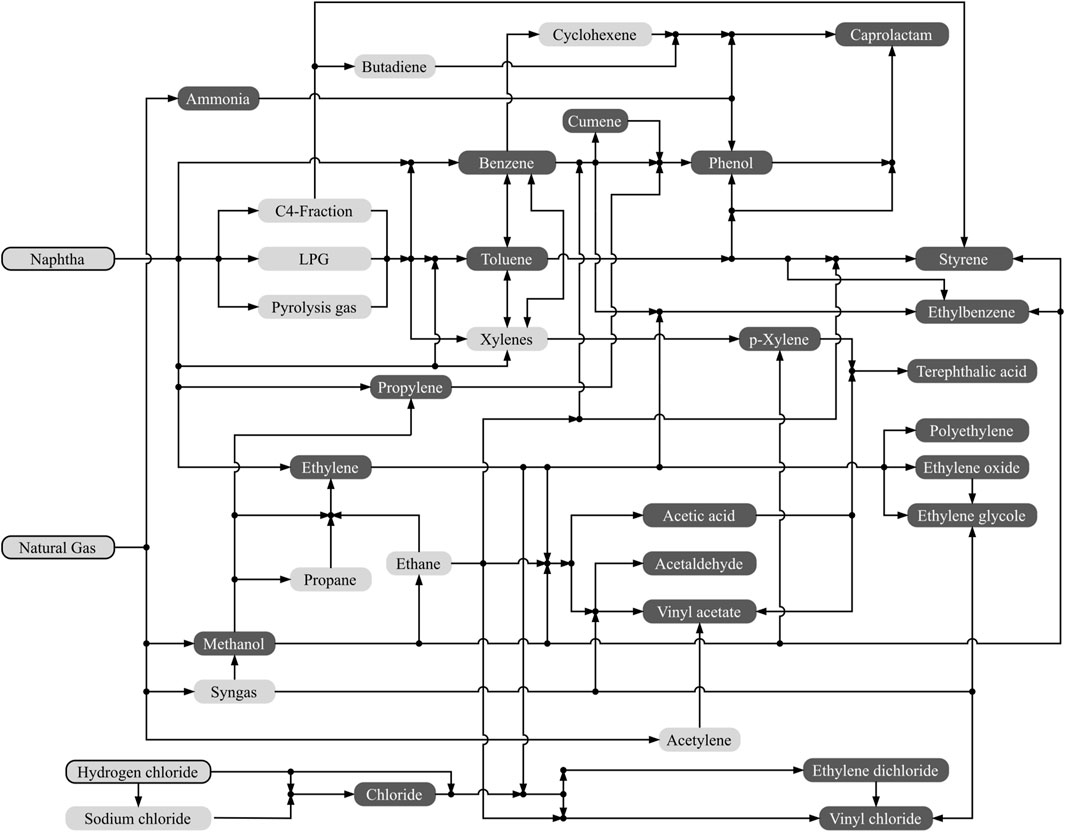
Figure 3. Simplified flowchart of products considered in the case study; products in dark grey; intermediate products and production system inputs (black outline) in light grey.
To build up the supply chain of our case study, we obtained all data on unit process level from the IHS Process Economics Program (PEP) Yearbook (IHS Markit, 2018). This data is based on detailed process analysis, simulations, and inputs from industrial experts. Aggregated data (background system) for the supply of additional process inputs and raw materials (e.g., naphtha, chlorine, natural gas) were obtained from commercial LCA databases (i.e., ecoinvent version 3.5). Whenever available, we used European data, but with no specific location or capacity for the production. Therefore, we considered no transport between processes and no scaling effects. A list of considered products and processes can be found in SI (SI_01, Chapter 2 and Supplementary Table S1, respectively).
The objective function of our system is the minimization of carbon emissions. Therefore, we need carbon emissions for unit processes and aggregated processes. Impact data for the aggregated processes is obtained from commercial LCA databases. However, the PEP Yearbook does not include direct process emissions for the considered unit processes. To estimate direct greenhouse gas emissions here, we calculated the carbon balance of each process according to Kätelhön et al. (2019). As a result, every carbon atom entering a process and not leaving it as part of a product is assumed to oxidize and leave the process as CO2. Thus, GHG emissions are estimated based on the assumption that each kilogram of carbon in a product or waste leads to emissions of 3.67 kg of CO2.
We consider a total of 24 products in our final demand
The second final demand
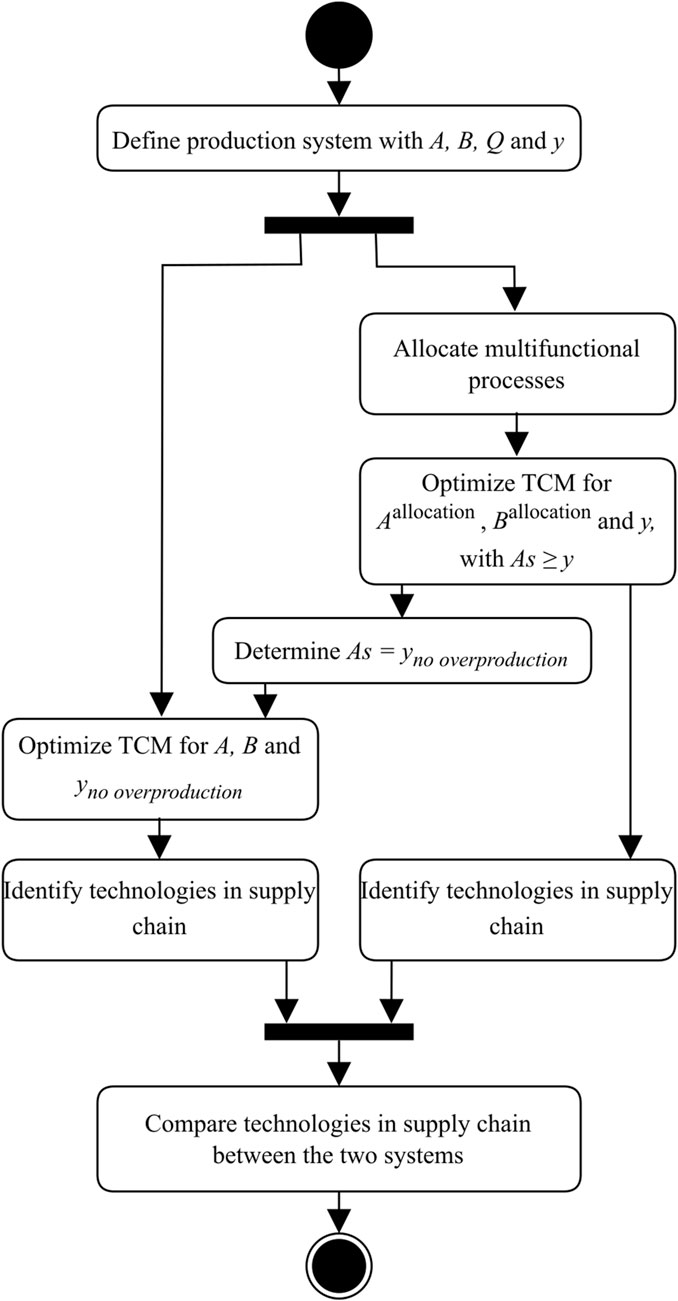
Figure 4. Calculation procedure to compare technology decisions between a production-wise optimization and a product basket wise optimization for yno overproduction.
We considered allocation factors based on mass, stoichiometry, energy content, and market price. Therefore, we assesses four allocated production systems for the product-wise optimization and compare each of them with the product system for a product basket-wise optimization. Market prices are based on data from IHS Markit (2018). Information on flow properties can be found in Supplementary Table S2 of the SI_02.
3 Results and discussion
The results of our case study show that in a product basket-wise optimization 43 production processes are selected to produce 24 chemicals, 22 of which are multifunctional processes. These 43 processes combined produce the final demand while they determine the lowest amount of GHG emissions. All processes not selected are suboptimal for the combination of our production system and final demand. This might have two reasons: (1) single technologies perform worse in comparison to the selected technologies and (2) the amount or proportions of by-products and their usability within the production system are disadvantageous. Cumulated results in Figure 5 show 144 Mt oil-equivalents and 155 Mt CO2-equivalents are consumed and emitted to produce the final demand in Europe for the year 2016 (European Commission, 2019).
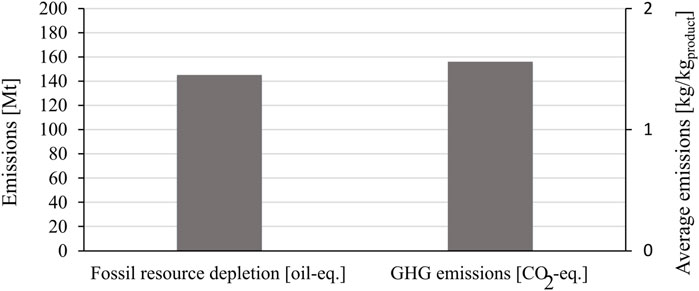
Figure 5. Cumulated yearly emissions of the production of basic chemicals in Europe.
3.1 Product basket-wise optimization compared to product-wise optimization for European demand
In Figure 6 we compare technology decisions between the product basket-wise optimization and the product-wise optimization for four allocation methods. In all allocated product systems fewer processes are selected to produce the final demand. In total 23–30 processes are selected in the model depending on the allocation method. This is because independent of the final demand only one process chain is favorable if an allocated production system is considered. In contrast to that, in case of the product basket-wise optimization, a combination of various alternative process chains might be advantageous to produce a specific final demand. This can be seen multiple times in our case study where e.g., vinyl acetate can be produced by two different processes. The amount and ratio between different raw materials and by-products vary between the two processes. Therefore, the combination of technologies depends on and varies with the final demand.
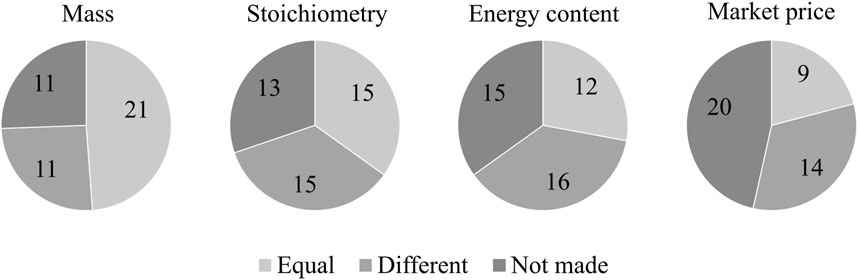
Figure 6. Amount of technology decisions that are equal, different or not made in comparison between a product-wise optimization, with allocation based on either mass, stoichiometry, energy content, or market price, and a product basket-wise optimization for European demand.
Depending on the allocation method selected, between 9 and 21 decisions are equal to those that are made in a product basket-wise approach, but 11–16 decisions differ between allocation methods (Figure 6). The difference in technology decisions indicates suboptimal pathways to produce the final demand that result in unnecessary environmental emissions for a product-wise optimization. We discuss some of these technology decisions and their effect on supply chains in the following to enable an understanding of how product-wise optimization lead to less efficient technology decisions and result in additional environmental emissions. However, note that due to the large production system, the presented result do not necessarily depict the complete set of technology decisions that lead to additional emissions.
The C4-fraction serves as an intermediate product in the supply chain of styrene and caprolactam only in the allocated production systems based on energy content and molar ratios. The C4-fraction itself is produced as a by-product of ethylene and propylene production. In the case of the allocated system based on molar ratios, naphtha serves as a carbon feedstock for the production of the C4-fraction. In contrast to this, natural gas is used in the energy content system to form methanol, which is further processed into ethylene, propylene, and a C4-fraction via methanol-to-olefin processes. Due to the small ratio of C4-fraction compared to ethylene and propylene this technology decision would in reality lead to massive overproduction of ethylene and propylene to fulfil the final demand of styrene and caprolactam. In contrast, in the product basket-wise approach, benzene and ethylene react to styrene, and caprolactam is produced from cyclohexane. Thus, considering the complete supply and demand of chemical supply chains is necessary to avoid an overproduction of the final products in the product basket-wise approach.
The results for the system using price allocation are comparable to the energy content system with one major difference: not only ethylene and propylene are produced via methanol, but all aromatic compounds. Naphtha is not used at all. This again would lead to overproduction in the real production system with by-products. Following this logic, one would have to assume that under the considered circumstances the chemical industry would shift to a single raw material instead of a mix of multiple raw materials, which in turn would require a shift in investment.
The final demand for benzene is higher than for toluene and xylenes. Nevertheless, due to allocations, technology decisions in the mass-allocated system lead to technologies where aromatic compounds are produced from LPG and naphtha. The amounts of toluene and xylenes are higher than those of benzene in the chosen process. This results in an overproduction of toluene and xylenes to meet the final demand of benzene. In the product basket-wise approach, benzene production is based on four technologies with different ratios between the aromatic compounds. One technology transforms toluene into benzene to adjust the production to the final demand.
These previous examples show that in every of the allocated systems suboptimal decisions are made. As a result, overproductions occurs. Overall, the accumulated production of all 24 products is 47% (mass allocation), 62% (stoichiometric allocation), 113% (energy content allocation), and 1,186% (price allocation) higher than the accumulated final demand
Higher amounts of final products than demanded lead not only to higher demands for process inputs and therefore raw materials, but also higher environmental emissions. In total the emissions increase by a factor of 4 (mass allocation), 6 (stoichiometric allocation), 13 (energy content allocation), and 174 (price allocation).
In summary, these additional emissions have three main reasons: (1) Technology decisions based on a product-wise optimization lead to suboptimal decisions. (2) Overproduction of final and intermediate products require additional raw materials and processing. (3) Incineration of overproduced intermediate and final products cause direct emissions. These three reasons can also explain why e.g., in case of the mass allocated system a 47% overproduction results in a factor 4 increase in emissions. We are aware this is a hypothetical situation, since decisions are optimized by an algorithm, rather than by a human decision-maker, who would additionally consider other factors (e.g., economic cost, opportunity cost).
3.2 Excluding overproduction and estimating emissions
When considering a final demand
Figure 7 shows the amount of technology decisions that differ between a product basket-wise optimization and a product-wise optimization for the final demand
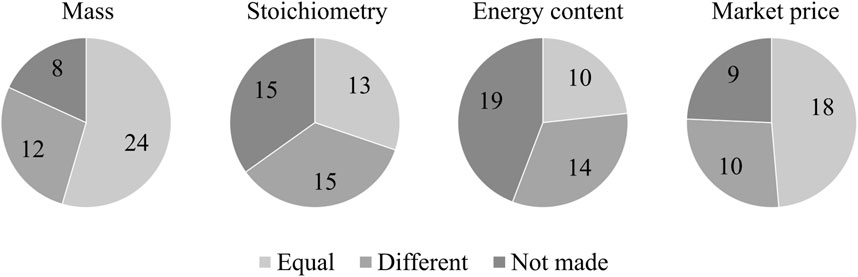
Figure 7. Amount of technology decisions that are equal, different or not made in comparison between a product-wise optimization - with allocation based on either mass, stoichiometry, energy content, or market price - and a product basket-wise optimization for European demand with overproduction.
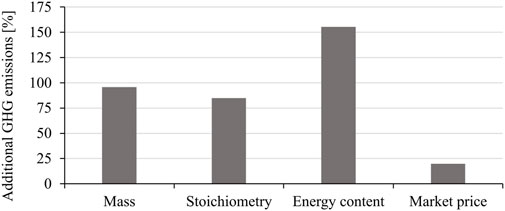
Figure 8. Additional GHG emissions in product-wise optimization - with allocation based on either mass, stoichiometry, energy content, or market price - compared to product basket-wise optimization.
4 Discussion
We see in our results that technology decisions in a product-wise optimization are independent of the final demand. In contrast to that in a product basket-wise optimization, technology decisions change along with the final demand and therefore adapt to changes in ratios between final products, as they change production routes in the supply chains. Due to the linear properties of the model, we include various process conditions (e.g., temperature, pressure) of the same technology, as separate process alternatives (i.e., separate column in technology matrix
Co-products are considered as a separate function in allocation only if they account for at least 5% of the cumulated product mass of a process. If they account for less than 5%, we allocate this co-product between the remaining functions of the process. Such a cut-off procedure avoids processes being chosen as the main supplier for a high-volume chemical that would only produce this product in small shares.
Considering uncertainties and trade-offs are two relevant aspects in LCA but go beyond the scope of our study. Uncertainties might have an impact on technology decisions and appear in multiple aspects, s.a. uncertainty in process data, allocation factors based on fluctuating market prices. Additionally, we chose to optimize carbon emissions and we did not consider trade-offs of other environmental impacts or the economic validity of our technology decisions and results. Optimizing other impact categories would certainly influence the optimal technology decisions. If data on other environmental impacts is available, trade-offs can be assessed using the same underlying equations.
In the context of the three step allocation procedure in ISO 14040/44, our product basket-wise optimization would be comparable to applying system expansion to a large system of connected products, processes and technologies. We have defined products and their share in our basket of products, while in system expansion usually the presence of by-products determine the products added to the functional unit and their share. In contrast to that, our product-wise optimization follows the third step of ISO allocation procedure (i.e., allocation reflecting the relationship between different co-products).
5 Conclusion
We modeled a system considering data for 293 unit processes and partially-allocated data for 26 aggregated processes, and we were able to show that it is possible to choose between technology alternatives in a complex production system without extensively using allocations while still comparing technologies on a detailed technical level. Nonetheless, we found, that different allocation strategies influence technology decisions between multiple alternatives. For this purpose, we compared technology decisions in a product basket-wise optimization with those in allocated variants of the same production system. While in a product basket-wise optimization we have one system boundary with the potential presence of allocations, a product-wise optimization equals optimizing multiple (smaller) systems. Therefore, it requires multiple system boundaries with the need to solve multifunctionality at each of them.
The use of allocated process data in our case study led to suboptimal decisions and resulted in unnecessary emissions. This shows, for emission reduction targets, it is of great importance to consider interlinked supply chains and optimize technology decisions for a product basket-wise rather than single products. This is especially relevant in policy-making and decision-making for sustainability.
Our case study stresses that it is important to consider by-products to reduce waste and overproduction and thereby decrease environmental emissions. In contrast to allocated production systems, the technology decisions in a product basket-wise approach adapt to a varying final demand by choosing a combination of technologies instead of a single technology. Thereby, avoiding overproduction, which seems environmentally favorable.
In our study, we assessed a broad industry with a great number of decisions. In further studies, this methodology can also be used to compare single technology alternatives in a broader context than usual comparative LCA studies, as done by Kätelhön et al. (2019). Results from such an assessment can also greatly support policymakers. The model can be easily expanded to assess trade-offs for other environmental burdens or impact categories. As already discussed by Kätelhön et al. (2016) in terms of costs, marginal emissions can be calculated by an incremental increase in final demand.
We are well aware that the TCM can only be used where data on a unit process level and emissions is available and that this is not the case for common LCA databases yet. But still, applying the TCM in the context of interlinked industries can give reliable and valuable insights to guide decision making. Further possible applications could be in the recycling industries, such as metal, textiles, and polymers with their complex recycling loops.
Data availability statement
The data analyzed in this study is subject to the following licenses/restrictions: The data used in this study are not publicly available due to licensing restrictions. They were obtained from a commercial database (IHS Markit, Ecoinvent) under a paid agreement and cannot be shared by the authors. Requests to access these datasets should be directed to https://www.spglobal.com/en, https://ecoinvent.org/.
Author contributions
JE: Conceptualization, Investigation, Methodology, Software, Visualization, Writing – original draft, Writing – review and editing. SC: Supervision, Writing – review and editing. RM: Conceptualization, Data curation, Writing – review and editing. AT: Supervision, Writing – review and editing.
Funding
The author(s) declare that no financial support was received for the research and/or publication of this article.
Conflict of interest
Author RM was employed by Carbon Minds GmbH.
The remaining authors declare that the research was conducted in the absence of any commercial or financial relationships that could be construed as a potential conflict of interest.
Generative AI statement
The author(s) declare that no Generative AI was used in the creation of this manuscript.
Any alternative text (alt text) provided alongside figures in this article has been generated by Frontiers with the support of artificial intelligence and reasonable efforts have been made to ensure accuracy, including review by the authors wherever possible. If you identify any issues, please contact us.
Publisher’s note
All claims expressed in this article are solely those of the authors and do not necessarily represent those of their affiliated organizations, or those of the publisher, the editors and the reviewers. Any product that may be evaluated in this article, or claim that may be made by its manufacturer, is not guaranteed or endorsed by the publisher.
Supplementary material
The Supplementary Material for this article can be found online at: https://www.frontiersin.org/articles/10.3389/fenvs.2025.1646009/full#supplementary-material
References
Chen, Z., Shen, Q., Sun, N., and Wei, W. (2019). Life cycle assessment of typical methanol production routes: the environmental impacts analysis and power optimization. JClP 220, 408–416. doi:10.1016/j.jclepro.2019.02.101
Chisalita, A., Peteresc, L., and Cormos, C. (2020). Environmental evaluation of European ammonia production considering various hydrogen supply chains. Renew. Susain. Energy Rev. 130, 109964. doi:10.1016/j.rser.2020.109964
Davidson, M. G., Elgie, S., Parsons, S., and Young, T. J. (2021). Production of HMF, FDCA and their derived products: a review of life cycle assessment (LCA) and techno-economic analysis (TEA) studies. Green Chem. 23, 3154–3171. doi:10.1039/d1gc00721a
Duchin, F., and Levine, S. H. (2011). Sectors may use multiple technologies simultaneously: the rectangular choice-of-technology model with binding factor constraints. Econ. Syst. Res. 23, 281–302. doi:10.1080/09535314.2011.571238
Guinée, J., Heijungs, R., and Frischknecht, R. (2021). “Chapter 4 multifunctionality in life cycle inventory analysis: approaches and solutions,” in Life cycle inventory analysis, LCA compendium – the complete world of life cycle assessment. Editors A. Ciroth, and R. Arvidsson (Cham: Springer International Publishing), 73–95. doi:10.1007/978-3-030-62270-1
Heijungs, R., and Guinée, J. B. (2007). Allocation and “what-if” scenarios in life cycle assessment of waste management systems. Waste Manag. 27, 997–1005. doi:10.1016/j.wasman.2007.02.013
Heijungs, R., and Suh, S. (2002). The computational structure of life cycle assessment, eco-efficiency in industry and science. Dordrecht: Springer. doi:10.1007/978-94-015-9900-9
Heijungs, R., Allacker, K., Benetto, E., Brandão, M., Guinée, J., Schaubroeck, S., et al. (2021). System expansion and substitution in LCA: a lost opportunity of ISO 14044 amendment 2. Front. Sustain. 2, 692055–3. doi:10.3389/frsus.2021.692055
IEA (2022). Chemicals. Available online at: https://www.iea.org/energy-system/industry/chemicals (Accessed August 9, 2025).
International Energy Agency, DECHEMA, ICCA (2013). Technology roadmap energy and GHG reductions in the chemical industry via catalytic processes.
James, D. H., and Castor, W. M. (2005). Ullmann’s encyclopedia of industrial chemistry. Chichester: Wiley.
Jung, J., Von Der Assen, N., and Bardow, A. (2014). Sensitivity coefficient-based uncertainty analysis for multi-functionality in LCA. Int. J. Life Cycle Assess. 19, 661–676. doi:10.1007/s11367-013-0655-4
Kätelhön, A., Bardow, A., and Suh, S. (2016). Stochastic technology choice model for consequential life cycle assessment. Environ. Sci. Technol. 50, 12575–12583. doi:10.1021/acs.est.6b04270
Kätelhön, A., Meys, R., Deutz, S., Suh, S., and Bardow, A. (2019). Climate change mitigation potential of carbon capture and utilization in the chemical industry. Proc. Natl. Acad. Sci. U. S. A. 166, 11187–11194. doi:10.1073/pnas.1821029116
Leontief, W. (1975). Structure of the world economy—outline of a simple input-output formulation. Proc. IEEE 63, 345–351. doi:10.1109/PROC.1975.9758
Thonemann, N., and Pizzol, M. (2019). Consequential life cycle assessment of carbon capture and utilization technologies within the chemical industry. Energy Environ. Sci. 12, 2253–2263. doi:10.1039/c9ee00914k
Keywords: life cycle assessment (LCA), decision-making, allocation, multifunctionality, carbon emissions
Citation: Enking J, Cucurachi S, Meys R and Tukker A (2025) Industry-wide life cycle assessment for improved decision-making: a case study on carbon emissions of petrochemicals. Front. Environ. Sci. 13:1646009. doi: 10.3389/fenvs.2025.1646009
Received: 12 June 2025; Accepted: 14 October 2025;
Published: 24 October 2025.
Edited by:
Fengtao Guang, China University of Geosciences Wuhan, ChinaReviewed by:
Feng Wang, Swinburne University of Technology, AustraliaQiaoli Wang, Zhejiang University of Technology, China
Copyright © 2025 Enking, Cucurachi, Meys and Tukker. This is an open-access article distributed under the terms of the Creative Commons Attribution License (CC BY). The use, distribution or reproduction in other forums is permitted, provided the original author(s) and the copyright owner(s) are credited and that the original publication in this journal is cited, in accordance with accepted academic practice. No use, distribution or reproduction is permitted which does not comply with these terms.
*Correspondence: Jana Enking, ai5lLmVua2luZ0BjbWwubGVpZGVudW5pdi5ubA==