 Mohanna Zarei
 Georgia Destouni
- 1Department of Physical Geography, Stockholm University, Stockholm, Sweden
- 2Department of Sustainable Development, Environmental Science and Engineering, KTH Royal Institute of Technology, Stockholm, Sweden
- 3Stellenbosch Institute for Advanced Study, Stellenbosch, South Africa
1 Introduction
Freshwater resources are highly sensitive to the impacts of climate change, often resulting in decreased availability and degraded quality of water, e.g., for drinking and irrigation, and with far-reaching consequences for ecosystems and human societies (Abbasnia et al., 2019; Solangi et al., 2020; Zimmermann and Neu, 2022). Water-related extreme events such as floods, droughts, heatwaves, and wildfires may also be increasingly common, and continue to pose significant threats to lives, livelihoods, and environmental systems (Gulzar et al., 2021; McGregor et al., 2005). Among natural hazards, floods and droughts remain the most lethal and economically destructive, impairing ecosystems, damaging infrastructure, and destabilizing water availability (Wijkman and Timberlake, 2021). Understanding, monitoring, and accurately predicting such changes in hydrological conditions under climate change depend fundamentally on data. A range of datasets spanning in-situ measurements, satellite observations, and model outputs are available to explore the interactions of climate change on water flux and storage change dynamics. Depending on disciplinary or operational needs, researchers and decision-makers select datasets based on their specific methodological frameworks and sector and regional focus (Yang et al., 2019; Zhang et al., 2016). However, inconsistencies among datasets remain a major challenge (Bring et al., 2015; Ghajarnia et al., 2021; Zarei and Destouni, 2024a), highlighting the need to critically assess the reliability of and identify discrepancies between different datasets, and determine which (if any) accurately reflect the regional hydrological reality under climate change.
The growing availability of regional and global hydro-climatic datasets has improved access to quantitative data for water cycle variables. However, datasets representing entire catchments and facilitating complete water balance closure remain scarce. The limitation of observation-based data is particularly evident for the lateral (horizontal) runoff fluxes (R), which are essential for catchment-wise water balance closure. Such observation-based runoff data are derived from monitored stream discharges, which integrate the hydrological runoff over each contributing catchment and directly determine the catchment-average runoff by dividing the monitored discharge (volumetric flow rate) by the catchment area. The vertical fluxes of precipitation (P) and evapotranspiration (ET) have differing levels of observational coverage. Precipitation data are more accessible, supported by relatively extensive meteorological station networks that permit spatial interpolation or extrapolation to estimate catchment-average P. Direct measurements of ET are far more limited, due to sparse availability of local flux towers, necessitating reliance on model-based estimations of ET at whole catchment scales.
In terrestrial water and climate research, significant geographical gaps also persist, for example, for South America and Africa where large populations both influence and depend heavily on the terrestrial freshwater (Zarei and Destouni, 2024b). In many parts of Africa, the research gaps may to large degree depend on the limited data availability (Ndehedehe, 2019). The research and data gaps are particularly critical in regions like Sub-Saharan Africa (SSA), where water-related vulnerabilities to climate change and related natural hazards may be amplified by limited adaptive societal capacity and infrastructure. Despite the needs, comprehensive and openly accessible datasets with adequate spatial and temporal coverage to facilitate assessment of catchment-wise water balance closure and its changes under the ongoing climate change remain scarce over SSA (Sutcliffe and Parks, 1999; Falkenmark, 1989). These persistent challenges in data reliability, catchment-scale modeling, and water balance closure across the region (Moyers et al., 2023; Banda et al., 2022), reinforce the need for harmonized, quality-checked datasets that bridge multiple data sources and improve consistency for hydrological assessments in SSA. Such datasets are critical to identify and quantify the impacts of climate change on freshwater fluxes and storages across the region. High-quality, openly available data serve as a foundation for improving the scientific understanding and tackling these challenges (Gudmundsson et al., 2017), not least over a region as ecologically and socially diverse as SSA (Turyasingura et al., 2022).
Sub-Saharan Africa is one of the most densely populated regions in the world and faces some of the most unstable and unequal accessibility conditions for freshwater resources (Turyasingura et al., 2022). Water bodies in the region play a critical role in supporting local livelihoods not only for drinking and irrigation, but also for activities such as fishing (Gopal et al., 2022), handcraft production (Onyena and Sam, 2020), and agricultural practices like mulching (Milder et al., 2011; Yahaya et al., 2022). The SSA region comprises 49 countries, spans approximately 24.3 million km2, and stretches across four time zones (Aryeetey-Attoh and McDade, 1997). Covering over 15% of the Earth’s land surface and extending into all four hemispheres, the region is predominantly located between the Tropics of Cancer and Capricorn, subjecting much of it to tropical climatic influences. Nonetheless, SSA exhibits considerable climatic, hydrological, and socio-environmental diversity, with substantial spatial and temporal variability in water availability (Africa, 2018).
While existing data resources such as the Global Runoff Data Centre (GRDC) and HydroSHEDS provide streamflow (Global Runoff Data Centre, 2020) and hydrologically conditioned mapping data (Lehner et al., 2008), respectively, they do not offer a harmonized synthesis of all multiple hydro-climatic variables needed for catchment-wise water balance closure and integrated hydro-climatic assessment. To address this critical need, we present a Sub-Saharan Africa Hydro-Climatic Data (SSA-HCD) synthesis. The SSA-HCD is extracted from the Global Hydro-Climatic Data (GHCD) compilation developed by Zarei and Destouni (2024a) and provides continuous, openly-access, quality-checked hydro-climatic data time series for the same 127 major, non-overlapping hydrological catchments across SSA as presented by four different (types of) datasets for the 30-year period from 1980 to 2020 (Figure 1). Unlike the GRDC, which provides observational runoff data with limited spatial and temporal completeness in SSA (Global Runoff Data Centre, 2020), and HydroSHEDS, which focuses on static hydrographic features (Lehner et al., 2008), the SSA-HCD offers a harmonized, multi-variable dataset with time-resolved hydro-climatic variables and built-in diagnostic indicators for assessing catchment-wise water balance closure around SSA. Furthermore, while the analogous GHCD synthesis applies globally (Zarei and Destouni, 2024a), the SSA-HCD has specific application focus on SSA (Figure 1) for all quantitative comparisons, quality checks, and implications for additional calculated variables of the included comparative datasets (see outline of the comparisons, checks, and additional variable calculations in Figure 2). The quantification steps and procedures are analogous for the SSA-HCD and the GHCD, but the actual quantification results depend on and differ between different region and scale applications. Consequently, the SSA-HCD differs accordingly from the GHCD.
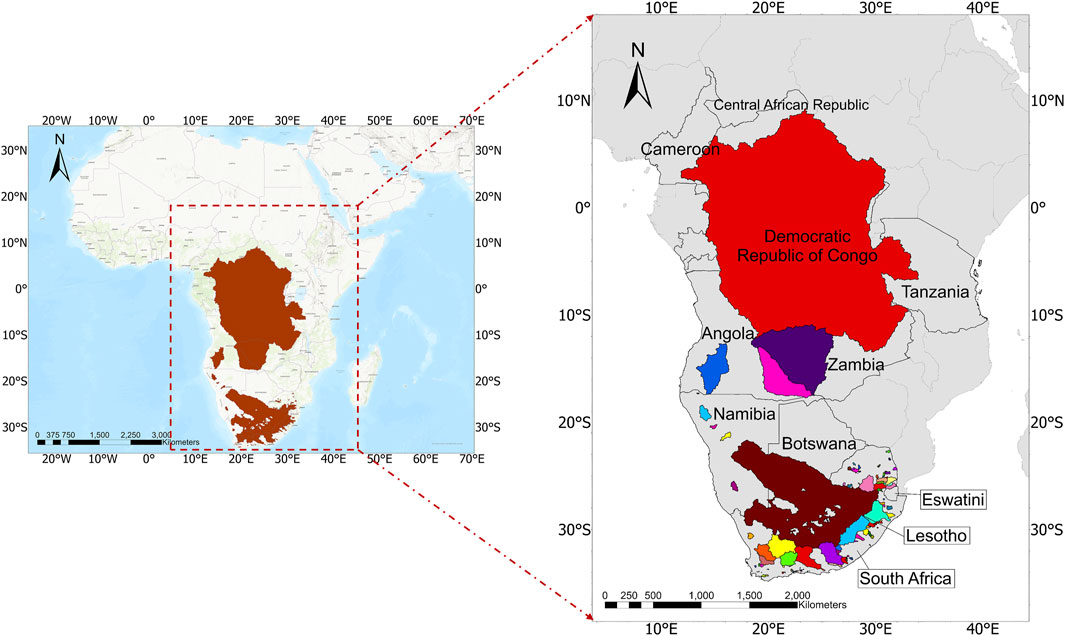
Figure 1. The catchments in the Sub-Saharan Africa Hydro-Climatic Data (SSA-HCD) synthesis and their spreading around the region. The right-hand map shows the extents of the 127 non-overlapping catchments (colored fields) in and across different Sub-Saharan countries.
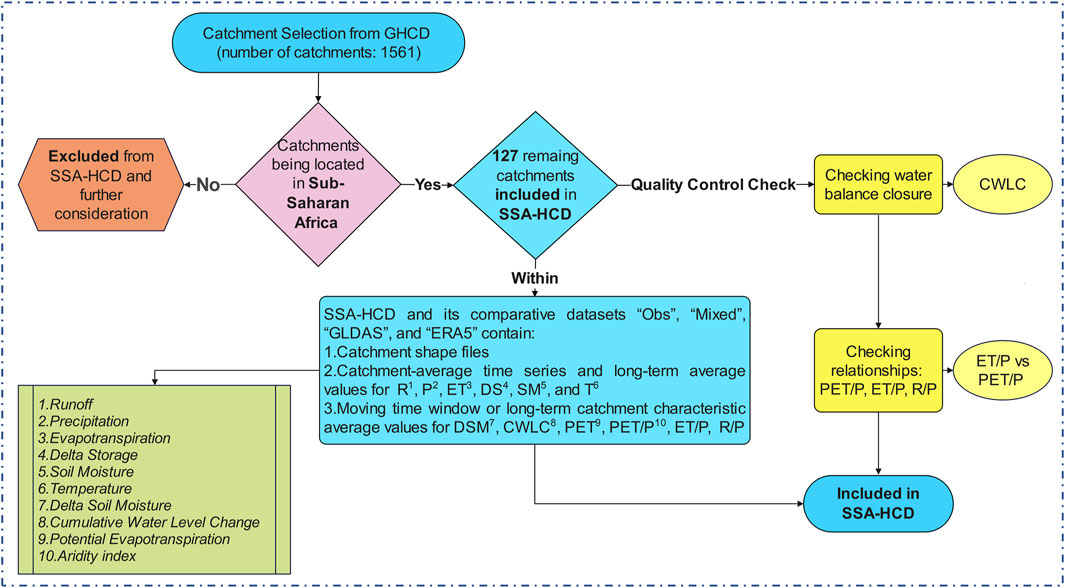
Figure 2. Schematic illustration of the process and steps for creating the Sub-Saharan Africa Hydro-Climatic Data (SSA-HCD) synthesis.
The development of the SSA-HCD aim at several core objectives with focus on the SSA region including: (i) to support consistent evaluation of observational, satellite and model-based, and reanalysis-based estimates of freshwater fluxes and storage dynamics; (ii) to facilitate examination of water balance closure at the catchment level under the associated changing climatic conditions; and (iii) to facilitate deciphering of key spatial and temporal patterns of hydro-climatic dynamics, and of consistency and discrepancy about these dynamics across different datasets. Moreover, the SSA-HCD provides a foundation for further uses of the synthesized data to address important research questions for the region, comparatively between the harmonized included datasets. For example,: (1) In what ways do observational and model-derived datasets differ in capturing interactions among major hydro-climatic variables in and across the SSA catchments? (2) If the dataset implications diverge, which of the divergent representations is more credible or physically plausible? The SSA-HCD dataset also offers a platform for investigating broader research issues across various spatiotemporal scales within SSA, such as: (3) track patterns of variability and change in water extremes and conditions, and analyze their primary climatic and anthropogenic drivers; and (4) assess the impacts of these water variations on sectors such as agriculture, water management, and ecosystem functioning. Furthermore, SSA-HCD serves as a resource for: (5) model calibration and performance evaluation from catchment to regional level for SSA; and (6) quantification of uncertainties and identification of key data limitations, as emerging from conflicting dataset representations of hydro-climatic processes in the region.
The 127 catchments included in the SSA-HCD collectively represent approximately 5.3 million km2 of land area across the SSA. As for the global GHCD synthesis, the selection of these catchments was based on a set of stringent criteria to ensure harmonized and comprehensive spatiotemporal data coverage, open accessibility, and comparability across all four datasets. The primary inclusion criteria were: a minimum of 300 non-missing monthly runoff observations over the 30-year period (1980–2020) for all data sources, internal consistency across all included hydro-climatic variables, and non-overlapping spatial boundaries. Catchment areas within SSA that did not meet these conditions across all datasets were excluded from the final compilation. The non-overlapping criterion was important for avoiding data redundancy and prevent multiple representations of the same hydrological signals in aggregate analyses over the whole region. Moreover, priority was given to the largest possible non-overlapping catchments that satisfied all other data availability and temporal extent criteria, to maximize the spatial coverage of the SSA-HCD while upholding standards of data quality, integrity, and consistency.
The SSA-HCD facilitates assessment of main dataset consistencies and differences for SSA. Such comparative analyses can enhance research on the hydrological impacts of climate change by clarifying the implication robustness and uncovering critical uncertainties in the hydro-climatic relationships, impacts and feedbacks implied by different types of observation and model-based data for the region’s diverse catchments. Furthermore, the SSA-HCD can be used for calibration and validation of various hydro-climatic models, supporting efforts to improve simulation accuracy and predictive capacity across the hydrological catchments of this region. The SSA-HCD synthesis can also be used as a practical tool to improve representations of regional water systems in models and assessments related to regional water management, plans and preparations for droughts and floods. Furthermore, reliable data is often a key barrier both to relevant research, policy, and decision-making. In order to overcoming this barrier, the SSA-HCD supports water-related research and applications, e.g., for water resource planning, climate risk assessments, and developments of adaptation strategies.
2 Materials and methods
2.1 Data compilation and processing procedures
In consistency with the global GHCD compilation, the SSA-HCD incorporates four comparative datasets that enable cross-evaluation of climate change impacts on the regional freshwater fluxes and water balance components (Supplementary Information S1–Supplementary Table S1). (I) One dataset is named Obs and includes in-situ observational data for air temperature (T) from GHCN-CAMS (Fan & Van den Dool, 2008), precipitation (P) from the “Global Precipitation Climatology Centre (GPCC-V7)” (Schneider et al., 2016), and runoff (R) from the “Global Streamflow Indices and Metadata (GSIM)” (Do et al., 2018a; Gudmundsson et al., 2018b); based on the P and R data, Obs further includes estimates of average annual evapotranspiration (ET) using the water balance approximation ET ≈ P–R, under the simplifying assumption of negligible long-term water storage change (DS = P–R - ET ≈ 0). (II) A second dataset is named Mixed and includes the same observational data for T, P and R as Obs, combined with modelled ET data from the “Global Land Evaporation Amsterdam Model (GLEAM)” (Martens et al., 2017; Miralles et al., 2011), which uses satellite observations for its ET modeling, and additionally also provides corresponding soil moisture (SM) data for the SSA-HCD. The observational R data from GSIM in Obs and Mixed directly define the contributing catchments, for which such observational catchment-defining data are available such that the same catchments can included consistently in all comparative observation and model-based datasets of the SSA-HCD. (III) A third dataset is GLDAS, a global reanalysis product that provides a full set of model-based data for T, P, ET, R and SM from the “Global Land Data Assimilation System (GLDAS)” (Beaudoing and Rodell, 2019; Rodell et al., 2004). (IV) An additional global reanalysis dataset (ERA5) is finally also included and offers full model-based time series for all basic hydro-climatic variables T, P, ET, R and SM from the “ECMWF Reanalysis fifth Generation (ERA5)” (Hersbach et al., 2017). For Mixed, GLDAS, and ERA5, the SSA-HCD further includes calculated data for storage change (DS = P–ET–R) based on the modelled ET data provided in these datasets. Catchment-wise water balance closure (comparatively as P–ET–R = DS in Mixed, GLDAS, and ERA5, and approximately assumed P–ET–R≈0 in Obs) is a key for investigating the regional water system state (in terms of R, ET, and DS) under the different climatic conditions of temperature (T) and precipitation (P) around the region, and the consistency or divergence of the different datasets in representing the regional climate and water state relationships (Berghuijs et al., 2014; Bring et al., 2015; Lehmann et al., 2022).
In principle, if consistent observations of water storage change (DS) were widely available from ground-based and/or remote sensing sources checked and accurately calibrated based on ground data, ET could be estimated instead of DS from the catchment-scale water balance as ET = P–R – DS (Bhattarai et al., 2019). However, availability of such DS data with sufficient spatiotemporal resolution across diverse catchments remains a substantial challenge. To further assess internal dataset consistency, the temporal changes in soil moisture (DSM) were also computed for each dataset and compared with the DS implied by the same dataset (Supplementary Note S1), given that DSM is a component of the total DS and both are therefore expected to vary in the same direction (Destouni and Verrot, 2014).
As stated, the 127 non-overlapping catchments included in the SSA-HCD are determined by the stream discharge measurement locations in the Global Streamflow Indices and Metadata (GSIM) archive. These discharge data also form the basis for determining catchment-average R in both the Obs and Mixed datasets, and enable the estimation of ET in Obs as ET = P–R. For the remaining variables, gridded datasets were used, with data extracted according to the hydrological boundaries of each catchment. To compute catchment-average values, consistent with the catchment-average R data, spatial interpolation was applied using an area-weighted averaging approach for all grid cells intersecting the boundaries (topographically determined water divide) of each catchment. The data processing was conducted at the finest consistent temporal resolution available (monthly) for and across all hydro-climatic variables to generate continuous time series of monthly variable values for each catchment. In addition, corresponding annual and long-term average variable values were also calculated for each catchment to facilitate analyses of interannual variability and longer-term hydro-climatic trends in and across the catchments.
The schematic flowchart in Figure 2 presents an overview of the data processing steps used to create the multi-catchment, multi-dataset SSA-HCD (Zarei and Destouni, 2025b). As summarized visually in Figure 2, the processing steps in the SSA-HCD development, are consistent with and include the same data quality and consistency requirements, checks, and assurances as the analogous published global data syntheses GHCD (Zarei and Destouni, 2024a), and BHCD for the Baltic region (Zarei and Destouni, 2025a). For more detailed descriptions of the different steps and associated requirements, checks, and assurances of data quality and consistency, we refer to the more extensive GHCD paper (Zarei and Destouni, 2024a).
2.2 SSA-HCD overview
The comparative datasets included in the SSA-HCD provide time series of monthly and annual average values for each hydro-climatic variable, along with their long-term averages over the 30-year climatological reference period (1980–2010). This period aligns with the World Meteorological Organization (WMO) recommendation to use 30-year intervals for representing climatic norms (World Meteorological Organization, 2017); the SSA-HCD can be further extended as more recent data become available and climatic reference periods change. The only exception in terms of temporal resolution is the Obs dataset, which does not include monthly time series for ET and DS. This is because the assumption of ET ≈ P - R and DS ≈ 0 in Obs is only physically meaningful for annual or longer-term average (and not monthly) water balance. This assumption (DS ≈ 0) is commonly used in large-scale water balance assessments over multi-annual and longer time periods (e.g., Althoff and Destouni, 2023; Bhattarai et al., 2019). Average water storage change (DS) has been shown to often be small over whole catchments (Jaramillo et al., 2013) and larger scales (Zarei and Destouni, 2024a) relative to the corresponding average evapotranspiration flux that this assumption is used to calculate as ET ≈ P-R since ET is not measured over such large scales. All dataset variables are further provided as catchment-average values. In addition to the primary climatic air temperature (T) and precipitation (P) data and corresponding hydrological flux and storage-change data (for ET, R, DS, and DSM), the SSA-HCD also includes data for catchment-average cumulative water level change (CWLC) implied by DS over the full 30-year period (SI-Note S2 and associated Supplementary Figure S1), and the long-term aridity index (PET/P; where PET is potential evapotranspiration) and flux partitioning ratios ET/P and R/P (SI-Note S3 and associated Supplementary Figure S2).
Folder 1 of the SSA-HCD contains the catchment polygon shapefiles used to extract the data from the corresponding global datasets and aggregate them over each SSA catchment to produce catchment-average time series of the hydro-climatic variables. These polygons were sourced from the Global Streamflow Indices and Metadata archive (Do et al., 2018b; Gudmundsson et al., 2018a) and have been renamed to match the naming conventions adopted in the SSA-HCD. A corresponding csv file, “Catchment_Info.csv,” also located in Folder 1, provides essential metadata, including the SSA-HCD catchment names, their original GSIM identifiers, the country in which each catchment’s outlet (hydrometric station) is located, and the reported catchment area in km2 (as per GSIM). In GSIM, each gauged catchment is linked to a specific river station, with an associated country designation based on the station’s location—regardless of whether the full catchment area spans multiple countries. For instance, catchments labeled under “Namibia” include the Konkiep River (Bethanien station), Omaruru River (Etemba station), Abu-Huab River (Rooiberg station), Hoanib River (Sesfontein station), Kwando River (Kongola station), Zambezi River (Katima Mulilo station), Kunene River (Ruacana station), and Omuhonga River (Ombuka station). Although several of these rivers are transboundary and thus extend into countries such as Angola and Zambia, they are categorized under “Namibia” in GSIM due to the monitoring station location in Namibian territory.
Folders 2–5 of the SSA-HCD contain catchment-average monthly and annual time series for the hydro-climatic variables air temperature (T), precipitation (P), evapotranspiration (ET), runoff (R), total water storage change (DS), and soil moisture (SM) across the 127 non-overlapping study catchments within SSA, for each of the four datasets: Obs, Mixed, GLDAS, and ERA5. The Obs dataset includes only annual time series and long-term average values for ET and DS, and does not include any corresponding soil moisture data. All data are provided in csv format, organized by variable and catchment. Each dataset folder contains: (a) an annual folder with annual time series data, (b) a monthly folder with monthly time series data, (c) a summary file titled DatasetX_AnnualDataSummary.csv, which compiles long-term average values for P, R, ET, DS, SM, DSM, T, and PET across all 127 catchments, along with derived indices (PET/P, ET/P, R/P), CWLC values, and associated catchment metadata (name, outlet country, outlet latitude/longitude, and area in km2), and (d) a Readme_Data Columns and Variable Units. txt file, providing comprehensive documentation on all variables, including data sources, origins, units, and corresponding column headers in the time series files. For SM, the readme file also includes information about the rootzone depth used from the soil moisture profiles of the Mixed (GLEAM-based), ERA5, and GLDAS datasets. Users are strongly encouraged to consult the readme file prior to working with the data time series in the Annual and Monthly folders to ensure correct interpretation and usage.
3 Conclusions and applications
While data availability constraints have influenced the selection of hydro-climatic study regions in past research, these constraints also underscore the need to start prioritizing underrepresented areas in new investigations. The SSA-HCD provided here opens new avenues to bridge the data gaps for SSA. The SSA-HCD shows both agreements and differences in the hydro-climatic variables and the catchment-wise water balances they imply based on the different datasets. Further study of these data and their implications can provide new insights into the reasons for dataset divergence and advance our understanding of the impacts of climate change on the freshwater fluxes and storage change dynamics in the SSA. Use of the SSA-HCD can enable a wide range of hydro-climatic research applications, such as: quantifying long-term groundwater depletion through analysis of DS and DSM trends, evaluating flood and drought hazards based on precipitation and runoff variations and how they are modulated by evapotranspiration and temperature, comparing and analyzing how different datasets represent these extreme events, supporting seasonal forecasting and early warning systems for the extreme events, validating hydrological and land surface models, and assessing climate change impacts on water availability at catchment and over larger scales. These applications can target multiple stakeholders groups including: hydrologists and water resource scientists for evaluating water balance closure and hydro-climatic interactions, climate modelers and data assimilation experts for benchmarking land surface models and assessing data realism, regional planners and applied researchers for drought trend assessment, flood risk modeling, and water resource planning in data-scarce contexts, and policy and decision-support communities who may rely on catchment-scale data to guide investment and adaptation planning under climate variability.
It is important for users to recognize that the datasets included in the SSA-HCD are not fully independent, as they share some underlying data and methodologies. However, each dataset involves distinct assumptions and modeling approaches that can help reveal the reasons for inconsistencies between the datasets. For instance, differences between the Obs and Mixed datasets depend primarily on their alternative methods of ET estimation, while differences between GLDAS and ERA5 stem from their different model representations of hydro-climatic interaction processes on land, beyond the similar atmospheric forcing of these datasets. The SSA-HCD synthesis enables valuable hydro-climatic analysis across SSA, subject to various limitations inherited from the source datasets. For instance, GPCC precipitation data are affected by sparse gauge coverage in parts of SSA, leading to uncertainties in interpolated data values. Similarly, GSIM streamflow data, though extensively quality-controlled, are also spatially limited and include associated data gaps and station-specific uncertainties. The reanalysis datasets ERA5 and GLDAS offer full spatial coverage over SSA, but have been primarily calibrated using data from other regions, with denser observational infrastructure, which may introduce important biases when applied to the SSA region. These underlying dataset limitations are not corrected in the SSA-HCD. The four included datasets, however, collectively support consistent cross-comparisons that can identify important result convergence and robustness, and key result differences and uncertainties between the datasets.
Data availability statement
The original contributions presented in the study are included in the article/Supplementary Material, further inquiries can be directed to the corresponding author.
Author contributions
MZ: Conceptualization, Software, Formal Analysis, Writing – original draft, Methodology, Visualization, Investigation. GD: Visualization, Funding acquisition, Writing – review and editing, Conceptualization, Supervision, Methodology, Writing – original draft.
Funding
The author(s) declare that financial support was received for the research and/or publication of this article. Funding support for this study has been provided by the Swedish Research Council (VR, project 2022-04672). This study has been partially funded by the Swedish Research Council through grant agreement no. 2022-06725.
Acknowledgments
Part of the computations and data handling were enabled by resources provided by the National Academic Infrastructure for Supercomputing in Sweden (NAISS), partially funded by the Swedish Research Council through grant agreement no. 2022-06725.
Conflict of interest
The authors declare that the research was conducted in the absence of any commercial or financial relationships that could be construed as a potential conflict of interest.
Generative AI statement
The author(s) declare that no Generative AI was used in the creation of this manuscript.
Any alternative text (alt text) provided alongside figures in this article has been generated by Frontiers with the support of artificial intelligence and reasonable efforts have been made to ensure accuracy, including review by the authors wherever possible. If you identify any issues, please contact us.
Publisher’s note
All claims expressed in this article are solely those of the authors and do not necessarily represent those of their affiliated organizations, or those of the publisher, the editors and the reviewers. Any product that may be evaluated in this article, or claim that may be made by its manufacturer, is not guaranteed or endorsed by the publisher.
Supplementary material
The Supplementary Material for this article can be found online at: https://www.frontiersin.org/articles/10.3389/fenvs.2025.1646528/full#supplementary-material
References
Abbasnia, A., Yousefi, N., Mahvi, A. H., Nabizadeh, R., Radfard, M., Yousefi, M., et al. (2019). Evaluation of groundwater quality using water quality index and its suitability for assessing water for drinking and irrigation purposes: case study of sistan and baluchistan province (Iran). Hum. Ecol. Risk Assess. Int. J. 25 (4), 988–1005. doi:10.1080/10807039.2018.1458596
Africa, S.-S. (2018). Sustainable solar energy collection and storage for rural. In: A comprehensive guide to solar energy systems: with special focus on photovoltaic systems, Vol. 81. Cham, Switzerland: Springer.
Althoff, D., and Destouni, G. (2023). Global patterns in water flux partitioning: irrigated and rainfed agriculture drives asymmetrical flux to vegetation over runoff. One Earth 6 (9), 1246–1257. doi:10.1016/j.oneear.2023.08.002
Aryeetey-Attoh, S., and McDade, B. E. (1997). Geography of Sub-Saharan Africa. Upper Saddle River, New Jersey: Prentice Hall.
Banda, L., Van Loon, A. F., Bogaard, T. A., and van de Giesen, N. (2022). Hydrological modelling and climate adaptation under changing climate: a review with a focus in Sub-Saharan Africa. Water 14 (24), 4031. doi:10.3390/w14244031
Beaudoing, H., and Rodell, M. (2019). GLDAS noah land surface model L4 monthly 1.0× 1.0 degree V2. 0, greenbelt, Maryland, USA, goddard Earth sciences data and information services center (GES DISC) Greenbelt, MD.
Berghuijs, W., Woods, R., and Hrachowitz, M. (2014). A precipitation shift from snow towards rain leads to a decrease in streamflow. Nat. Clim. Change 4 (7), 583–586. doi:10.1038/nclimate2246
Bhattarai, N., Mallick, K., Stuart, J., Vishwakarma, B. D., Niraula, R., Sen, S., et al. (2019). An automated multi-model evapotranspiration mapping framework using remotely sensed and reanalysis data. Remote Sens. Environ. 229, 69–92. doi:10.1016/j.rse.2019.04.026
Bring, A., Asokan, S. M., Jaramillo, F., Jarsjö, J., Levi, L., Pietroń, J., et al. (2015). Implications of freshwater flux data from the CMIP5 multimodel output across a set of northern hemisphere drainage basins. Earth’s Future 3 (6), 206–217. doi:10.1002/2014ef000296
Destouni, G., and Verrot, L. (2014). Screening long-term variability and change of soil moisture in a changing climate. J. Hydrology 516, 131–139. doi:10.1016/j.jhydrol.2014.01.059
Do, H. X., Gudmundsson, L., Leonard, M., and Westra, S. (2018a). The global streamflow indices and metadata archive—part 1: station catalog and catchment boundary. Bremen, Germany: Pangaea. doi:10.1594/PANGAEA.887477
Do, H. X., Gudmundsson, L., Leonard, M., and Westra, S. (2018b). The global streamflow indices and metadata archive (GSIM)—Part 1: the production of a daily streamflow archive and metadata. Earth Syst. Sci. Data 10 (2), 765–785. doi:10.5194/essd-10-765-2018
Falkenmark, M. (1989). The massive water scarcity now threatening Africa: why isn't it being addressed? Ambio 18 (2), 112–118. Available online at: https://www.jstor.org/stable/4313541.
Fan, Y., and Van den Dool, H. (2008). A global monthly land surface air temperature analysis for 1948–present. J. Geophys. Res. Atmos. 113 (D1). doi:10.1029/2007jd008470
Ghajarnia, N., Kalantari, Z., and Destouni, G. (2021). Data-driven worldwide quantification of large-scale hydroclimatic covariation patterns and comparison with reanalysis and Earth system modeling. Water Resour. Res. 57 (10), e2020WR029377. doi:10.1029/2020wr029377
Global Runoff Data Centre (GRDC) (2020). The global runoff data centre (GRDC): river discharge data access. Koblenz, Germany: Federal Institute of Hydrology. Available online at: https://www.bafg.de/GRDC (Accessed August 01, 2025).
Gopal, N., Raghavan, R. M., Sruthi, P., Rejula, K., and Ananthan, P. (2022). Traditional access rights and methods of fishing in inland water bodies: are women slowly losing out? A study from Kerala, India. Gend. Technol. Dev. 26 (3), 522–543. doi:10.1080/09718524.2022.2120844
Gudmundsson, L., Seneviratne, S. I., and Zhang, X. (2017). Anthropogenic climate change detected in European renewable freshwater resources. Nat. Clim. Change 7 (11), 813–816. doi:10.1038/nclimate3416
Gudmundsson, L., Do, H. X., Leonard, M., and Westra, S. (2018a). The global streamflow indices and metadata archive (GSIM)—Part 2: time series indices and homogeneity assessment. Bremen, Germany: Pangaea. doi:10.1594/PANGAEA.887470
Gudmundsson, L., Do, H. X., Leonard, M., and Westra, S. (2018b). The global streamflow indices and metadata archive (GSIM)—Part 2: quality control, time-series indices and homogeneity assessment. Earth Syst. Sci. Data 10 (2), 787–804. doi:10.1594/essd-10-787-2018
Gulzar, A., Islam, T., Gulzar, R., and Hassan, T. (2021). Climate change and impacts of extreme events on human health: an overview. Indonesian J. Soc. Environ. Issue. 2 (1), 68–77. doi:10.47540/ijsei.v2i1.180
Hersbach, H., Bell, B., Berrisford, P., Hirahara, S., Horányi, A., Muñoz-Sabater, J., et al. (2017). Complete ERA5 from 1940: fifth generation of ECMWF atmospheric reanalyses of the global climate. Reading, United Kingdom: Copernicus Climate Change Service (C3S) Data Store (CDS). doi:10.24381/cds.143582cf
Jaramillo, F., Prieto, C., Lyon, S. W., and Destouni, G. (2013). Multimethod assessment of evapotranspiration shifts due to non-irrigated agricultural development in Sweden. J. Hydrology 484, 55–62. doi:10.1016/j.jhydrol.2013.01.010
Lehmann, F., Vishwakarma, B. D., and Bamber, J. (2022). How well are we able to close the water budget at the global scale? Hydrology Earth Syst. Sci. 26 (1), 35–54. doi:10.5194/hess-26-35-2022
Lehner, B., Verdin, K., and Jarvis, A. (2008). New global hydrography derived from spaceborne elevation data. Trans. Am. Geophys. Union 89 (10), 93–94. doi:10.1029/2008EO100001
Martens, B., Miralles, D. G., Lievens, H., Van Der Schalie, R., De Jeu, R. A., Fernández-Prieto, D., et al. (2017). GLEAM v3: satellite-Based land evaporation and root-zone soil moisture. Geosci. Model Dev. 10 (5), 1903–1925. doi:10.5194/gmd-10-1903-2017
McGregor, G. R., Ferro, C. A., and Stephenson, D. B. (2005). Projected changes in extreme weather and climate events in Europe. Extreme Weather Events Public Health Responses, 13–23. doi:10.1007/3-540-28862-7_2
Milder, J. C., Majanen, T., and Scherr, S. J. (2011). Performance and potential of conservation agriculture for climate change adaptation and mitigation in Sub-Saharan Africa. Blacksburg, VA: Virginia Tech.
Miralles, D. G., Holmes, T., De Jeu, R., Gash, J., Meesters, A., and Dolman, A. (2011). Global land-surface evaporation estimated from satellite-based observations. Hydrology Earth Syst. Sci. 15 (2), 453–469. doi:10.5194/hess-15-453-2011
Moyers, J. S., Bierkens, M. F. P., Wood, E. F., Sutanudjaja, E. H., and van Beek, L. P. H. (2023). A decade of data-driven water budgets: lessons and prospects for integrating observations, models, and machine learning. Water Resour. Res. 59 (1), e2022WR034310. doi:10.1029/2022WR034310
Ndehedehe, C. E. (2019). The water resources of tropical West Africa: problems, progress, and prospects. Acta Geophys. 67 (2), 621–649. doi:10.1007/s11600-019-00260-y
Onyena, A. P., and Sam, K. (2020). A review of the threat of oil exploitation to mangrove ecosystem: insights from niger Delta, Nigeria. Glob. Ecol. Conservation 22, e00961. doi:10.1016/j.gecco.2020.e00961
Rodell, M., Houser, P., Jambor, U., Gottschalck, J., Mitchell, K., Meng, C.-J., et al. (2004). The global land data assimilation system. Bull. Am. Meteorological Soc. 85 (3), 381–394. doi:10.1175/bams-85-3-381
Schneider, U., Becker, A., Finger, P., Meyer-Christoffer, A., Rudolf, B., and Ziese, M. (2016). GPCC full data reanalysis version 7.0: monthly land-surface precipitation from rain gauges built on GTS based and historic data. Boulder, CO: US National Science Foundation.
Solangi, G. S., Siyal, A. A., Babar, M. M., and Siyal, P. (2020). Groundwater quality evaluation using the water quality index (WQI), the synthetic pollution index (SPI), and geospatial tools: a case study of sujawal district, Pakistan. Hum. Ecol. Risk Assess. Int. J. 26, 1529–1549. doi:10.1080/10807039.2019.1588099
Sutcliffe, J. V., and Parks, Y. P. (1999). The hydrology of the nile. In: A foundational source on SSA hydrology from a basin-wide perspective. Wallingford: IAHS Press.
Turyasingura, B., Chavula, P., Hirwa, H., Mohammed, F. S., Ayiga, N., Bojago, E., et al. (2022). A systematic review and meta-analysis of climate change and water resources in sub-sahara Africa. UNCST, 1–32. doi:10.37284/ajccrs.2.1.1264
Wijkman, A., and Timberlake, L. (2021). Natural disasters: acts of god or acts of man? Milton, OX: Routledge.
World Meteorological Organization (2017). WMO guidelines on the calculation of climate normals. Geneva, Switzerland: World Meteorological Organization.
Yahaya, M., Damoah-Afari, P., Mensah, C., Kumi, N., Prempeh, N. A., and Anima, P. A. (2022). Climate change adaptation strategies of smallholder farmers in the Mamprugu-moaduri district of Ghana. J. Energy Nat. Resour. Manag. 8 (1), 86–94.
Yang, H., Huntingford, C., Wiltshire, A., Sitch, S., and Mercado, L. (2019). Compensatory climate effects link trends in global runoff to rising atmospheric CO2 concentration. Environ. Res. Lett. 14 (12), 124075. doi:10.1088/1748-9326/ab5c6f
Zarei, M., and Destouni, G. (2024a). A global multi catchment and multi dataset synthesis for water fluxes and storage changes on land. Sci. Data 11 (1), 1333–13. doi:10.1038/s41597-024-04203-1
Zarei, M., and Destouni, G. (2024b). Research gaps and priorities for terrestrial water and Earth system connections from catchment to global scale. Earth Future 12 (1), e2023EF003792. doi:10.1029/2023EF003792
Zarei, M., and Destouni, G. (2025a). Baltic hydro-climatic data: a regional data synthesis for the Baltic sea drainage basin. Front. Earth Sci. 13, 1595943. doi:10.3389/feart.2025.1595943
Zarei, M., and Destouni, G. (2025b). Sub-saharan Africa hydro-climatic data. Geneva, Switzerland: Zenodo. doi:10.5281/zenodo.15260974
Zhang, Y., Peña-Arancibia, J. L., McVicar, T. R., Chiew, F. H., Vaze, J., Liu, C., et al. (2016). Multi-decadal trends in global terrestrial evapotranspiration and its components. Sci. Rep. 6 (1), 19124. doi:10.1038/srep19124
Keywords: hydro-climatic data, climate-water interplay, sub-Saharan Africa, water flux and storage changes, catchments, water balance
Citation: Zarei M and Destouni G (2025) A hydro-climatic data synthesis for Sub-Saharan Africa: facilitating water balance closure with different comparative datasets. Front. Environ. Sci. 13:1646528. doi: 10.3389/fenvs.2025.1646528
Received: 13 June 2025; Accepted: 10 September 2025;
Published: 24 September 2025.
Edited by:
Günter Blöschl, Vienna University of Technology, AustriaReviewed by:
Ngiamte George Lemewihbwen, The University of Bamenda, CameroonBrahim Benzougagh, Mohamed V University, Morocco
Copyright © 2025 Zarei and Destouni. This is an open-access article distributed under the terms of the Creative Commons Attribution License (CC BY). The use, distribution or reproduction in other forums is permitted, provided the original author(s) and the copyright owner(s) are credited and that the original publication in this journal is cited, in accordance with accepted academic practice. No use, distribution or reproduction is permitted which does not comply with these terms.
*Correspondence: Mohanna Zarei, bW9oYW5uYS56YXJlaUBuYXRnZW8uc3Uuc2U=