 Yu Ma
Yu Ma Weijie He2
- 1Research Center of China-Pakistan Economic Corridor, Kashi University, Xinjiang, China
- 2School of Finance, Shandong Technology and Business University, Yantai, Shandong, China
- 3Xin’an County Tax Bureau, State Administration of Taxation, Xin’an, China
The integration of low-carbon concepts into financial products through green finance promotes sustainable development and contributes to achieving carbon neutrality by mitigating carbon emissions. However, existing literature has rarely examined the impact of green finance on carbon emissions from nonlinear and spatial spillover perspectives, with insufficient exploration of the underlying mechanisms. This study aims to fill this research gap by adopting a nonlinear perspective and innovatively combining it with spatial econometric models to investigate the pathways and mechanisms through which green finance influences carbon emissions. Using annual panel data from 2007 to 2019 across 30 Chinese provinces, this research examines the relationship between green finance development and carbon emissions. We find that the relationship between green finance and carbon emissions follows an inverted U-shaped curve, with cross-regional spillover effects. Regionally, central and western China demonstrate stronger carbon emission reduction spillover effects compared to eastern China. Through mechanism tests, the study verifies the inverted U-shaped impact of green finance on carbon emissions via energy structure adjustment and technological advancement, further analyzing greenwashing phenomena and examining the lagged effects of green finance on emission reduction. This research emphasizes the significance of green finance in curbing carbon emissions, highlights its crucial role in promoting technological innovation and optimizing energy consumption structures, and calls for enhanced interprovincial cooperation to amplify the overall spatial impact of emission reduction efforts.
1 Introduction
The global climate crisis has become increasingly severe, with carbon emissions (CE) emerging as a focal point of international attention. To address this challenge, nations worldwide have been actively implementing policy initiatives. Countries including Canada, Japan, Mexico, and the United Kingdom have issued policy statements aimed at raising public awareness of the adverse climate impacts of fossil fuel emissions and associated climate change risks. At the international level, the Paris Agreement, a legally binding treaty on climate change mitigation, was ratified by signatory nations with the goal of limiting global warming to 2 °C or below (Chen et al., 2020). Members of the Conference of the Parties to the United Nations Framework Convention on Climate Change (COP26) also pledged commitments to reduce greenhouse gas emissions.
During the 75th United Nations General Assembly in September 2020, Xi Jinping made a solemn pledge to the global community, committing China to the ambitious “dual carbon” objectives of reaching carbon emission peak by 2030 and attaining carbon neutrality by 2060. As China’s economy transitions to high-quality development, these goals have become a pivotal focus. The United Nations Environment Programme called for a transformation of the global financial system in 2021, urging nations to shift their investment preferences towards renewable resources and low-carbon economies, utilizing GF to drive global sustainable development.
Green Finance (GF), which provides financial services for climate change mitigation and the promotion of resource-efficient and environmentally friendly economic activities, has emerged as a pivotal tool for carbon emission (CE) reduction. China has made significant contributions to advancing its “dual carbon” goals through the development of green finance. In August 2016, the People’s Bank of China (PBC) issued the “Guidelines on Constructing a Green Financial System (GCGFS)”, highlighting GF as a crucial instrument for economic restructuring and sustainable development. Since 2017, China has established Green Financial Reform and Innovation Pilot Zones (GFPZs) in six provinces and nine regions, leading to rapid growth in the total business volume of GF. By the first quarter of 2023, the balance of domestic and foreign currency green loans had surged to 24.99 trillion yuan, marking a substantial year-on-year increase of 38.3% compared to 5.20 trillion yuan in 2013. The scale of GF has expanded more than 3.8 times.
Green finance, as a rapidly evolving financial paradigm, has gradually permeated all aspects of production and daily life, and its environmental impact has attracted widespread attention. Notably, the effect of green finance (GF) on carbon emissions is not immediate but evolves from an initially modest impact to a pronounced one. In the early stages, green finance investments may have only a small effect on emissions, and only after reaching a certain threshold does a significant reduction effect emerge. Traditional approaches use linear models, which assume a constant marginal effect per unit of investment; however, in reality, the influence of green finance changes in different ways as it develops. Because project outcomes often exhibit time lags and some polluting firms may increase output before policies tighten, this effect is typically muted in the initial phase. Linear models cannot accurately capture these long-term dynamics. Moreover, the emission-reduction effectiveness of green finance varies across regions, factors, and levels of green finance and carbon emissions, exhibiting nonlinear characteristics (Liu et al., 2025). Therefore, relying solely on linear methods can lead to estimation errors or fail to detect critical turning points, preventing a comprehensive and accurate identification of green finance’s true impact on carbon emissions. Although most existing studies analyze the green finance–carbon emissions relationship from a linear perspective, this study reveals a “nonlinear inverted-U″ relationship between the two. Empirical evidence indicates that in the early stages of green finance development, green finance may actually increase carbon emissions (Yadav et al., 2024). However, over time, it significantly reduces emissions—especially after the inflection point is reached. This finding has practical implications for the advancement of green finance and the achievement of “peak carbon” and “carbon neutrality” goals. In addition, the widespread phenomenon of “greenwashing”—inconsistent rhetoric and actions regarding ecological and environmental protection—may initially lead to increased emissions rather than reductions (Jin and He, 2024). The existing literature has not fully explored the nonlinear relationship and spatial spillover effects between green finance and carbon emission intensity. Addressing these issues will not only inform government carbon-reduction policies but also offer new perspectives for the theoretical development of green finance. Future research should adopt more sophisticated nonlinear models and spatial analysis methods to investigate how green finance affects carbon emission intensity through different mechanisms and stages, and to uncover its spillover effects on neighboring regions, thereby providing more comprehensive and precise theoretical support for policymaking.
This study makes four key contributions to the existing literature: First, it employs a nonlinear model to empirically examine the relationship between green finance (GF) and carbon emissions (CE), revealing an inverted U-shaped nonlinear relationship contrary to conventional linear assumptions. Second, unlike most existing studies that neglect spatial factors, this research incorporates a Spatial Durbin Model (SDM) to analyze both intra-regional and inter-regional emission effects. By integrating nonlinear relationships into the SDM framework, the study demonstrates significant inverted U-shaped spillover effects from neighboring regions, thereby enhancing the depth of analytical insights. Third, it provides theoretical support for nonlinear mechanisms through two transmission channels—energy consumption structure adjustment and technological development promotion—while clarifying the specific roles of these mechanisms in mediating the overall impact. Finally, the study investigates the “greenwashing” phenomenon as a potential factor contributing to initial ineffective carbon reduction outcomes in green finance policies. To validate this hypothesis, it employs a Difference-in-Differences (DID) model and extends the analysis to examine lagged effects of green finance on emission reduction.
The remainder of the paper is organized sequentially. Section 2 reviews the extant literature on the relationship between green finance and carbon emissions, followed by the development of research hypotheses. Section 3 presents the construction of baseline models, the Spatial Econometric Model (SEM), and details on data sources. Section 4 carries out empirical analysis and mechanism testing, while Section 5 further examines the “greenwashing” phenomenon and the lagged effects of GF on CE reduction. The final section synthesizes key findings, discusses their policy implications, and proposes actionable recommendations. The structure of the full text is shown in Figure 1.
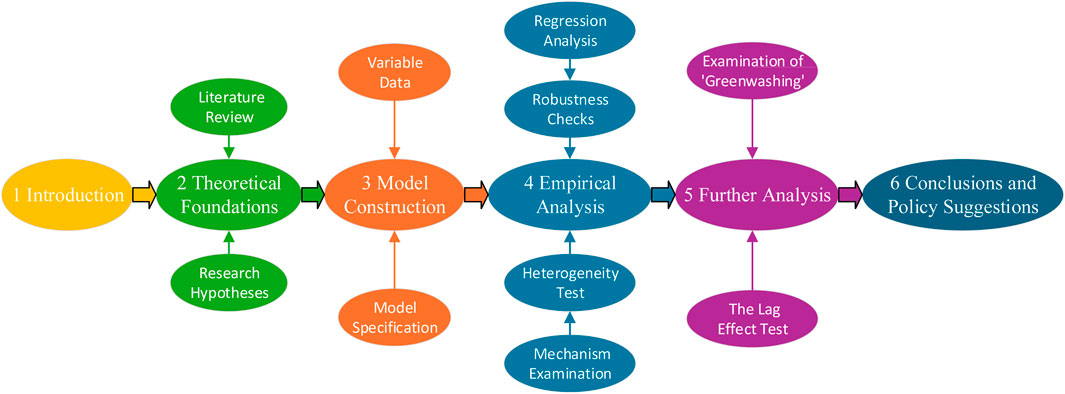
Figure 1. Article structure.
2 Theoretical Foundations
2.1 Literature review
Green Finance refers to activities that allocate funds toward environmentally sustainable development while providing fair returns to investors or lenders. Ozili (2021) defines green finance as project financing that generates economic benefits while promoting sustainable environmental outcomes, encompassing instruments such as green credit, green securities, green insurance, and green investments. The primary objective of green finance is to enhance capital flows from financial institutions to economic agents engaged in environmental protection projects and activities, thereby advancing the Sustainable Development Goals (Jawadi et al., 2025). The imperative to mitigate environmental harm caused by fossil fuel emissions has driven calls for divestment from fossil fuel-related activities and investment diversion toward low-carbon and environmentally friendly projects (Bergman, 2018; Galimova et al., 2023). These financial resources are collectively termed green finance or green financial instruments. Transitioning to a low-carbon or environmentally friendly economy necessitates innovative financing mechanisms to meet the growing yet modest-scale demands of the green economy sector. Consequently, proponents of green economics have advocated for green finance as a viable solution to address the financing needs of individuals, corporations, and governments participating in environmental conservation initiatives.
Most research on the impact of green finance (GF) on carbon emissions (CE) adopts a linear perspective, and one strand of the literature argues that GF development significantly suppresses CE (An, 2008; Xiu et al., 2015; He et al., 2019; Shen et al., 2021; Wen et al, 2021; Liu et al., 2022; Han et al., 2023). GF supports environmental protection and sustainable development through instruments such as green credit, green venture capital, green investment, and green bonds. Green credit—by offering low-interest loans—encourages investment in green projects; Song et al. (2021) find that it raises lending thresholds for polluting industries and promotes industrial upgrading, thus improving energy efficiency, and An et al. (2021) report that green credit can reduce carbon emissions to some extent. Zhao (2021) demonstrates that green credit significantly fosters regional green innovation activities, driving the adoption of clean energy and low-carbon technologies. Green venture capital provides funding for innovative green technologies and environmental enterprises; Jiang et al. (2020), using panel data from 23 Chinese provinces (2003–2016) and a dynamic panel model, show that both green credit and green venture capital significantly curb carbon emissions. Green investment focuses on sustainable industries such as clean energy and emission reduction—Zahan and Chuanmin (2021) find that green investment promotes clean energy consumption in China and suppresses carbon emissions, while Shen et al. (2021) confirm a negative correlation between green investment and CE. Energy transition, another key factor influencing CE, is driven by multiple elements: Wang et al. (2025a) find that carbon trading prices and crude oil prices jointly affect energy transition. Green bonds, through debt financing, support environmental projects; Wang et al. (2025b) using a quantile regression–distributed lag model, find that both artificial intelligence development and green bonds impact CE. Together, these instruments channel funds into green industries and advance environmental protection and emission-reduction objectives (You et al., 2022).
Another stream of research holds that the effect of green finance on carbon emissions not only exhibits time-lagged dynamics but also varies across regions and policy contexts. Liu et al. (2015) empirically find that green credit policies—by adjusting firms’ investment structures—can reduce carbon emissions in the long run, though their short-term impact is muted by factors such as industrial composition. Similarly, Wang et al. (2025c) show that geopolitical risk has a more pronounced long-term effect on carbon-futures volatility, while economic policy uncertainty significantly affects volatility in both the short and long term. Cao et al. (2021) report that green credit’s emission-reduction effects are limited for non-state-owned enterprises and in financially underdeveloped regions, and Shi and Shi (2022) find that in areas with poor environmental conditions and low financial development, the effectiveness of green finance is substantially weakened. Du (2023) examines the heterogeneous treatment effects of green finance on regional emissions. Wan et al. (2022) observe a significant negative relationship between green finance and global carbon emissions, particularly in emerging economies. Policy pilots also matter: the implementation of green finance pilot zones has significantly lowered regional emissions (Du and Zheng, 2019; Zhang et al., 2021; Fan and Zhang, 2022; Tan et al., 2023; Xie and Fan, 2023). These pilot programs have improved industrial structure toward greener, more energy-efficient sectors (Si and Yao, 2022) and raised financing costs for high-polluting firms, thereby incentivizing their transition to low-carbon operations (Wang et al., 2021). Wen Huwei et al. (2021) argue that green credit policies increase financing costs for “two-high” enterprises (high energy consumption and high emissions), thus deterring their green innovation and development.
Moreover, several studies highlight spatial spillover effects: green finance not only reduces local emissions but also lowers carbon emissions in neighboring regions (Li and Gan, 2020; Chen and Chen, 2021; Gao and Shen, 2022). Tian et al. (2022), using a dynamic Spatial Durbin Model on 30 Chinese regions, find that higher levels of green finance development decrease both local and adjacent emissions, with direct effects outweighing indirect effects and short-term impacts exceeding long-term ones. Yuyan et al., 2023 confirm that green finance’s emission-reduction effects have both territorial and spillover dimensions, yielding stronger cross-regional synergy.
The literature review indicates that most empirical studies of green finance (GF) on carbon emissions (CE) rely on provincial panel data and GF pilot zones (GFPZs), and that research on GF’s spatial spillover effects suggests positive impacts on neighboring regions. However, existing work has notable limitations. The vast majority assume a linear GF–CE relationship, implying that increases in GF directly and proportionally reduce CE, thereby overlooking the dynamic and stage-specific nature of GF’s impact. In the early stages of GF development, investments—such as infrastructure projects—can be energy-intensive and subject to technological lag, temporarily increasing emissions; some firms may also accelerate high-carbon activities before policy tightening, causing short-term emission spikes. Consequently, a linear framework fails to capture GF’s complex, phased effects and lacks theoretical grounding for nonlinear mechanisms. Moreover, many studies depend solely on traditional panel models and neglect GF’s spatial spillovers on neighboring regions—a critical omission, since areas with higher GF levels may influence adjacent regions’ emissions through technology diffusion, industrial relocation, or policy demonstration, with these spillovers inherently nonlinear and contingent on interregional economic linkages and policy coordination.
To address these gaps, this study expands the literature in four ways: first, it employs nonlinear models to more accurately test and reveal an inverted-U relationship between GF and CE; second, it integrates a Spatial Durbin Model (SDM) to analyze both within- and cross-regional emission dynamics, embedding nonlinear effects to demonstrate cross-region inverted-U spillovers; third, it theoretically explicates GF’s influence through two transmission channels—energy-consumption structure adjustment and technological innovation—and systematically examines their roles in the GF–CE nexus; finally, it introduces the concept of “greenwashing” as a potential cause of muted early-stage emission reductions and tests this hypothesis using a difference-in-differences (DID) approach.
2.2 Research hypotheses
Different scholars have observed that the impact of green finance (GF) on carbon emissions (CE) varies across development stages (Liu et al., 2015). Although GF is widely believed to reduce emissions by driving technological innovation and optimizing industrial structure (Huang et al., 2021), the time required for R&D, technology adoption, and structural adjustment means that GF’s carbon-reduction effects may be muted in the early phase. According to the Environmental Kuznets Curve (EKC) theory, GF’s initial development can lead to a short-term rise in emissions due to the inertia of high-carbon industries and lagged technology transitions. In particular, during GF policy rollout, some market participants may increase investment in non-green projects to maximize short-term output before policies are fully refined, temporarily boosting emissions.
Moreover, GF policies channel funds toward green projects, but this capital flow does not always translate directly into lower emissions. Under constrained GF development, firms may face liquidity shortages and divert funds from core operations or R&D toward high-carbon activities, thereby exacerbating emissions and giving rise to “greenwashing” (Flammer, 2021; Wu and Ren, 2023). This phenomenon indicates that although firms access more capital through GF, short-term profit motives can limit their genuine environmental contributions.
Path-dependence theory suggests that GF development is constrained not only by existing market mechanisms and technological capabilities but also by historical trajectories. In the early stages, firms’ green transition may be hindered by underdeveloped institutional frameworks and inadequate information disclosure. As GF quality improves and market mechanisms mature, enhanced transparency can curb greenwashing and further incentivize investment in green technologies and energy efficiency. With expanded GF capital and refined policies, firms will gain greater access to green financing, effectively promoting technological advancement, improving energy efficiency, and reducing fossil fuel consumption. To validate the above analysis, we propose research hypothesis H1.
H1. The influence of green finance on carbon emissions demonstrates an inverted-U relationship and produces spatial spillover effects on surrounding regions.
Most enterprises, in pursuit of maximizing profits, typically avoid investing substantial funds in green technology research and development, leading to a majority of funds seeking short-term profits while generating negative externalities. Green finance can alter this status quo, as it fundamentally provides financial services for environmentally friendly green projects, thereby bringing financial support to the development of green technologies. With the introduction of GF policies, green credit can not only provide credit support to environmental enterprises but also compel polluting enterprises to transition to greener operations through punitive interest rates and credit limit restrictions. Additionally, the growth of green securities and green funds can broaden corporate financing channels and optimize debt structures through equity financing, providing more exogenous financing for corporate research and development investments, while also diversifying risk among numerous investors, reducing the risk borne by individual investors. The advancement of green finance can propel progress in green technology, leading to reductions in energy consumption and CE. Consequently, GF plays a pivotal role in curbing CE through technological advancements. Green credit facilitates the mitigation of pollution emissions by incentivizing environmental upgrades and technological enhancements (Jiang et al., 2020). Regional green technological innovation has been actively fostered by green finance initiatives (Zhao, 2021), with green technological innovation being a fundamental factor influencing carbon emissions (Wang and Zhang, 2021). Kumar and Francisco (2007) contend that green finance policies can effectively achieve CE reduction targets through the adoption of innovative low-carbon technologies. The promotion of green technology through green finance leads to significant environmental benefits by driving advancements in sustainable practices (Xie, 2021). This leads to the proposal of research hypothesis H2.
H2. Green finance curbs carbon emissions through the technology advancement mechanism.
China’s traditional energy consumption has primarily relied on fossil fuels such as coal. Green finance, while encouraging corporate transformation, has also altered the traditional energy consumption structure, reducing fossil fuel consumption and increasing the utilization of renewable energy. A transition from traditional energy sources to renewable energy systems—including solar, wind, photovoltaic, and hydropower generation—represents a strategic shift toward environmentally sustainable development (Bekun et al., 2024). These renewable energy technologies generally exhibit significantly lower environmental impacts compared to conventional fossil fuel-based energy production, primarily by reducing greenhouse gas emissions, mitigating air pollution, and minimizing land-use degradation associated with resource extraction and combustion processes (Liu et al., 2023). With the improvement of carbon finance markets such as carbon trading and carbon taxes, a substantial amount of carbon dioxide emissions caused by enterprises will be internalized as their costs. This, in turn, raises the cost of using fossil fuels and can, to some extent, reduce corporate reliance on fossil fuels. GF has a “crowding-out effect” on highly polluting and energy-intensive enterprises. Environmental pollution leads to higher financing costs for these enterprises, thus compelling them to accelerate the adoption of green technologies, improve their energy consumption structure (Liu and Ren, 2019) and subsequently reduce carbon emissions. Furthermore, green finance serves a fund-oriented function by promoting the growth of the green industry, providing low-cost credit funds to green industries, increasing the application of clean energy, optimizing energy consumption structures, and reaching emission reductions (Chen et al., 2018). The optimization of energy consumption structures can effectively promote carbon emissions reductions (Mudakkar et al., 2013). Feng and Xing (2018) reveal that under the guidance of green credit policies, consumers are likely to further increase their demand for new energy sources, thus tuning the consumption structure of energy. Therefore, research hypothesis H3 is proposed.
H3. Green finance reduces carbon emissions by influencing the structure of energy utilization.
The transmission mechanism of the impact of green finance on carbon emissions is shown in Figure 2.
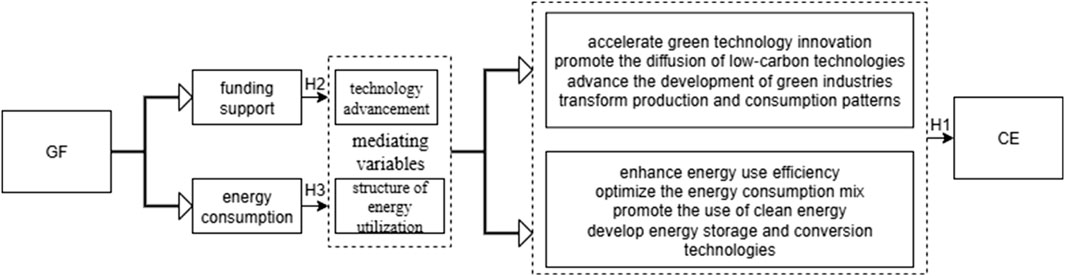
Figure 2. Mechanism framework.
3 Model construction
3.1 Model specification
3.1.1 Baseline regression model
Taking carbon emissions (CE) as the dependent variable and green finance (GF) as the independent variable, a non-linear fixed-effects regression model is formulated as depicted in Equation 1:
Where
3.1.2 Spatial econometric model
Although green finance is a nascent financial model, its growth, akin to traditional finance, is influenced by economic and geographical factors, leading to spatial disparities and agglomeration features. “Everything is interconnected, but objects in close proximity exhibit stronger relationships than those farther apart”. The principle suggests that regions in close proximity exhibit stronger correlations in their development. The exchange of various production factors between regions, driven by the development of GF, results in spatial spillover effects on the impact between GF and CE.
During the progress of GF, the transmission of incentives through green policies leads to the concentration of production factors in central regions, fostering collaboration in areas such as funding, labor, talent, and other aspects related to green policies. The clustering of green industries fosters specialization and collaboration among upstream and downstream sectors as well as neighboring regions, leading to a decrease in CE through technological advancements and industrial transformations. Industrial agglomeration forms the basis for the spatial spillover effects of GF. As industries cluster to a certain scale, internal competition reduces profit margins for related enterprises, prompting the shift and diffusion of green finance-related industries and resources to surrounding areas. This flow of production factors to adjacent regions facilitates the development of GF in those areas. Furthermore, GF policies demonstrate leadership and serve as examples for neighboring regions. Advanced regions in GF can lead and showcase technological advancements and industrial transformations to reduce carbon dioxide emissions. Therefore, spatial panel models are employed for analysis.
The spatial panel models utilized include the Spatial Durbin Model (SDM), Spatial Autoregressive Model (SAM), and Spatial Error Model (SEM). The general form of a spatial panel model is expressed as Equation 2:
In the equation provided, where
3.2 Variable selection
3.2.1 Dependent variable
The dependent variable is per capita carbon dioxide (CO2) emissions. Because of the lack of a standardized measurement method for calculating carbon dioxide emissions at the provincial level in China, we adopt the methodology introduced by Yang and Liao (2021). Our calculation of CE is derived from the consumption of different fossil fuels and carbon emission coefficients provided in the CSMAR Database. Subsequently, per capita carbon dioxide emissions are determined by dividing the total CE by the population, Using the following specific Formula 3:
Where
3.2.2 Explanatory variables
The explanatory variable is the development of GF. To comprehensively assess the development of GF in different areas of China, this study utilizes five indicators from four categories of GF: green credit, green securities, green insurance, and green investment. Due to the absence of standardized data on the official balance of green credit at the provincial level, this research employs the proportion of interest expenses of high-energy-consuming industries as a proxy for green credit evaluation (Here, “high-energy-consuming industries” are defined as the six major energy-intensive sectors in each province—namely, (1) non-ferrous metal smelting and rolling, (2) petroleum processing, coking, and nuclear fuel processing, (3) chemical raw materials and chemical products manufacturing, (4) ferrous metal smelting and rolling, (5) non-metallic mineral products, and (6) electric power and heat production and supply. The same definition applies throughout.). For green securities, the study uses the proportion of market value in high-energy-consuming industries across various provinces and cities. As for green insurance, given the limited availability of data on environmental pollution liability insurance, the depth of agricultural insurance, a sector highly influenced by the natural environment, is used as a substitute indicator for green insurance evaluation, measured by the ratio of agricultural insurance income to total agricultural output value. Regarding green investment measurement, existing literature indicates that environmental protection investments are predominantly government-funded. Therefore, this study adopts the ratios of investment of pollution treatment to GDP and environmental protection expenditure to general budget expenditure as indicators for assessing green investment (Yuyan et al., 2023). See Table 1 for details.

Table 1. Measurement indicators for green finance development level.
To reduce bias introduced by human factors, the entropy method is used for evaluation, and the formula is as follows:
In the first step, the five indicators measuring GF are standardized.
For positively oriented indicators, as shown in Formula 4.
For negatively oriented indicators, as shown in Formula 5.
The second step is to calculate the weights for the indicators, as shown in Formula 6.
The third step involves calculating the entropy value for the j-th indicator, where k = 1/ln (nm), and when p_jk = 0, it is considered as
The fourth step entails computing the objective weights as shown in Formula 8.
The fifth step involves calculating the specific comprehensive Green Finance Index (GFI) as shown in Formula 9.
Due to space limitations, this section only presents the calculated GFI for 30 Chinese provinces in 2019 using the entropy method, as presented in Table 2. The entropy-based weights are detailed in Table 3.
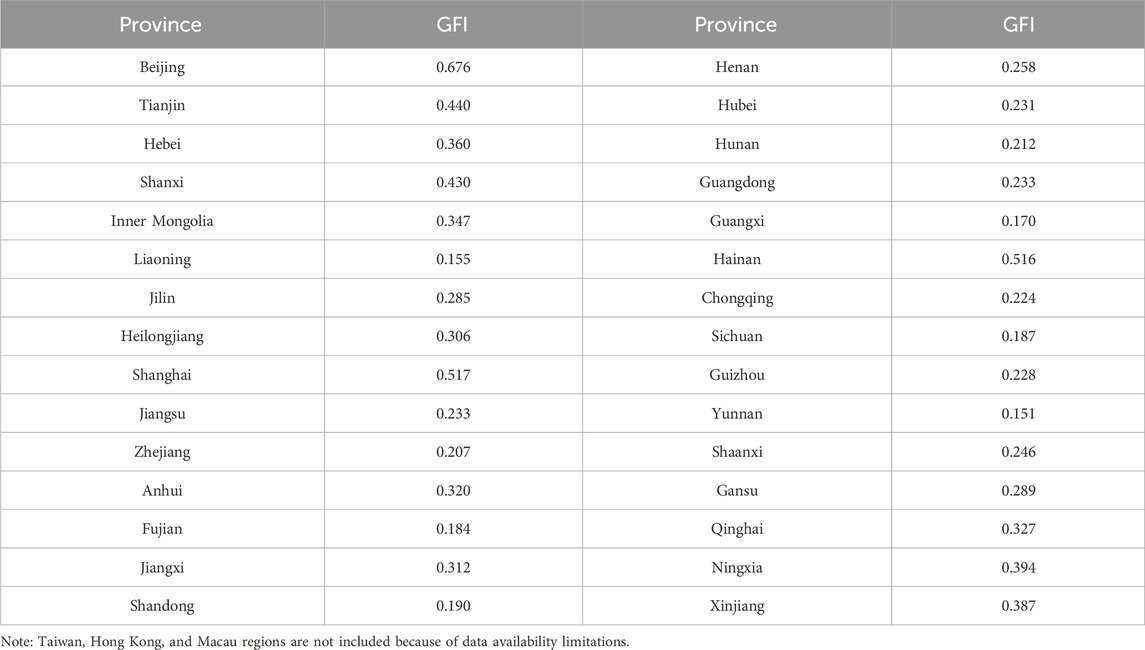
Table 2. Green finance index for 30 Chinese provinces in 2019.
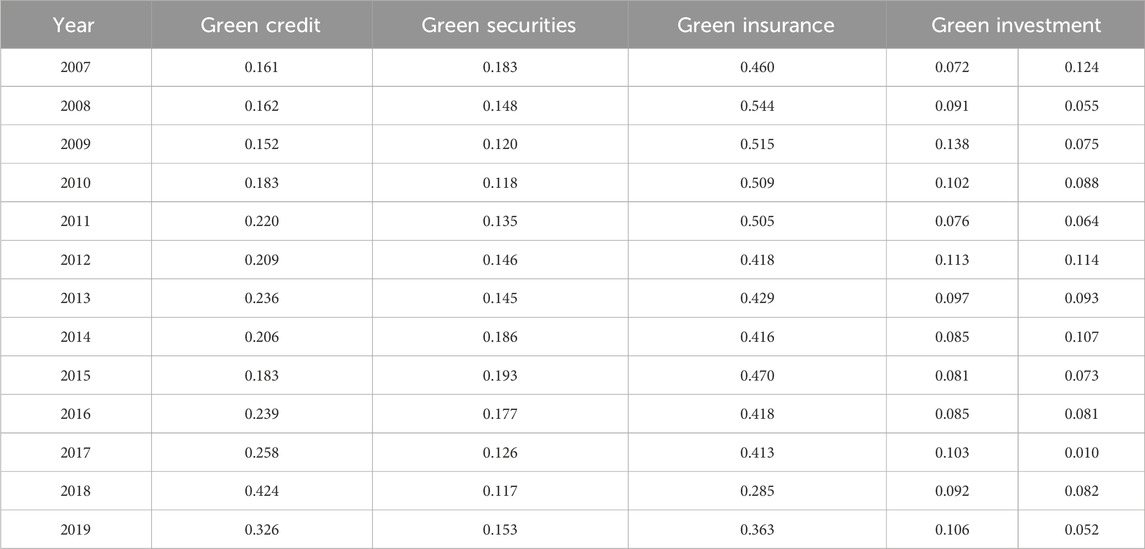
Table 3. Weights of the green finance index.
3.2.3 Control variables
Drawing from pertinent literature on factors that influence CE, the subsequent indicators have been chosen as control variables:
(1) Macroeconomic level: GDP is a key indicator for measuring macroeconomic performance and has a substantial impact on CE. CE primarily result from the consumption of energy in production and daily life, making GDP one of the important influencing factors. Following the approach used by Yang and Liao (2021), we use the logarithm of per capita GDP (lnGDP) to represent this variable.
(2) Population density: An increase in population inevitably results in higher energy consumption. Higher population density increases resource and environmental pressure and can harm ecosystems. Drawing from the research of Zhou and Lin (2019), Gao and Shen (2022), we use the logarithm of population density per square kilometer (lnpopu) as a measure.
(3) Private car ownership: As a pillar industry driving China’s economic development, the automotive sector consumes a significant share of fuel and electricity. Characterized by its extensive supply chain and high energy intensity, this comprehensive manufacturing industry faces substantial carbon challenges throughout its lifecycle (Zhao et al., 2022). Specifically, raw material production and vehicle operation account for 41.82% and 39.49% of total lifecycle emissions, respectively (Long and Changqing, 2024). Consequently, the scale and penetration rate of automobiles are closely linked to carbon emissions. This variable is represented by the number of private cars per 100 people.
(4) Degree of openness to foreign investment: CE can be influenced by high levels of openness to foreign investment, which results in both positive and negative impacts. On one hand, the sector may catalyze green technological innovation through spillover and competitive effects. The adoption of advanced energy-efficient technologies by automotive firms can enhance productivity, enable cleaner production processes, and ultimately reduce CE in host economies. On the other hand, it risks attracting carbon-intensive industries relocated from developed countries, potentially increasing local CE and environmental pollution (Wu and han, 2023). Following the practices of Yang and Liao (2021) and Zhang and Sun (2022), we use the ratio of foreign direct investment to regional GDP as a measure.
3.3 Data sources and variable descriptions
In 2007, China first introduced the concept of “ecological civilization construction,” marking the launch of green finance initiatives. An (2008) is regarded as the starting point of China’s green finance development, this study likewise begins its sample in that year. However, due to data availability constraints, 2019 was chosen as the end year to ensure the completeness of the empirical analysis. The data span this period captures the full evolution of China’s green finance policies—from their initial rollout to progressive deepening. Although the early establishment of these policies and the gradual improvement of relevant mechanisms have laid the groundwork for future policy advances, their full effects continue to unfold. Consequently, the conclusions drawn here remain highly relevant. It should be noted that green finance’s impact on carbon emissions exhibits substantial lag effects. While the 2007–2019 data reflect the policies’ influence during their early phase, many policy measures and market mechanisms may require a longer horizon to materialize completely. Therefore, the findings based on this period can offer valuable guidance for current and future green finance policies, particularly in fostering long-term carbon-reduction mechanisms. The data on green credit are obtained from the “China Industrial Statistics Yearbook” and “Economic Census Bulletin,” while data on agricultural insurance income are sourced from the “China Insurance Yearbook.” For the year 2016, data for the Guangxi Zhuang Autonomous Region are derived from the “Guangxi Statistical Yearbook.” Data on pollution treatment investment are from the “China Environmental Statistics Yearbook,” and other data sources include the CSMAR database and the “China Statistical Yearbook.” Table 4 shows the descriptive statistics for the variables.
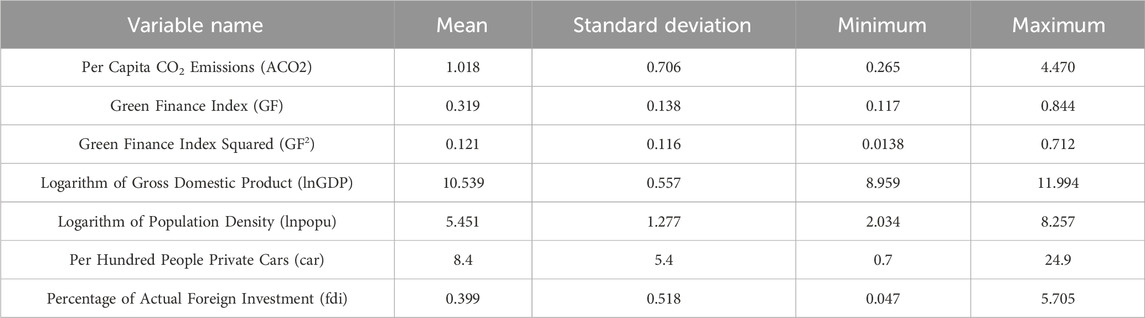
Table 4. Descriptive statistics of variables.
4 Empirical analysis
4.1 Benchmark model regression analysis
The regression results of the benchmark model are presented in Table 5. In column (1), the results are presented without the inclusion of control variables, while column (2) displays the results after incorporating control variables. Notably, irrespective of the inclusion of control variables, the first-order term of GF exhibits a meaningly positive effect at the 5% confidence level, whereas the second-order term demonstrates a greatly negative impact at the 1% confidence level. The results suggest the presence of an inverted-U non-linear relationship between GF and CE. A U-test curve analysis was conducted, resulting in a p-value of 0.0001, which, accepted at the 1% level, supports the alternative hypothesis that the curve follows an inverted “U” shape. This outcome partially validates hypothesis H1 of the study. Consequently, as the level of GF increases, its influence on CE transitions from being promotive to inhibitory. This implies that effective carbon reduction is achievable only when GF attains a certain developmental threshold. The inflection point for the impact of GF on CE is calculated to be 0.2963 based on the coefficients of the first and second-order terms of GF. Analysis of the GF levels across provinces reveals that 13 provinces reached this inflection point in their Green Finance Index (GFI) between 2007 and 2019, while the remaining provinces are yet to surpass this threshold. This suggests that, overall, China’s level of GF development is not high, highlighting the necessity for further advancement in GF. GF becomes notably effective in reducing CE once it reaches a certain threshold.
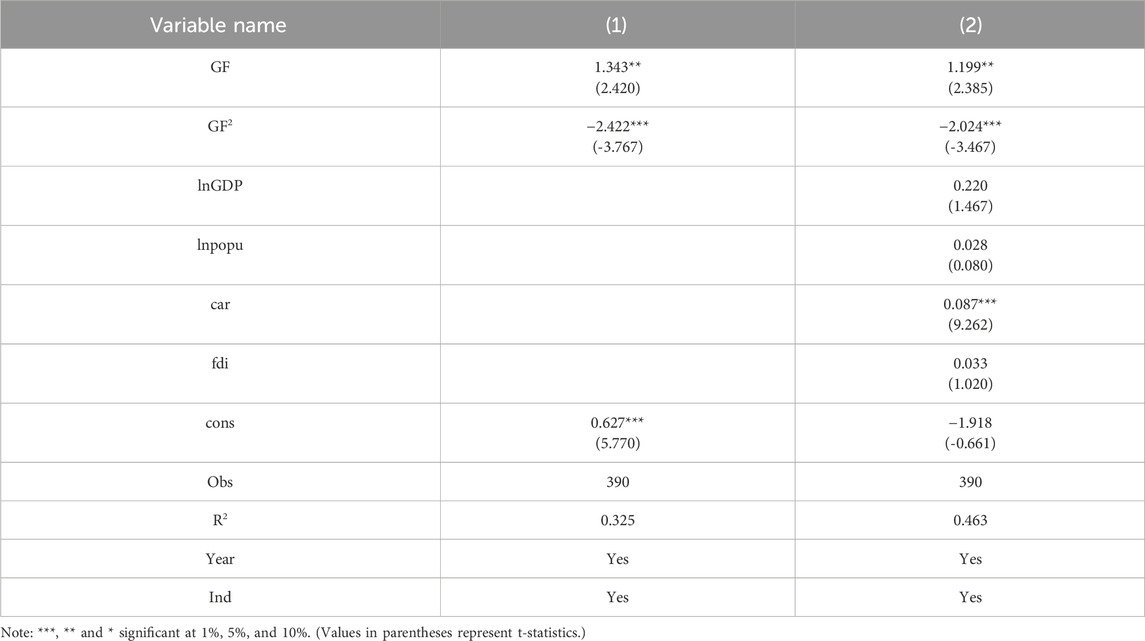
Table 5. Benchmark regression results.
The results indicate a significant positive correlation between private car ownership rates and carbon emissions (CE) at the 1% confidence level, suggesting that higher per capita car ownership is associated with increased CE levels. Given the currently low clean energy utilization rates in private vehicles, expanded automobile production and usage exacerbate CE levels, aligning with conventional wisdom. This underscores the necessity to enhance clean energy adoption rates and promote public transportation systems as effective mitigation strategies. The insignificant regression results for GDP, population density, and FDI on CE may be attributed to multiple factors. As China’s economic growth model transitions, the correlation between GDP aggregate and carbon emissions has weakened significantly; with industrial relocation to central and western regions and advancements in automation and AI, population density’s impact on industrial development—and consequently on carbon emissions—has diminished; meanwhile, increased low-carbon technologies have enabled FDI in China to promote carbon reduction through technology transfer but may also introduce environmentally unfriendly low-end industries, leading to an overall insignificant effect on CE. Furthermore, traditional dual-fixed panel models exhibit methodological limitations, necessitating the construction of spatial econometric models for further analysis.
Given the regional heterogeneity in per capita carbon emissions (CE), we additionally constructed local Moran’s I scatter plots to visualize spatial association patterns. Due to space limitations, we present 2019 as a representative year (Figure 3). The spatial clustering pattern observed in 2019 indicates that most provincial-level CE values are located in the first and third quadrants of the local Moran’s I scatter plot—regions exhibiting positive spatial autocorrelation. Both the global Moran’s I index and the local Moran’s I scatter plot confirm significant spatial self-correlation in per capita CE distribution, satisfying the fundamental requirements for spatial econometric modeling.
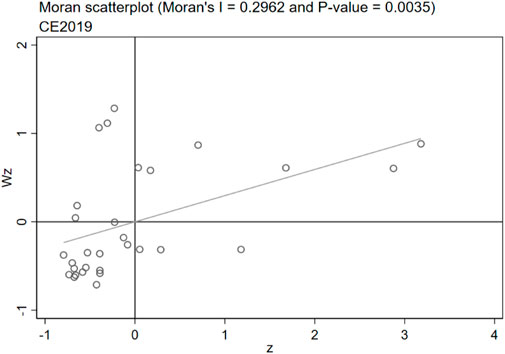
Figure 3. Moran’s index in 2019.
4.2 Spatial econometric model regression analysis
4.2.1 Spatial autocorrelation test
A spatial autocorrelation test was conducted on the per capita CE for the 30 Chinese provinces from 2007 to 2019, as presented in Table 6.
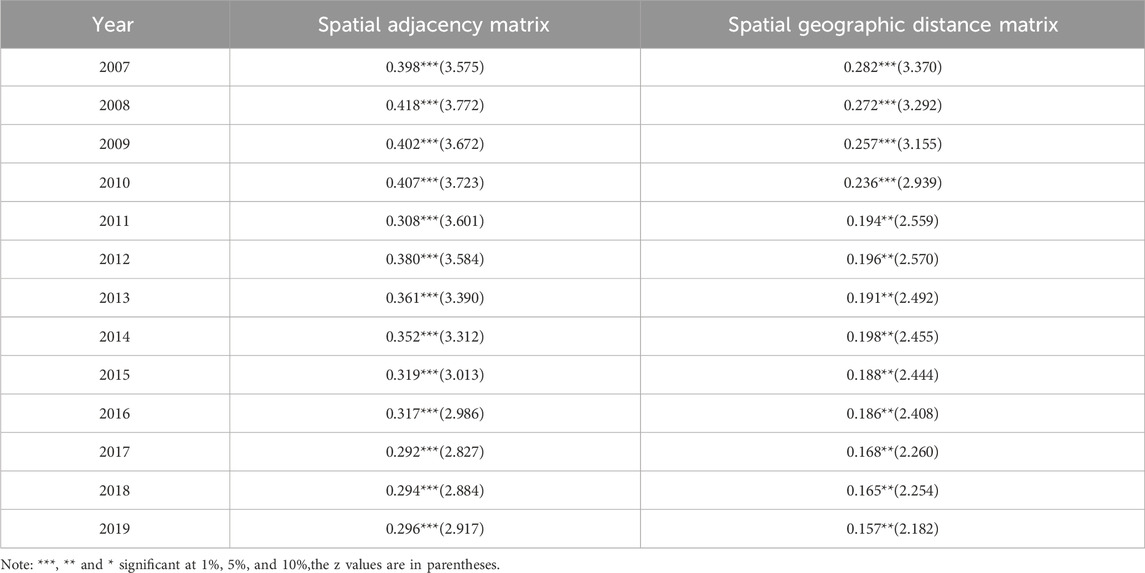
Table 6. Moran’s I statistics.
Analysis of Table 5 reveals that the Global Moran’s I values for per capita CE in Chinese provinces or cities from 2007 to 2019 are all greater than 0 and significant at the 1% and 5% levels. In terms of the overall trend, both weight matrices (Queen and Rook) exhibited a slight fluctuation followed by a decreasing trend in Global Moran’s I values.
4.2.2 Testing and identification of spatial econometric models
The Lagrange Multiplier (LM) Test and Robust LM Test results indicate the presence of spatial autocorrelation. Consequently, it is essential to establish spatial econometric models, including the SDM, SAR, and SEM. After conducting the Likelihood Ratio (LR) test and Wald test, considering the practical situation, the SDM is selected. The relevant test results are shown in Table 7.
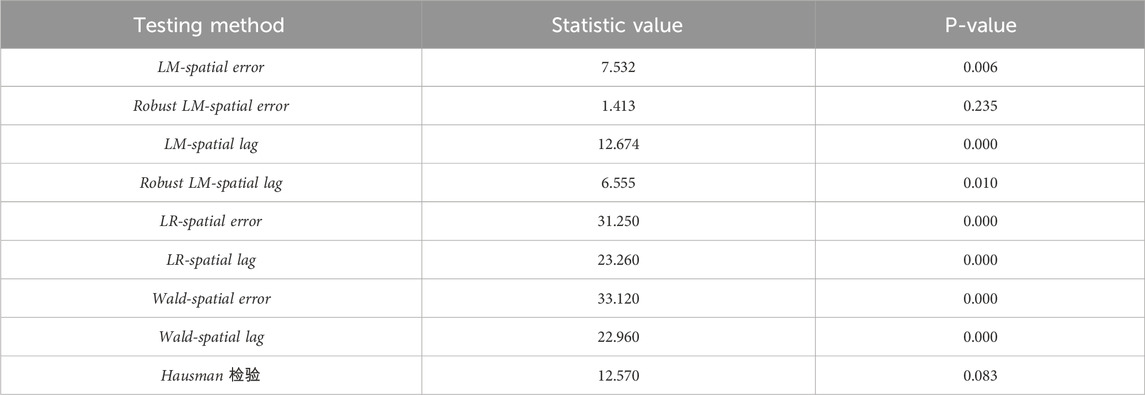
Table 7. Spatial econometric model related tests.
Moreover, based on theHausman test, the chi-squared statistic is meaningfully at the 10% level, indicating the suitability of the fixed effects model. Subsequently, a decision must bemade among three models: time-fixed effects, regional-fixed effects, and time-regional fixed effects. Consistent with the methodology of Dong et al. (2022), model selection criteria include minimizing the AIC and BIC values, assessing the R2 value, and evaluating the significance of key coefficients. Ultimately, the SDM incorporating both time and regional fixed effects is selected as the spatial econometric model for analysis. Detailed regression results are provided in Table 8.
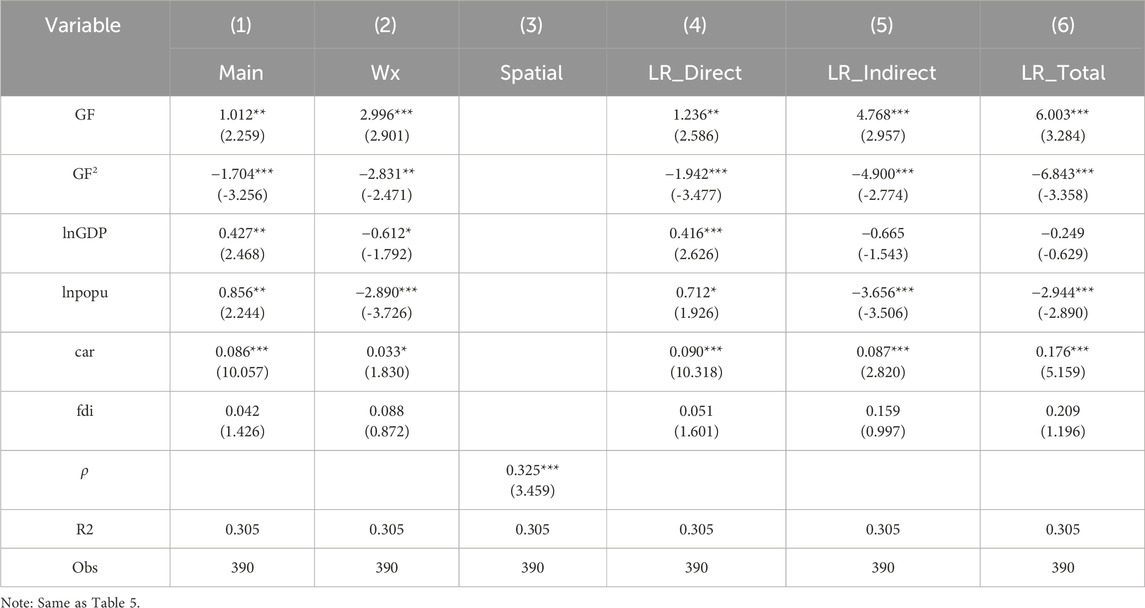
Table 8. Spatial durbin model regression results.
4.2.3 Empirical results and analysis of spatial econometric models
Based on the findings shown in Table 8, we can observe that the linear term of GF exhibits a significant positive effect, while the quadratic term shows a significant negative impact, both at the 1% level. The results confirm the presence of inverted U-shaped relationships in both within-region and neighboring areas, providing additional support for hypothesis H1. The rationale behind this relationship can be elucidated as follows: In the initial stages of GF development, challenges such as incomplete regulatory frameworks, lack of institutional support, and information asymmetry may hinder efficient allocation of GF resources and impede its role in guiding societal entities towards green transformation. Green projects often entail substantial initial capital investments with extended payback periods, potentially leading to an initial rise in CE due to increased investment. Moreover, the effects of GF policies may exhibit a time lag. As the level of GF development surpasses the turning point of the inverted U curve, the positive impacts of enhanced technological advancements facilitated by GF development gradually emerge, resulting in a decline in CE.
Furthermore, in the SDM, the spatial autoregressive coefficient is greatly positive at the 1% level. This signifies a positive spatial correlation effect among per capita CE across different regions, highlighting the substantial influence of spatial factors on CE. This could be attributed to the fact that CE in a region are influenced by various factors, such as technological levels, talent exchange, and financial interactions, which are objective and often influenced by neighboring regions. Therefore, the CE of one region can have a positive correlation with those of its neighboring regions.
Following Lesage and Kelley (2009), we conduct partial differentiation on the SDM to dissect the spatial effects into direct and indirect components (refer to Table 8). The direct effect signifies the influence of GF on local per capita CE, while the indirect effect denotes the impact of GF on per capita CE in neighboring regions. The total effect encompasses the cumulative impact of both components.
Table 8 illustrates a spatial spillover effect of GF on per capita CE in surrounding regions, characterized by a nonlinear influence that further corroborates hypothesis H1. One plausible explanation is that during the initial phases of GF development, green principles may initially converge from surrounding regions to the central area. However, as this concentration reaches a critical mass, internal competition drives related enterprises to seek cost efficiencies by relocating to neighboring regions, subsequently exerting an inhibitory effect on per capita CE in these areas during the later stages of GF evolution. Another potential rationale is that GF policies have showcased and guided neighboring regions in GF advancement through learning and collaboration, thereby eliciting a nonlinear impact on per capita CE in these vicinities.
Moreover, the calculated inflection point for the spatial spillover effect of GF is determined to be 0.2971, closely aligning with the inflection point derived from the baseline regression. Regarding the effects of control variables decomposition, the direct impact of per capita GDP is meaningfully positive, while the indirect effect is nonsignificant. This implies that local economic growth partly mirrors the demand in the area, leading to heightened energy consumption and CE. Conversely, the direct effect of population density is notably positive, while the indirect effect of population density is markedly negative, indicating that higher population density correlates with increased CE. Furthermore, the direct effect of private car ownership is meaningfully positive, with both indirect and total effects also exhibiting significance. This suggests that an upsurge in private car ownership contributes to elevated CE in the region, exerting a substantial influence on both local and neighboring regions. The insignificant overall effects of FDI may stem from its dual pathways: while foreign direct investment (FDI) can potentially mitigate carbon emissions through technology transfer, it might simultaneously exacerbate environmental pressures by relocating high-carbon industries. This dual mechanism—acting as both a promoter and inhibitor of CE—contributes to the lack of statistical significance in the empirical results.
4.3 Robustness checks
4.3.1 Replacement of spatial weight matrices
The selected spatial econometric models have inherent limitations, particularly in their high sensitivity to the construction of spatial weight matrices. These matrices exert substantial impacts on modeling outcomes, as they define the spatial relationships assumed in the analysis. Spatial weight matrices significantly influence the outcomes of these models. To ensure the robustness of the regression results, we will perform the regression analysis utilizing a spatial adjacency weight matrix. The results are outlined in Table 9, Column (1). The coefficients of the linear and quadratic terms of GF in this alternative model exhibit a similar direction and confidence level as in the previous analysis, reinforcing the conclusion that GF has a nonlinear, inverted U impact on CE. Additionally, it continues to demonstrate spatial spillover effects on CE in surrounding regions, further supporting the conclusions drawn from the previous analysis using the spatial geographical distance matrix.
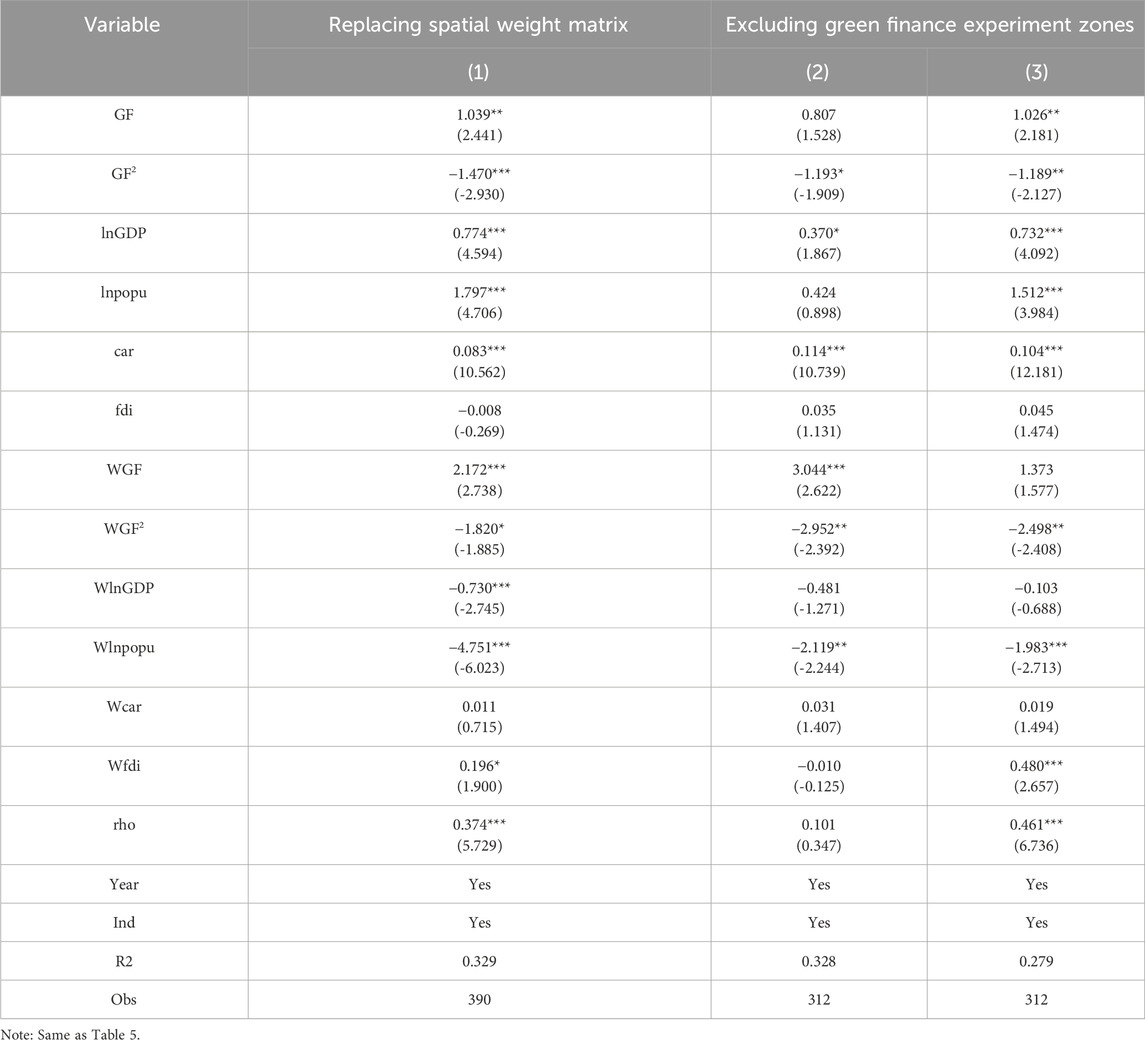
Table 9. Regression results for robustness checks.
4.3.2 Mitigating the impact of outliers
To further enhance the robustness of our analysis, we perform robustness checks by excluding outliers. Up to 2019, the State Council had established GFPZs in six provinces and nine regions. These regions experienced significant advancements in GF. To reduce the potential impact of outliers on our empirical findings, we will re-run the regressions after excluding the six provinces (Xinjiang, Guizhou, Gansu, Jiangxi, Zhejiang, and Guangdong) where the GFPZs were located. The results of this analysis are outlined in Table 9. Columns (2) and (3) display the regression outcomes utilizing the spatial geographical distance matrix and spatial adjacency matrix, respectively, on the subset excluding the pilot zones. The results reveal that the key variables, such as GF, demonstrate similar regression outcomes as in the previous analysis, thereby reinforcing the robustness of our earlier findings.
4.4 Heterogeneity test
To examine regional disparities in the influence of GF on CE, we conducted a subgroup analysis by categorizing provinces into Eastern China and Central/Western China. The outcomes, detailed in Table 10, indicate variations in how GF affects CE across these regions. In Eastern China, we find a significant direct effect between both variables at the 5% confidence level, suggesting a notable reduction in CE within the region. However, the indirect effect (spillover effect) on surrounding areas is not statistically significant, indicating a limited influence in nearby areas. In contrast, Central and Western China shows both direct and indirect effects with respectively at the 1% and 5% level. These outcomes highlight a substantial impact of GF on reducing CE within Central/Western China, along with significant spillover effects on neighboring areas. The impact of GF on CE varies by region, with a more pronounced effect in Central/Western China compared to Eastern China. This finding is consistent with Liu et al. (2022) research, which observes that GF development significantly reduced CE in China’s central region, while its carbon-reduction impact remained statistically insignificant in the eastern region.
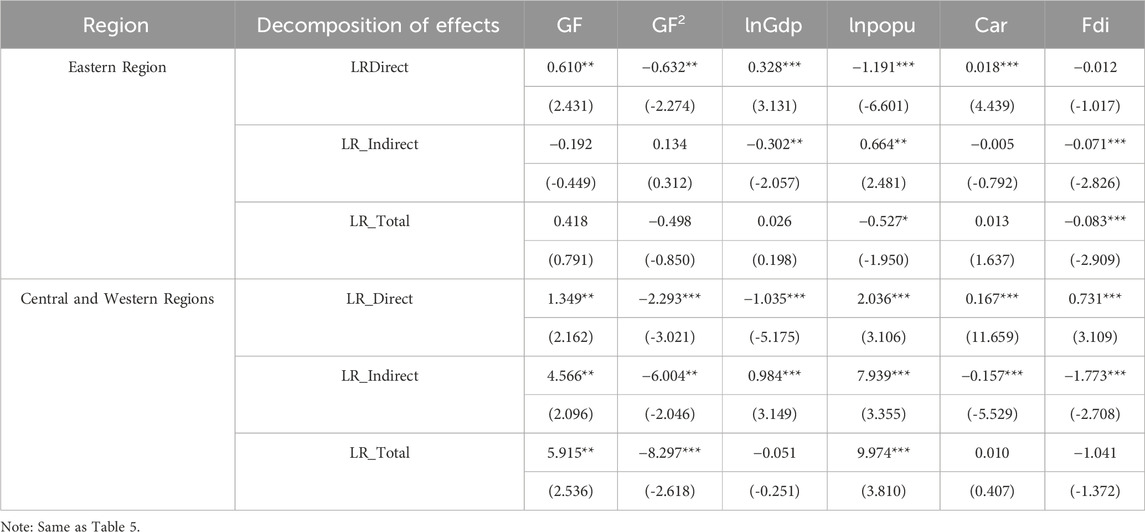
Table 10. The impact of green finance on carbon emissions in different regions.
The observed regional disparities in GF’s impact on CE levels can be attributed to differences in regional development stages, industrial structures, and policy implementation gradients. Eastern China, located on the right side of the inverted U-shaped curve, exhibits significant direct effects of GF on CE levels due to mature industrial infrastructure and economic activity clusters. Provinces in the eastern region, characterized by late-stage industrialization, benefit from dual driving mechanisms: well-developed factor markets and concentrated industrial capital. Coastal provinces implement “birdcage replacement” policies to relocate energy-intensive industries to central/western regions, focusing GF on low-carbon retrofitting of existing industries. Local industrial structures shift toward low-carbon and service sectors through enhanced environmental regulations and financial tool innovations, driving enterprise production toward low-emission trajectories. This policy framework features strong institutional constraints, with “vertical environmental governance” systems and grid-based monitoring networks establishing end-to-end regulatory chains that internalize environmental costs to critical thresholds. Limited technology spillover paths and “hollowing-out effects” from factor agglomeration weaken GF’s radiative capacity, resulting in insignificant spatial spillover effects on neighboring regions.
In contrast, western provinces are in mid-stage industrialization, shaped by unique policy windows and industrial relocation patterns. Industrially, central/western regions act as value-chain recipients from eastern provinces, maintaining high shares of traditional industries. GF policies achieve “forced coupling” between technological upgrades and emission reductions through technology-bundled credit instruments (e.g., environmental equipment upgrade loans). At the policy implementation level, “ecological compensation pilot zones” and “green finance innovation test beds” generate institutional dividends. Central cities promote clean energy transitions in energy-intensive industries through standardized green technology outputs. Market saturation drives green capital and technology diffusion along industrial chains to county-level economies, creating coordinated emission reduction effects through rural energy optimization and micro-enterprise green transformation. This “diffusion effect” amplifies GF’s spatial spillover capacity, while government-led resource allocation policies further strengthen regional radiation capacity of green development initiatives.
4.5 Mechanism examination
To explore the mechanisms by which green finance (GF) impacts carbon emissions (CE), we conduct a mechanism examination. Following the methodology of Zhang et al. (2015), we utilize the mediation effect method to assess the role of the transmission mechanism in the impact of GF on CE. Specifically, we analyze two mechanisms: technological advancement (Tech) and energy consumption structure (ES), with the model structured as shown in Formulas 1, 10.
In this model, Pi,t represents the mediating variables, with technological advancement and energy consumption structure selected as these variables. Specifically, Tech is indicated by the ratio of technology market turnover to regional GDP; a higher value signifies a higher level of technology. The ES refers to the ratio of coal consumption to total energy consumption, where a higher proportion signifies a higher reliance on fossil fuels.
Model (10) is employed to validate the quadratic correlation among GF, technological progress, and energy consumption structure. Meanwhile, Model (11) is used to examine the mediating role of technological advancement and energy consumption structure in the influence of GF on CE. By comparing these results with regression outcomes that do not consider mediating variables, we can confirm the mechanistic significance of these mediators. The estimated outcomes of the mediation effect model are displayed in Table 11.
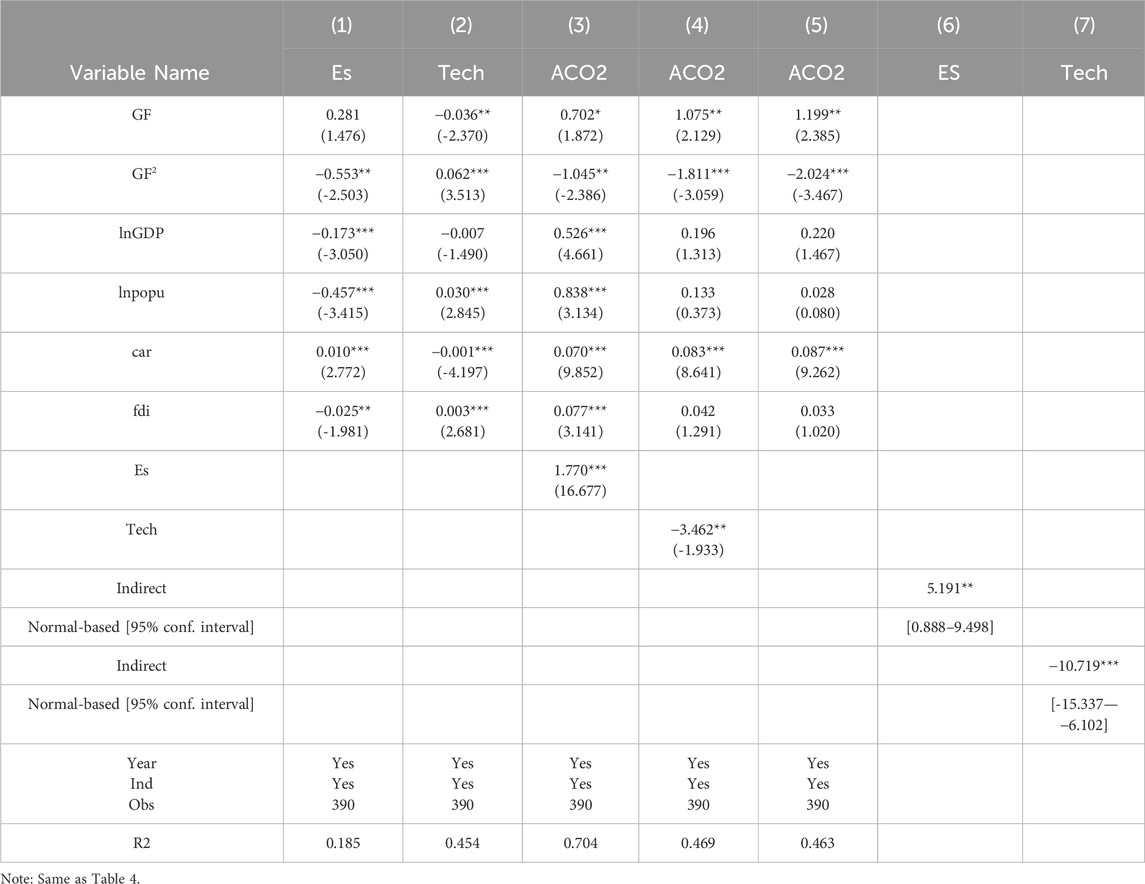
Table 11. Results of the mechanism examination.
The analysis of Table 11 reveals important findings. Column (1) reveals a significantly negative regression coefficient between the ES and the squared term of GF, suggesting an inverted-U relationship between these variables. In Column (2), a U-shaped relationship between GF and technological advancement is illustrated. Moving on to columns (3) to (5), it becomes apparent that technological advancement has a significantly negative regression coefficient, implying an inverted-U mediating effect in the relationship between GF and CE. Conversely, the regression coefficient for energy consumption structure is notably positive, suggesting an inverted-U mediating role in the impact of GF. Additionally, column (5) presents the results of the dual fixed-effects model without mediating variables. A comparison between columns (3) and (4) with column (5) shows a significant regression coefficient of CE on the square term of GF, albeit with a reduced absolute value. The mediation analysis was conducted using a non-parametric bootstrap method with 1,000 resamples. The results indicate As shown in columns (6) and (7) that the indirect effect of the first mediation path is 5.191, which is statistically significant at the 5% level (95% CI [0.888, 9.498], excluding zero). In contrast, the indirect effect of the second mediation path is −10.719, which is significant at the 1% level (95% CI [−15.337, −6.102], excluding zero). These findings suggest that GF exerts a significant indirect effect on CE through these two mediating variables. This indicate mediating effect of both mechanisms, reinforcing the inverted-U relationship between both variables. Consequently, Hypotheses 2 and 3 of this study find support.
The mediating function of technological advancement implies that during the initial phases of GF evolution, the targeted allocation of green funds drives enterprises to engage in energy-saving and environmental protection initiatives. Nevertheless, during this period, limited progress in green finance development led to technological advancements focused on marginal efficiency improvements. Consequently, overall productivity growth slowed down or even declined, creating financial strain during production processes and tightening corporate financial conditions. This situation intensifies the burden on enterprises, affects their R&D investment in other aspects, and hinders technological research and development. Secondly, due to the immature related systems at the onset of GF, including an underdeveloped information disclosure system, there are instances of ‘greenwashing,’ which also negatively impact the development of green technologies. Furthermore, investment projects supported by GF are characterized by long recovery periods and the lack of evident short-term benefits, so they struggle to exert influence during the early stages of development. As GF advances beyond the inflection point, the scope of green funds expands continuously, bolstering the institutional framework of GF. This growth enables more capital to be channeled into eco-friendly projects, encouraging enterprises to elevate their technological capabilities continually. Technological innovation has shifted from sector-specific breakthroughs to systematic upgrading. Clean energy technologies—including photovoltaics, energy storage, and others—have achieved large-scale deployment. Synergistic incentives between carbon trading markets and green financial instruments drive enterprises to pursue technological innovation to obtain carbon allowance premiums. During this phase, the substitution effect of technological progress significantly reduces energy intensity per unit GDP, while the upward leap in overall productivity directly suppresses carbon emissions. Concurrently, as the benefits of earlier research and development investments materialize, GF effectively mitigates CE by enhancing technological proficiency.
The mediating function of coal consumption structure highlights that during the initial phases of GF evolution, dedicated GF resources prompt enterprises to allocate these funds to green initiatives, diverting investments from other sectors. In scenarios where other variables remain constant, enterprises, driven by short-term profit maximization, may intensify energy usage, resulting in heightened CE (Zhang et al., 2021). Policies promoting energy efficiency upgrades through standards and green bonds aim to incentivize corporate energy-saving transformations. However, this process faces investment payback period mismatches: firms may need to borrow to purchase or produce high-efficiency equipment, temporarily increasing energy inputs to offset retrofitting costs. Simultaneously, regional economic progress necessitates increased energy consumption. In situations where green industries lack economies of scale and economic transition progresses slowly, the increase in CE due to escalated energy consumption surpasses the carbon reduction effect of GF, resulting in a sudden surge. Furthermore, high-energy-intensive industries remain dominant due to employment and tax considerations, while GF prioritizes “incremental” improvements over radical transformations, risking greenwashing. This phenomenon may temporarily raise traditional energy consumption shares, driving CE growth alongside expanding energy consumption totals. Conversely, the ongoing expansion of GF leads to better management of enterprise expenditures and substantial technological advancements that greatly improve energy utilization efficiency. When GF policy shifts from “end-of-pipe” controls to “source control,” renewable energy capacity surpasses critical thresholds, substantially displacing traditional energy demand. As economic growth gradually decouples from energy consumption growth, the increased share of clean energy directly reduces carbon intensity per unit of energy output. Coastal eastern regions achieve energy consumption decoupling through industrial upgrading, whereas western provinces accelerate energy structural transitions via green financial tool innovations. This transition towards industrial ecology is gradually realized, with a surge in clean energy adoption reducing CE during production processes.
5 Further analysis
5.1 Examination of ‘greenwashing'
The phenomenon of ‘greenwashing’ notably impacts carbon reduction in the initial stage of GF development. To examine the existence of ‘greenwashing,’ a DID model is utilized. It is reasonable to assume that regions exhibiting pronounced ‘greenwashing’ would be those with substantial GF volumes prior to policy stringency. Following the enforcement of stricter GF regulations, these regions are expected to display sluggish growth or even a decline in GF. The thirty provinces are categorized into three groups based on their GF maturity levels, with ten provinces in each group. The group with the highest GF maturity is designated as the experimental group, assuming a more pronounced ‘greenwashing’ effect in these regions. As stringent GF policies are enforced, projects tainted by ‘greenwashing’ are phased out, resulting in a deceleration or reduction in GF scale in these provinces. Conversely, the group with the lowest GF maturity serves as the control group. The initiation of stringent GF policies is identified as commencing in 2017, following the issuance of the GCGFS by PBC and seven other ministries in August 2016. These guidelines elucidated the essence of GF, emphasizing that the ‘green’ aspect pertains to economic endeavors supporting environmental enhancement, climate change mitigation, and resource efficiency. Therefore, the model is constructed as shown in Formula 12
The selected dependent variable is the extent of green finance (GF) advancement. The policy variable, denoted as “policy,” signifies the enforcement of stringent GF policies from 2017 onwards. Provinces in the experimental group are assigned a value of 1 for the year 2017 and subsequent years, while other provinces receive a value of 0. Financial development level (loangdp) is selected as an explanatory variable, represented by the ratio of the increase in bank loans to GDP in each province. Control variables denoted by X include per capita GDP (pergdp) and sulfur dioxide emissions (SO2). The variables i and t denote each province and year, respectively,
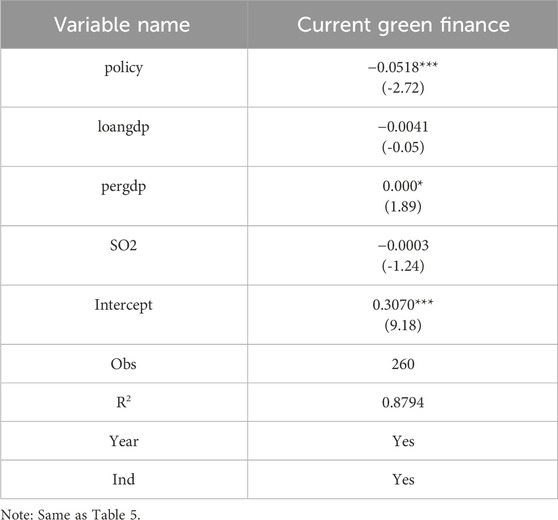
Table 12. Results of the difference-in-differences test for greenwashing.
The regression findings presented in Table 12 reveal a significantly negative coefficient for the policy variable at the 1% confidence level. This outcome suggests that the enforcement of stringent GF policies has contributed to a reduction in the magnitude of GF within the experimental group provinces. The implication is that the imposition of strict GF policies may have eliminated projects associated with “greenwashing,” although this impact could have existed prior to policy implementation. To validate this, a parallel trend analysis was conducted, with the results depicted in Figure 4. The x-axis depicts the policy timeline, while the y-axis illustrates the regression coefficient of the policy dummy variable at each time point. Prior to policy enforcement, the coefficient of the policy dummy variable fluctuated around zero, indicating no discernible disparity in GF progression between the experimental and non-experimental groups, aligning with the parallel trend assumption. Following the initiation of the policy pilot phase, a notable decline in GF development was observed, significantly deviating from zero. This shift signifies that the enforcement of stringent GF policies has resulted in a stagnation or decline in GF expansion within provinces that previously exhibited higher GF levels.
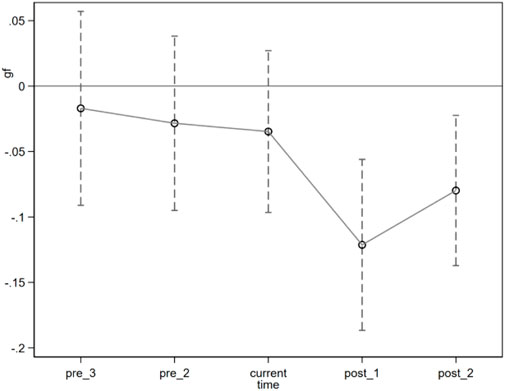
Figure 4. Parallel trends test.
The baseline regression and parallel trends analysis validate the absence of a significant disparity in GF levels between the experimental and control groups prior to the enforcement of stringent GF policies. However, following the policy pilot phase, GF within the experimental group exhibited a notable decrease compared to the control group. This divergence may be influenced by unobservable variables like alternative policies or economic cycles. To assess the incidental nature of the effects stemming from the implementation of strict GF policies, a placebo test was conducted. Figure 5 illustrates the distribution of estimated coefficients derived from 500 Monte Carlo simulations, demonstrating that the simulated regression coefficients adhere to a normal distribution with a mean proximate to zero. This observation indicates that the outcomes of the baseline regression are not a result of shifts in other unobservable factors but are directly linked to the implementation of stringent GF policies.
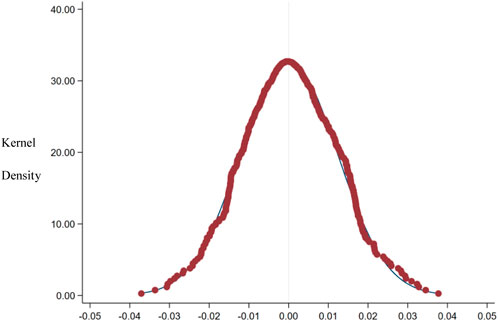
Figure 5. Placebo test.
5.2 Testing the lag effect of green finance
GF primarily caters to long-cycle green projects, implying that its influence on CE is not immediate but extends over a prolonged period. To investigate this, we introduce lag periods of one, two, and three into a nonlinear fixed-effects regression model to examine the lag effect. L1, L2, and L3 denote the lag periods. The outcomes are detailed in Table 13, where the regression analysis demonstrates that the coefficient of the quadratic term of GF with a one-period lag is −1.582, surpassing the 1% significance threshold. Similarly, the coefficients for the two-period and three-period lags are −1.286 and −1.360, respectively, both exceeding the 5% confidence level.
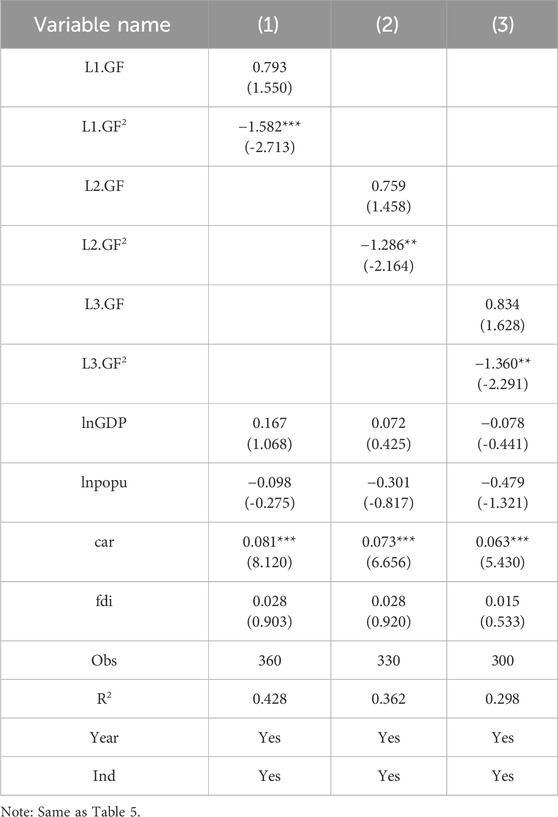
Table 13. Lag effects of green finance on CE.
In conclusion, a notable lag effect is evident in the impact of GF on CE. The consistently negative coefficients of the quadratic term of GF across one, two, and three lag periods signify a significant delayed inverted-U influence.
6 Conclusions and policy suggestions
6.1 Conclusions
To investigate the influence of green finance (GF) on carbon emissions (CE) in China and its spatial spillover effects, we selected a sample of 30 provinces in China, utilizing annual data from 2007 to 2019 and employing the spatial Durbin model (SDM). Incorporating the quadratic term of GF into the model allowed for an exploration of the nonlinear impact, enhancing the research perspective on this relationship. By integrating spatial factors into the traditional panel model, we analyzed the localized impact of GF on CE within regions and investigated the spillover effects on neighboring areas. Furthermore, to assess the varying regional impacts, we categorized regions into eastern and central-western parts, examining the effects and spatial spillovers in distinct areas. Lastly, we delved into the two transmission mechanisms through which GF influences CE: technological advancement and energy consumption structure. The study has yielded the following conclusions:
First, there exists an inverted-U nonlinear relationship between GF and CE. Initially, GF leads to an increase in CE in the short period within a region. However, over time, as GF advances and exceeds the turning point of the inverted U curve, it transitions to a role of mitigating carbon emissions. It is evident that the majority of provinces in China are situated on the left side of this turning point, indicating a lower level of GF development in China. Furthermore, there are regional disparities, highlighting substantial potential for future development.
Second, GF exhibits an inverted-U spatial spillover effect on CE in surrounding regions. In the short term, GF contributes to an increase in CE in surrounding regions. Nevertheless, in the long term, as GF progresses and surpasses the turning point of the inverted U curve, it exerts a dampening effect on the CE of surrounding areas.
Third, a comparison of the impact of GF on CE in different regions reveals distinctions between the eastern and central-western regions, particularly in terms of spatial spillover effects on neighboring areas. Regarding the direct effect, GF in both regions exhibits a inverted U-shaped impact on CE within the region. However, the indirect effect of GF in the eastern region is not significant, whereas in the central-western region, it is notable. Considering the overall effect, the eastern region shows insignificance, whereas the central-western region demonstrates a meaningful inverted U curve. This suggests that the suppressing effect of GF on CE is more pronounced in the central-western region compared to the eastern region.
Fourth, the findings of the mechanism test indicate that GF affects CE by driving technological advancements and altering the energy consumption structure. The advancement of GF results in heightened energy consumption in the initial phases of economic growth, followed by a gradual increase in the utilization of clean energy in later stages. Consequently, the energy consumption structure exhibits an inverted-U mediating effect in the influence of GF on CE. Regarding technological progress, GF initially hinders corporate R&D investment to some extent. With the advancement of GF development and the realization of outcomes from initial green projects, there is a mitigating impact on CE due to the enhancement of technological capabilities. Thus, technological progress plays a U-shaped mediating role in this impact.
Fifth, the test results concerning “greenwashing” reveal the presence of this issue during the initial phases of GF development. Furthermore, the analysis of the lag effect of GF reveals a significant delay in its influence on CE. The presence of “greenwashing” and the lag effect of GF effectively explain the inverted-U influence.
6.2 Policy suggestions
Based on our findings, we put forward the following policy recommendations:
First, Implement region-tailored, phased green finance (GF) policies. To address regional disparities in GF development, policies should be calibrated to each province’s economic stage and rolled out in phases. Establish a comprehensive early-warning system to monitor whether regions have crossed the critical threshold on the inverted-U curve—particularly those on the left (early development) side. In these provinces, introduce flexible regulatory constraints to manage carbon-intensity targets and the pace of green credit expansion, balancing environmental objectives with economic growth. Simultaneously deploy a dual-track incentive mechanism to support both technological innovation and emission reductions. In the initial phase, GF pilot zones should leverage green mortgages and carbon forward contracts to drive energy-efficiency upgrades. Once a province reaches its critical GF threshold, shift toward market-based tools—such as emissions auctions and carbon border adjustments—to strengthen market discipline over high-carbon industries. Finally, expand the number of GF demonstration zones; these areas can both replicate proven best practices and serve as testbeds for innovative GF instruments, thereby improving policy effectiveness nationwide.
Secnod, Strengthen and refine GF supervision. Adopt a systemic, precision-targeted regulatory framework to bolster GF’s integrity and impact. Develop a dynamic GF standards system—incorporating third-party verification and blockchain tracing—to ensure full transparency of capital flows. Embed a lifecycle-based assessment mechanism that clearly defines sectoral boundaries and quantifies environmental benefits, thus deterring greenwashing. Implement differentiated regional support, for example, by creating GF guidance funds and tax incentives in underdeveloped areas, and using digital-yuan platforms to expand inclusive lending. Enforce mandatory environmental disclosure rules to guarantee transparency and accountability: require firms and financial institutions to report carbon-footprint data regularly under the Task Force on Climate-related Financial Disclosures (TCFD) framework. Such measures will standardize monitoring and reporting, mitigating greenwashing risks. Link environmental credit ratings to financial product pricing to incentivize corporate shifts toward sustainability. Finally, launch “Carbon Account +” micro-enterprise services to help small businesses adopt green practices.
Third, Strengthen regional integration and cooperation. To fully unleash the potential of green finance, it is vital to establish a coordinated spatial governance framework. Since GF exerts cross-border impacts on carbon emissions, neighboring regions should prioritize mutually beneficial development. Cities hosting GF demonstration zones ought to collaborate with surrounding areas to promote industrial linkages and technology diffusion. For example, in key clusters such as the Yangtze River Delta and the Guangdong–Hong Kong–Macau Greater Bay Area, a unified green finance product certification system and a shared carbon-account information platform should be implemented. Policy design must account for regional differences: eastern provinces should prioritize market-based emission-reduction mechanisms—leveraging carbon-financial instruments to drive market innovation—whereas western provinces should focus on strengthening green finance infrastructure and adopt tiered spatial compensation policies. Specific measures might include allocating carbon-trading quotas to provinces that “export” green finance and offering targeted tax breaks to provinces that “import” green industries. International cooperation should be deepened by actively participating in global GF standards initiatives, providing cross-border tax incentives for green-bond investments, and encouraging regional alliances to support clean-energy projects—especially under the Belt and Road Initiative. Green finance must become a key driver of global sustainable development.
Fourth, Maximize GF’s role in technological advancement and energy transition. To harness GF’s dual capacity to spur innovation and drive energy transition, an integrated approach is required. Establishing a national green-technology venture fund should be a priority, providing full-lifecycle support for green technologies through concessional loans and risk-sharing mechanisms to incentivize corporate investment in green innovation. Renewable energy and energy-efficiency upgrades should receive preferential financing to reduce reliance on high-carbon energy sources. Before the structural inflection point in energy consumption arrives, priority funding should go to clean-coal utilization projects; thereafter, carbon border adjustments should accelerate the phase-out of high-carbon energy. Finally, a cross-sector collaboration mechanism should be created to facilitate cooperation among government agencies, financial institutions, and enterprises, thereby amplifying GF’s impact on optimizing the energy mix and accelerating technological progress. By aligning policy support, financing channels, and private-sector innovation, this collaborative model will generate synergies that significantly advance industrial green upgrading, technology diffusion, and overall carbon-governance efficiency.
Data availability statement
The original contributions presented in the study are included in the article/supplementary material, further inquiries can be directed to the corresponding authors.
Author contributions
YM: Conceptualization, Data curation, Investigation, Methodology, Software, Supervision, Writing – original draft, Writing – review and editing. WH: Formal Analysis, Project administration, Validation, Writing – original draft, Writing – review and editing. XC: Conceptualization, Formal Analysis, Project administration, Resources, Validation, Writing – original draft, Writing – review and editing. ZX: Formal Analysis, Project administration, Validation, Writing – original draft, Writing – review and editing.
Funding
The author(s) declare that no financial support was received for the research and/or publication of this article.
Conflict of interest
The authors declare that the research was conducted in the absence of any commercial or financial relationships that could be construed as a potential conflict of interest.
Generative AI statement
The author(s) declare that no Generative AI was used in the creation of this manuscript.
Any alternative text (alt text) provided alongside figures in this article has been generated by Frontiers with the support of artificial intelligence and reasonable efforts have been made to ensure accuracy, including review by the authors wherever possible. If you identify any issues, please contact us.
Publisher’s note
All claims expressed in this article are solely those of the authors and do not necessarily represent those of their affiliated organizations, or those of the publisher, the editors and the reviewers. Any product that may be evaluated in this article, or claim that may be made by its manufacturer, is not guaranteed or endorsed by the publisher.
References
An, W. (2008). Preliminary exploration of the connotation, mechanism, and practice of green finance. Econ. Latit. 2008 (5), 156–158. doi:10.3969/j.issn.1006-1096.2008.05.046
An, S., Li, B., Song, D., and Chen, X. (2021). Green credit financing versus trade credit financing in a supply chain with carbon emission limits. Eur. J. Operational Res. 292 (01), 125–142. doi:10.1016/j.ejor.2020.10.025
Bekun, F. V., Gizem, U., Muhammad Saeed, M., and Yadav, A. (2024). Another look at energy consumption and environmental sustainability target through the lens of the load capacity factor: accessing evidence from MINT economies. Nat. Resour. Forum, 07. doi:10.1111/1477-8947.12481
Bergman, N. (2018). Impacts of the fossil fuel divestment movement: effects on finance, policy and public discourse. Sustainability 10 (7), 2529–29. doi:10.3390/su10072529
Cao, T., Zhang, C., and Yang, X. (2021). Green credit policy's green effect and impact mechanism: evidence from Chinese listed companies' green patent data. Financ. Forum 2021 (05), 7–17. doi:10.16529/j.cnki.114613/f.2021.05.003
Chen, X., and Chen, Z. (2021). Can green finance development reduce carbon emissions? Empirical evidence from 30 Chinese provinces. Sustainability 13 (21), 12137. doi:10.3390/su132112137
Chen, Z., Gao, H., and Zhang, Z. (2018). Green finance development and optimization and upgrading of regional industrial structure: a case study of Western China. Southwest Finance 2018 (11), 70–76. Available online at: https://kns.cnki.net/kns/advsearch?dbcode=SCDB.
Chen, T., Giray, G., Koo, C. K., and Lau, C. K. M. (2020). Does international cooperation affect CO2 emissions? Evidence from OECD countries. Environ. Sci. Pollut. Res. 27 (17), 21831–21843. doi:10.1007/s11356-019-07324-y
Dong, X., Liu, J., and Wang, Y. (2022). Spatial effects of the agglomeration of rural financial institutions on farmers' consumption behavior. Quantitative Econ. Tech. Econ. Res. 39 (02), 64–83.
Du, L., and Zheng, L. (2019). Evaluation of the effectiveness of China's green finance policy system: based on pilot operation data analysis. Tsinghua Univ. J. Philosophy Soc. Sci. 34 (01), 173–182+199. doi:10.13613/j.cnki.qhdz.002821
Du, M. (2023). Causal forest treatment effects and identification of factors in green finance on carbon emission reduction. Financial Theory Pract. 2023 (01), 82–97.
Fan, D., and Zhang, X. (2022). Analysis of the effects of green finance reform and innovation on carbon emission reduction of high-emission enterprises. Front. Eng. Manag. 41 (04), 55–61. doi:10.11847/fj.41.4.55
Feng, M., and Xing, J. (2018). Research on the impact of financial development on energy Consumption——Construction and analysis of energy consumption structure change index. Price Theory Pract. 2018 (11), 107–110. doi:10.19851/j.cnki.cn11-1010/f.2018.11.028
Flammer, C. (2021). Corporate green bonds. J. Financial Econ. 142 (2), 499–516. doi:10.1016/j.jfineco.2021.01.010
Zhao, F., Liu, X., Zhang, H., and Liu, Z. (2022). Automobile industry under China’s carbon peaking and carbon neutrality goals: challenges, opportunities, and coping strategies. J. Adcanced Transp. 12. doi:10.1155/2022/5834707
Galimova, T., Ram, M., Bogdanov, D., Fasihi, M., Gulagi, A., Khalili, S., et al. (2023). Global trading of renewable electricity-based fuels and chemicals to enhance the energy transition across all sectors towards sustainability. Renew. Sustain. Energy Rev. 183, 113420. doi:10.1016/j.rser.2023.113420
Gao, Y., and Shen, Z. (2022). The role of green finance reform policy in carbon reduction. China Environ. Sci. 42 (10), 4849–4859. doi:10.19674/j.cnki.issn1000-6923.20220616.009
Han, X., Xiao, J., and Dong, M. F. (2023). The carbon emission reduction effect of green finance development. Resour. Sci. 45 (4), 843–856. doi:10.18402/resci.2023.04.13
He, W. J., Chen, H. H., and Wang, Z. (2019). Empirical study on the dynamic relationship between green finance development and carbon emissions: based on the VAR model test. J. Guizhou Normal Univ. Soc. Sci. Ed. (01), 99–108. doi:10.16614/j.gznuj.skb.2019.01.012
Huang, Y., Lian, X., and Khan, Z. (2021). What abates carbon emissions in China: examining the impact of renewable energy and green investment. Sustain. Dev. 2021, 23. doi:10.1002/sd.2177
Zahan, I., and Chuanmin, S. (2021). Towards a green economic policy framework in China: role of green investment in fostering clean energy consumption and environmental sustainability. Environ. Sci. Pollut. Res. 28 (32), 43618–43628. doi:10.1007/s11356-021-13041-2
Jawadi, F., Pondie, T. M., and Cheffou, A. I. (2025). New challenges for green finance and sustainable industrialization in developing countries: a panel data analysis. Energy Econ. 142, 108120. doi:10.1016/j.eneco.2024.108120
Jiang, H.L., Wang, W. D., Wang, L., and Wu, J. (2020). Research on the carbon emission reduction effect of China's green finance development: a case Study of green credit and green venture capital. Financ. Forum 25 (11), 39–48+80. doi:10.16529/j.cnki.11-4613/f.2020.11.006
Jin, Y., and He, L. (2024). How does energy policy uncertainty perception affect corporate greenwashing behaviors? Evidence from China's energy companies. Energy 15 (306), 132403. doi:10.1016/j.energy.2024.132403
Kumar, A., and Francisco, M. (2007). Enterprise size, financing patterns, and credit constraints in Brazil: analysis of data from the Investment Climate Assessment Survey. World Bank. Publ. 2015 (9), 1144–1130. doi:10.2139/ssrn.960152
Lesage, J., and Kelley, P. R. (2009). Introduction to spatial econometrics. doi:10.1201/9781420064254
Li, C., and Gan, Y. (2020). The spatial spillover effects of green finance on the ecological environment: empirical research based on spatial econometric model. Environ. Sci. Pollut. Res. 28, 5651–5665. doi:10.1007/s11356-020-10961-3
Li, Y., Xie, X., and Wang, M. (2023). Energy structure and carbon emission: analysis against the background of the current energy crisis in the EU. Energy 280, 128129. doi:10.1016/j.energy.2023.128129
Si, L., and Yao, X. (2022). Green finance reform and innovation and the ecologization of regional industrial structure: evidence from the Green finance reform and innovation pilot Zone. Learn. Explor. 2022 (4), 129–138+2. doi:10.3969/j.issn.1002-462X.2022.04.018
Liu, C., and Ren, Y. (2019). The impact of green credit on the low carbonization of energy consumption structure. Wuhan. Finance 2019 (1), 66–70.
Liu, J.Y., Yan, X., and Lin, S. (2015). Short, Medium, and long-term effects of China's green credit Policy: an analysis based on the financial CGE model. China Manag. Sci. 23 (04), 46–52. doi:10.16381/j.cnki.issn1003-207x.2015.04.006
Liu, F., Huang, P., and Tang, D. (2022). The Carbon Emission Reduction Effect and Influence Channel Research of Green Finance. Financial Econ. Res. 6, 144–158.
Liu, X., Ji, K., Sun, Y., and Lu, J. (2025). Unveiling the nonlinear impact: green finance, carbon emission intensity, and digital economy integration. Sustain. Futur. 9, 100610. doi:10.1016/j.sftr.2025.100610
Long, S., and Changqing, W. (2024). Research and analysis of vehicle life cycle carbon emission. Automob. Technol. Material 07, 1–8. doi:10.19710/J.cnki.1003-8817.20230363
Mudakkar, S. R., Khalid, Z., Khan, M. M., and Ahmad, M. (2013). Energy for economic growth, industrialization, environment, and natural resources: living with just enough. Renew. Sustain. Energy Rev. 25, 580–595. doi:10.1016/j.rser.2013.05.024
Ozili, P. K. (2021). Digital finance, green finance and social finance: is thera a link? Financ. Internet Q. 1 (17), 1–7. doi:10.2478/fiqf-2021-0001
Shen, Y., Zhi-Wei, S., Malik, M. Y., Umar, M., Khan, Z., and Khan, M. (2021). Does green investment, financial development, and natural resources rent limit carbon emissions: a provincial Panel analysis of China. Sci. Total Environ. 755, 142538. doi:10.1016/j.scitotenv.2020.142538
Shi, D., and Shi, X. (2022). Green finance and high-quality economic development: mechanism, characteristics, and empirical research. Stat. Res. 2022 (01), 31–48. doi:10.19343/j.cnki.11-1302/c.2022.01.003
Song, M., Xie, Q. J., and Shen, Z. Y. (2021). Impact of green credit on high-efficiency utilization of energy in China considering environmental constraints. Energy Policy 153, 112267. doi:10.1016/j.enpol.2021.112267
Tan, X., Gao, J., Zeng, A., and Xing, X. (2023). Impact of the“pilot zones for Green Finance Reform and innovations”policy on carbon emissions. Adv. Clim. Change Res. 19 (02), 213–226. doi:10.12006/j.issn.1673-1719.2022.069
Tian, J., Huang, W., Peng, J., and Fu, S. (2022). Transmission mechanism and spatial effects of green finance empowering carbon neutrality. West. Forum 32 (05), 44–62.
Wan, Q., Qian, J., Baghirli, A., and Aligul, A. (2022). Green finance and carbon reduction: implications for green recovery. Econ. Analysis Policy 76, 901–913. doi:10.1016/j.eap.2022.09.022
Wang, Q., and Zhang, F. (2021). The effects of trade openness on decoupling carbon emissions from economic growth: evidence from 182 countries. J. Clean. Prod. 279, 123838–10. doi:10.1016/j.jclepro.2020.123838
Wang, X., Liu, J., and Yaxiong, Z. (2021). Measuring the effectiveness of green finance reform and innovation pilot zones. Quantitative Econ. Tech. Econ. Res. 2021 (10), 107–127. doi:10.13653/j.cnki.jqte.2021.10.006
Wang, X., Jin, W., and Sebastian-Emanuel, S. (2025a). Empowering energy transition: revisiting the dynamic impacts of carbon emissions trading and the crude oil market. Econ. Analysis Policy 86, 988–1001. doi:10.1016/j.eap.2025.04.020
Wang, X., Jin, W., Xu, B., and Wang, K. (2025b). Volatility in carbon futures amid uncertainties: considering geopolitical and economic Policy factors. J. Of Futur. Mark. 45 (6), 308–325. doi:10.1002/fut.22565
Wang, X., Adnan, S., and Ge, F. (2025c). Towards carbon neutrality: will artificial intelligence and green bond become catalysts? Energy Econ. 148, 108711. doi:10.1016/j.eneco.2025.108711
Wen, S. Y., Zhang, L., and Liu, X. L. (2021a). Why do we need green finance? Global empirical facts and theoretical explanations in an economic growth framework. Financial Res. 2021 (12), 20–37. Available online at: http://www.jryj.org.cn/EN/Y2021/V498/I12/20.
Wen, H., Chien-Chiang, L., and Zhou, F. (2021b). Green credit Policy, credit allocation efficiency, and the upgrade of energy-intensive enterprises. Energy Econ. 94, 105099. doi:10.1016/j.eneco.2021.105099
Wu, Y., and Han, X. (2023). The effect of FDI agglomeration on carbon emission intensity: evidence from city-level data in China. Sustainability 15 (2), 1716. doi:10.3390/su15021716
Wu, Q., and Ren, X. (2023). Green credit Policy and governance of corporate greenwashing behavior:an empirical Study based on the national finance framework. Financial Econ. Res. 2023 (01), 146–160.
Xie, Q., and Fan, X. Carbon emission reduction effects of green finance reform and innovation pilot zones policy: evidence from the prefecture-level city in China Environ. Sci. Pollut. Res. 30, 102624–102640. (2023). doi:10.1007/s11356-023-29505-6
Xie, R. (2021). G green technology progress, positive externality and environmental pollution control of China. Manag. Rev. 33 (06), 111–121. doi:10.14120/j.cnki.cn11-5057/f.2021.06.009
Xiu, J., Liu, H., and Zang, X. (2015). Industrial growth and prediction under the background of green credit and energy saving and emission reduction. Model Econ. Sci. 37 (3), 55–62. doi:10.3969/j.issn.1002-2848.2015.03.007
Yadav, A., Gyamfi, B. A., Asongu, S., and Behera, D. K. (2024). The role of green finance and governance effectiveness in the impact of renewable energy investment on CO2 emissions in BRICS economies. J. Environ. Manag. 358, 120906. doi:10.1016/j.jenvman.2024.120906
Yang, L., and Liao, Z. (2021). Green Finance,Structural adjustment and carbon Emissions--A Test based on the regulated mediation effect. Finance Econ. 2021 (12), 31–39. doi:10.19622/j.cnki.cn36-1005/f.2021.12.004
Yang, Ao, Xingang, H., Xian, T. B. S., and Wenqi, L. (2023). Has green finance improved China’s ecological and livable environment? Environ. Sci. Pollut. Res. 30 (16), 45951–45965. doi:10.1007/s11356-023-25484-w
You, Z., Peng, Z., and Peng, L. (2022). Research on the impact of green finance development on regional carbon emission: take green Credit,Green industrial investment and green bonds for example. Financial Theory Pract. 2022 (02), 69–77.
Yuyan, L., Zhang, S., and Zhang, Y. (2023). Spatial-temporal evolution and reduction of provincial carbon emissions from the perspective of green finance. Soft Sci. 2023 (03), 65–72. doi:10.13956/j.ss.1001-8409.2023.12.06
Zhang, G., and Sun, H. (2022). Empirical research on the inhibitory effect of green finance on carbon emissions. Regional Finance Res. 2022 (06), 5–14.
Zhang, X., Jin, X., and Xu, L. (2015). Can the governance mode of elite executives improve corporate performance? An empirical Study based on social network relationship regulation effects. Econ. Res. 50 (03), 100–114.
Zhang, S., Wu, Z., Yao, W., and Yu, H. (2021). Fostering green development with green finance: an empirical study on the environmental effect of green credit policy in China. J. Environ. Manag. 296, 113159. doi:10.1016/j.jenvman.2021.113159
Zhao, Na. (2021). Can green credit improve regional green technology innovation? Based on regional green patent data. Econ. Issues 2021 (6), 33–39. doi:10.16011/j.cnki.jjwt.2021.06.005
Keywords: green finance, carbon emissions, nonlinear impact, spatial spillover effect, greenwashing
Citation: Ma Y, He W, Cui X and xu Z (2025) Research on the impact of green finance on carbon emissions from the perspectives of nonlinearity and spatial spillover. Front. Environ. Sci. 13:1647224. doi: 10.3389/fenvs.2025.1647224
Received: 15 June 2025; Accepted: 07 August 2025;
Published: 01 September 2025.
Edited by:
Fengtao Guang, China University of Geosciences Wuhan, ChinaReviewed by:
Xiaoqing Wang, Ocean University of China, ChinaPin Li, Xi’an University of Science and Technology, China
Copyright © 2025 Ma, He, Cui and xu. This is an open-access article distributed under the terms of the Creative Commons Attribution License (CC BY). The use, distribution or reproduction in other forums is permitted, provided the original author(s) and the copyright owner(s) are credited and that the original publication in this journal is cited, in accordance with accepted academic practice. No use, distribution or reproduction is permitted which does not comply with these terms.
*Correspondence: Yu Ma, bXk1NTVAMTYzLmNvbQ==; Xinyuan Cui, MTIwODQ1NDUyOUBxcS5jb20=