 Tao Shi
 Min Chen1
- 1Department of Mathematics and Computer Science, Tongling University, Tongling, China
- 2Anhui Province Key Laboratory of Physical Geographic Environment, Chuzhou University, Chuzhou, China
- 3Anhui Engineering Research Center of Remote Sensing and Geoinformatics, Chuzhou, China
- 4Anhui Center for Collaborative Innovation in Geographical Information Integration and Application, Chuzhou, China
- 5School of Earth and Space Sciences, University of Science and Technology of China, Hefei, Anhui, China
This study quantifies the nonlinear driving force of urban morphological factors on canopy urban heat island intensity (CUHII) in Anhui Province, integrating relocated meteorological station data, remote sensing imagery, and machine learning frameworks. CUHII values exhibit a range of 0.06°C–1.12°C, with the built-up largest patch index (LPIbt, importance score = 0.25) and built-up area ratio (ARbt, 0.18) emerging as dominant drivers. Cropland coverage (ARc, Pearson’s r = −0.59) demonstrates significant cooling effects on urban thermal environments. The random forest (RF) model outperforms support vector regression (SVR) model, achieving training/test R2 values of 0.95/0.76 and RMSE of 0.04/0.08°C. This superiority highlights its capability to capture complex interactions between urban morphologies and local thermal environment. The research framework is innovatively adapted to a flipped classroom educational model: students not only replicate the machine learning workflow using the same dataset but also design comparative experiments to test how urban morphological indicators affect CUHI outputs, thereby deepening their understanding of both physical mechanisms of CUHI and the interpretability of machine learning modeling. This integration of cutting-edge climate research with hands-on educational practice bridges the gap between academic inquiry and practical skill development. The study provides a replicable methodological framework for urban climate research and its translation into educational applications.
1 Introduction
Accelerated urbanization and population increases have driven continuous growth in anthropogenic heat release, intensifying urban heat island (UHI) phenomena globally (Grimm et al., 2008; Wang et al., 2016). The UHI effect manifests as elevated temperatures in urban zones relative to adjacent suburban and rural regions, predominantly attributed to modified surface properties (e.g., reduced vegetation cover, impervious materials) and concentrated human activities (Kang et al., 2014; Yang et al., 2017; Li et al., 2020). Within this framework, the canopy urban heat island (CUHI) specifically quantifies air temperature differentials between urban and rural environments, measured vertically from ground surfaces to building rooftop levels (Li et al., 2024). These thermal anomalies exert multifaceted impacts on societal systems, including but not limited to: amplified energy demand for cooling, heightened risks of heat-related morbidity, altered precipitation patterns contributing to urban flooding, and degradation of air quality through pollutant stagnation (Yang et al., 2022; Chen et al., 2022; Yang et al., 2023). Consequently, comprehensive investigation of CUHI dynamics and their governing factors remains essential for developing sustainable urban planning frameworks and climate adaptation measures.
The spatial heterogeneity of urban areas and infrastructure is recognized as a key driver of localized temperature variations (Fenner et al., 2017; Dang et al., 2022). Urban surfaces exhibit lower albedo than rural regions, leading to increased solar radiation absorption that intensifies heat island effects (Oke, 1982; Arnfield, 2003). Simultaneously, urban buildings alter surface roughness and wind patterns, reducing heat dissipation efficiency (Fujibe, 2003; Zong et al., 2021). These thermal dynamics are fundamentally influenced by urban surface composition, spatial arrangement, and distribution patterns (Li et al., 2021). Remote sensing studies have advanced the investigation of urban morphology-CUHI relationships. Shi et al. (2015) analyzed land use types within station buffers to evaluate surface air temperature (SAT) variations, while Li et al. (2015) quantified relationships between land cover (LULC) and SAT sequences using remote sensing data. However, existing studies predominantly rely on conventional indicators like land surface temperature and vegetation indices, inadequately addressing spatial configuration effects in LULC analysis.
Previous study predominantly employ linear regression to model urban morphology-thermal environment relationships (Shi et al., 2021), yet this approach faces inherent limitations. Wang et al. (2019) demonstrated through obstacle-SAT correlation analyses that urban morphological influences on temperature sequences exhibit nonlinear characteristics. Such findings reveal fundamental constraints of linear statistical methods in quantifying CUHI mechanisms. Recent advances in machine learning provide alternative frameworks for these complex interactions (Chen and Guestrin, 2016; Psistaki et al., 2025; Zhang et al., 2025). As an efficient supervised learning approach, Support Vector Regression (SVR) has been widely applied in various fields. SVR enhances data fitting capability while preserving model complexity by introducing the concept of support vectors (Zhu et al., 2024). Random Forest (RF), a decision tree-based ensemble method (Mutale et al., 2024), effectively captures nonlinear dynamics through recursive partitioning and feature importance evaluation.
Notably, the advancement of machine learning in urban climate research has two aspects of significance: it not only deepens scientific understanding of phenomena like CUHI, but also provides important opportunities for improving environmental education. As these models play an increasingly important role in solving real-world urban thermal challenges, educational systems need to help students develop not only theoretical knowledge of algorithms, but also practical ability to apply them in specific fields. However, despite these advancements in urban climate modeling, data science education is often disconnected from such real-world applications. Existing curricula tend to focus more on generic algorithm training (e.g., linear regression, basic classification) than on domain-specific problem-solving, which makes it difficult for students to connect theoretical knowledge with practical skills when dealing with urban environmental challenges. Another factor that widens this gap is the lack of educational materials based on cutting-edge research: although more and more studies show that machine learning is useful in urban thermal environment modeling (Ming et al., 2024; Shi et al., 2015; Zhong et al., 2025), these research results are rarely adapted into teaching modules. As a result, students are often not familiar with the entire workflow, from data curation to model interpretation (e.g., variable importance assessment), which affects their ability to link academic research with real-world urban planning needs.
In summary, although progress in CUHI research, three critical gaps remain: 1) Existing studies insufficiently address the driving force of urban morphologies on CUHI, often relying on linear models that fail to capture complex interactions; 2) The integration of machine learning techniques in urban climate research lacks enough exploration of parameter interpretability, limiting insights into the physical mechanisms driving CUHI; 3) Educational curricula rarely incorporate real-world applications of machine learning in urban thermal environment studies, creating a disconnect between academic research and practical skill development for addressing urban climate challenges. Anhui Province, located in the western Yangtze River Delta (YRD), has experienced significant meteorological station relocations due to urbanization. This strategic geographic context enables systematic investigation of urban morphology impacts on CUHI dynamics. The study targets relocated stations in Anhui, integrating remote sensing with machine learning models to quantify CUHII responses to morphological parameters. By achieving these objectives, this study seeks to advance both scientific understanding of CUHI dynamics and educational practices for training future researchers and practitioners in urban climate adaptation.
2 Data and methodology
2.1 Study area
Anhui Province is located in eastern China (114°54′–119°37′E, 29°41′–34°38′N), lying in the transition zone between the Yangtze River Delta and the Huaihe River Basin, with an area of approximately 140,100 square kilometers. Its terrain shows significant spatial variation: the southern part is dominated by mountainous areas, while the northern part is mainly composed of plains and hills. Major water systems in the province include the Yangtze River and the Huaihe River. Climatically, Anhui has a subtropical to warm-temperate monsoon climate, with an annual average temperature ranging from 14°C to 17°C and annual precipitation of 800–1800 mm.In terms of social economy, the population of Anhui Province was approximately 61.27 million in 2023, with an urbanization rate of 59.4%. As an important part of the western Yangtze River Delta, the province is experiencing rapid urban expansion. This geographical and socioeconomic background makes Anhui an ideal place for studying the driving effect of urban morphology on CUHI.
2.2 Data
The surface air temperature (SAT) data utilized in this study is provided by the National Meteorological Information Center under the China Meteorological Administration. This dataset includes homogenized monthly and daily mean SAT, as well as maximum and minimum SAT records from 2419 national meteorological stations across China.
Over the past several decades, China’s land cover has undergone significant transformations amid economic development. The annual China Land Cover Dataset (CLCD) is a dynamic land use dataset released by Wuhan University. As developed by Yang and Huang (2021), this dataset was constructed with a 30-m spatial resolution using 335,709 Landsat images via Google Earth Engine. The most recent version of the dataset includes land cover information for China spanning from 1985 to 2021, with an overall land classification accuracy of 80%.
The population (POP) and gross domestic product (GDP) data used in this study, were obtained from the “China Statistical Yearbook” published annually by the National Bureau of Statistics. These data provide detailed information on the population distribution and economic development level over the years, which helps to analyze the relationship between POP and GDP factors and CUHII.
2.3 Methodology
2.3.1 Meteorological stations selecting and CUHII calculation
Relocated stations were selected using historical records, environmental assessments, and satellite imagery under four criteria: 1) Environmental degradation (urbanization) necessitated relocation; 2) Altitude difference <50 m and relocation distance ≤20 km; 3) Geographic similarity in terrain/climate; 4) Instrument consistency. Forty-two stations meeting these standards (Figure 1) were spatially balanced across Anhui’s four sub-regions, with 5 km-radius buffer zones established.
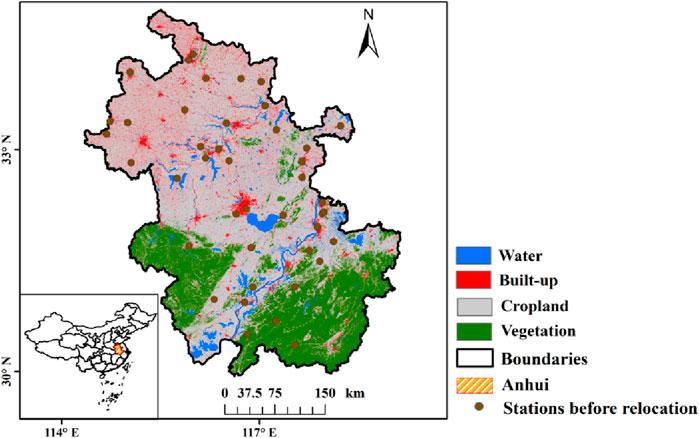
Figure 1. Spatial distribution of selected meteorological stations in Anhui Province.
The CUHII is defined as the temperature difference between urban areas and reference meteorological stations (Ren et al., 2007; Shi et al., 2015). However, rapid urbanization has made it difficult to locate unaffected rural reference stations near cities (Wen et al., 2019). Relocated meteorological stations, often situated in representative environments like open farmland or other vegetated areas, provide accurate regional climatic baselines (Yang et al., 2013) and serve as ideal rural reference sites. According to China’s Surface Meteorological Observation Standards, national stations must undergo at least 1 year of parallel observations before and after relocation. Thus, synchronized observation data from these sites offer high-quality samples for CUHII research. The calculation method for CUHII of each station after relocation is given in Equation 1.
In the above formula, Tbr is the average air temperature value (°C) of station before relocation; Tar is the average air temperature value (°C) of station after relocation that can represent the background climate. Notably, during the period of rapid urbanization, meteorological stations were significantly affected by urbanization, resulting in frequent relocations. However, as the pace of urbanization slows down and the protection of station detection environments is strengthened, the number of relocations has gradually decreased. Therefore, the method of using relocated station data to explore the driving effect of urban morphology on CUHI will have certain limitations in the future.
2.3.2 Urban morphologies datasets constructing
In this study, four land use types—built-up areas, water bodies, cropland, and vegetation—were extracted from the CLCD dataset to characterize land use patterns around meteorological stations. Land use parameters included the built-up area ratio (ARbt), water body area ratio (ARw), cropland area ratio (ARc), and vegetation area ratio (ARv). Landscape parameters mainly comprised the largest patch index (LPI) and average fractal dimension (FRA) for each land use type (Li et al., 2011; Ren et al., 2015). LPI reflects the dominant land use in the study area; higher values indicate a more significant role of that type in the overall landscape (Wu, 2000). As an index for characterizing patch configurations, FRA shows that a higher fractal dimension means more complex patch shapes and more fragmented distributions (Wu, 2000). These landscape metrics were calculated using Fragstats software.
Location parameters included the distances (DIS) between stations and centroids of various land uses, as well as distances from stations to urban centers (Liu et al., 2014). In ArcGIS, different land uses within station buffer zones were extracted, and their centroids were derived using the Calculate Geometry tool. This study also incorporated social indicators such as POP and GDP of the cities where stations were located. These social indicators serve as surrogates for measuring regional socioeconomic characteristics, which may influence the thermal environment around stations (Ren et al., 2015; Wen et al., 2019).
2.3.3 Machine learning modeling
This research explored the physical mechanisms driving the formation of the CUHI and applied various statistical models to analyze the responsive relationship between CUHII and urban morphological parameters. As an effective supervised learning approach, Support Vector Regression (SVR) is widely applied in various fields. By introducing the concept of support vectors, SVR enhances the data fitting capability while maintaining model complexity (Huang et al., 2025).
Derived from decision trees, the Random Forest (RF) model is a widely adopted and flexible machine learning technique (Hastie et al., 2009) with remarkable performance. Compared to conventional linear regression, RF leverages its non-parametric nature to effectively capture complex nonlinear relationships between predictors and response variables (Rafael et al., 2025). This model also demonstrates capability for variable importance identification (Zeng et al., 2020), enabling the decomposition of multi-factor contribution mechanisms. In this study, the RF model was trained and tested using 10-fold cross-validation (CV), with predictive performance evaluated via the coefficient of determination (R2). Model optimization focused on two core parameters: the number of decision trees and theproportion of candidate variables sampled at node splitting. Variable importance was quantified through Mean Decrease in Accuracy (MDA) and Mean Decrease in Impurity (MDI), where higher values indicate greater contributions of input variables. Using CUHII as the dependent variable, this research integrated multidimensional variables—including land use parameters, landscape pattern metrics, geometric characteristics, and socioeconomic factors—to construct SVR and RF models separately. By comparing the importance scores and statistical significance of input parameters across both models, the impact of urban spatial morphology on CUHII was quantified. This approach identifies dominant drivers of CUHII and their contribution hierarchy, providing mechanistic insights for heat island mitigation in urban planning.
3 Results
3.1 Characteristics of CUHI and urban morphologies
SAT measurements at relocated stations exhibited consistent decreases compared to pre-relocation baselines. These station-pair observational discrepancies during synchronous monitoring periods directly quantify CUHII in corresponding urban areas. Figure 2 delineates the spatial distribution of CUHII across Anhui Province, with recorded values spanning 0.06°C–1.12°C. Through natural breaks classification (Wen et al., 2019), seven distinct station groups were identified based on CUHII magnitude. The highest-intensity cluster (0.97°C–1.12°C) consists of five stations, dominated by Mengcheng Station in northern Anhui where pre-relocation built-up coverage reached 61.08%. Three regionally representative stations - Huainan (north Anhui), Hefei (central Anhui), and Dongzhi (south Anhui) - all exhibited CUHII exceeding 1°C, each surrounded by over 40% built-up areas prior to relocation. Conversely, the lowest-intensity group (0.06°C–0.21°C) contains four stations, including Fengtai Station in northern Anhui with only 15.2% pre-relocation built-up coverage. The remaining three stations in this category maintained built-up ratios below 20%, illustrating the direct correlation between urbanization levels and thermal environment alterations. This stratification systematically reveals how varying degrees of urban encroachment differentially influence microclimate conditions at meteorological observation sites.
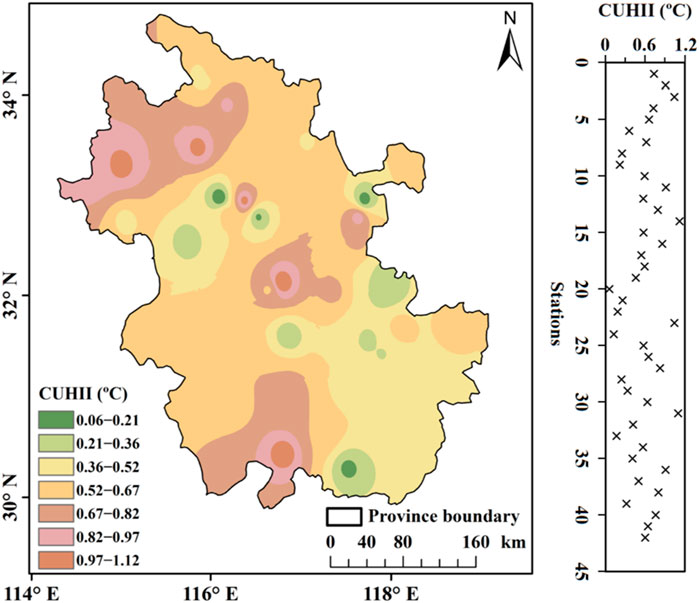
Figure 2. Patterns of CUHI of relocation station samples in Anhui province.
In addition, this paper conducted a statistical analysis of the distribution characteristics of urban morphological parameters before station relocation. Taking built-up areas as an example, the key findings are as follows: for ARbt, the average coverage across all stations stood at 31.08%, with values ranging from 9.3% to 68.8%. The probability density showed a trend of first increasing and then decreasing as the built-up area expanded, approximating a left-skewed normal distribution, with the density peak occurring in the interval of 25%–30% built-up coverage; the average value of LPIbt was 24.37, with a maximum of 66.96 and a minimum of 2.49; the highest probability density was observed in the range of 20–25; fractal analysis results indicated that FRAbt had an average of 1.09, with values spanning 1.02–1.13, and the interval of 1.08–1.1 corresponded to the highest probability density; in terms of distance metrics, DISbt had an average of 0.76 km, ranging from 0.22 km to 1.75 km, with the density peak appearing in the interval of 0.71–0.82 km. These distribution patterns rigorously confirm that the station environments before relocation had already been significantly affected by urbanization. Specifically, the configuration of built-up land cover directly contributes to urban thermal bias in surface air temperature (SAT) records through altered energy balance mechanisms. The concentration of parameters within specific value ranges—especially the fact that ARbt exceeded 25% at most stations—further validates the existence of a critical threshold, beyond which urban encroachment begins to significantly distort microclimate observations.
3.2 Nonlinear modulation of CUHII based on machine learning
This study quantified relationships between CUHII and urban morphology through correlation analysis of relocated meteorological stations. The heatmap (Figure 3) visualization employs color gradients (blue: negative, red: positive) and intensity scaling to represent correlation strength, with asterisks denoting statistical significance. LPIbt showed the strongest positive correlation (r = 0.68, p < 0.001), while ARc demonstrated maximal negative correlation (r = −0.59, p < 0.001). These patterns confirm urbanization-induced thermal impacts: expanding impervious surfaces reduce land thermal capacity and amplify anthropogenic heat, whereas agricultural lands enhance evapotranspiration cooling (Zeng et al., 2010; Zhao et al., 2018). Moderate correlations emerged for ARbt, LPIc, and POP, all p < 0.01. Contrary to previous findings (Knight et al., 2010), DISu showed non-significant correlation (r = 0.09), potentially reflecting regional sampling limitations - a methodological constraint to be addressed through expanded Yangtze River Delta research.
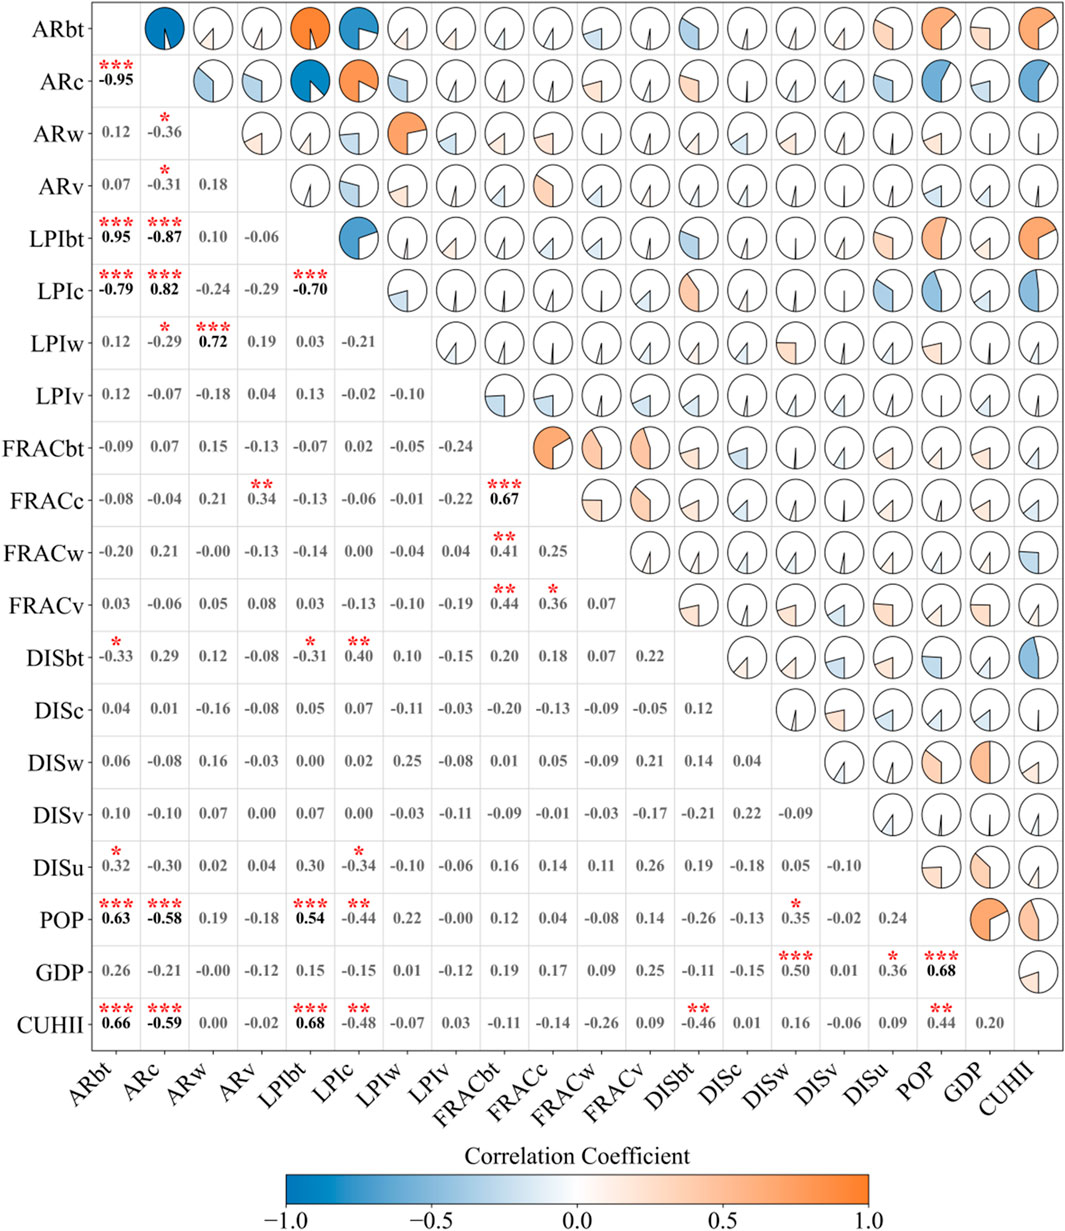
Figure 3. The Spearman correlation analysis of CUHII and various parameters.
The predictive performance of two distinct modeling approaches—SVR and RF—was evaluated for CHUII estimation. SVR showed training performance (R2 = 0.91, RMSE = 0.05°C; Figure 4a) and maintained test phase constraints (R2 = 0.67, RMSE = 0.09°C). The RF model outperformed both approaches, achieving exceptional training accuracy (R2 = 0.95, RMSE = 0.04°C; Figure 4b) while maintaining robust test generalization (R2 = 0.76, RMSE = 0.08°C). Comparative metrics highlight RF’s superior capability in capturing nonlinear relationships. Training phase analysis showed 46% higher R2 than linear models and 4% improvement over SVR. Test phase performance demonstrated 124% R2 enhancement versus linear approaches and 13% superiority over SVR. The 50% RMSE reduction in RF’s test predictions compared to linear models further confirms its precision. Mechanistically, RF’s ensemble decision tree architecture effectively integrates multiple urban parameters through recursive partitioning. This methodological advantage positions RF as the optimal tool for urban climate modeling, particularly in complex urbanization scenarios requiring high spatial resolution predictions. Future implementations will integrate temporal urban growth data to enhance model generalizability across evolving metropolitan regions.
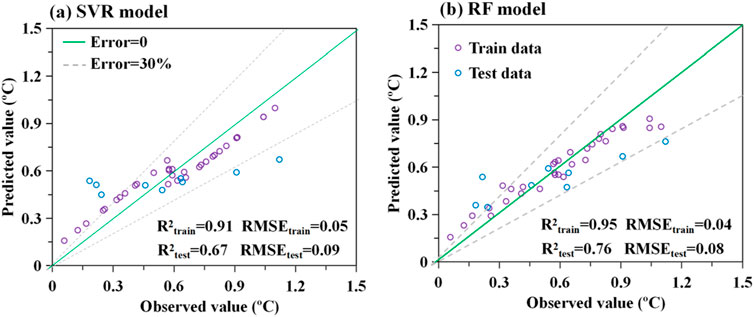
Figure 4. The comparison between predicted CUHII values and observed CUHII values by conducting different models (a,b).
This study employed the RF model to evaluate the relative importance of urban morphological parameters in predicting CHUII (Figure 5). The analysis revealed distinct hierarchical contributions across four parameter categories. For land use parameters, ARbt emerged as the second most influential factor (importance = 0.18), consistent with prior findings that urban-rural surface contrast alters net radiation partitioning into sensible versus latent heat fluxes (Miao et al., 2012). ARc (importance = 0.15), ARw (0.11), and ARv (0.09) followed in descending order. Landscape parameters demonstrated greater dominance, with LPIbt (0.25) ranking first overall - a 39% higher importance than ARbt. This reflects how contiguous urban patches reduce surface heterogeneity, impeding energy-matter exchanges between adjacent land covers (Estoque et al., 2017). LPIc (0.17) showed comparable influence to ARbt, with urban vegetation’s cooling capacity attributed to synergistic evapotranspiration and shading effects (Givoni, 1994; Shashua-Bar and Hoffman, 2000). Location parameters exhibited moderate impacts, with distance to DISbt (0.09) surpassing POP (0.08) in predictive importance. Comparative analysis established land use and landscape parameters collectively account for 82% of model explanatory power, versus 17% from location/social factors. The critical parameter hierarchy was identified as: LPIbt > ARbt > LPIc > ARc > DISbt > POP. While these findings elucidate two-dimensional urban morphology effects, the study acknowledges a methodological gap in three-dimensional parameter integration. Previous research demonstrates building height variability coulud explains the street-level temperature variance (Chun and Guldmann, 2014), while tree canopy vertical structure contributes the cooling through multi-layer shading (Zheng et al., 2019; Guo et al., 2023). Future investigations will incorporate LiDAR-derived 3D metrics (e.g., sky view factor, frontal area index) through multisensor remote sensing fusion, enabling comprehensive characterization of urban form-thermal environment interactions across spatial scales.
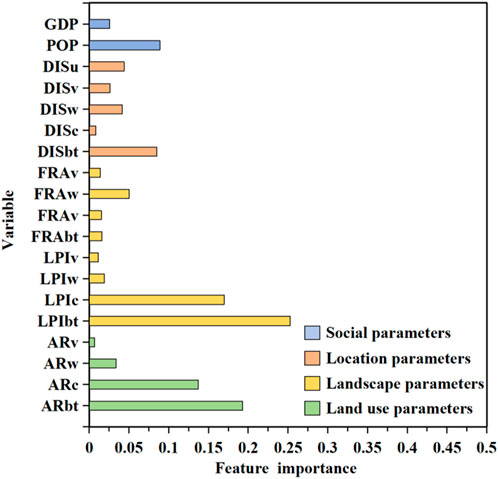
Figure 5. The importance rank of urban morphological variables for the RF model predicting the CHUII.
3.3 Educational application of research findings
The following section describes how the research methods and findings were adapted for a university course on Applied Data Science, demonstrating the practical utility of urban climate research in education.
The flipped classroom model restructures traditional pedagogy by reversing the sequence of knowledge transfer (pre-class self-study) and knowledge internalization (in-class interactions). Pioneered by Bergmann and Sams (2012), this approach shifts instructional focus to student-centered collaborative activities, where teachers facilitate discussions and problem-solving rather than deliver lectures. Key mechanisms include: 1) Pre-class knowledge acquisition through digital resources; 2) Classroom time dedicated to applying concepts through peer interactions and teacher guidance. This dual-phase design enhances student autonomy while strengthening socio-emotional connections through structured teacher-student dialogues. Empirical studies across disciplines confirm its effectiveness in fostering deeper cognitive engagement and meeting learners’ psychological needs (Schultz et al., 2014). This course achieves precise breakthroughs through a three-tier system reconstruction and optimizes the teaching process by leveraging the flipped classroom model: students engage in self-directed learning of basic theories of spatiotemporal data analysis before class, focus on technical practice and collaborative inquiry during class, and extend to industry application projects after class. The specific architecture is as follows (Figure 6).

Figure 6. Curriculum system framework.
During the knowledge input phase, students establish a spatiotemporal analysis framework through self-directed learning. They methodically study meteorological time series decomposition and spatial autocorrelation analysis using micro-lecture videos, perform sliding average filtering on temperature data in Jupyter Notebook, and generate daily urban heat island intensity curves. Teachers pre-release a library of typical urban heat island cases, requiring students to calculate heat island effects during heatwaves and conduct spatial overlay analysis of building density to form initial insights into spatiotemporal correlations. The knowledge internalization phase focuses on three core classroom components. First, students engage in case comparison discussions and group debates on the applicability of interpolation algorithms in complex urban areas. Second, they develop spatiotemporal density clustering algorithms, perform kernel density calculations on meteorological station data using Python, and optimize sliding time window parameters. Third, students collaborate to build 3D feature engineering modules (building height, sky visibility) and tune thermal environment feature matrices. For example, in feature engineering, they integrate street view images to extract aspect ratio indicators and construct multidimensional driver matrices with remote sensing ecological indices. During knowledge transfer, extended projects involve integrating multi-source data to construct random forest models for heat island prediction and ventilation corridor optimization. The final comprehensive solution includes a spatiotemporal data dashboard, Python API prediction model, and parameter sensitivity planning report, covering the full technical chain from data governance to planning decisions.
This study obtained ethical exemption from Tongling University Ethics Committee for analyzing anonymized classroom interaction data. Students were informed through institutional platforms about pedagogical data usage, with rights to voluntary participation and withdrawal preserved. All procedures complied with institutional guidelines and national regulations. Implemented in Spring 2023, the flipped classroom model enhanced students’ spatiotemporal analysis skills through a “pre-class construction, in-class internalization, post-class application” framework. A comparative study between 2022 (60-student experimental class: 32M/28F) and 2021 (58-student control class) cohorts showed significant improvements: experimental class mean score 93.7 vs. 74.8, with an 18.9-point difference confirmed by t-test (p < 0.001). Mastery of spatial interpolation rose from 58% to 93%, spatiotemporal autocorrelation accuracy from 47% to 85%, and machine learning modeling errors dropped from 72% to 37%—all metrics showing statistical significance (p < 0.001) (Table 1). Course enrollment increased, with higher proportions of high-scoring students. The research-teaching integration established an undergraduate practice mechanism: over 90% of students reported deepened machine learning modeling understanding, 80% noted improved research and writing skills. Fifteen undergraduates participated in urban thermal environment projects over three semesters, a 100% increase from pre-reform levels. This practice demonstrates that integrating real-world cases, innovative pedagogy, and comprehensive evaluations effectively enhances learning motivation, strengthens the understanding of CUHII physics mechanisms, and prepares students for academic and professional careers.
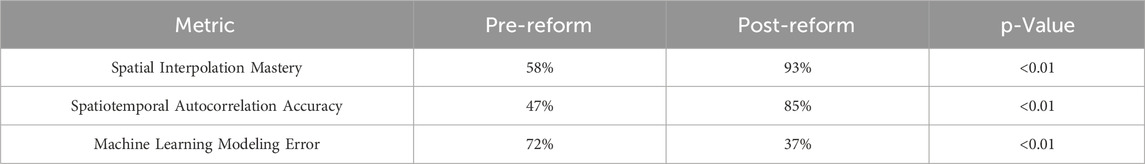
Table 1. Teaching practice outcomes.
4 Discussion
This study quantified the driving effect of urban morphology on canopy urban heat island intensity (CUHII) in Anhui Province using machine learning methods and explored the application of the research results in teaching. Despite achieving certain findings, there are still the following limitations:
This study focuses on Anhui Province. Although it can reflect the impact of urbanization in the western Yangtze River Delta on heat islands, the singularity of the research area may limit the generalizability of the conclusions. The urbanization model of Anhui Province (e.g., dominated by the expansion of small and medium-sized cities) differs from that of the high-density urban agglomerations on the eastern coast, resulting in possible differences in the driving mechanisms of urban morphological indicators (such as building density and landscape fragmentation) on heat islands compared with regions like Shanghai and Zhejiang. In addition, this study mainly uses two-dimensional indicators such as urban land use and landscape patterns to characterize urban morphology, without considering the complex driving effect of urban three-dimensional morphology on CUHI (Shi et al., 2015; Davis et al., 2016; Tysa et al., 2019).
Although the random forest model performs better than support vector regression in nonlinear fitting, the “black box” nature of machine learning models limits the physical interpretation of driving mechanisms (Reichstein et al., 2019). For example, it cannot quantify the interaction intensity between the proportion of built-up areas and farmland coverage. The variable importance analysis only relies on mean decrease accuracy (MDA) and mean decrease impurity (MDI), without combining tools such as partial dependence plots to reveal the marginal effects of parameters on heat island intensity, which may mask the threshold effects of key indicators (Gu et al., 2024; Wang et al., 2024; Liu and Shi, 2025). Moreover, the model does not consider temporal dynamics and is only based on static urban morphology data, failing to capture the interannual variation patterns of heat islands during the urbanization process.
In addition, the flipped classroom model has improved students’ technical application ability, but the educational application is limited to a single course with a small sample size, and the evaluation indicators mainly focus on skill mastery, lacking long-term tracking of students’ scientific research thinking (such as problem raising and scheme design). In addition, the teaching cases mainly use two-dimensional urban morphological parameters (such as the proportion of built-up areas and largest patch index), lacking three-dimensional morphological indicators (such as building height, floor area ratio, and sky view factor). Existing studies have confirmed that the vertical structure of buildings has a significant impact on surface radiation and air movement (Shao et al., 2023; Zhang et al., 2023; Ding et al., 2024), which may lead to cognitive biases regarding the generalizability of the model.
Future research will be improved from three aspects: First, expand to the entire Yangtze River Delta, compare and analyze the differences in heat island driving mechanisms among Anhui, Jiangsu, Zhejiang, and Shanghai, and incorporate the impact mechanisms of urban three-dimensional morphology such as building height, street aspect ratio, and sky view factor on heat islands. Second, adopt more diverse machine learning models such as gradient boosting trees and graph neural networks, enhance interpretability by combining SHAP values and partial dependence plots, quantify parameter effects, integrate annual urban expansion data to simulate the dynamic changes of heat islands, and predict risks under different scenarios. Third, improve educational applications, build a heat island teaching database covering multiple climate zones, extend the tracking period to evaluate students’ abilities, establish inter-school cooperation to promote the “research-teaching” integration model, and develop an online experimental platform to allow students to simulate heat island changes by adjusting urban morphological parameters, enhancing their intuitive understanding of driving mechanisms.
In summary, this study provides quantitative methods and educational practice cases for the impact of urban morphology on heat island intensity, but needs further improvement in regional representativeness, data integrity, model interpretability, and educational promotion to more accurately serve urban climate research and talent cultivation.
5 Conclusion
This study investigates canopy urban heat island (CUHI) dynamics in Anhui Province using relocated meteorological stations, remote sensing data, and machine learning. By analyzing 42 pairs of relocated stations, we quantify CUHI intensity (CUHII) and its relationship with urban morphology. CUHII values at the stations range from 0.06°C to 1.12°C, reflecting temperature differences between urban and rural environments. The largest patch index of built-up land (LPIbt, importance = 0.25) and built-up area ratio (ARbt, 0.18) emerge as key drivers of thermal anomalies. This indicates that the spatial contiguity and proportion of built-up land significantly influence local temperature patterns. In contrast, cropland coverage (ARc, r = −0.59) shows notable cooling effects, likely due to evapotranspiration and vegetation shading. A random forest (RF) model outperforms linear regression and support vector regression, with training and test R2 values of 0.95 and 0.76, respectively, and root mean square errors (RMSE) of 0.04°C and 0.08°C. The RF model’s superiority stems from its ability to capture nonlinear relationships between urban morphology and CUHII through ensemble learning. It effectively integrates multiple variables, such as landscape indices and distance metrics, to provide robust predictions of thermal anomalies in urban environments. The research framework is adapted into a flipped classroom model, where students apply the same dataset and modeling workflows to enhance their mastery of spatial analysis and nonlinear modeling techniques. This integration demonstrates the utility of real-world climate data in data science education, bridging academic research with practical skill development.
Data availability statement
The original contributions presented in the study are included in the article/supplementary material, further inquiries can be directed to the corresponding author.
Author contributions
TS: Conceptualization, Writing – original draft. MC: Conceptualization, Writing – review and editing, Software. JL: Software, Data curation, Writing – review and editing. GL: Writing – review and editing.
Funding
The author(s) declare that financial support was received for the research and/or publication of this article. Specifically, this study was supported by the Anhui Provincial Natural Science Foundation (2508085MD088); the Collaborative Innovation Fund of the Education Department of Anhui Province (Grant No. GXXT-2023-050); the Fund Project of the Anhui Key Laboratory of Real Scene Geographical Environment (Grant No. 2024PEG010); the Joint Research Project for Meteorological Capacity Improvement (22NLTSQ013).
Conflict of interest
The authors declare that the research was conducted in the absence of any commercial or financial relationships that could be construed as a potential conflict of interest.
Generative AI statement
The author(s) declare that no Generative AI was used in the creation of this manuscript.
Publisher’s note
All claims expressed in this article are solely those of the authors and do not necessarily represent those of their affiliated organizations, or those of the publisher, the editors and the reviewers. Any product that may be evaluated in this article, or claim that may be made by its manufacturer, is not guaranteed or endorsed by the publisher.
References
Arnfield, A. J. (2003). Two decades of urban climate research: a review of turbulence, exchanges of energy and water, and the urban heat island. Int. J. Climatol. 23, 1–26. doi:10.1002/joc.859
Bergmann, J., and Sams, A. (2012). Flip your classroom: reach every student in every class every day. Washington, DC: International Society for Technology in Education.
Chen, T., and Guestrin, C. (2016). XGBoost: a scalable tree boosting system. Proc. 22nd ACM SIGKDD Int. Conf. Knowl. Discov. Data Min., 785–794. doi:10.1145/2939672.2939785
Chen, S., Yang, Y., Deng, F., Zhang, Y., Liu, D., Liu, C., et al. (2022). A high-resolution monitoring approach of canopy urban heat island using a random forest model and multi-platform observations. Atmos. Meas. Tech. 15, 735–756. doi:10.5194/amt-15-735-2022
Chun, B., and Guldmann, J. M. (2014). Spatial statistical analysis and simulation of the urban heat island in high-density central cities. Landsc. Urban Plan. 125, 76–88. doi:10.1016/j.landurbplan.2014.01.016
Dang, B., Liu, Y., Lyu, H., Zhou, X., Du, W., Xuan, C., et al. (2022). Assessment of urban climate environment and configuration of ventilation corridor: a refined study in xi’an. J. Meteorological Res. 36, 914–930. doi:10.1007/s13351-022-2035-0
Davis, A. Y., Jung, J., Pijawka, B. C., and Minor, E. S. (2016). Combined vegetation volume and “greenness” affect urban air temperature. Appl. Geogr. 71, 106–114. doi:10.1016/j.apgeog.2016.04.012
Ding, X., Zhao, Y., Strebel, D., Fan, Y., Ge, J., and Carmeliet, J. (2024). A WRF-UCM-SOLWEIG framework for mapping thermal comfort and quantifying urban climate drivers: advancing spatial and temporal resolutions at city scale. Sustain. Cities Soc. 112, 105628. doi:10.1016/j.scs.2024.105628
Estoque, R. C., Murayama, Y., and Myint, S. W. (2017). Effects of landscape composition and pattern on land surface temperature: an urban heat island study in the megacities of southeast Asia. Sci. Total Environ. 577, 349–359. doi:10.1016/j.scitotenv.2016.10.195
Fenner, D., Meier, F., Bechtel, B., Otto, M., and Scherer, D. (2017). Intra and inter Local Climate Zone variability of air temperature as observed by crowdsourced citizen weather stations in Berlin, Germany. Meteorol. Z. 26, 525–547. doi:10.1127/metz/2017/0861
Fujibe, F. (2003). Long-term surface wind changes in the Tokyo metropolitan area in the afternoon of sunny days in the warm season. J. Meteorological Soc. Jpn. Ser. II 81, 141–149. doi:10.2151/jmsj.81.141
Givoni, B. (1994). Urban design for hot humid regions. Renew. Energy 5, 1047–1053. doi:10.1016/0960-1481(94)90132-5
Grimm, N. B., Faeth, S. H., Golubiewski, N. E., Redman, C. L., Wu, J. G., Bai, X. M., et al. (2008). Global change and the ecology of cities. Science 319, 756–760. doi:10.1126/science.1150195
Gu, X., Wu, Z., Liu, X., Qiao, R., and Jiang, Q. (2024). Exploring the nonlinear interplay between urban morphology and nighttime thermal environment. Sustain. Cities Soc. 101, 105176. doi:10.1016/j.scs.2024.105176
Guo, A., He, T., Yue, W., Xiao, W., Yang, Y., Zhang, M., et al. (2023). Contribution of urban trees in reducing land surface temperature: evidence from china’s major cities. Int. J. Appl. Earth Observation Geoinformation 125, 103570. doi:10.1016/j.jag.2023.103570
Hastie, T., Tibshirani, R., and Friedman, J. (2009). The elements of statistical learning: data mining, inference, and prediction. second edition. New York, NY: Springer Science+Business Media, LLC.
Huang, Z., Ma, R., Liu, H., Xue, K., Hu, M., Wei, X., et al. (2025). Short-term spatial prediction of algal blooms in Lake taihu via machine learning and GOCI observations. J. Environ. Manag. 388, 125964. doi:10.1016/j.jenvman.2025.125964
Kang, H. Q., Zhu, B., Zhu, T., Gao, J. H., Sun, J. L., and Su, J. F. (2014). Investigation of an urban heat island episode along suzhou-wuxi-changzhou urban cluster. Trans. Atmos. Sci. 37, 432–440. (in Chinese). doi:10.13878/j.cnki.dqkxxb.20140320001
Knight, S., Smith, C., and Roberts, M. (2010). Mapping manchester’s urban heat island. Weather 65, 188–193. doi:10.1002/wea.542
Li, J., Song, C., Cao, L., Zhu, F., Meng, X., and Wu, J. (2011). Impacts of landscape structure on surface urban heat islands: a case study of shanghai, China. Remote Sens. Environ. 115, 3249–3263. doi:10.1016/J.RSE.2011.07.008
Li, Y., Shi, T., Yang, Y., Wu, B., Wang, L., Shi, C., et al. (2015). Satellite-based investigation and evaluation of the observational environment of meteorological stations in Anhui province, China. Pure Appl. Geophys. 172, 1735–1749. doi:10.1007/s00024-014-1011-8
Li, Y., Sebastian, S., Kropp, J. P., and Rybski, D. (2020). On the influence of density and morphology on the urban heat island intensity. Nat. Commun. 11, 2647. doi:10.1038/s41467-020-16461-9
Li, Y., Ye, H., Sun, X., Zheng, J., and Meng, D. (2021). Coupling analysis of the thermal landscape and environmental carrying capacity of urban expansion in beijing (china) over the past 35 years. Sustainability 13, 584. doi:10.3390/su13020584
Li, Y., Yang, T., Zhao, G., Ma, C., Yan, Y., Xu, Y., et al. (2024). A systematic review of studies involving canopy layer urban heat island: monitoring and associated factors. Ecol. Indic. 158, 111424. doi:10.1016/j.ecolind.2023.111424
Liu, W., and Shi, X. (2025). An enhanced neural network forecasting system for July precipitation over the middle-lower reaches of the yangtze river. Atmosphere 16, 272. doi:10.3390/atmos16030272
Liu, J., Kuang, W., Zhang, Z., Xu, L., Qin, Y., and Ning, J. (2014). Spatiotemporal characteristics, patterns and causes of land use changes in China since the late 1980s. Acta Geogr. Sin. 69, 3–14. (in Chinese). doi:10.11821/dlxb201401002
Miao, S., Dou, J., Chen, F., Li, J., and Li, A. (2012). Analysis of observations on the urban surface energy balance in beijing. Sci. China Earth Sci. 55, 1881–1890. doi:10.1007/s11430-012-4411-6
Ming, Y., Liu, Y., Li, Y., and Song, Y. (2024). Unraveling nonlinear and spatial non-stationary effects of urban form on surface urban heat islands using explainable spatial machine learning. Comput. Environ. Urban Syst. 114, 114102200–102200. doi:10.1016/j.compenvurbsys.2024.102200
Mutale, B., Withanage, N. C., Mishra, P. K., Shen, J., Abdelrahman, K., and Fnais, M. S. (2024). A performance evaluation of random forest, artificial neural network, and support vector machine learning algorithms to predict spatio-temporal land use-land cover dynamics: a case from Lusaka and Colombo. Front. Environ. Sci. 12, 1431645. doi:10.3389/fenvs.2024.1431645
Oke, T. R. (1982). The energetic basis of the urban heat island. Q. J. R. Meteorological Soc. 108, 1–24. doi:10.1002/qj.49710845502
Psistaki, K., Richardson, D., Achilleos, S., Roantree, M., and Paschalidou, A. K. (2025). Assessing the impact of climatic factors and air pollutants on cardiovascular mortality in the eastern mediterranean using machine learning models. Atmosphere 16, 325. doi:10.3390/atmos16030325
Reichstein, M., Camps-Valls, G., Stevens, B., Jung, M., Denzler, J., and Carvalhais, N. (2019). Deep learning and process understanding for data-driven Earth system science. Nature 566 (7743), 195–204. doi:10.1038/s41586-019-0912-1
Ren, G., Chu, Z., Chen, Z., and Ren, Y. (2007). Implications of temporal change in urban heat island intensity observed at beijing and wuhan stations. Geophys. Res. Lett. 34, 2006GL027927. doi:10.1029/2006GL027927
Ren, G., Li, J., Ren, Y., Chu, Z., Zhang, A., Zhou, Y., et al. (2015). An integrated procedure to determine a reference station network for evaluating and adjusting urban bias in surface air temperature data. J. Appl. Meteorology Climatol. 54, 1248–1266. doi:10.1175/JAMC-D-14-0295.1
Schultz, D., Duffield, S., Rasmussen, S. C., and Wageman, J. (2014). Effects of the flipped classroom model on student performance for advanced placement high school chemistry students. J. Chem. Educ. 91, 1334–1339. doi:10.1021/ed400868x
Shao, L., Liao, W., Li, P., Luo, M., Xiong, X., and Liu, X. (2023). Drivers of global surface urban heat islands: surface property, climate background, and 2D/3D urban morphologies. Build. Environ. 242, 110581. doi:10.1016/j.buildenv.2023.110581
Shashua-Bar, L., and Hoffman, M. E. (2000). Vegetation as a climatic component in the design of an urban street. Energy Build. 31, 221–235. doi:10.1016/S0378-7788(99)00018-3
Shi, T., Huang, Y., Shi, C., and Yang, Y. (2015). Influence of urbanization on the thermal environment of meteorological stations: satellite-Observational evidence. Adv. Clim. Change Res. 6 (1), 7–15. doi:10.1016/j.accre.2015.07.001
Shi, T., Sun, D., Huang, Y., Yang, Y., and Lu, G. (2021). A new method for correcting urbanization-induced bias in surface air temperature observations: insights from comparative site-relocation data. Front. Environ. Sci. 9, 625418. doi:10.3389/fenvs.2021.625418
Tysa, S. K., Ren, G., Qin, Y., Zhang, P., Ren, Y., Jia, W., et al. (2019). Urbanization effect in regional temperature series based on a remote sensing classification scheme of stations. J. Geophys. Res. Atmos. 124 (13), 10646–10661. doi:10.1029/2019JD030948
Wang, W., Zhou, W., Ng, E. Y. Y., and Xu, Y. (2016). Urban heat islands in Hong Kong: statistical modeling and trend detection. Nat. Hazards 83, 885–907. doi:10.1007/s11069-016-2353-6
Wang, C., Wei, X., Yan, J., and Jin, L. (2019). Grade evaluation of detection environment of meteorological stations in beijing. J. Appl. Meteorological Sci. 30, 117–128. (in Chinese). doi:10.3969/j.issn.1001-7313.2019.01.011
Wang, Q., Wang, H., Ren, L., Chen, J., and Wang, X. (2024). Hourly impact of urban features on the spatial distribution of land surface temperature: a study across 30 cities. Sustain. Cities Soc. 113, 105701. doi:10.1016/j.scs.2024.105701
Wen, K., Ren, G., Li, J., Zhang, A., Ren, Y., Sun, X., et al. (2019). Recent surface air temperature change over mainland China based on an urbanization-bias adjusted dataset. J. Clim. 32 (10), 2691–2705. doi:10.1175/JCLI-D-18-0395.1
Wu, J. (2000). Landscape ecology, pattern, process, scale and grade. Beijing: Higher Education Press, 107–115.
Yang, J., and Huang, X. (2021). The 30 m annual land cover dataset and its dynamics in China from 1990 to 2019. Earth Syst. Sci. Data 13, 3907–3925. doi:10.5194/essd-13-3907-2021
Yang, Y., Wu, B., Shi, C., Zhang, J., Li, Y., Tang, W., et al. (2013). Impacts of urbanization and station-relocation on surface air temperature series in Anhui province, China. Pure Appl. Geophys. 170 (11), 1969–1983. doi:10.1007/s00024-012-0619-9
Yang, Y., Wang, L., Huang, Y., Shi, C., and Shi, T. (2017). Impact of urbanization on meteorological observation and its environment representativeness: a case study of Shouxian national climate station. Meteorological Sci. Technol. 45, 7–13. (in Chinese). doi:10.19517/j.1671-6345.20160062
Yang, Y., Guo, M., Ren, G., Liu, S., Zong, L., Zhang, Y., et al. (2022). Modulation of wintertime canopy urban heat island (CUHI) intensity in beijing by synoptic weather pattern in planetary boundary layer. J. Geophys. Res. Atmos. 127, e2021JD035988. doi:10.1029/2021JD035988
Yang, Y., Guo, M., Wang, L., Zong, L., Liu, D., Zhang, W., et al. (2023). Unevenly spatiotemporal distribution of urban excess warming in coastal shanghai megacity, China: roles of geophysical environment, ventilation and sea breezes. Build. Environ. 235, 110180. doi:10.1016/j.buildenv.2023.110180
Zeng, Y., Zhang, S., Zhang, H., Huang, W., and Liu, H. (2010). Study on urban heat island effects and its associated surface indicators. Remote Sens. Technol. Appl. 25, 1–7. doi:10.3724/SP.J.1087.2010.02819
Zeng, Z., Wang, Z., Gui, K., Yan, X., Gao, M., Luo, M., et al. (2020). Daily global solar radiation in China estimated from high-density meteorological observations: a random forest model framework. Earth Space Sci. 7 (2), e2019EA001058. doi:10.1029/2019EA001058
Zhang, M., Kafy, A.-A., Xiao, P., Han, S., Zou, S., Saha, M., et al. (2023). Impact of urban expansion on land surface temperature and carbon emissions using machine learning algorithms in wuhan, China. Urban Clim. 47, 101347. doi:10.1016/j.uclim.2022.101347
Zhang, W., Li, Y., Li, B., Li, T., Wang, Z., Yang, X., et al. (2025). Retrieval of atmospheric XCH4 via XGBoost method based on TROPOMI satellite data. Atmosphere 16, 279. doi:10.3390/atmos16030279
Zhao, L., Oppenheimer, M., Zhu, Q., Liu, X., Ebi, K. L., Bou-Zeid, E., et al. (2018). Interactions between urban heat islands and heat waves. Environ. Res. Lett. 13, 034003. doi:10.1088/1748-9326/aa9f73
Zheng, Z., Zhou, W., Yan, J., Qian, Y., Wang, J., and Li, W. (2019). The higher, the cooler? Effects of building height on land surface temperatures in residential areas of beijing. Phys. Chem. Earth 110, 149–156. doi:10.1016/j.pce.2019.01.008
Zhong, Q., Li, Z., Zhu, J., and Yuan, C. (2025). Revealing multiscale and nonlinear effects of urban green spaces on heat islands in high-density cities: insights from MSPA and machine learning. Sustain. Cities Soc. 120, 120106173–106173. doi:10.1016/j.scs.2025.106173
Zhu, H., Hao, H. K., and Lu, C. (2024). Enhanced support vector machine-based moving regression strategy for response prediction and reliability estimation of complex structure. Aerosp. Sci. Technol. 155, 109634. doi:10.1016/j.ast.2024.109634
Keywords: urban morphologies, canopy urban heat island, random forest, educational application, methodological framework
Citation: Shi T, Chen M, Li J and Lu G (2025) Quantifying the driving force of urban morphologies on canopy urban heat island: a machine learning approach with educational application. Front. Environ. Sci. 13:1647596. doi: 10.3389/fenvs.2025.1647596
Received: 15 June 2025; Accepted: 31 July 2025;
Published: 18 September 2025.
Edited by:
Md. Omar Sarif, Hiroshima University, JapanReviewed by:
Emmanuel Yeboah, Nanjing University of Information Science and Technology, ChinaMukesh Kumar Verma, Chandigarh University, India
Copyright © 2025 Shi, Chen, Li and Lu. This is an open-access article distributed under the terms of the Creative Commons Attribution License (CC BY). The use, distribution or reproduction in other forums is permitted, provided the original author(s) and the copyright owner(s) are credited and that the original publication in this journal is cited, in accordance with accepted academic practice. No use, distribution or reproduction is permitted which does not comply with these terms.
*Correspondence: Tao Shi, c2hpdGFvQG1haWwudXN0Yy5lZHUuY24=