 Jing Chen
 Xiangmin Liu3*
 Xingjian Wang
- 1School of Public Administration, Hebei University of Economics and Business, Shijiazhuang, China
- 2Hebei Collaborative Innovation Center for Urban-rural Integrated Development, Hebei University of Economics and Business, Shijiazhuang, China
- 3Institute of Environmental Economics, Chinese Academy of Natural Resource Economics, Beijing, China
- 4North China Engineering Investigation Institute Co., LTD., Shijiazhuang, China
- 5School of Geographical Sciences, Hebei Normal University, Shijiazhuang, China
Introduction: Urban agglomerations, as regions of concentrated economic activity, exhibit both embodied carbon transfer (ECT) driven by interregional trade and carbon sequestration service flows (CSSF) caused by spatial mismatches in carbon sink supply and demand.
Research Gap: Traditional carbon compensation mechanisms often adopt a single perspective, limiting their ability to reflect interregional carbon responsibility.
Methods: Using the Beijing-Tianjin-Hebei (BTH) urban agglomeration as a case study, this paper proposes a “Flow-Zoning-Compensation” framework that integrates ECT and CSSF. It identifies inter-administrative carbon flow paths, clarifies compensation subjects and benchmarks, and generates differentiated compensation schemes to establish a fairer horizontal carbon compensation mechanism.
Results: (1) Economically developed cities (e.g., Beijing, Shijiazhuang): transfer embodied carbon to industrial cities (e.g., Tianjin, Tangshan, Handan), while ecological function zones (e.g., Zhangjiakou, Chengde) not only receive embodied carbon but also provide sequestration services; (2) Based on total net transfers, the 13 cities in BTH are divided into six payers and seven recipients, with Shijiazhuang (2.861 billion CNY) and Chengde (2.860 billion CNY) as the main payer and recipient, respectively.
Discussion: This mechanism offers a more comprehensive reflection of carbon responsibility and provides policy implications for coordinated low-carbon development and national-level compensation design.
1 Introduction
In the context of increasingly severe climate change, China, as a responsible major country, has proposed the ambitious goals of “peaking carbon emissions by 2030 and achieving carbon neutrality by 2060.” To achieve these targets, the government has issued the Guidelines on Carbon Peak and Carbon Neutrality and the Action Plan for Carbon Dioxide Peaking Before 2030, which emphasize improving the carbon trading market and establishing a scientific carbon compensation mechanism. As an emerging field in ecological compensation research, carbon compensation aims to provide reasonable economic or non-economic compensation to carbon sink providers or ecological protectors (Zhao et al., 2016), serving as an effective pathway to achieve the dual carbon goals. Academic discussions on carbon compensation mechanisms primarily focus on three key aspects: compensation subjects, compensation standards, and compensation approaches. Defining compensation subjects forms the foundation for building an effective compensation mechanism. According to the “beneficiary pays” principle of ecological compensation, carbon compensation should clearly distinguish between payment areas and compensation-receiving areas (Tang et al., 2024; Yang et al., 2024). However, current delineation of compensation subjects still relies on administrative directives rather than market mechanisms, resulting in uneven responsibility allocation. Determining carbon compensation standards constitutes the core issue in establishing an effective carbon compensation system, as it directly influences the system’s scientific validity and practical effectiveness (Niu and Zou, 2019). Currently, academic research primarily employs three methods: the carbon sink value method (Liu and Chen, 2025), the willingness-to-pay method (Berger et al., 2022; Kang and Zhu, 2022), and the carbon balance method (Yang et al., 2022; Du and Yang, 2024). However, significant discrepancies among these methods often result in compensation standards that are either unrealistically high or insufficiently low. In China’s current practice, carbon compensation predominantly relies on central fiscal transfers, while market-oriented mechanisms and diversified horizontal compensation approaches remain underdeveloped (Jia and Gao, 2015). Consequently, establishing a scientific, equitable, and operationally efficient carbon compensation mechanism represents a critical pathway for achieving China’s “dual carbon” objectives.
China’s regional economic development imbalance has led to significant embodied carbon transfer (ECT) between provinces and regions through inter-regional trade and industrial relocation (Wang Y. N. et al., 2021). Current carbon compensation mechanisms focus solely on local carbon emissions while neglecting cross-regional ECT in trade, resulting in carbon leakage and misallocated emission reduction responsibilities (Han et al., 2024). Consequently, developing ECT-based carbon compensation mechanisms has emerged as a critical research focus (Ping and Zeng, 2023). Carbon sequestration services (CSS), as a typical ecosystem service function, partially offset anthropogenic carbon dioxide emissions through natural vegetation photosynthesis, playing a crucial role in climate change mitigation and regional sustainable development (Zhai et al., 2021). Spatial mismatches between CSS supply and demand areas frequently occur due to disparities in resource endowments, uneven population distribution, and varying socioeconomic conditions (Xi et al., 2024). This imbalance leads to carbon sequestration service flows (CSSF), where carbon sequestration benefits extend beyond their source areas to other regions through spatial transfer (Du et al., 2023). This phenomenon provides new theoretical and practical foundations for interregional ecological compensation (Wu A. B. et al., 2024).
Functioning as the primary economic hub of northern China, the Beijing-Tianjin-Hebei urban agglomeration (BTH) has long faced the contradiction between economic development and ecological preservation. On the one hand, Beijing and Tianjin, as core cities, have transferred a large amount of embodied carbon emissions to Hebei through industrial relocation and consumption spillover. On the other hand, Hebei not only bears the environmental pressure resulting from the inflow of high-carbon industries, but also plays a critical role in providing ecological services and acting as an ecological security barrier for Beijing and Tianjin (Yang et al., 2020). This has given rise to a dual-direction carbon flow pattern characterized by “carbon transfer–carbon sequestration service,” which, while promoting the reconfiguration of regional factors and spatial redistribution within the urban agglomeration, has also intensified regional development imbalances and ecological burden disparities. Therefore, establishing a coordinated compensation mechanism that considers both carbon source responsibility and carbon sink contributions is essential for achieving fair intra-regional responsibility sharing and green collaborative development within the urban agglomeration (Rao et al., 2022).
Guided by the theories of ecosystem services and environmental justice, this study systematically integrates two key carbon flow types—embodied carbon transfer (ECT) and carbon sequestration service flow (CSSF)—to propose a triadic “Flow–Zoning–Compensation” framework for designing a regional carbon compensation mechanism. Specifically: (1) At the flow level, a multi-regional input–output (MRIO) model is constructed to quantify embodied carbon transfers among regions, while breakpoint identification and field strength models are employed to assess the spatial flow of carbon sequestration services, thereby mapping the cross-jurisdictional carbon flow network; (2) At the zoning level, a compensation matrix is established based on bidirectional carbon flow data, enabling the scientific delineation of carbon payment and compensation zones and clarification of interregional carbon responsibility boundaries; (3) At the compensation level, carbon market trading prices are adopted as the benchmark for monetary calculation, and regional socioeconomic adjustment coefficients are introduced to formulate differentiated carbon compensation standards and financial compensation schemes.
This study breaks through the traditional single research perspective by coupling the dual dimensions of ECT and CSSF, and develops a “flow-zoning-compensation” framework. Its marginal contributions are in the following three aspects: (1) Theoretical advancement: The study expands from a single-dimensional carbon perspective to a bidirectional coupling of carbon sources and carbon sinks, promoting a paradigm shift in carbon compensation research; (2) Methodological innovation: It moves from static stock accounting toward dynamic flow-based carbon analysis, enhancing the scientific rigor and policy adaptability of compensation calculations; (3) Framework development: The study introduces a systematic three-tier compensation pathway—“Flow–Zoning–Compensation”—offering a replicable and scalable design for carbon compensation mechanisms in urban agglomerations.
2 Theoretical background and literature review
2.1 Theoretical background
2.1.1 Ecosystem services theory
Ecosystem services theory emphasizes that natural ecosystems, through their structures and processes, provide a variety of services to human societies, including provisioning, regulating, cultural, and supporting services. Among these, carbon sequestration functions—classified as a typical regulating service—play a crucial role in maintaining the global carbon balance and mitigating climate change. Forests, wetlands, and grasslands possess significant carbon storage capacity through photosynthesis, which enables them to absorb and fix atmospheric carbon dioxide. Given the spatial heterogeneity and externalities of ecosystem services, there is often a geographic mismatch between service-providing areas and beneficiary regions (Burkhard et al., 2014; Fisher et al., 2009). At the regional scale, ecological function zones tend to act as providers of carbon sink services, while economically developed areas are typically the major sources of carbon emissions and primary beneficiaries. This spatial asymmetry in the supply and demand of “carbon emission–carbon sink services” is particularly pronounced within urban agglomerations. Therefore, identifying the spatial flow of ecosystem services and clarifying the transboundary directions of regional carbon sink flows is critical for building equitable and efficient horizontal carbon compensation mechanisms (Grêt-Regamey et al., 2012; Liu et al., 2020). Ecosystem services theory thus provides not only the theoretical basis for identifying and evaluating carbon sequestration service flows but also a logical framework for designing intra-urban ecological compensation pathways.
2.1.2 Environmental justice theory
As an important branch of environmental sociology and sustainable development theory, environmental justice theory focuses on the fair distribution of environmental benefits and ecological burdens across different social groups and regions. It emphasizes the spatial justice and redistribution of responsibilities under the logic of “who pollutes, who suffers, and who benefits.” The theory posits that environmental issues often manifest in the form of resource-rich or economically powerful regions transferring environmental burdens to disadvantaged areas, rendering the latter as “environmental victims” without institutional access to adequate compensation. Within urban agglomerations, such inequalities are reflected in the embodied carbon emissions transferred from developed cities to ecological function zones via industrial spillovers and consumption activities. While ecological regions not only bear the pressure of carbon emissions, they also continuously provide carbon sequestration services, often without receiving equivalent compensation. Environmental justice theory stresses the need for institutionalized compensation mechanisms to rebalance carbon responsibilities and ecological rights across space, ensuring fair compensation for ecological contributors and enhancing the equity, sustainability, and legitimacy of low-carbon collaborative governance in regional contexts (Liu et al., 2020; Rao et al., 2022).
2.2 Literature review
2.2.1 Review of research on embodied carbon transfer
Embodied Carbon Transfer (ECT), as a crucial analytical tool for assessing the redistribution of carbon responsibilities across regions (Wiedmann et al., 2007), has emerged as a frontier topic in carbon footprint and ecological compensation research in recent years. Existing studies primarily rely on Multi-Regional Input–Output (MRIO) models, often in combination with Structural Path Analysis (SPA) and Social Network Analysis (SNA), to systematically trace the spatial coupling between product flows and carbon flows. These methods help identify key nodes and dominant pathways in the carbon transfer chain (Zhong et al., 2023; Luo et al., 2024). At the same time, discussions around the allocation of carbon responsibility have gradually shifted from the traditional “producer responsibility” model to frameworks emphasizing “consumer responsibility” and “shared responsibility,” thereby promoting interregional cooperation on carbon mitigation and fair compensation (Wang et al., 2023).
Some scholars have begun to explore spatial carbon compensation schemes based on ECT. However, there remains debate over how to define compensation benchmarks. While some researchers adopt the carbon balance method—assessing compensation based on regional carbon deficits or surpluses (Xia et al., 2023)—this approach often overlooks variations in trade structures. Others propose using net embodied carbon flows as the accounting basis (Chen et al., 2023), focusing on the compensation relationship between net carbon outflow and inflow regions, which is more conducive to targeted and equitable compensation schemes. Overall, the study of ECT has evolved from static estimation toward dynamic network identification, and it is increasingly integrated with policy tools and compensation mechanisms, providing a robust technical and practical foundation for developing precise, equitable, and efficient regional carbon governance systems.
Despite these advances, current research remains concentrated on macro-scale analyses and often lacks fine-grained assessments of intra-urban carbon transfers, particularly within polycentric urban agglomerations. As hubs of intensive economic activity with high population density and advanced levels of industrialization and urbanization, urban agglomerations are significant carbon emission zones. The internal carbon transfer effects within these regions are especially pronounced. Therefore, in-depth research into intra-agglomeration carbon transfer and corresponding compensation mechanisms is essential for delineating carbon responsibility and promoting regionally balanced and sustainable development.
2.2.2 Review of research on carbon sequestration service flow (CSSF)
Carbon sequestration service is a core function in the study of ecosystem services, referring to the capacity of natural ecosystems to absorb and store carbon dioxide through processes such as photosynthesis, thereby providing climate regulation support to human society. With the advancement of ecosystem services theory, scholars have increasingly recognized that carbon sequestration services not only possess ecological attributes but also exhibit significant spatial spillover effects. In many cases, there exists a spatial mismatch between service-providing areas and benefiting regions, resulting in cross-regional CSSF (Zhai et al., 2021). The identification and quantification of CSSF typically rely on data such as carbon density, land use, and spatial statistical models. Common methods include supply–demand matching analysis (Li et al., 2022; Li and Yao, 2024), breakpoint and ecological niche models (Du et al., 2023; Wang et al., 2022; Wang et al., 2024), as well as geographically weighted regression.
In recent years, researchers have begun to explore the application of CSSF in regional ecological compensation schemes. CSSF is seen as not only a useful tool for identifying the directional relationships between ecosystem service providers and beneficiaries but also as a theoretical basis for determining compensation zones and assigning compensation weights (Zhai et al., 2022; Wu C. S. et al., 2024; Ma et al., 2024). These studies enhance our understanding of how ecosystem functions can be integrated into spatial governance mechanisms. However, current research on CSSF primarily focuses on service flows within ecological systems, with limited integration of carbon emission responsibility allocation within economic systems.
In summary, current research on carbon compensation primarily follows two separate pathways: the allocation of emission responsibilities and the identification of ecological value. However, the integration of dual carbon flows remains underdeveloped. Studies on ECT highlight mismatches in responsibility caused by economic activities, whereas research on CSSF emphasizes the spatial spillover of ecological contributions. At present, few studies have attempted to model the linkage between ECT and CSSF, and comprehensive frameworks driven by both carbon flows are largely absent. Integrating these two flows can help clarify the logical chain of “who emits, who sequesters, and who compensates” within urban agglomerations, and promote a transition from static accounting to dynamic, co-evolutionary governance. Therefore, constructing a horizontal compensation mechanism based on the coordination of dual carbon flows—encompassing both carbon sources and sinks—offers a promising pathway for fostering green and coordinated development within urban agglomerations.
2.3 Research framework
This study examines BTH urban agglomeration by integrating ECT and CSSF into a unified analytical framework, constructing a three-tiered “flow-zoning-compensation” carbon compensation framework (Figure 1). The framework comprises: (1) flow layer, MRIO model was used to quantify interregional carbon transfers (inflows, outflows, and net transfers), while the InVEST model and population density method were used to assess carbon sequestration supply-demand dynamics, and breakpoint analysis with field strength modeling calculates CSSF to map spatial transfer patterns; (2) zoning layer, establish a bidirectional carbon source-sink compensation matrix to identify compensation subjects, categorizing regions into payment areas and compensation-receiving areas with differentiated benchmark values; and (3) compensation layer, carbon market prices were adjusted by regional development coefficients, and generate compensation standard and compensation amounts.
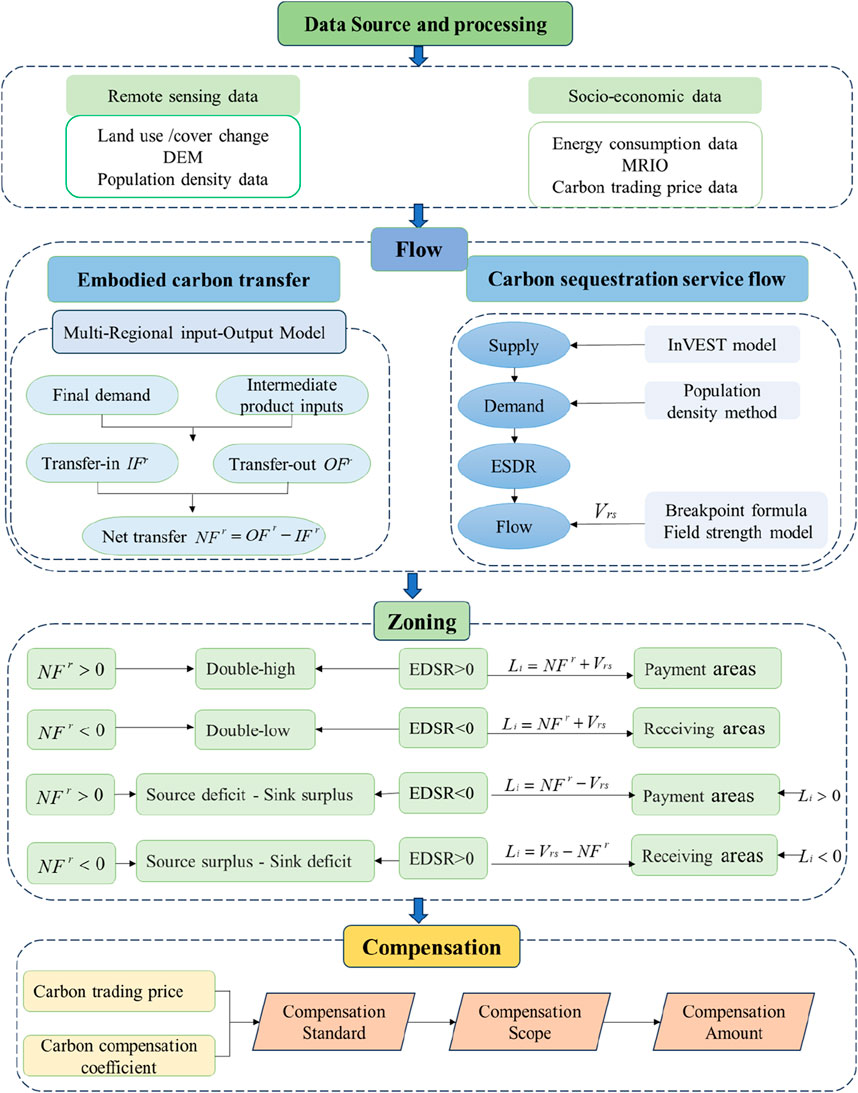
Figure 1. The research framework.
3 Materials and methods
3.1 Study area
The BTH region (36°05′–42°40′N, 113°27′–119°50′E), comprising Beijing Municipality, Tianjin Municipality, and Hebei Province, encompasses 13 cities across a total area of 218,000 square kilometers (Figure 2). As China’s pivotal political, economic, and cultural center, the region exhibits distinct geographical features: higher elevations in the northwest with the Bashang Plateau and Yanshan Mountains, lower southeastern terrain comprising the North China Plain, the Taihang Mountains to the west, and Bohai Bay to the east. By 2020, the region had a permanent population of approximately 110 million, with a population density of 508 persons/km2 and an urbanization rate of 68.61%, while its GDP totaled 8.575 trillion yuan.
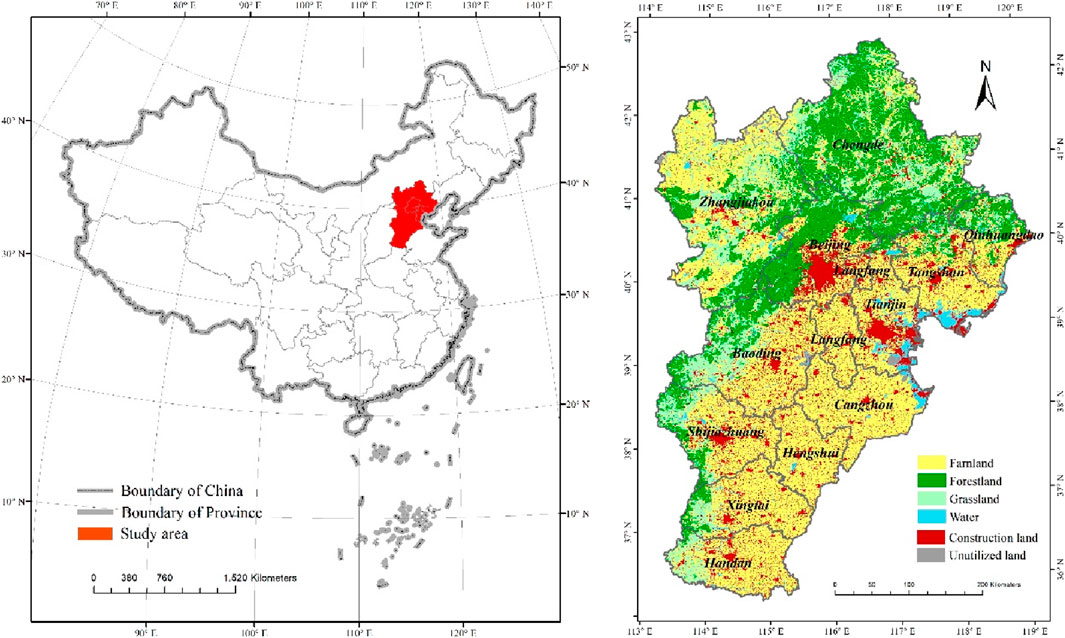
Figure 2. Location map of the Beijing-Tianjin-Hebei region.
The execution of the BTH coordinated development strategy coupled with Beijing’s non-capital function relocation have led Tianjin and Hebei to absorb substantial manufacturing industries from Beijing. Although this industrial transfer has reduced Beijing’s local carbon emissions, it has simultaneously increased carbon emission pressures in Tianjin and Hebei, creating significant interregional carbon transfer effects (Pang et al., 2017). Furthermore, the Yanshan and Taihang Mountains serve as natural ecological barriers, providing carbon sink services that mitigate regional carbon reduction pressures and offer essential ecological support for achieving carbon neutrality objectives.
3.2 Data source and processing
(1) Energy consumption data: Sectoral energy consumption data were obtained from the Beijing Statistical Yearbook (2021), Tianjin Statistical Yearbook (2021), and Hebei Statistical Yearbook (2021). Industrial carbon emissions were calculated using the IPCC carbon emission coefficient method.
(2) MRIO table: The MRIO data were sourced from the China Carbon Accounting Database (https://www.ceads.net.cn/), which provides provincial tables for 31 Chinese provinces and municipal tables for 309 cities. For this study, we extracted MRIO tables for the 13 BTH cities from the municipal tables. Given that the latest available data are for 2017 (while our study period is 2020), we followed the approach of Ye et al. (2012) by assuming constant direct input coefficients for intermediate and final use between 2017 and 2020. This allowed us to estimate the 2020 MRIO table while maintaining methodological consistency with established literature.
(3) Sectoral aggregation: The original MRIO table comprises 42 industrial sectors. Following established methodologies (Zhang et al., 2023; Zhu et al., 2022), we consolidated these sectors into seven aggregated categories for analytical simplification: Agriculture, Forestry, Animal Husbandry and Fishery; Mining industry; Manufacturing industry; Energy production and supply industry; Construction industry; Wholesale and retail, accommodation and catering industry; and other industry
(4) Spatial Data: Land use data were obtained from the Resource and Environmental Science Data Platform of the Chinese Academy of Sciences (https://www.resdc.cn/). The dataset classifies land use into six categories: cultivated land, forest land, grassland, water, construction land, and other land types, with a spatial resolution of 1 km × 1 km. Population density data were acquired from the WorldPop dataset (https://www.worldpop.org/) at the same spatial resolution (1 km × 1 km).
(5) Carbon Trading Price Data: Carbon trading price data were collected from the China Carbon Emissions Exchange (https://www.cneeex.com/). Since China’s national carbon emissions trading market was officially launched in 2021, we used the 2021 national carbon market average trading price as the baseline. The 2020 carbon trading price was then adjusted according to China’s GDP growth rate between 2020 and 2021, yielding a final value of 46.66 yuan per ton.
3.3 Methods
3.3.1 ECT accounting based on MRIO model
3.3.1.1 Direct carbon emissions calculation for different sectors
Using data from statistical yearbooks, we obtained energy consumption Fig. s for various sectors across the 13 cities and calculated sectoral carbon emissions by applying the IPCC coefficient method. For a given sector i utilizing l types of energy in its production activities, the total CO2 emissions can be expressed as:
where Ei represents the carbon emissions of sector i (10,000 tons), Cj is the consumption of energy j, and Kj is the carbon emission coefficient of energy j (10,000 tons of carbon per 10,000 tons of standard coal equivalent).
3.3.1.2 Calculation of ECT
The MRIO model can systematically track interregional flows of goods and services, making it an increasingly essential analytical tool for carbon transfer studies (Yuan et al., 2022; Fang et al., 2024). The MRIO analysis was conducted by the using the Python software. For a system comprising M regions with N industrial sectors each, the basic MRIO equilibrium is formally defined as:
where
The direct consumption coefficients of each sector are:
Equation 2 can be expressed in matrix form as:
Given I is the identity matrix and
Equation 4 can be expressed as:
To quantify interregional carbon transfers, we introduce the direct carbon emission coefficient
where
Let C be a diagonal matrix whose elements are carbon emission coefficients.
where
Based on the above formulation, the carbon emission transfer from region r to region s can be expressed as:
Then, the carbon emission transfer from region s to region r can be expressed as:
The net carbon transfer in region r can be expressed as:
3.3.2 Calculation of carbon sequestration service supply, demand, and flow
3.3.2.1 Carbon sequestration service supply (CSSS)
CSSS represents a critical ecosystem service function that positively contributes to CO2 emission mitigation, carbon balance maintenance, and global warming reduction. For this study, we employed the Carbon Storage and Sequestration module of the InVEST model to estimate 2020 carbon sequestration service in the BTH region. Using land-use data as input, the model aggregates carbon pools across various land-use types to compute carbon storage per pixel unit i, as expressed in the following equation:
where Aijt represents the area of land-use type j in pixel i, and N is the total number of pixels. Cabove, Cbelow, Csoil, Cdead denote the carbon densities of the aboveground biomass, belowground biomass, soil, and dead organic matter carbon pools for land-use type j, respectively. The carbon density data were obtained by revising 499 carbon density records for the BTH region from the 2010s China Terrestrial Ecosystem Carbon Density Dataset (Xu et al., 2019) and integrating findings from recent studies on regional carbon storage (Peng et al., 2024; Wu A. B. et al., 2024; Gong et al., 2023). This study yielded the carbon density values for different land-use types (Table 1).
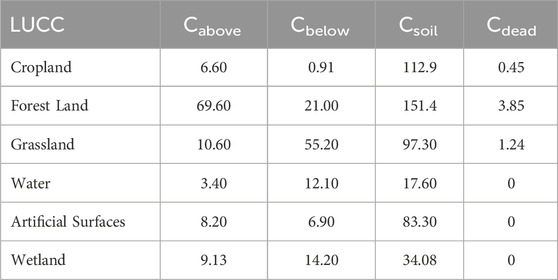
Table 1. Carbon density of different land-use types in the BTH.
3.3.2.2 Carbon sequestration service demand (CSSD)
The population density method is currently a widely used approach for estimating CSSD (Wu et al., 2023). CSSD, representing regional carbon emissions demand, is calculated based on population density and per capita carbon emissions. The calculation follows this formula:
where, Pi represents the population density of pixel i (persons/km2); θ is the per capita carbon emission coefficient (kg/person); and N is the total number of pixels.
The per capita carbon emission coefficient represents the ratio of total carbon emissions to the corresponding population size. Given the substantial differences in carbon emission patterns between urban and rural areas, this study employs a differentiated approach: (1) For agricultural land, the coefficient is derived by dividing the total carbon emissions from agriculture, forestry, animal husbandry, and fishery sectors by the rural population. (2) Emissions from the remaining six industrial sectors are uniformly classified as mixed urban-rural sources. For urban-rural demarcation, we adopt the urban-rural lighting area identification method (Wang et al., 2024), utilizing nighttime light data and other indicators to classify the study area into urban lighting zones and rural lighting zones. This allows for separate calculation of differentiated per capita carbon emission coefficients for urban and rural regions. This methodology significantly enhances the accuracy of carbon emission spatial allocation and better reflects the actual emission characteristics across different regions.
3.3.2.3 Carbon sequestration service supply-demand ratio (CSSDR)
The supply-demand relationship of CSS was evaluated by the supply-demand ratio (Du, et al., 2023). The formula is as follows:
where CSSDR represents the supply-demand ratio of CSS, with S and D denoting CSS supply and demand, respectively. The ratio interpretation is as follows: (1) CSSDR <0 indicates a demand surplus (supply < demand); (2) CSSDR = 0 represents supply-demand equilibrium; and (3) CSSDR >0 signifies a supply surplus (supply > demand).
3.3.2.4 Carbon sequestration service flow (CSSF)
The breakpoint formula and field strength model are employed to quantify three key parameters: (1) flow range, (2) flow intensity, and (3) transfer amount. This approach reveals the spatial transfer characteristics of CSS from output areas to input areas. The breakpoint formula is expressed as:
where, Dr is the flow range; Drs is the distance from the core of output area p to the core of input area d; Nr is the total CSSD of input region r; Ns is the total CSSD of output region s.
The field strength model is:
where, Irs represents the flow intensity, t/km2. The smaller the Irs, the weaker the flow intensity, and vice versa.
Using the buffering and overlay tools in ArcGIS 10.8, we generated a buffer zone centered on the core of source region r with the breakpoint distance as the radius. This buffer zone was then overlaid with input region s. Srs denotes CSSF covering area from the output region r to the input region s. The transfer amount is calculated as:
where,
3.3.3 Determination of carbon compensation benchmark and compensation zoning
Based on the calculation results of Formula 9, a positive value (ECT >0) indicates that the region serves as a net ECT input area, while a negative value denotes a net ECT output area. Similarly, according to Formula 12, CSSDR <0 identifies a net CSS input area, whereas CSSDR ≥0 indicate an output area. By integrating ECT and CSSF, we constructed a bidirectional carbon compensation zoning matrix (Table 2) comprising four combined scenarios, based on which differentiated carbon compensation benchmarks were established.
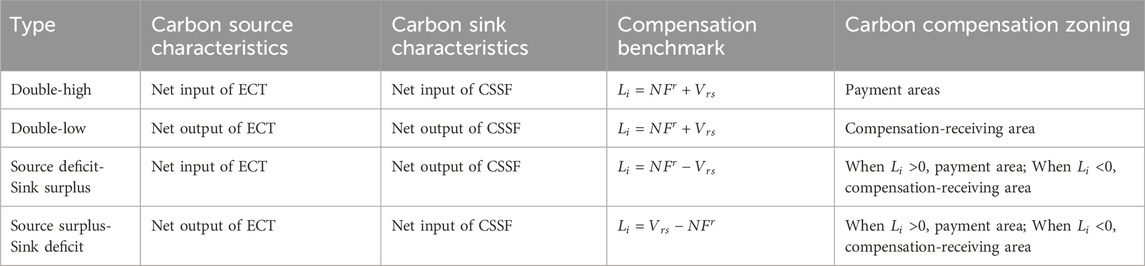
Table 2. Carbon compensation benchmarks and zoning table.
As shown in Table 2, “Dual-high” compensation zones refer to cities that experience both net embodied carbon inflow and net carbon sequestration service inflow. These cities are major beneficiaries of carbon emissions and heavily rely on external ecosystems for carbon sequestration services. Typically, they are economically developed, industrially concentrated, and densely populated core cities that should bear a greater share of compensation payments, thus categorized as carbon compensation payer zones. In contrast, “Dual-low” compensation zones are areas that both export embodied carbon and provide carbon sequestration services. These regions face the dual burden of emission responsibility and ecological service provision and are usually ecologically advantageous but economically underdeveloped peripheral areas. They should be designated as recipient zones in the carbon compensation scheme.
The source deficit–sink surplus type refers to regions with net embodied carbon inflow and net carbon sequestration service outflow. Such areas not only absorb transferred carbon emissions but also supply carbon sink services to other regions. If the net carbon input is greater than zero, the region should be classified as a payer zone; if less than zero, it is considered a recipient zone. Conversely, the source surplus–sink deficit type refers to regions with net embodied carbon outflow and net carbon sequestration service inflow. These regions transfer emission responsibilities outward while depending on external ecosystems for sequestration functions. If the net output is greater than zero, the region should be a payer zone; otherwise, it is a recipient zone.
3.3.4 Calculation carbon compensation amount
With reference to relevant methods (Zhao et al., 2016), the calculation method for carbon compensation was obtained:
where TCi represents the carbon compensation amount in region i,
where
4 Results
4.1 ECT characteristics and spatial patterns in BTH
4.1.1 Direct carbon emissions by sector in BTH
Based on Formula 1, we calculated direct carbon emissions from seven major sectors across 13 cities (Figure 3). In terms of total carbon emissions, Tangshan exhibited the highest total emissions (387.09 million tons), significantly exceeding other cities, followed by Handan (162.11 million tons) and Tianjin (119.21 million tons). Conversely, Langfang (15.21 million tons) and Hengshui (13.44 million tons) showed the lowest emission levels. In terms of emission intensity, Tangshan (5.38 tons/10,000 yuan) and Handan (4.46 tons/10,000 yuan) exhibited the highest carbon emissions per unit of GDP. By contrast, Beijing demonstrated the lowest carbon intensity (0.16 tons/10,000 yuan), with Shijiazhuang and Langfang tied at 0.51 tons/10,000 yuan.
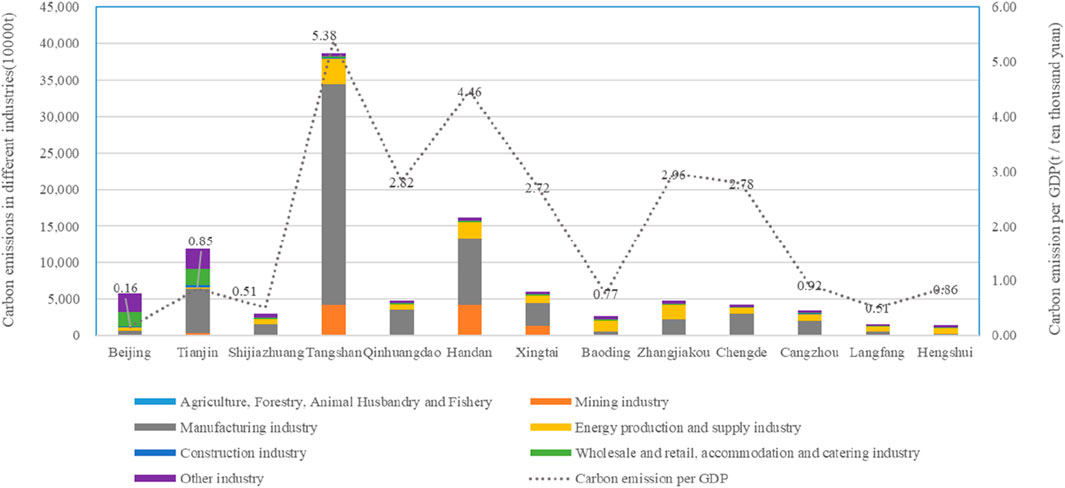
Figure 3. Carbon emissions and carbon emission intensity in BTH.
Industrial carbon emission structure shows the following characteristics: (1) In cities such as Tangshan, Qinhuangdao, Handan, Xingtai, Chengde, and Cangzhou, the proportion of manufacturing industrial carbon emissions accounts for over 50%, with Tangshan being the most prominent, accounting for 78.4%; (2) The carbon emissions from the energy production and supply industry dominate in cities such as Baoding, Langfang, Hengshui, and Zhangjiakou, with Hengshui having the highest proportion, accounting for 56.8%; (3) Beijing exhibits a distinct carbon emission structure, where the carbon emissions of wholesale and retail, accommodation and catering industry account for 80.1%, reflecting that its carbon emissions primarily come from the service industry rather than traditional industry.
4.1.2 ECT inflows and outflows in BTH
Based on Formulas 2-10, this study quantified the ECT of 13 cities in BTH region and their interregional transfers (Figures 4, 5). Figure 4 visually displays the embodied carbon inflow, outflow, and net carbon transfer of each city. Here, the embodied carbon inflow refers to emissions acquired by a region through commodity imports from external sources, while the embodied carbon outflow reflects the emissions transferred to other regions through commodity exports. The positive or negative value of the net carbon transfer carries significant economic and environmental implications: a positive value indicates that the region has net transferred carbon emissions to external areas through trade, achieving partial externalization of emissions, while a negative value suggests that the region bears carbon emission pressure net imports.
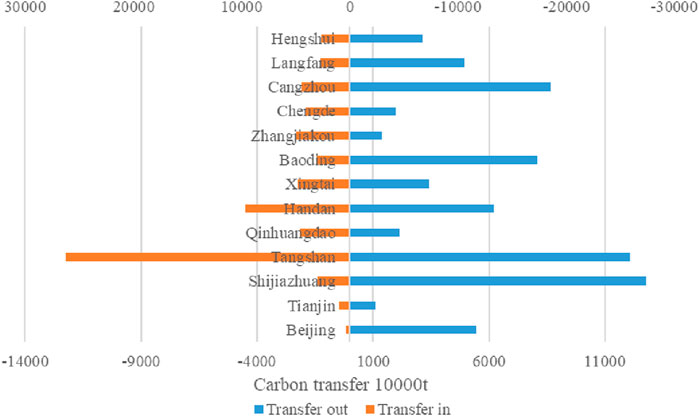
Figure 4. Carbon transfer in and transfer out in BTH.
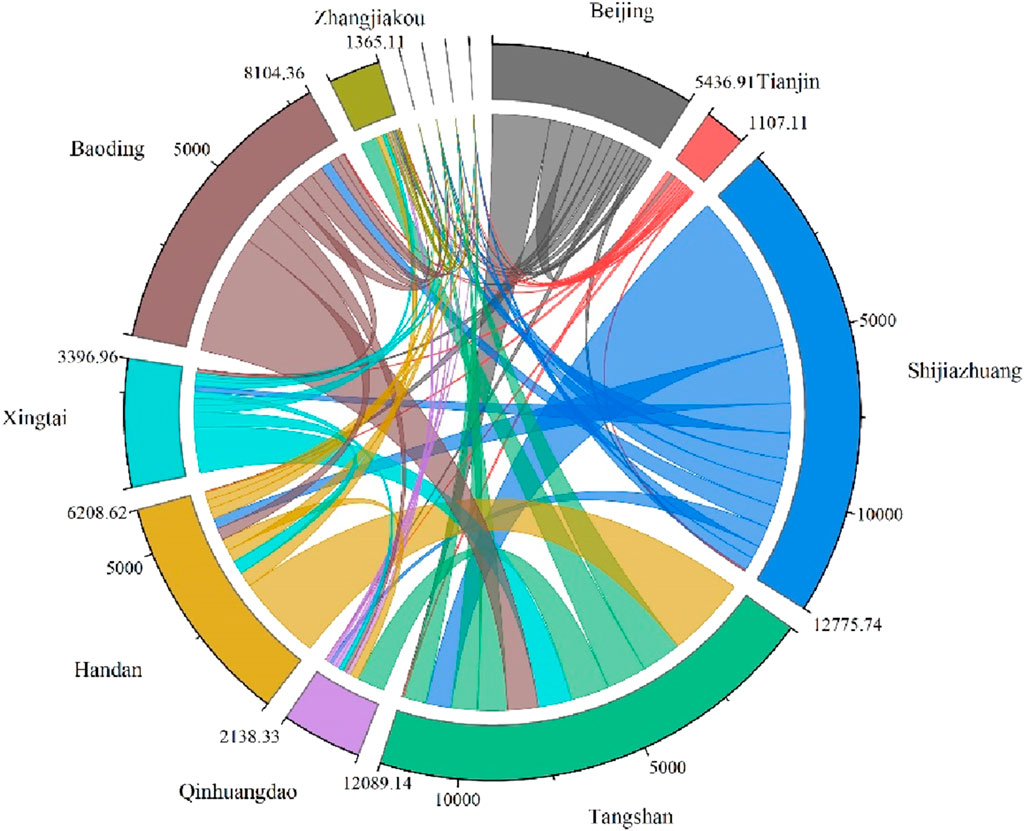
Figure 5. Intercity embodied carbon transfers (ECT) in the BTH Region.
The results show that: (1) Seven cities—Beijing, Tianjin, Shijiazhuang, Baoding, Cangzhou, Langfang, and Hengshui—exhibit net carbon outflow. Among them, Shijiazhuang (98.0608 million tons), Beijing (51.1045 million tons), and Baoding (50.4899 million tons) show the most substantial net outflows, followed by Cangzhou (42.0635 million tons) and Langfang (22.2755 million tons). This phenomenon indicates that despite their relatively low direct carbon emissions, these cities’ production and consumption activities indirectly drive external carbon transfer through regional trade. (2) Six cities—Tangshan, Qinhuangdao, Handan, Xingtai, Zhangjiakou, and Chengde—show net carbon inflow. Tangshan has the largest net inflow (141.70 million tons), followed by Zhangjiakou (35.66 million tons), Handan (34.06 million tons), and Qinhuangdao (24.41 million tons). This spatial pattern reveals significant regional heterogeneity in carbon emission transfers within the BTH region, with resource-intensive cities bearing greater carbon emission burdens.
4.1.3 Intercity ECT networks in BTH
Figure 5 illustrates the spatial characteristics of ECT among the 13 cities in the BTH. In terms of transfer pathways: As the core city, embodied carbon emissions of Beijing primarily flowed into Tianjin (7.6466 million tons), Tangshan (18.9033 million tons) and Handan (6.5406 million tons). The embodied carbon emissions of Shijiazhuang mainly flowed into Tangshan (51.7852 million tons), Handan (18.9360 million tons) and Xingtai (9.8119 million tons). Similarly, Baoding, Cangzhou, and Langfang predominantly transferred their emissions to Tangshan and Handan, with amounts of 38.87/9.68 million tons, 46.34/10.71 million tons, and 23.30/6.05 million tons, respectively. As typical carbon sink cities, Zhangjiakou and Chengde received ECT from all other cities, among them, with Tangshan contributing the largest amounts (13.08 million tons and 9.74 million tons, respectively).
Regional carbon transfers are closely associated with industrial characteristics. As an international metropolis, Beijing depends heavily on surrounding regions for manufactured goods and agricultural supplies. Under the dual pressures of relocating non-capital functions and adjusting its energy structure, Beijing has transferred out carbon emissions to other cities. Shijiazhuang has experienced consistent declines in local carbon emissions due to its coal reduction policies and clean energy substitution. Cities like Baoding (new energy), Cangzhou (petrochemicals), and Langfang (electronics and information technology) are dominated by low-energy-consumption industries, demonstrating clear patterns of net energy imports. The steel industry belt comprising Tangshan, Handan, and Xingtai accounts for 76% of regional steel production. As exporters of energy-intensive products, these cities have become primary recipients of embodied carbon. Zhangjiakou (a renewable energy demonstration zone) and Chengde (an ecological conservation area) utilize their carbon sequestration capacities to absorb emissions from other regions, resulting in net embodied carbon inflows.
4.2 Carbon sequestration service supply-demand patterns and flows in BTH
4.2.1 CSSS patterns
Using Formula 11, we calculated CSSS at both grid and city scales across the BTH region (Figure 6).
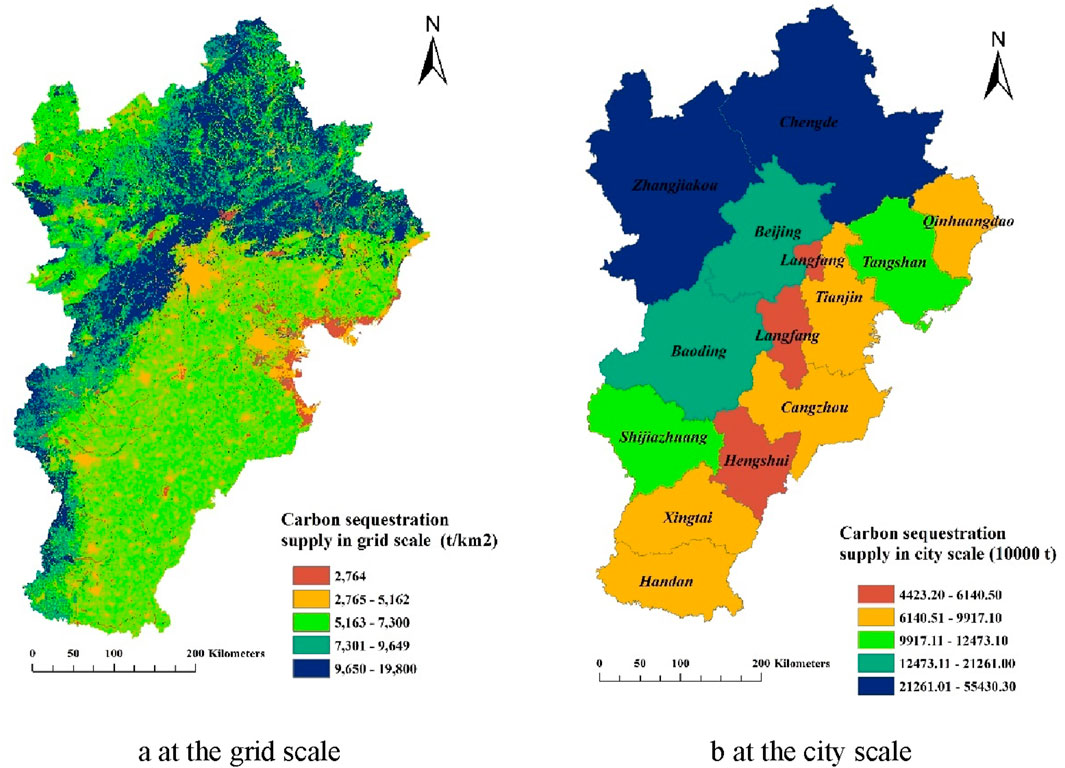
Figure 6. Spatial Distribution of CSSS in BTH. (a) at the grid scale. (b) at the city scale.
In 2020, the CSSS in the BTH region exhibited a distinct spatial pattern of “high in the northwest and low in the southeast” (Figure 6a). High-value areas were concentrated in the Yanshan-Taihang Mountain ecological barrier zone, where forestland and grassland dominated the land use types, forming contiguous high-carbon sequestration core zones. In contrast, the southeastern plains—particularly urban agglomerations around Beijing, Tianjin, and Shijiazhuang—showed lower carbon sequestration capacity. This was primarily due to the encroachment on ecological land caused by urban expansion (Wu C. S. et al., 2024) and the impact of high-intensity human activities.
In 2020, the total CSSS in BTH reached 2,144.7926 million tons, with an average of 164.9840 million tons. Due to varying ecological baseline conditions across regions, significant spatial heterogeneity was observed (Figure 6b). High-supply areas were concentrated in Zhangjiakou (377.958 million tons) and Chengde (554.303 million tons), collectively accounting for 43.5% of the total CSSS, highlighting their critical function as ecological barriers for the BTH region. Conversely, low-supply areas predominated in Langfang (44.232 million tons) and Hengshui (61.405 million tons), where areas cover less than 10,000 km2 and ecological land accounts for <30%. These constrained conditions result in substantially reduced carbon sequestration capacity.
4.2.2 CSSD patterns
Using Formula 12, we calculated CSSD at both grid and city scales across the BTH region (Figure 7).
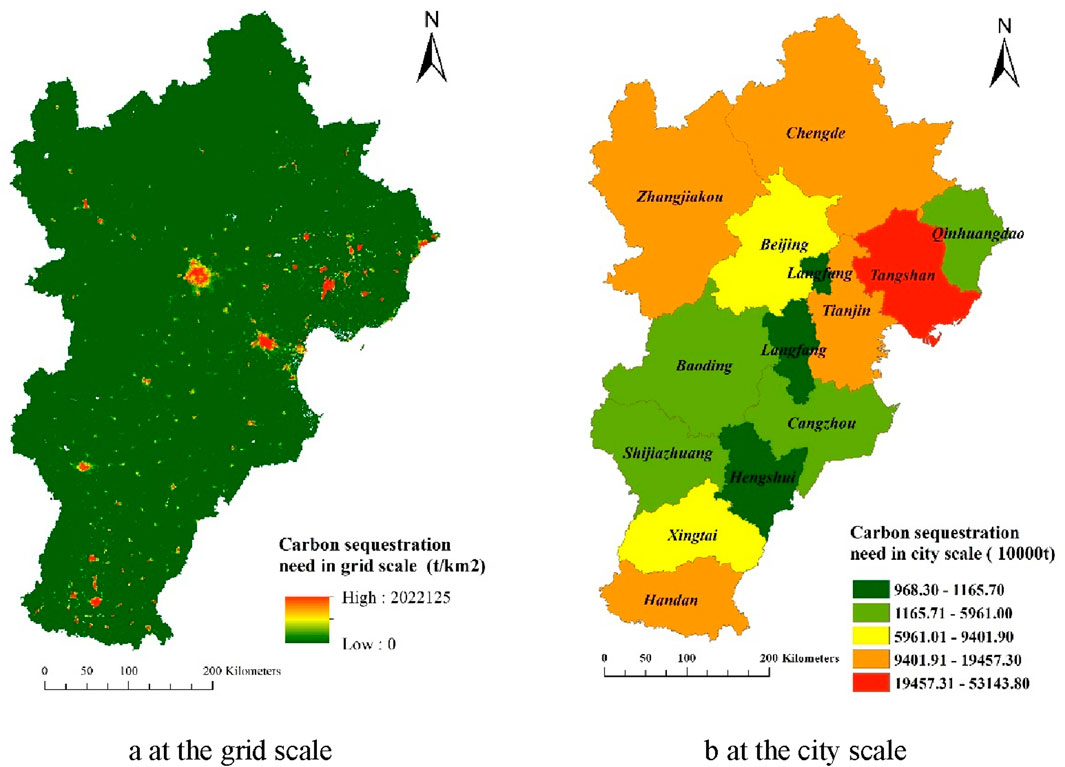
Figure 7. Spatial Distribution of CSSD in BTH. (a) at the grid scale. (b) at the city scale.
In 2020, the CSSD in BTH region exhibited a typical “centralized polarization” spatial pattern (Figure 7a). High-demand zones (>5 million tons/km2) are primarily clustered in urban cores such as Beijing, Tianjin, and Shijiazhuang, central districts of industrial cities like Tangshan and Handan, and scattered locations in urban-rural transition zones. As the economic growth hubs of BTH, these areas not only supported the highest population density (>2,000 people/km2) but also demonstrated a significant per capita carbon emission effects. In contrast, low-demand zones (<1 million tons/km2) were mainly distributed in the ecological conservation areas, dominated by croplands and forests that naturally maintained minimal CSSD.
In 2020, the total CSSD in BTH region reached 1,591.8659 million tons, with an average of 122.4512 million tons, yet it showed a significant spatial heterogeneity (Figure 7b). The demand hotspots ranked in descending order, were Tangshan (531.44 million tons), Handan (194.57 million tons), Zhangjiakou (173.91 million tons), Chengde (169.64 million tons), and Tianjin (141.72 million tons). Notably, despite serving as a critical ecological barrier, the Zhangjiakou-Chengde zone relied on coal-dominated energy consumption (>65%), resulting in substantial carbon offset demand. Tianjin, as a megacity, exhibited demand driven by both traditional manufacturing and household emissions, while Handan’s high demand primarily originated from its steel industry’s carbon intensity. In contrast, demand coldspots—such as Hengshui (11.66 million tons) and Langfang (9.68 million tons)—showed significantly lower CSSD, closely tied to their smaller areal extent, land-use composition, and sparse population density (<400 people/km2).
4.2.3 CSSDR patterns
Using Formula 13, we calculated CSSDR at both grid and city scales across the BTH region (Figure 8).
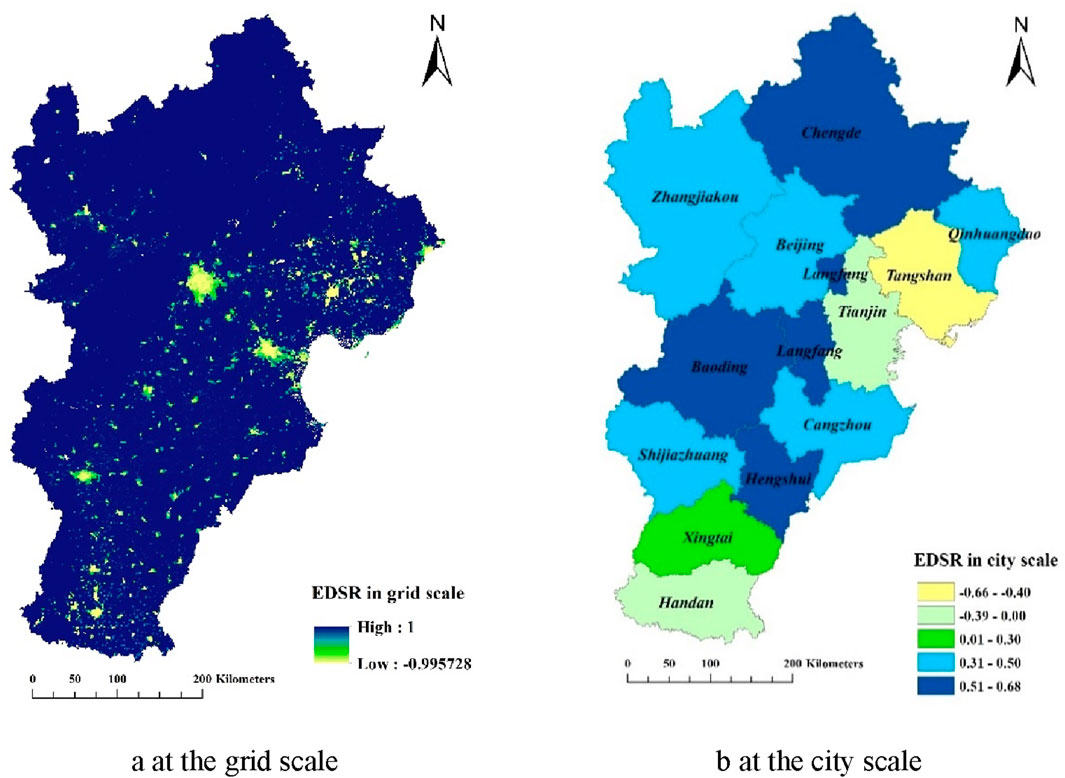
Figure 8. Spatial distribution of CSSDR in BTH. (a) at the grid scale, (b) at the city scale.
In 2020, the CSSDR in BTH region showed an overall ratio of 0.15, with an average of 0.25, indicating a carbon sequestration service surplus (Figure 8a), yet revealing significant spatial disparities. Deficit areas were mainly concentrated in urban built-up areas and their surrounding zones, particularly in Beijing, Tianjin, Tangshan, and Shijiazhuang, where high-intensity human activities drove carbon emissions far exceeding local carbon sequestration capacity. In contrast, surplus areas were mainly distributed across the Yanshan-Taihang Mountain ecological corridor, which maintained over 70% forest-grassland coverage and population densities below 100 people/km2, enabling these regions to not only achieve carbon neutrality but also provide additional sequestration services to neighboring areas.
From the perspective of the city scale (Figure 8b), the CSSDR of Tianjin (−0.29), Tangshan (−0.66), and Handan (−0.37) show negative CSSDR values, classifying them as net carbon input areas with deficits of 6,363.50, 42,291.54, and 10,483.00 million tons respectively. In contrast, The CSSDR of remaining eight cities show positive CSSDR values, classifying them as net output area, indicating that these cities can provide CSS to Tangshan, Tianjin, and Handan while maintaining their own carbon balance.
4.2.4 Spatial characteristics of CSSF in BTH
Using Formulas 14-16, we calculated the flow range, flow intensity and transfer amounts of 13 cities in the BTH region (Figure 9; Table 3).

Figure 9. Spatial Characteristics of CSSF in BTH. (a) Flow range, (b) Flow intensity, (c) Transfer amount.
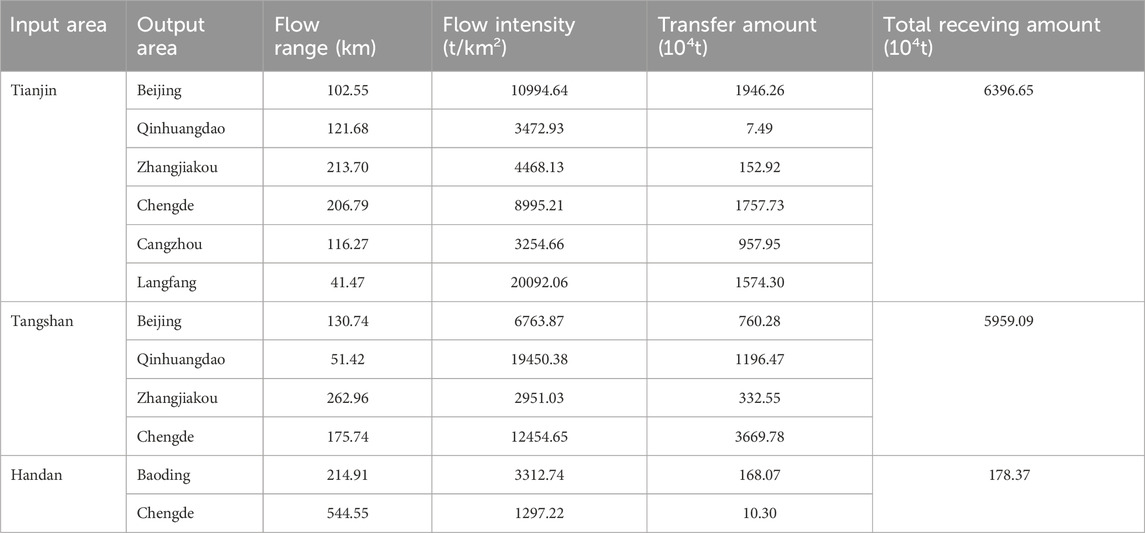
Table 3. Output and input of carbon sequestration service in BHT.
From the perspective of flow range (Figure 9a; Table 3), the flow radius of output areas ranges from 41.47 to 544.55 km, demonstrating a distinct distance decay effect. The shortest flow radius is from Langfang to Tianjin (41.47 km), while the longest is from Chengde to Handan (544.55 km). As the primary output area, Chengde supplies carbon sequestration services across long distances to key industrial cities, including Tianjin, Tangshan, and Handan. Conversely, Tianjin, as a major input city, receives CSS from six cities, including Zhangjiakou, Chengde, Beijing and Qinhuangdao and two others (Table 3).
From the perspective of flow intensity (Figure 9b; Table 3), the average flow intensity is 8,125.63 t/km2, but existing significant variations. The Langfang-Tianjin flow demonstrates the highest intensity (20,092.06 t/km2), whereas the Chengde-Handan flow shows the lowest (1,297.22 t/km2). Notably, flow intensity displays a strong inverse relationship with spatial distance - intensity diminishes with increasing distance and strengthens with proximity.
By integrating flow range and intensity, we calculated regional transfer amounts (Figure 9c; Table 3). Tianjin and Tangshan emerged as the primary input regions, with Tianjin receiving the highest amount at 63.9665 million tons, accounting for 38.7% of the total. Followed by Tangshan, with 59.5909 million tons, accounting for 36.1% of the total. Handan showed the smallest transfer amount at 1.7837 million tons, making up only 1.1%. Tianjin and Tangshan are located at the geometric center of the BTH, benefiting from natural geographical advantages. It is relatively close to regions with strong CSS such as Zhangjiakou, Chengde, Qinhuangdao, and Beijing, facilitating substantial inflows. In contrast, Handan is situated at the southern end of BTH, farther from regions with strong CSS, leading to lower transfer amount.
4.3 Carbon compensation zoning and compensation amount
4.3.1 Carbon compensation zoning and amount based on ECT
Based on Table 2 and Formula 17, the compensation zones and amounts based on ECT were calculated (Figure 10). The results show that Beijing, Shijiazhuang, Baoding, Cangzhou, Langfang, and Hengshui are payment areas, which can be further divided into two categories: (1) economically developed compensation cities (e.g., Beijing, Shijiazhuang, and Langfang), characterized by strong economic strength, high clean energy adoption, and industrial relocation, relying on imported products and accounting for 74.48% of the total amount; and (2) agriculture-dominated compensation cities (e.g., Baoding, Hengshui, and Cangzhou), which have lower industrialization levels and similar import dependence, contributing 25.52% of the total. Meanwhile, Tianjin, Tangshan, Qinhuangdao, Handan, Xingtai, Zhangjiakou, and Chengde are compensation-receiving areas, also divided into two subcategories: (1) resource-intensive cities (e.g., Tangshan, Handan, and Xingtai), which bear high carbon intensity and significant ecological costs for regional development, accounting for 76.09% of the total amount; and (2) carbon-sink cities (e.g., Zhangjiakou, Chengde, and Qinhuangdao), distinguished by their prominent carbon sequestration functions, accounting for 23.91% of the total.
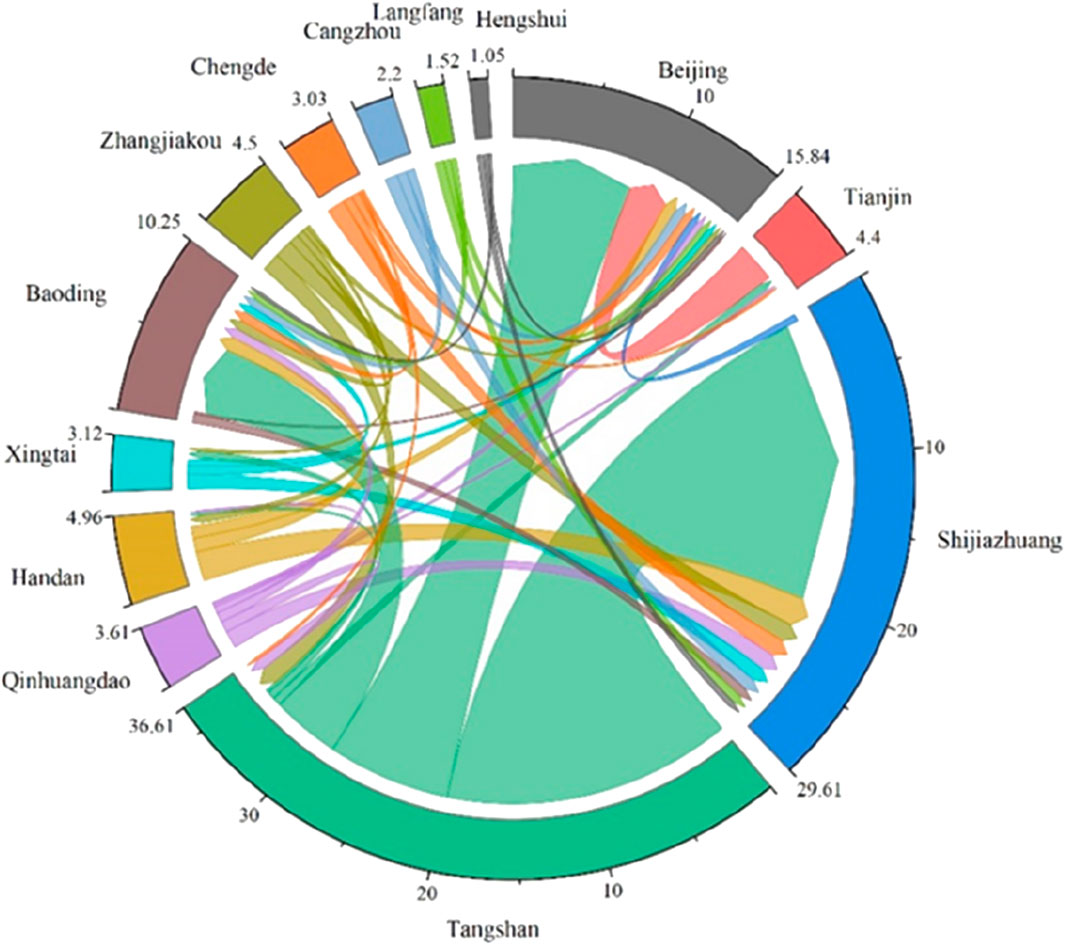
Figure 10. Carbon compensation amount based on ECT.
Figure 10 illustrates the compensation amounts among cities in the BTH region. Among the payment areas, Shijiazhuang has the highest payment amount at 2.864 billion yuan, with the largest amount to Tangshan, about 1.988 billion yuan. Beijing ranked second, with amount of 1.585 billion yuan, primarily directed toward Tangshan and Tianjin, with the amount of 847 million yuan and 273 million yuan, respectively. Baoding, Cangzhou, Langfang, and Hengshui follow with sequentially decreasing payment amounts of 861 million, 816 million, 651 million, and 71 million yuan, respectively. Among compensation-receiving areas, Tangshan received the compensation of 4.426 billion yuan, far exceeding other regions. Zhangjiakou ranked second, receiving 641 million yuan, while Tianjin had the lowest compensation at just 106 million yuan. These results reflect significant regional imbalances in ECT, with Tangshan bearing the primary responsibility as a recipient, while economically developed areas like Shijiazhuang and Beijing contributed the majority of the compensation funds.
4.3.2 Carbon compensation zoning and amount based on CSSF
Based on Table 1 and Formula 17, the CSSF-based compensation zones and amounts were calculated (Figure 11). The results reveal three distinct regional categories: payment areas (Tianjin, Tangshan, and Handan), compensation-receiving areas (Beijing, Qinhuangdao, Zhangjiakou, Chengde, Cangzhou, Langfang, and Baoding), and neutral areas (Shijiazhuang, Xingtai, and Hengshui) that neither bear payment obligations nor qualify for compensation.
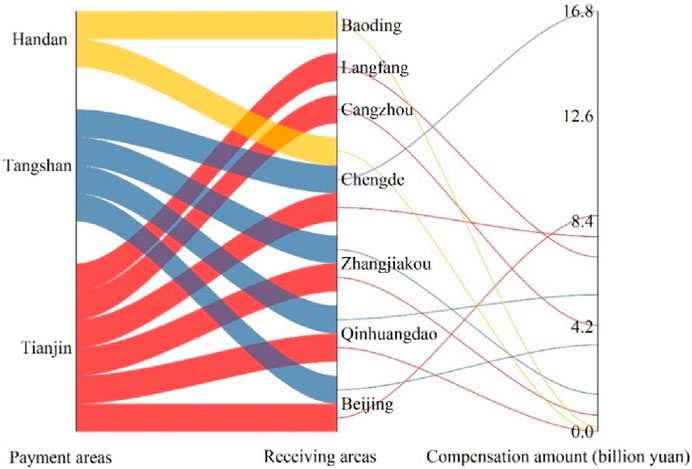
Figure 11. Carbon Compensation Amount based on CSSF.
Figure 11 illustrates carbon compensation amounts among cities in the BTH region. In terms of total amounts, the payment amounts for Tianjin, Tangshan, and Handan are 2.836 billion, 2.725 billion, and 23 million yuan, respectively. Among the receiving cities, Chengde ranked first with an amount of 2.458 billion yuan, followed by Beijing and Langfang, with amounts of 1.211 billion yuan and 698 million yuan, respectively. Notably, Baoding received the lowest amount of 22 million yuan. In terms of compensation flows, the largest transfer occurred from Tangshan to Chengde (1.678 billion yuan), representing the most significant regional compensation relationship. The second largest flow was from Tianjin to Beijing (863 million yuan). The smallest transfers were observed from Handan to Chengde (1 million yuan) and Tianjin to Qinhuangdao (3 million yuan).
4.3.3 Bidirectional carbon compensation zoning and compensation amounts
Based on integrated ECT and CSSF compensation zoning results (Table 4), this study classified the compensation zonings and determined compensation benchmark for 13 cities in BTH (Table 4). The results showed that: (1) “Double-low” cities (Qinhuangdao, Zhangjiakou, Chengde) with low net output in both metrics were classified as payment areas; (2) “Carbon source deficit-carbon sink surplus” cities included Beijing, Baoding, and Cangzhou (payment areas where net ECT input exceeded CSS output) versus Langfang (compensation-receiving area showing the inverse relationship); (3) “Carbon source surplus-carbon sink deficit” cities featured Tianjin (payment area with CSS input > ECT output) versus Tangshan and Handan (compensation-receiving areas); (4) The CSS-neutral cities (Shijiazhuang, Hengshui, Xingtai) followed ECT-only compensation logic, with Shijiazhuang and Hengshui (net ECT input >0) as payment areas and Xingtai as a receiver.
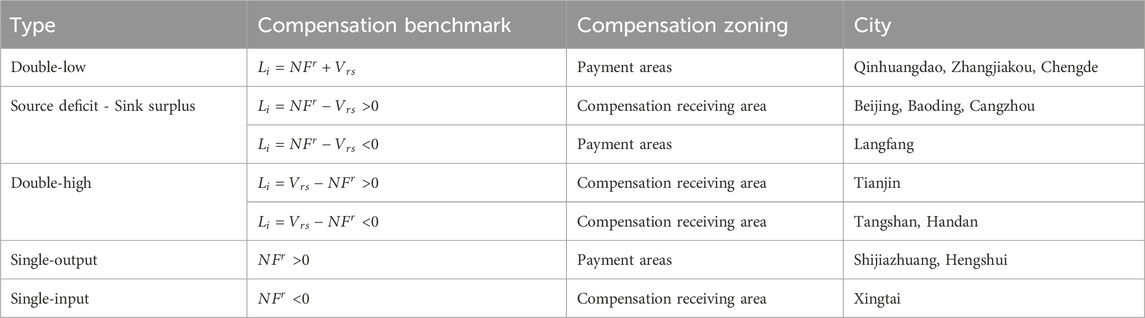
Table 4. Bidirectional’ carbon compensation zoning in BTH.
Based on the carbon compensation benchmarks in Table 4 and Formula 17 calculations, Figure 12 presents the carbon compensation amounts for the 13 BTH cities. Among payment areas: Shijiazhuang, as single-output type city, had the highest total payment of 2.861 billion yuan, with 1.988 billion yuan allocated to Tangshan. Tianjin ranked second with a total amount of 2.730 billion yuan, primarily compensating for CSSF through payments to Chengde (797 million yuan), Langfang (705 million yuan), and Cangzhou (434 million yuan). Hengshui recorded the lowest payment at just 71 million yuan. Among compensation recipients: Chengde received the highest total amount of 2.860 billion yuan, mainly from Tianjin (1.697 billion yuan) and Tangshan (797 million yuan) for carbon sequestration services. Tangshan ranked second with 1.70 billion yuan, primarily from Beijing (499 million yuan), Cangzhou (652 million yuan), and Shijiazhuang (1.988 billion yuan), while Langfang received the smallest amount (47 million yuan).
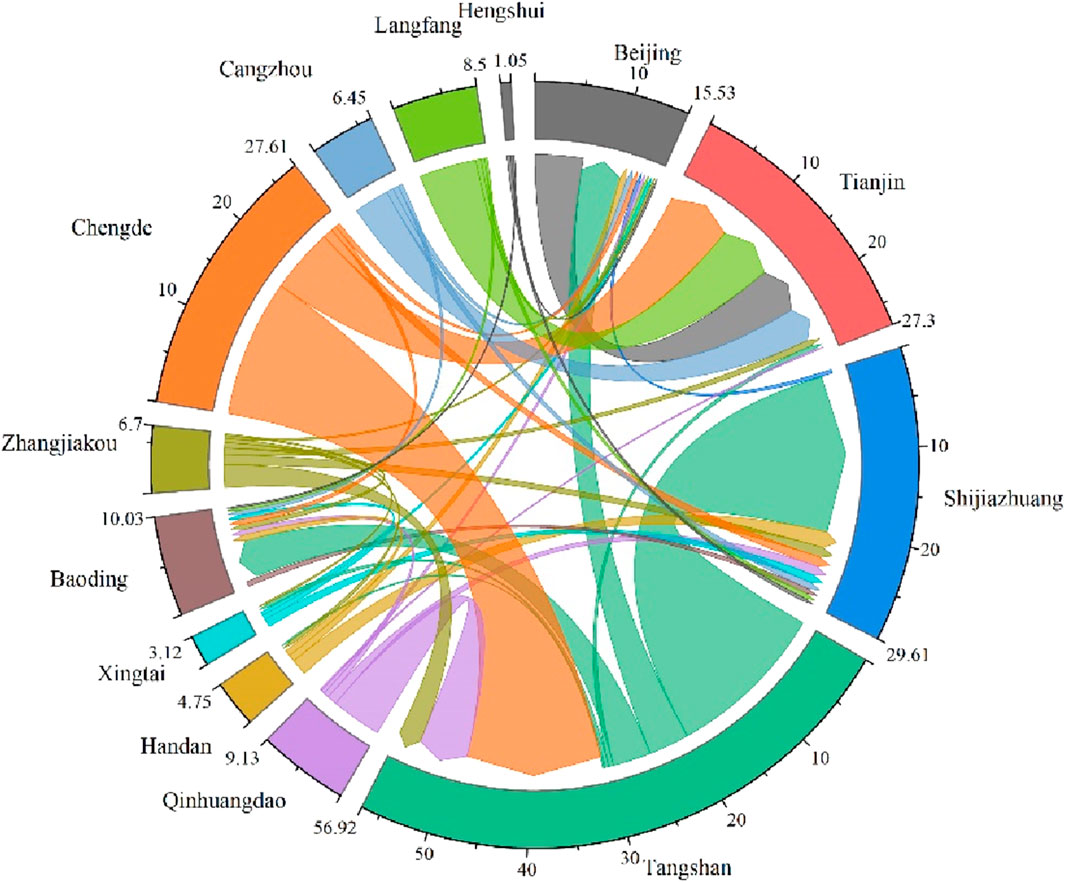
Figure 12. Comprehensive carbon compensation Chart.
5 Discussion
5.1 Carbon compensation mechanism as a key pathway for BTH’s coordinated development
The BTH urban agglomeration demonstrates distinctive spatial characteristics. As the region’s core cities, Beijing and Tianjin are completely geographically encircled by Hebei Province, forming a unique “dual-core surrounded by Hebei” spatial pattern. The three regions have developed close, complex interrelationships and ecological network connections. Under the “relocation of non-capital functions” policy guidance (Jiang et al., 2025), Beijing has been systematically transferring its resource-intensive industries to Tianjin and Hebei, a process accompanied by carbon emissions transfer. Meanwhile, through sustained environmental governance and ecological construction efforts, Beijing has significantly enhanced its carbon sink capacity, transforming from a carbon sink demand area to a carbon sink supply area.
Hebei Province plays multiple functional roles within the BTH region (Lu, 2015). On one hand, industrial cities like Tangshan, Handan, and Xingtai have long supplied essential industrial raw materials such as coal and steel to Beijing and Tianjin. On the other hand, regions like Zhangjiakou and Chengde serve as crucial ecological barriers and water conservation areas, providing key safeguards for regional ecological security. However, this dual role has imposed substantial resource supply and ecological service costs on Hebei Province. The current lack of an institutionalized ecological compensation mechanism (Li and Hu, 2024) fails to safeguard Hebei’s legitimate rights and interests, ultimately leading to regional development disparities. As a crucial economic hub and industrial base in North China (Lu, 2015), Tianjin plays a dual role in the regional carbon cycle, and it absorbs carbon emissions transferred from Beijing while CSS from ecological conservation zones. This dual function highlights the necessity of establishing a carbon compensation mechanism.
The establishment of carbon compensation mechanism is a crucial institutional innovation for achieving high-quality coordinated development in the BTH region. Based on the ‘beneficiary pays’ principle, delineating compensation zones and creating an intercity compensation system can not only clarify the ecological responsibilities of all parties but also regulate regional benefit distribution through market-oriented mechanisms, ultimately achieving three-dimensional synergy among economic development, social equity, and ecological protection. As an innovative policy instrument, this mechanism will provide a significant reference model for promoting sustainable development practices across China.
5.2 Optimizing carbon compensation standards: a core element in mechanism enhancement
Currently, China’s carbon trading market remains in the pilot phase and it is urgent to accelerate the development of a unified national carbon trading market to provide real-time and authoritative price benchmarks for carbon compensation. The compensation standards must prioritize the actual compensation capacity of payers. Research indicates that compensation capacity is primarily influenced by three factors: economic development level, willingness to pay, and social development progress (Chi, et al., 2024).
Using the 2021 national carbon market average trading price as a baseline, this study adjusted the benchmark carbon price to 46.66 yuan/ton by incorporating GDP growth rates. The carbon compensation standards for the 13 cities were then calculated using Formula 18. Spatial analysis conducted through the Natural Breaks method on the ArcGIS platform (Figure 13) revealed significant intercity variations. Beijing has the highest compensation standard (102.65 yuan/ton), followed by Tianjin and Tangshan (30-46 yuan/ton). Shijiazhuang, Qinhuangdao, and Langfang formed the third tier (20-30 yuan/ton), while the remaining cities comprised the lowest tier (12.60–20 yuan/ton). This graduated compensation structure effectively embodies the “common but differentiated responsibilities” principle while comprehensively considering regional development disparities, thereby establishing a scientific foundation for implementing an equitable and effective carbon compensation mechanism.
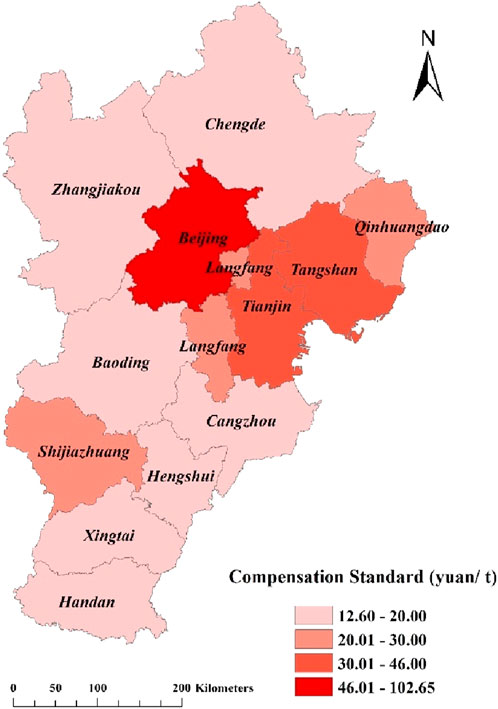
Figure 13. Carbon compensation standards in BTH.
5.3 Comparisons with existing carbon compensation mechanisms
On the one hand, China’s current carbon compensation mechanisms primarily rely on vertical fiscal transfer payments, with representative systems such as the national key ecological function zone transfer payment scheme. These mechanisms typically determine compensation based on administrative boundaries or ecological zone classifications, without fully incorporating interregional carbon transfer responsibilities or the spatial mismatch of carbon sink supply and demand (Zhang et al., 2025). In contrast, the “dual carbon flow coupling compensation framework” proposed in this study introduces two dimensions—embodied carbon transfer and carbon sequestration service flow—to identify the actual carbon burden and ecological contributions among cities, thereby enhancing the precision of spatial compensation zoning and responsibility allocation.
On the other hand, international carbon compensation mechanisms, such as the European Union Emissions Trading System, focus on emission quota trading among member states through market-based pricing mechanisms, emphasizing the economic value of carbon. Forest carbon initiatives like REDD+ (Reducing Emissions from Deforestation and Forest Degradation) primarily aim to incentivize forest conservation in developing countries, with a focus on global emissions reduction rather than correcting regional ecological imbalances (Angelsen, 2009). In comparison, this study addresses the spatial structure of carbon responsibilities at the urban agglomeration scale, emphasizing fairness and coordination in cross-regional ecological compensation. This approach is more suited to China’s multi-administrative regional planning and the governance goal of achieving “regional carbon equity”.
6 Conclusion
6.1 Main conclusion
This study focuses on the increasingly complex pattern of carbon responsibility sharing within the BTH urban agglomeration, aiming to construct an analytical framework for an urban carbon compensation mechanism from the dual dimensions of ECT and CSSF. By employing MRIO model and a coupling method of carbon sequestration service supply and demand, the study systematically identifies the dual carbon source–sink flow pathways among cities, delineates compensation zones, and estimates differentiated compensation amounts. A “Flow–Zoning–Compensation” framework is proposed to provide a quantitative basis for fair and reasonable regional carbon governance.
The main findings are as follows:
(1) From the perspective of ECT, a significant imbalance in carbon responsibility exists within the BTH region. Economically developed cities (e.g., Beijing, Shijiazhuang) and agriculturally dominated cities (e.g., Baoding, Hengshui) are the main net carbon exporters and should be designated as carbon-paying zones. In contrast, resource-based and ecologically functional cities (e.g., Tangshan, Zhangjiakou, Chengde) bear substantial carbon inflows and should be considered as compensation-receiving zones. Shijiazhuang and Tangshan have the highest compensation payment and receipt amounts, respectively, highlighting the spatial displacement of carbon emission pressures.
(2) From the perspective of CSSF, a clear mismatch exists between carbon sequestration supply and demand. The main supply comes from ecological barrier zones such as Chengde and Zhangjiakou, while high carbon demand is concentrated in industrial hubs like Tianjin and Tangshan. The CSSF flows reflect an “ecological output–economic benefit” pattern, providing a rationale for ecological zones to claim compensation.
(3) From an integrated accounting perspective, the urban agglomeration can be divided into six carbon-paying zones and seven carbon-receiving zones. Notably, Shijiazhuang and Chengde represent extremes on both dimensions, indicating the spatial asymmetry and bidirectional interweaving of carbon flows. This zoning provides a spatial basis for the design of a differentiated carbon compensation system.
6.2 Policy recommendations
To promote the effective implementation of a carbon compensation mechanism within urban agglomerations from the perspective of ECT–CSSF coordination, it is recommended to establish a multi-level implementation pathway encompassing four key dimensions: fiscal policy, market mechanisms, financial instruments, and regional governance.
(1) Fiscal dimension: A vertically and horizontally integrated transfer payment system should be established. At the central level, a special ecological compensation fund for the BTH region should be created to coordinate compensation for carbon sequestration contributions from ecologically focused cities. At the provincial level, horizontal fiscal transfer payments should be promoted, with funds allocated based on the precision accounting of dual carbon flows, following the principle of “the more you compensate, the more you receive.” A dynamic carbon flow monitoring mechanism should be introduced to enable real-time adjustments to compensation standards.
(2) Market dimension: Industrial and ecological functional zones should be integrated to promote coordinated development. A “green investment + ecological compensation” bundled mechanism should be established, encouraging industrial cities to offset their compensation liabilities by investing in green projects in ecological zones. Mechanisms for trading ecosystem service products and sharing carbon footprints should be explored to link carbon emission rights with ecological compensation entitlements.
(3) Financial dimension: Efforts should be made to capitalize carbon sequestration resources. Financial instruments such as carbon sequestration-backed loans, insurance, and carbon-based options and futures should be developed to expand financing channels for ecological zones. Regional green funds and green bonds should be encouraged to support ecosystem restoration, the development of carbon neutrality technologies, and the establishment of carbon assessment and certification systems.
(4) Regional governance dimension: A cross-jurisdictional collaborative mechanism for carbon governance should be established. A carbon reduction alliance for the urban agglomeration should be formed to unify accounting standards, assessment frameworks, and regulatory systems. The boundaries of each city’s “carbon account” and corresponding responsibility targets should be clearly defined. Through information sharing and joint enforcement mechanisms, a collaborative carbon governance community that upholds the principles of “shared responsibility and mutual benefit” can be effectively constructed.
6.3 Limitations and outlook
Although this study makes progress in constructing a carbon compensation mechanism, several limitations remain. First, the spatial resolution is constrained by the use of city-level MRIO tables, limiting finer-scale analysis at the county or grid level; future research could integrate remote sensing and big geodata to enhance spatial accuracy. Second, the study focuses solely on intra-regional flows within the Beijing-Tianjin-Hebei urban agglomeration, without accounting for inter-agglomeration exchanges with other regions, which may affect carbon responsibility distributions; future work should broaden the scope to include national-scale interactions. Third, the analysis is based on 2020 data, lacking temporal depth to assess dynamic evolution; constructing time-series MRIO tables would allow examination of changes over time. Finally, due to the unavailability of 2020 MRIO data, the study relies on estimations derived from 2017 data, which may introduce uncertainty; future efforts should refine estimation methods through comparison with official statistics to enhance reliability.
Data availability statement
The raw data supporting the conclusions of this article will be made available by the authors, without undue reservation.
Author contributions
JC: Investigation, Writing – original draft. XL: Visualization, Writing – review and editing. SY: Methodology, Software, Writing – review and editing. XW: Data curation, Formal Analysis, Writing – original draft.
Funding
The author(s) declare that no financial support was received for the research and/or publication of this article.
Conflict of interest
Author SY was employed by North China Engineering Investigation Institute Co., Ltd.
The remaining authors declare that the research was conducted in the absence of any commercial or financial relationships that could be construed as a potential conflict of interest.
Generative AI statement
The author(s) declare that no Generative AI was used in the creation of this manuscript.
Publisher’s note
All claims expressed in this article are solely those of the authors and do not necessarily represent those of their affiliated organizations, or those of the publisher, the editors and the reviewers. Any product that may be evaluated in this article, or claim that may be made by its manufacturer, is not guaranteed or endorsed by the publisher.
References
A. Angelsen (2009). Realising REDD+: national strategy and policy options. Bogor, Indonesia: (CIFOR). doi:10.17528/cifor/002871
Berger, S., Kilchenmann, A., Lenz, O., and Schlöder, F. (2022). Willingness-to-pay for carbon dioxide offsets: field evidence on revealed preferences in the aviation industry. Glob. Environ. Change. 73, 102470. doi:10.1016/j.gloenvcha.2022.102470
Burkhard, B., Kandziora, M., Hou, Y., and Müller, F. (2014). Ecosystem service potentials, flows and demands–concepts for spatial localisation, indication and quantification. Landsc. Online 34, 1–32. doi:10.3097/LO.201434
Chen, H., Wang, E. D., Wang, N., and Song, T. (2023). Research on embodied carbon transfer measurement and carbon compensation among regions in China. Int. J. Environ. Res. Public Health. 20, 2761. doi:10.3390/ijerph20032761
Chi, C., Shen, J. Q., Gao, X., Hu, P., and Yi, P. (2024). Horizontal ecological compensation standards based on ecosystem services flow. Ecol. Indic. 163, 112081. doi:10.1016/j.ecolind.2024.112081
Du, M. Q., and Yang, X. (2024). Horizontal carbon compensation in Guangdong province based on coordinating land use carbon budget under the background of carbon neutrality. J. Soil Water Conserv. 1, 197–206. doi:10.13870/j.cnki.stbcxb.2024.01.026
Du, H. Q., Zhao, L., Zhang, P. T., Li, J., and Yu, S. (2023). Ecological compensation in the beijing-tianjin-hebei region based on ecosystem services flow. J. Environ. Manag. 331, 117230. doi:10.1016/j.jenvman.2023.117230
Fang, G. C., Huang, M., Zhang, W. B., and Tian, L. (2024). Exploring global embodied carbon emissions transfer network—An analysis based on national responsibility. Technol. Forecast. Soc. Change. 202, 123284. doi:10.1016/j.techfore.2024.123284
Fisher, B., Turner, R. K., and Morling, P. (2009). Defining and classifying ecosystem services for decision making. Ecol. Econ. 68 (3), 643–653. doi:10.1016/j.ecolecon.2008.09.014
Gong, S. X., Zhang, Y. L., and Li, Y. H. (2023). Spatio-temporal variation and prediction of carbon storage in beijing-tianjin-hebei region-A PLUS-InVEST model approach. J. Arid. Land Resour. Environ. 6, 20–28. doi:10.13448/j.cnki.jalre.2023.133
Grêt-Regamey, A., Brunner, S. H., and Altwegg, J. (2012). Facing uncertainty in ecosystem services-based resource management. J. Environ. Manag. 196, 376–382. doi:10.1016/j.jenvman.2012.07.028
Han, X., Gao, X., Ahmad, F., Ali Chandio, A., and Khan, S. (2024). Carbon compensation and carbon neutrality: regional variations based on net carbon transfer of trade in China. Geosci. Front. 15, 101809. doi:10.1016/j.gsf.2024.101809
Jia, R. X., and Gao, G. L. (2015). Research on the establishment of a horizontal ecological compensation system among regions. Macroeconomics 3, 13–23. doi:10.16304/j.cnki.11-3952/f.2015.03.002
Jiang, X. M., Ouyang, J., and Zhao, W. R. (2025). Industrial transfer and coordinated emissions reductions in the beijing⁃Tianjin⁃Hebei region. Manag. Rev. 2, 44–56. doi:10.14120/j.cnki.cn11-5057/f.2025.02.003
Kang, B. Y., and Zhu, M. F. (2022). Tourists’willingness to pay for carbon offsets in view of ecotourism: case study of China giant panda national park. J. Arid land resour. Environ. 7, 16–22. doi:10.13448/j.cnki.jalre.2022.168
Li, X. E., and Hu, Y. N. (2024). Measuring regional balance of carbon sequestration from the perspective of supply and demand: a case study of yangtze river Delta ecological greening development demonstration area. Resour. Environ. Yangtze Basin. 1, 55–65.
Li, Q. N., and Yao, J. (2024). Carbon budget pattern and carbon compensation standard of Xinjiang tianshan world natural heritage site. Resour. Ecol. 6, 1–12.
Li, X., Wu, K. N., Feng, Z., and Wang, Y. H. (2022). Carbon balance from the perspective of supply and demand of carbon sequestration services in Henan Province. Acta Ecol. Sin. 23, 9627–9635.
Liu, J. L., and Chen, X. P. (2025). The construction of the compensation mechanism for China's wetland carbon sink market based on carbon trading. Environ. Prot. Sci. doi:10.16803/j.cnki.issn.1004-6216.202412028
Liu, L., Wang, S., Li, W., Liu, J., Zhang, Y., and Li, J. (2020). Applying blockchain in the geoenergy domain: the road to interoperability and standards. Appl. Energy 262, 114545. doi:10.1016/j.apenergy.2020.114545
Lu, D. D. (2015). Function orientation and coordinating development of subregions within the jing-jin-ji urban agglomeration. Prog. Geogr. 3, 265–270. doi:10.11820/dlkxjz.2015.03.001
Luo, M., Zheng, R., Fan, R., Zhang, Y., and Yang, M. (2024). Research on interprovincial embodied carbon transfer network in China and its endogenous dynamic evolutionary mechanism. Sustainability 16 (24), 10814. doi:10.3390/su162410814
Ma, Y. H., Chen, H., Yang, M. M., Aihemaiti, G., Lu, W., and Zhao, R. (2024). Ecological compensation based on multiscale ecosystem carbon sequestration service flow. J. Environ. Manag. 372, 123396. doi:10.1016/j.jenvman.2024.123396
Niu, Z. W., and Zou, Z. X. (2019). Theory and methods of agricultural ecological Compensation—A compensation standard model based on the consistency of ecosystem and ecological value. Manag. World. 11, 133–143. doi:10.19744/j.cnki.11-1235/f.2019.0153
Pang, J., Shi, Y. C., Li, Z. X., and Zhang, J. Z. (2017). Inter-provincial transfer of embodied pollution in Beijing-Tianjin-Hebei region based on the MRIO model. Chin. Environ. Sci. 8, 3190–3200.
Peng, Y. N., Sang, H. Y., Zhai, L., Zhang, Z. Y., and Duan, J. .J. (2024). Study on land use change and spatiotemporal variation of carbon storage in Beijing-Tianjin-Hebei based on InVEST model. Bull. Surv. Mapp. 1, 19–24. doi:10.13474/j.cnki.11⁃2246.2024.0104
Ping, W. Y., and Zeng, K. (2023). Study on standard measure and mechanism construction of China's regional horizontal carbon compensation from the perspective of carbon transfer. J. Beijing Technol. Bus. Univ. Soc. Sci. 6, 85–101. doi:10.12085/j.issn.1009⁃6116.2023.06.008
Rao, Q., Lin, X., Chen, F., Chen, W., Lin, Y., and Zeng, Y. (2022). Research into an ecological compensation standard in the minjiang river basin under the combined scenario of 'clear property rights, water quality and quantity, and opportunity cost. Water Sci. and Technol. Water supply 10, 7873–7883. doi:10.2166/ws.2022.307
Tang, Y., Wang, R., Ci, H., Wei, J., Yang, H., Teng, J., et al. (2024). Analysis of the spatiotemporal evolution of carbon budget and carbon compensation zoning in the core area of the Yangtze River Delta Urban Agglomeration. Land 13, 747. doi:10.3390/land13060747
Wang, C. D., Li, W. Q., Sun, M. X., Wang, Y., and Wang, S. (2021a). Exploring the formulation of ecological management policies by quantifying interregional primary ecosystem service flows in yangtze river Delta region, China. J. Environ. Manag. 284, 112042. doi:10.1016/j.jenvman.2021.112042
Wang, Y. N., Wang, X. B., Chen, W., Qiu, L., Wang, B., and Niu, W. (2021b). Exploring the path of inter-provincial industrial transfer and carbon transfer in China via combination of multi-regional input–output and geographically weighted regression model. Ecol. Indic. 125, 107547. doi:10.1016/j.ecolind.2021.107547
Wang, Q., Liu, S., Wang, F., Liu, H., Liu, Y., Yu, L., et al. (2022). Quantifying carbon sequestration service flow associated with human activities based on network model on the Qinghai-Tibetan Plateau. Front. Environ. Sci. 10, 900908. doi:10.3389/fenvs.2022.900908
Wang, W. Z., Hu, Y., and Zhang, X. Y. (2023). Comparison of carbon emission responsibility allocation methods and carbon compensation design among provinces in China. Resour. Sci. 10, 1913–1930. doi:10.18402/resci.2023.10.01
Wang, C. H., Li, B. Y., Li, J., Bai, J., and Zhang, Y. (2024). Adaptive management of Mountain ecosystems based on carbon sequestration: based on the “state-flow-utility” framework. Ecol. Indic. 168, 112703. doi:10.1016/j.ecolind.2024.112703
Wiedmann, T., Lenzen, M., Turner, K., and Barrett, J. (2007). Examining the global environmental impact of regional consumption activities — part 2: review of input–output models for the assessment of environmental impacts embodied in trade. Ecol. Econ. 61 (1), 15–26. doi:10.1016/j.ecolecon.2006.12.003
Wu, J. S., Fan, X. N., Li, K. Y., and Wu, Y. W. (2023). Assessment of ecosystem service flow and optimization of spatial pattern of supply and demand matching in pearl river Delta, China. Ecol. Indic. 153, 110452. doi:10.1016/j.ecolind.2023.110452
Wu, A. B., Chen, F. G., Zhao, Y. X., Qin, Y. J., Liu, X., and Guo, X. P. (2024a). Multi-scenario simulation of construction land expansion and its impact on ecosystem carbon storage in Beijing-Tianjin-Hebei Urban Agglomeration. Environ. Sci. 5, 2828–2839. doi:10.13227/j.hjkx.202305221
Wu, C. S., Lu, R. R., Zhang, P., and Dai, E. F. (2024b). Multilevel ecological compensation policy design based on ecosystem service flow: a case study of carbon sequestration services in the Qinghai-Tibet Plateau. Sci. Total Environ. 921, 171093. doi:10.1016/j.scitotenv.2024.171093
Xi, H. H., Liu, X. D., Ding, X., Huang, C., Tao, Y., Tao, Q., et al. (2024). Incorporating embodied carbon transfer and sequestration service flows into regional carbon neutrality assessment in China. Sustain. Prod. Consum. 51, 432–444. doi:10.1016/j.spc.2024.10.003
Xia, M. Y., Chuai, X. W., Xu, H. B., Cai, H. H., Xiang, A., Lu, J., et al. (2023). Carbon deficit checks in high resolution and compensation under regional inequity. J. Environ. Manag. 328, 116986. doi:10.1016/j.jenvman.2022.116986
Xu, L., He, N. P., and Yu, G. R. (2019). A dataset of carbon density in Chinese terrestrial ecosystems (2010s). China Sci. Data. 1, 90–96. doi:10.11922/csdata.2018.0026.zh
Yang, W., Gong, Q., and Zhang, X. (2020). Surplus or deficit? Quantifying the total ecological compensation of beijing-tianjin-hebei region. J. Geogr. Sci. 30, 621–641. doi:10.1007/s11442-020-1746-3
Yang, S., Fu, W., Hu, S., and Ran, P. (2022). Watershed carbon compensation based on land use change: evidence from the yangtze river economic belt. Habitat Int. 126, 102613. doi:10.1016/j.habitatint.2022.102613
Yang, R. F., Jin, X. F., Zhou, H. W., Ren, F., Zhang, X. C., Ma, Z. Z., et al. (2024). Regional differences in carbon budgets and inter-regional compensation zoning: a case study of Chongqing, China. Land 13, 1495. doi:10.3390/land13091495
Ye, Z. (2012). The method of update input-output data and application in the analysis of carbon emissions. Stat. Inf. Forum. 9: 39–44.
Yuan, X., Sheng, X., Chen, L., Tang, Y., Li, Y., Jia, Y., et al. (2022). Carbon footprint and embodied carbon transfer at the provincial level of the yellow river basin. Sci. Total Environ. 1, 149993. doi:10.1016/j.scitotenv.2021.149993
Zhai, T., Zhang, D., and Zhao, C. (2021). How to optimize ecological compensation to alleviate environmental injustice in different cities in the yellow river basin? A case of integrating ecosystem service supply, demand and flow. Sustain. Cities Soc. 75, 103341. doi:10.1016/j.scs.2021.103341
Zhai, T. L., Wu, L. K., Chen, Y. M., Nazir, M. F., Chang, M., Ma, Y., et al. (2022). Ecological compensation in the context of carbon neutrality: a case involving service production-transmission and distribution-service consumption. Land 11, 2321. doi:10.3390/land11122321
Zhang, K. L., He, L., and Lu, H. W. (2023). Carbon transfer characteristics and its effect on carbon neutrality of China's inter-regional trade. Acta Ecol. Sin. 9, 3407–3416. doi:10.5846/stxb202108082170
Zhang, X. D., Fu, W. H., and Pei, Z. T. (2025). Dual carbon compensation mechanism in Chinese agriculture from the perspective of horizontal and vertical integration. Chin. Popul. Resour. Environ. 35 (4), 84–98.
Zhao, R. Q., Liu, Y., Ma, L., Li, Y. X., Hou, L. P., Zhang, Z. P., et al. (2016). County-level carbon compensation of Henan Province based on carbon budget estimation. Nat. Resour. J. 31, 1675–1687.
Zhong, S. Y., Zhang, X. M., Wu, J., Wu, N., Feng, Q., and Ze, Q. (2023). Carbon offsetting mechanism of China province based on carbon reduction cost. Environ. Sci. 8, 4637–4646. doi:10.13227/j.hjkx.202209038
Zhu, K., Liu, Q., Xiong, X., Zhang, Y., and Wang, M. (2022). Carbon footprint and embodied carbon emission transfer network obtained using the multi-regional input-output model and social network analysis method: a case of the hanjiang river basin, China. Front. Ecol. Evol. 10, 941520. doi:10.3389/fevo.2022.941520
Keywords: embodied carbon transfer, carbon sequestration service flow, flow-zoning-compensation, carbon compensation, Beijing-Tianjin-Hebei urban agglomeration
Citation: Chen J, Liu X, Yang S and Wang X (2025) Towards a carbon compensation framework: integrating embodied carbon transfer and carbon sequestration service flows in urban agglomerations. Front. Environ. Sci. 13:1647605. doi: 10.3389/fenvs.2025.1647605
Received: 16 June 2025; Accepted: 28 July 2025;
Published: 14 August 2025.
Edited by:
Fengtao Guang, China University of Geosciences Wuhan, ChinaCopyright © 2025 Chen, Liu, Yang and Wang. This is an open-access article distributed under the terms of the Creative Commons Attribution License (CC BY). The use, distribution or reproduction in other forums is permitted, provided the original author(s) and the copyright owner(s) are credited and that the original publication in this journal is cited, in accordance with accepted academic practice. No use, distribution or reproduction is permitted which does not comply with these terms.
*Correspondence: Xiangmin Liu, bGl1eGlhbmdtaW4yMDE1QDE2My5jb20=