 Tianle Ma
 Wenhao Cheng
 Wenxuan Yao
- College of Geography and Planning, Ningxia University, Yinchuan, China
Habitat quality (HQ) is recognized as a significant factor in biodiversity maintenance and ecological conservation advancement, and the land-use cover change (LUCC) can directly affect the spatial pattern and evolution of HQ. Land-use datasets spanning 2010, 2015, and 2020 were analyzed through the integrated application of the future land-use simulation (FLUS) model and the integrated valuation of ecosystem services and trade-offs (InVEST) model, supplemented by multiple analytical indicators, resulting in LUCC patterns and HQ variations being investigated within the urban agglomeration along the Yellow River in Ningxia, China. These findings demonstrate (Hall, Wiley on behalf of the Wildlife Society, 1997, 25(1), 173–82) a reduction in ecological land coverage during the previous period, which correlates with a decrease in the mean HQ. The value ratings in 2010, 2015, and 2020 were 0.4919, 0.4730, and 0.4654, respectively. Moreover, the evolution characteristics exhibited distinct divergence trends between the periods of 2010–2015 and 2015–2020. The spatial distribution showed a pronounced periphery–core gradient (Fahrig, Eution, and Systematics, 2017, 48(1), 1–23). The study area’s HQ was categorized within the moderate-to-good range, with mean values demonstrating a descending sequence: EPS (0.5348) > NDS (0.5165) > FSS (0.4967) > EDS (0.4681). Optimal ecosystem service performance was observed in the Helan Mountain Nature Reserve and Yellow River mainstream (Alaniz et al., Ecological Indicators, 2021, 126). Scenario modeling revealed that ecological conservation measures effectively enhanced biodiversity preservation and ecosystem service capacity. Scenario optimization was determined through the combined evaluation of ecological resource support limit and territorial development suitability. Multi-scenario methods and environmental simulation models were integrated in this study, enabling a more accurate assessment of the landscape spatiotemporal pattern. This approach provides decision-making insights and multiple perspectives for spatial planning under different developmental goal orientations.
1 Introduction
Habitat quality (HQ) is an ecosystem’s capability of providing organisms with the ability for growth, development, reproduction, and distribution under specific spatial and temporal conditions (Hall, 1997; Fahrig, 2017; Alaniz et al., 2021). It plays a significant role in regional biodiversity and regional protection ecological security, as suitable HQ can maintain the ecological balance and guarantee ecological services (Li et al., 2024a; Mortelliti et al., 2010; Regolin et al., 2021). Currently, numerous HQ research studies are based on land-use cover change (LUCC), and they mainly focus on the quantitative evaluation of the spatiotemporal features, investigation of the driving factors, and assessment of the future scenarios within modeling and simulation (Wang et al., 2023; M´elanie et al., 2024; You et al., 2025). The LUCC reflects natural environmental changes and human activities, including the proportions, structure, and intensity of land-use types (Pratzer et al., 2025; Thomas et al., 2021). It can alter the composition and structure of HQ by affecting matter and nutrient cycling, as well as the energy flow among habitat patches (Xu et al., 2023; Kong et al., 2022). However, future social and economic developments often face various black swan events, such as COVID-19 and the Russo-Ukrainian conflict. It could disrupt the established developmental paths of both global and regional systems. Meanwhile, there are differences in developmental priorities that differ between regions and even with the same region at different stages. Thereby, multiple scenarios should be arranged, as it can cope with various issues and possibilities that may arise in future development (Budnik et al., 2020; Ma et al., 2023). The future land-use simulation model (FLUS) is universally employed to analyze future land-use changes across various periods and scenarios, and it shows a high level of simulation precision (Liu et al., 2017). Additionally, the FLUS model enhanced the capability of addressing uncertainties and complexities associated with future developmental scenarios (Zhang et al., 2023). Current methodologies for quantifying HQ predominantly rely on ecological assessment frameworks, with the integrated valuation of ecosystem services and trade-offs (InVEST) model’s HQ module being widely adopted because of its simplified operational stipulation and accessibility of input data. This model enables systematic analysis of habitat sensitivity to anthropogenic or environmental threats while simultaneously evaluating the interrelationships and mutual influences among such stressors (Moreira et al., 2018; Kadaverugu et al., 2020; Zhang et al., 2022). The combination of the FLUS and the InVEST models can establish an ecological index that can be coupled with land-use characteristics (Babbar et al., 2021; Zhang et al., 2025). By setting up different scenarios, it provides guidance for the optimal development mode to improve the ecological indicators in the study area (Kunwar et al., 2018; Wu et al., 2025a). Moreover, it allows for an understanding of the evolution of habitats in light of the present circumstances (Xiao et al., 2022). The Ningxia section of the Yellow River Basin (YRB) urban agglomeration represents a significant desert-oasis area, with the important task of guaranteeing ecological stability in northwestern China. However, as HQ is located in an ecologically fragile region, it is facing destruction and degradation issues, and the human–land-use conflict has emerged as a major challenge (Wang et al., 2019). Hence, there is an inevitable need to establish and enhance the HQ within the research region. Therefore, we systematically characterized the HQ on the basis of LUCC, presenting the differentiated needs of future multiple developmental scenarios (Wu et al., 2025a). Meanwhile, we aimed to analyze the possible trends and evolution laws of HQ and formulate scientific and reasonable ecological protection strategies. The key goals of this study were to (Hall, 1997) explore the evolution characteristics of LUCC and HQ in the past years (Fahrig, 2017), simulate the multi-scenario patterns of LUCC and HQ in 2035 (Alaniz et al., 2021), and plan the optimization strategies of HQ.
2 Materials and methods
2.1 Study area and data processing
2.1.1 Study area
Situated within the upper reaches of the YRB in China, the Ningxia YRB urban agglomeration is characterized by continental arid to semi-arid climate (Figure 1). This region encompasses 13 county-level administrative units, spanning 22,700 km2. The area accommodates 70.10% of Ningxia’s permanent population and generates 81.23% of the GDP. The Yellow River flows in the southwest–northeast direction through the territory, sustaining biodiverse wetland ecosystems while supplying irrigation water for agricultural activities and industrial operations. Developmental strategies emphasizing the economic growth and ecological conservation have been prioritized in alignment with national directives (Guan et al., 2023; Wang et al., 2022; Cheng et al., 2024). Functioning as a transitional desert-oasis system, agglomeration borders three major deserts, including the Ulan Buh, Mu Us, and Tengger deserts (Liu et al., 2020), along its northern, eastern, and western peripheries, respectively (Liu et al., 2020). Land cover analysis reveals grassland (45.8%) and cropland (24.4%) as the predominant categories, followed by ecological reserves comprising forest (5.6%) and aquatic systems (5.1%). The remaining territories are classified as unused land (10.6%) and developed urban areas (8.4%).
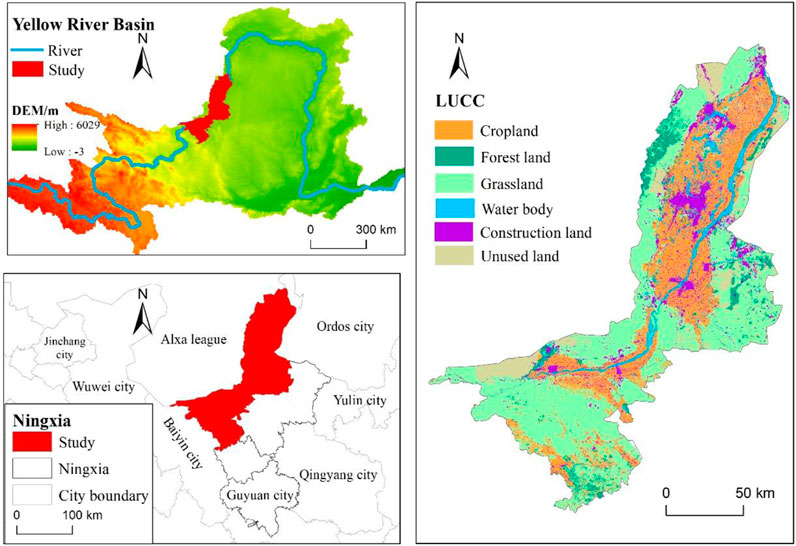
Figure 1. Geographic position of the research region.
2.1.2 Data sources
Essential datasets including formats, sources, and methodological parameters are systematically summarized in Table 1. Land-use classification involved six distinct categories: cropland, forest land, grassland, water body, construction land, and unused land. Spatial data processing incorporated grid standardization to 90 m × 90 m resolution prior to analytical computations.
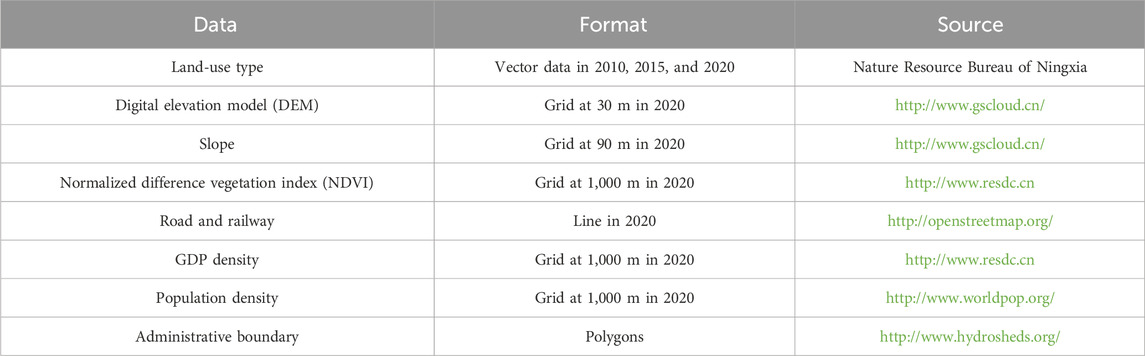
Table 1. Key datasets utilized for the study.
2.2 Methods
The study’s progression flowchart is illustrated in Figure 2, and it comprises two primary stages: predicting the land demands using the FLUS model (see Section 2.2.1) and simulating HQ based on the land-use pattern using the InVEST model (see Section 2.2.2).
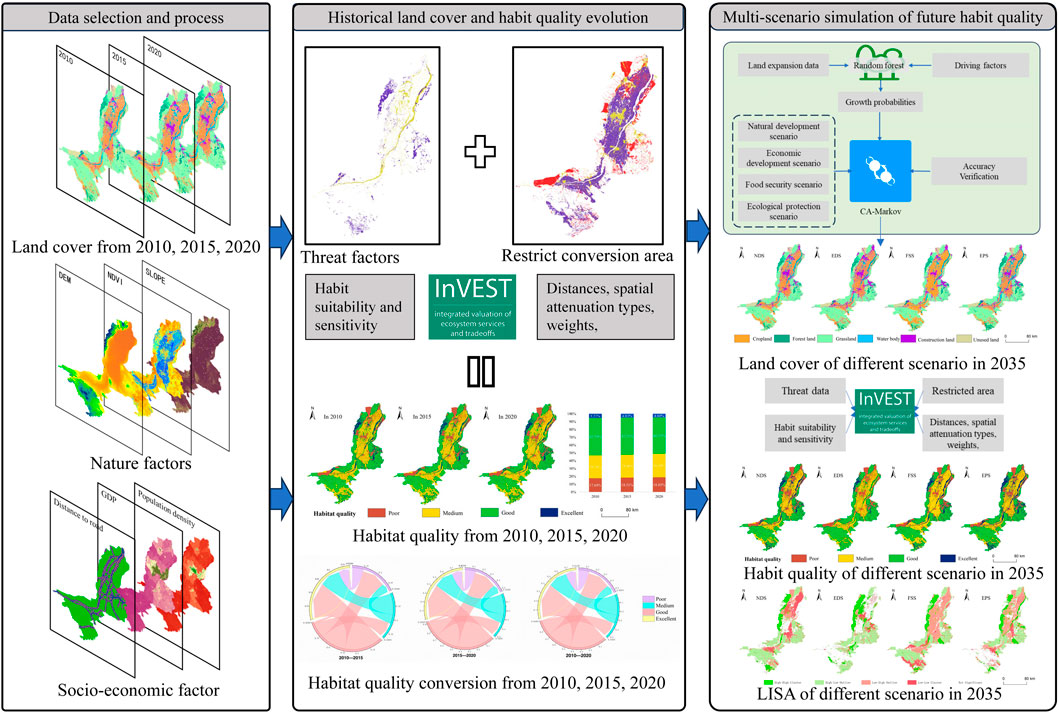
Figure 2. Research framework.
2.2.1 Multi-scenario land-use prediction
The simulations of land-use patterns were executed through the FLUS model, which integrates three functional components through hierarchical coupling (Hall, 1997), namely, transition probability estimation via artificial neural network (ANN)-based computational algorithm (Fahrig, 2017); spatial allocation optimization through self-adaptive mechanisms resolving inter-category competition, implemented via a conversion matrix framework (Alaniz et al., 2021); and demand-driven pattern projection combining cellular automata and Markov chain principles, enabling precise quantification of landscape evolution drivers and high-accuracy spatial simulations (Li et al., 2023; Liang et al., 2018a).
2.2.1.1 Driving factors of LUCC
Driver variables were systematically categorized through synthesized analysis of established methodologies and regional biophysical characteristics, comprising two principal domains (Hall, 1997), namely, natural parameters including the digital elevation model (DEM), slope, and normalized difference vegetation Index (NDVI) (Fahrig, 2017), and socioeconomic indicators involving transportation network proximity, GDP, and population density. Land-use conversion probabilities were subsequently derived through analytical synthesis of these determinants. Occurrence likelihoods for distinct land categories were quantified within the output architecture of the ANN using stochastic sampling-calibrated algorithms, with the computational framework implementing the following mathematical formula (Liang et al., 2018b):
The parametric formulation was structured as follows: p (p, k, t) mathematically defined the occurrence likelihood of land category k within temporal interval p at spatial coordinate t. Weighting coefficients were parameterized through adjacency relationships, with wjk representing hidden-output layer connections and wij characterizing hidden-input layer linkages. Signal transformation employed a sigmoid nonlinear operator, where netj (p, t) quantified the aggregated synaptic inputs to processing node j. Here, xi (p, t) symbolized input neuron i as its activation state at the spatiotemporal position.
2.2.1.2 Conversion matrices and neighborhood effects
A self-adaptive optimization framework combining intrinsic competition mechanisms was established through synergistic incorporation of conversion matrices and neighborhood effects within the CA architecture. Land-use transition logic was formalized via binary conversion rulesets, where permissible transformations were governed by dichotomous coding principles (1: authorized type conversion and 0: transition prohibition) as per established methodological precedents (Mondal et al., 2016). The structured interoperability between land categories under these constraints was tabulated as shown in Table 2.
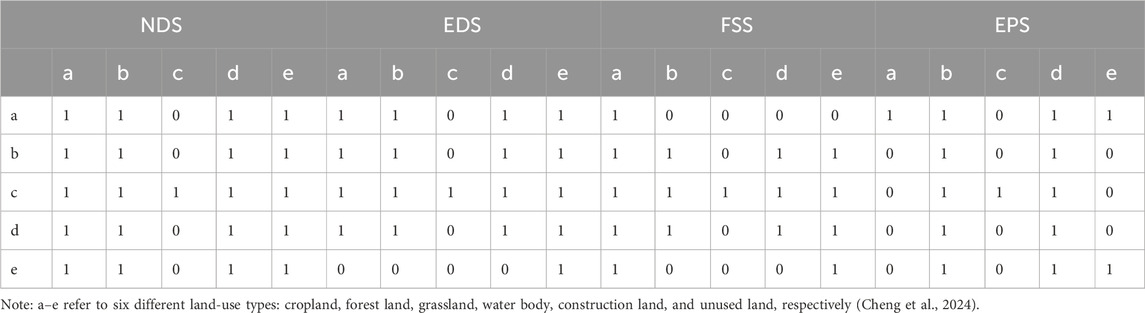
Table 2. Land-use transition matrices for the four scenarios.
The neighborhood influences indicate the land-use types’ expansion intensity, and they reveal how external factors influence the expansion capability of each land-use type. Within the 0–1 threshold range, higher values represent a stronger capacity for expansion (Cheng et al., 2024; Lin et al., 2022). Table 3 shows this effects’ value.

Table 3. Neighborhood effects of each land-use type.
2.2.1.3 Land-use demand in multiple scenarios
The Markov chain predicts future trends by evaluating the initial probabilities of various land-use conditions and the probabilities of transitions between different land-use states. The formula for this calculation (Jokar Arsanjani et al., 2013) is
where S(t) represents the state matrix at time t and S(t+1) represents the state matrix at time t+1, whereas Pij denotes the transfer probability matrix from type i to j.
Four developmental frameworks were formulated through the synthesis of regional policy directives and biogeographical characteristics (Hall, 1997), namely, the natural development scenario (NDS): a framework where historical land-use transition patterns were extrapolated without anthropogenic intervention (Fahrig, 2017); the economic development scenario (EDS): an anthropogenically prioritized framework inducing 40% expansion in urban–rural interface zones and concurrently implementing 10% reduction coefficients for non-construction land transitions (Alaniz et al., 2021); the food security scenario (FSS): an agro-centric developmental paradigm applying 30% weighting premium on cultivated land retention with a parallel 10% diminishment of competing land conversion probabilities (Li et al., 2024a); and the ecological protection scenario (EPS): an ecological optimization framework mandating 40% conversion intensification toward vegetated matrices alongside 10% transition suppression for non-ecological land classes. This policy-constrained scenario modeling integrated spatial governance schemata with ecological conservation imperatives through differential transition elasticity parameters.
2.2.1.4 Model validation
Model validation protocols were executed through the integration of Kappa concordance metrics and categorical accuracy assessments in alignment with established methodological frameworks. A Kappa value exceeding the 0.80 benchmark threshold demonstrated robust model performance (Lin et al., 2020).
2.2.2 The InVEST model
The HQ reflects the intensity of human activities. Currently, the higher the intensity of human activities, the stronger the intimidation to HQ (Gashaw et al., 2021). The assessment within the HQ module of the InVEST framework was executed through dual analytical dimensions, namely, synergistic stressors interactions between land cover typologies (as specified in Table 4) and multi-parameter ecological determinant integration. Habitat suitability coefficients, spatial stressor sensitivity, proximity decay gradients, and anthropogenic impact weights were methodically synthesized for comprehensive degradation index derivation, with all model parameters systematically weighted, as shown in Table 5. The calculation is as follows:
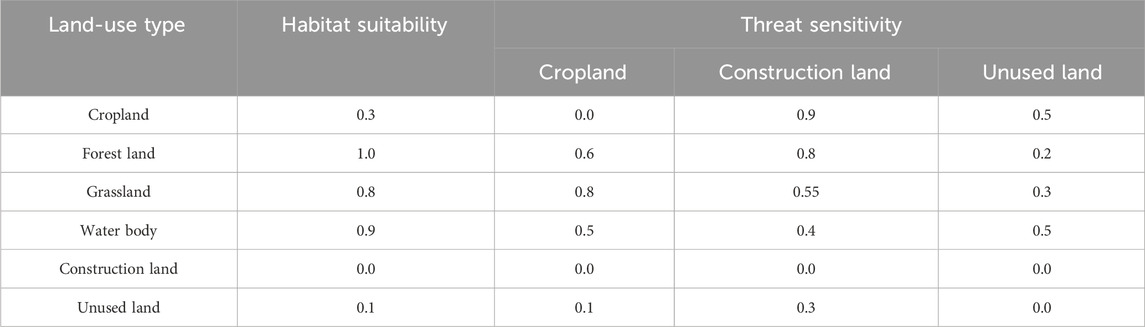
Table 4. Habitat suitability and threat sensitivity for various land-use types.
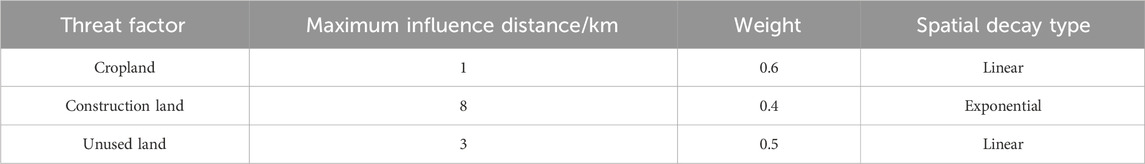
Table 5. Maximum impact distance and weight of threat factors.
The optimized version with reduced similarity is as follows: Qxj represents the HQ score of grid x for land-use category j, Hj denotes the suitability of habitat for land-use type j, Dxj z reflects the habitat degradation level that occurs in grid x in land-use type j, z denotes a predefined coefficient in the model, and k is a half-saturation coefficient, which is commonly assigned a value of 0.5 (Han et al., 2024).
Habitat degradation indices Dxj were computed through the integrative assessment of anthropogenic stressors, where r denoted categorized land-use pressures and R indicated their cumulative count. Spatial influence matrices y weighted threat propagation from source grids, where Yr referred to the total grid number for threat source r, wr denotes the threat source weight, and ry denoted grid threat value y. Additionally, irxy reflected the impact from the threat source within grid x, and βx represented the susceptibility to threat factor. Sjr represented the rapid ecological encroachment drivers, including cultivated zones, urbanized areas, and nonproductive terrains.
HQ values were calibrated on a 0–1 continuum and stratified into four discrete tiers: 0–0.1 (poor), 0.1–0.5 (medium), 0.5–0.8 (good), and 0.8–1 (excellent), corresponding proportionally to the ecosystem service capacity and biodiversity conservation potential. Elevated HQ metrics indicated enhanced ecological integrity and species preservation viability.
3 Results
3.1 Historical land-use cover change and habitat quality evolution
3.1.1 Spatiotemporal evolution of historical land-use types
From 2010, 2015, and 2020, cropland and construction land showed an expansion trend, whereas other land-use categories experienced a reduction during this period (Figures 3, 4), and it exhibited distinct divergence between the first 5 years and the following 5 years. Cropland was distributed in the Yingchuan Plain and Weining Plain, which were irrigated by the Yellow River. The proportion of cropland increased from 23.86% to 24.33% during the 10 years due to the implementation of a permanent basic farmland protection policy. However, the cropland area slightly decreased from 23.86% to 23.73% during 2010–2015. Cropland was mainly transformed from grassland, construction land, and unused land. Due to rapid urbanization, the proportion of construction land increased from 6.52% to 8.40%. Construction land comprised urban construction, rural construction, and transportation land, which was converted from cropland, grassland, and pre-existing construction land, and the transformation rate in 2010–2015 was approximately twice that of the 2015–2020 period. Ecological land, including forest land and water bodies, declined and was converted into cropland and construction land. Therefore, conducting ecological restoration in the research regions was an urgent task. The area of water body remained stable in the first 5 years, but its proportional coverage in the total area exhibited a 0.11% decline during the following 5 years. The forest land conversion rates experienced nearly identical trends in the two distinct time periods.
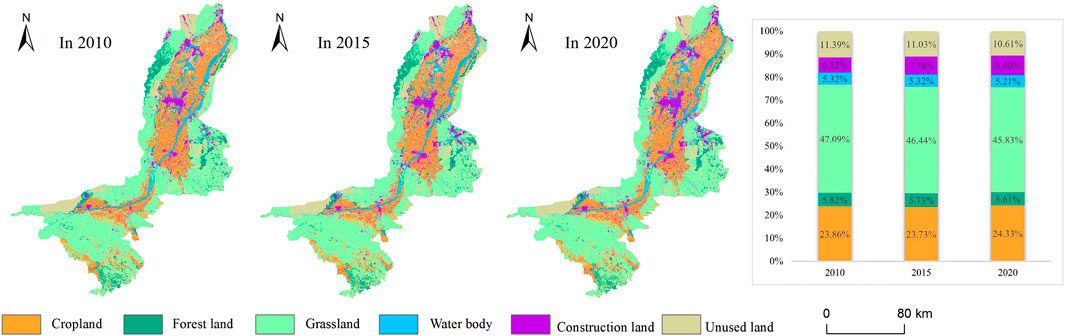
Figure 3. Schematic diagram of land-use types from 2010, 2015, and 2020.
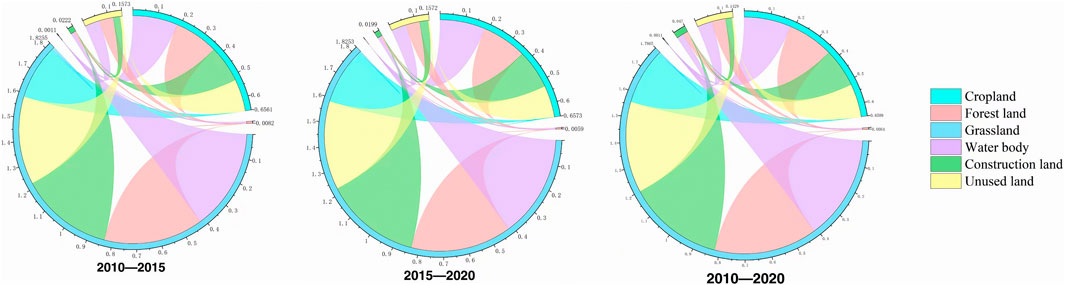
Figure 4. Land-use types conversion from 2010, 2015, and 2020.
3.1.2 Spatiotemporal evolution of historical habitat quality
Across 2010, 2015, and 2020, the mean HQ of the study area showed a downward trend, with values of 0.4919, 0.4730, and 0.4654 in the corresponding years, respectively. It exhibited obvious spatial differences, which contain two categories, namely, medium HQ and good HQ (Figure 5). The spatial pattern with the superior HQ was located in the periphery of the study area, especially in the Helan Mountain Nature Reserve and the Yellow River mainstream. The spatial pattern with inferior HQ was located in the central region, particularly in cities and farm zones. The distribution of HQ levels in various zones was improved due to ecological restoration. At the same time, other zones were degraded as a consequence of social and economic advancement. These two zones were interspersed with each other. The quantitative evaluation of HQ was based on the change between each pair of land-use types. The results indicated that the HQ in the study area exhibited a declining trend for 2010, 2015, and 2020, with significant differences observed between the first 5 years and the following 5 years (Figure 6). Unfortunately, the ratio of areas with excellent HQ diminished from 5.27% to 4.60% during the 10 years, and the diminishment rate in 2010–2015 was more than twice that of 2015–2020. The ratio of areas with poor HQ increased from 17.68% to 18.85%, and the expansion rate showed a significant deceleration during the following 5 years. The ratio of areas with good HQ dropped from 47.79% to 46.35%, and the ratio of areas with medium HQ ascended from 29.24% to 30.20%. Both types demonstrated a trend in which the change rates during the following 5 years surpassed those of the first 5 years.
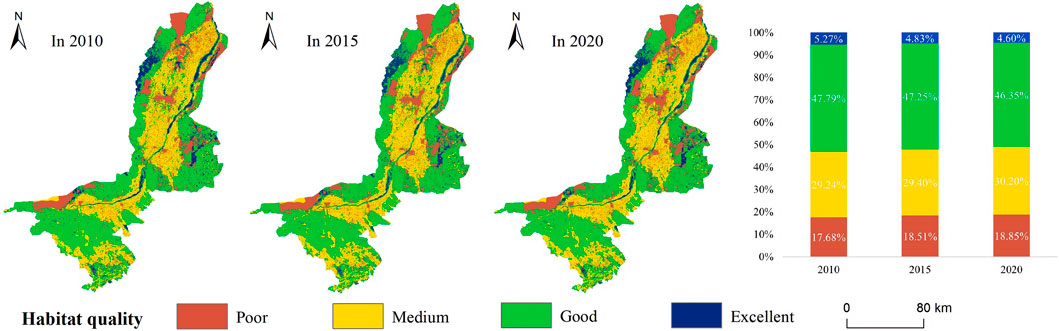
Figure 5. Schematic diagram of habitat quality from 2010 to 2020.
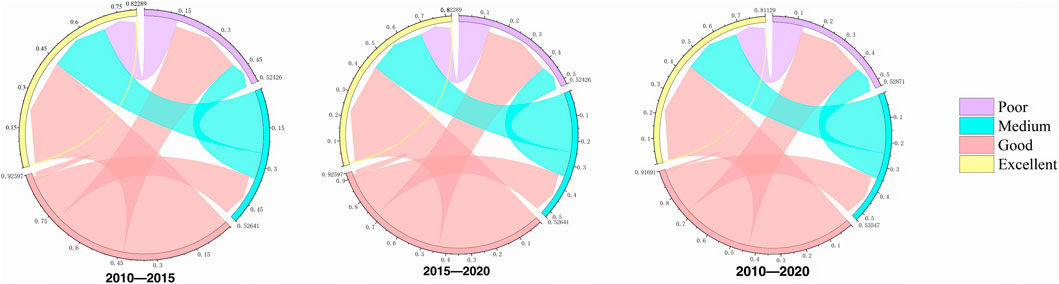
Figure 6. Habitat quality conversion from 2010 to 2020.
3.2 Future habitat quality pattern under multiple scenarios
3.2.1 Land-use types across multiple scenarios in 2035
Simulation-output consistency was empirically verified against 2010–2020 observational datasets, yielding superior agreement levels quantified by a Kappa coefficient of 0.8652 accompanied by 90.47% overall accuracy. Based on the result of model validation, we simulated multiple scenarios in 2035 and found that the land cover configurations across all scenarios demonstrated sustained dominance by grassland and cropland systems, mirroring the spatial patterns of 2020, as demonstrated in Figure 7. Under the NDS, grassland ecosystems (44.17%) exhibited concentrated distribution clusters across central–southern sectors, whereas cropland formations (25.73%) were distributed along the Yellow River’s agricultural axial belt, particularly within intensive cultivation zones of the Yinchuan and Weining Plains. Marginal proportions were maintained by forest land (5.32%) and water body (5.04%), with arboreal concentrations restricted to protected highland preserves, Zhongwei Forest Farm, and the south foot of Xiangshan and Baijitan nature reserves. The water bodies included the Yellow River, Yuehai Lake, Sha Lake, Xinghai Lake, and other lakes. Construction land accounted for 9.82% of all land-use types, indicating typical characteristics of the response to human activity. Urban land was located in prefecture-level cities and county-level towns, and rural land was scattered in patches across the area. Transportation land sprawled in strips, extending from the north to the south across the plain. Unused land accounted for 10.35% of all land-use types. Spatial analysis revealed predominant concentrations across three aeolian geomorphic zones: the Shapotou sand-drift region, transitional edges of the Mu Us sandy land, and low vegetation coverage areas exemplified by the Shitanjin mining district. Under the EDS, rapid industrialization and urbanization drove the significant ectasia of construction land, expanding it by 888 km2 (a 23.6% increase) relative to that under the NDS. Under the FSS, the cropland area increased by 1,399 km2 (an 8.4% increase) through the enforcement of national cropland preservation mandates, whereas the EPS achieved concurrent gains in forest land (485 km2; a 5.2% increase) and water body (458 km2; a 12.7% increase) via strategic ecological barrier construction and water-system restoration projects, respectively.
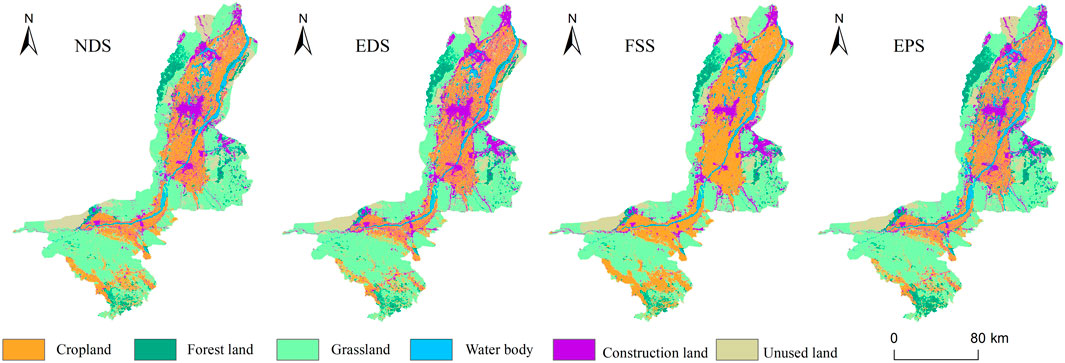
Figure 7. Schematic diagram of land-use types under various scenarios in 2035.
3.2.2 Multi-scenario simulation and Anselin Local Moran Ⅰ analysis of habitat quality in 2035
As depicted in Figure 8, it can be observed that the HQ spatial pattern exhibited notable convergence across different scenarios, with the dominant pattern of HQ levels being medium and good. Additionally, a strong spatial coupling relationship existed between HQ levels and land cover types. The average HQ followed the order EPS (0.5348)> NDS (0.5165)> FSS (0.4967)> EDS (0.4681). Under the NDS, the proportion of area with good HQ accounted for 65.00% of the total HQ, showing high similarity to the geographic distribution of grassland coverage. The proportion of area with medium HQ accounted for 37.96% of the total, demonstrating a spatial distribution coupling relationship of the cropland cover area. The proportion of area with excellent HQ accounted for 13.88% of the total, which also shows a coupling relationship with the region of ecological lands, which were located in the nature reserves, major rivers, and lakes. The area with poor HQ constituted 27.90% of the total, exhibiting that the distribution pattern was analogous to construction land and unused land, such as cities, villages, and deserts, among others. Under the EDS, the area with excellent HQ decreased by 80.28% due to the rapid urban expansion compared to that under NDS. Simultaneously, the area with poor HQ increased by 16.36%, reaching an area of 88,032 km2. The HQ level in the Yellow River transformed from excellent to second grade. The area with medium HQ expanded rapidly, and the area with good HQ was shown as the opposite of the former under the FSS, driven by the cropland protection policy. The policy also contributed to the restoration of the land-use types with poor HQ. On the contrary to EDS, the area with excellent HQ increased significantly under the EPS.
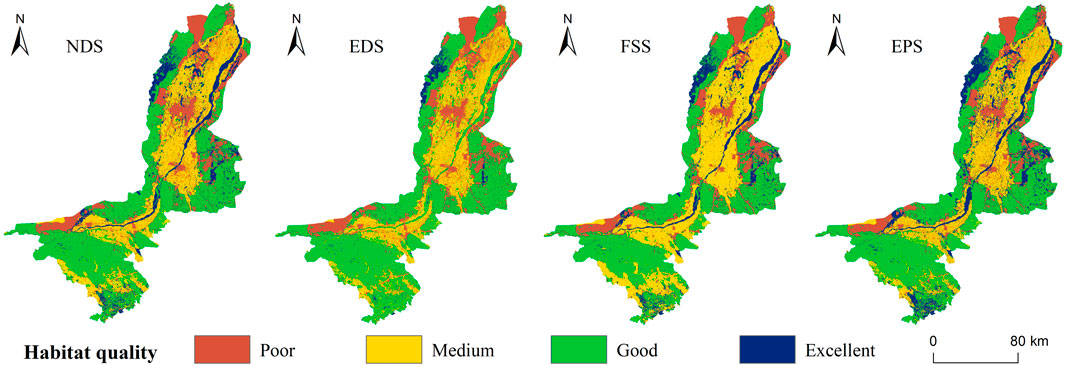
Figure 8. Schematic diagram of habitat quality under different scenarios in 2035.
The Anselin Local Moran Ⅰ was computed through ArcGIS 10.8. As depicted in Figure 9, the HQ levels of the study area were strongly associated with altitude, land-use types, and human activities. The Helan Mountain Nature Reserve was the largest area among the four scenarios that could provide ecological service functions to humanity and other species. However, its alluvial fan was an ecologically fragile area. Due to the spatial proximity effect, the area covered by grassland differed significantly from the surrounding areas. It exhibited a situation of a high–low outlier. Under the EPS, the mainstream served as an overall ecological safeguard. Meanwhile, the HQ of construction land, especially in Yinchuan city and the Ningdong industrial base, improved under EPS but had a low value under EDS. In contrast to NDS, the HQ of construction land became comparable under the FSS because of the increasing cropland area. Cropland HQ was identified as a primary determinant influencing the Yellow River ecosystem integrity within the Yingchuan Plain, with intensifying effects observed during agricultural expansion phases under FSS scenarios. Conversely, limited hydrological impacts were recorded in the Weining Plain system, where progressive cropland quality deterioration occurred despite similar cultivation area increases. The HQ of cropland had a low value under NDS, and it showed the same situation with EPS. A series of HQ patches had a high value under the EDS due to the reduction of cropland.
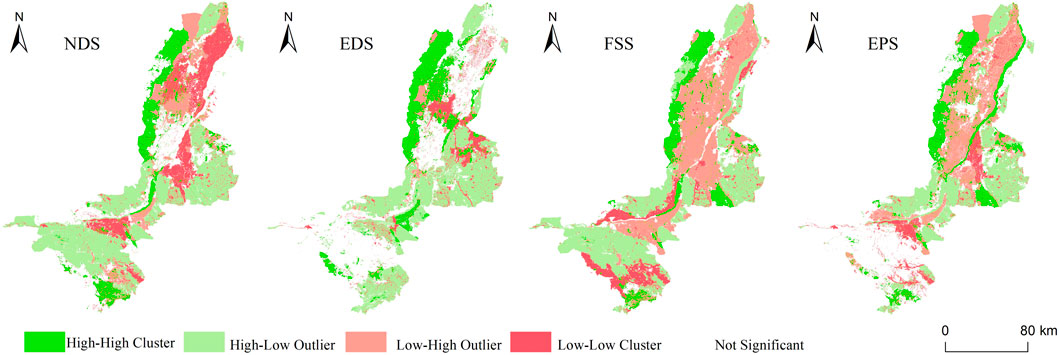
Figure 9. LISA aggregation of the habitat quality spatial distribution by scenarios in 2035.
4 Discussion
4.1 The necessity and advantage of multi-scenario methods
The multi-scenario analysis is of great necessity and advantageous for studying HQ. It can not only trade-off and coordinate the contradictions and heterogeneity but also reflect the uncertainties and complexities of the future more scientifically and objectively. Generally, the higher the vegetation coverage is, the better the HQ is, and the decline of HQ is exacerbated by human activities and continuous urban expansion (Walfrido et al., 2019). The same results were also shown in the cases of the Hexi region and the whole YRB (Li et al., 2024b; Tang et al., 2023). The mean HQ in the Hexi region under the EPS was higher than that under the NDS. Meanwhile, the mean HQ of each region among the whole YRB was closely related to the natural environment, exhibiting the following order: Xi,-T > HBOY > Yin-C > Lan-X. Moreover, HQ embodies a highly intricate and systematic ecosystem as its spatial and temporal patterns were shaped by a combination of natural and artificial factors. Natural disasters and resource shortages, such as floods, droughts, and energy crises, would have an impact on the uncertainty and complexity of the social and economic development. The natural environment changes, the technological advances, and the social and economic transformation would continue to increase progressively. For example, the mean HQ degeneracy value decreased in the following order: EDS (0.2231) > FSS (0.1971) > NDS (0.1911) > EPS (0.1771). This value was exactly the opposite of the mean HQ value, indicating the impact caused by policy difference and the importance of protecting the HQ. However, it also revealed that the spatial relationships and HQ quality did not align consistently; for example, under the EPS, the HQ exhibited the highest value but lacked the most concentrated spatial clustering. This highlights the distinctions in landscape patterns between arid and semi-arid regions compared to others, such as the humid areas in southeastern China and Malaysia’s tropical rainforest climate zones (Wu et al., 2024; Zhang et al., 2024). Moreover, the HQ interacts with other regional characteristics, such as ecological security pattern, carbon storage, urban cooling, and seasonal water yield. It is not easy to accurately calculate the characteristics of each index, and the reasons for the differences in regional characteristics under each scenario should be explored (Ma et al., 2023; Wu et al., 2025b).
4.2 Future development of urban agglomeration along the Yellow River in Ningxia
The Territorial Space Plan of the Ningxia Hui Autonomous Region (2021–2035) announces building a solid spatial foundation for safe developmental foundations through integrated resource–environmental carrying capacity assessments. Scenario simulations derived mandatory land allocation thresholds for 2035, which included ecological conservation zones requiring ≥4,568.96 km2, urban development capped at ≤ 2,970.78 km2, and the cropland area should be no less than approximately 3,564.45 km2. All modeled scenarios satisfied the statutory cropland preservation and urban expansion requirements; however, ecological integrity optimization necessitated further comparative analysis. Current water resource management under the city–land–population–industry water quota system imposes absolute consumption limits (≤51.81 billion m3), fundamentally constraining demographic distribution, socioeconomic development intensity, and infrastructure expansion patterns (Wang et al., 2024). Therefore, it was necessary to determine the future developmental model of the Ningxia Yellow River-adjacent urban cluster according to the characteristics of water resources while taking policy constraints into account (Li et al., 2025). In this study, the DEM, slope, NDVI, transportation network proximity, GDP density, and population density were seen as the contributing factors or limiting factors for the urban agglomeration along the YRB in Ningxia. The DEM and slope were the foundation of regional ecological security, directly affecting the mesoscale environment and microenvironment of the study area. NDVI was an important ecological indicator of different areas because it was formed by temperature, precipitation, and other regional characteristics. GDP increase, population growth, and construction land encroachment exacerbated pressure on ecological carrying capacity, especially in ecologically fragile zones. The priority zones for ecological restoration should reconcile conflicts among ecosystem services, human preferences, and future development aims, which were based on the natural and artificial environment by optimizing land-use functions and zoning identification strategies (Wu et al., 2025b; Lai et al., 2025). The Helan Mountain Nature Reserve and the Yellow River mainstream were regarded as the most critical regions for ecological protection and restoration. In other regions such as the Ulan Buh, Mu Us, and Tengger deserts and the Baijitan Nature Reserve, measures of sand fixation should be strengthened. Additionally, high-pollution and high-energy-consuming industries should be reduced in the intensive human activity zones.
4.3 Limitations and prospects
Although the FLUS–InVEST model was capable of reflecting the HQ within its spatiotemporal process and dynamics in the past/future periods, there were still many limitations. The selection of parameters and weights may be uncertain and inevitable due to the author’s subjectivity. In addition, HQ simulation using the FLUS–InVEST models relies on the LUCC predictions. Therefore, the LUCC was greatly affected by the natural environment and human activity, and quantifying these factors was challenging (Wang et al., 2025). Future studies should emphasize the interaction between HQ and other region characteristics, as the regional development was an organic whole. Meanwhile, multi-source data and a large language model (LLM) should be utilized to replicate the alterations in regional characteristics (Zheng et al., 2024; Liu et al., 2024). This approach could improve simulation accuracy and present realistic scenarios.
5 Conclusion
This study utilized the FLUS and InVEST integrated modeling to assess LUCC and HQ within the urban agglomeration along the YRB in Ningxia across 2010, 2015, and 2020, with supplementary scenario projections extending to 2035. The results showed that (Hall, 1997) the areas of ecological land decreased during the period. Correspondingly, the mean HQ demonstrated a successive decline from 0.4919 to 0.4730, and further to 0.4654, characterized by centrifugal degradation gradients from the peripheral to central regions (Fahrig, 2017). Multi-scenario analysis for 2035 revealed consistent land-use proportions across developmental frameworks and similar to the historical periods, with medium-to-good HQ levels predominating and demonstrating significant spatial coupling with LUCC. Scenario-specific HQ performance followed the hierarchy EPS (0.5348) > NDS (0.5165)> FSS (0.4967) > EDS (0.4681). The Helan Mountain Nature Reserve showed sustained ecological integrity across the four scenarios. The Yellow River mainstream exhibited continuum-scale ecosystem functionality under EPS, contrasting with fragmented conservation patterns observed in alternative scenarios. Moreover, the HQ of the Yellow River showed spatial differences between the Weining and Yinchuan plains (Alaniz et al., 2021). The HQ was a complex and dynamic synthesis, and the multi-scenario simulation could effectively address its idiosyncrasies. The HQ was guided by natural factors and government policies, coordinating the man–land relations.
Data availability statement
The datasets presented in this article are not readily available because the datasets used and analyzed in the current study are available from the first author or the corresponding author on reasonable request. Requests to access the datasets should be directed toY2hlbmd3aEBueHUuZWR1LmNu.
Author contributions
TM: Conceptualization, Formal Analysis, Writing – original draft, Methodology, Validation. WC: Writing – original draft, Conceptualization, Investigation, Resources, Funding acquisition. WY: Software, Writing – original draft.
Funding
The author(s) declare that financial support was received for the research and/or publication of this article. This research was funded by the Ningxia Natural Science Foundation of China (2024AAC02022), the National Science Research Project Foundation of China (2023YFF1304705), and the Ningxia Education Science Foundation of China (NYG2024007).
Acknowledgments
The authors express their gratitude to the reviewers and the editor for their professional comments and suggestions.
Conflict of interest
The authors declare that the research was conducted in the absence of any commercial or financial relationships that could be construed as a potential conflict of interest.
Generative AI statement
The author(s) declare that no Generative AI was used in the creation of this manuscript.
Publisher’s note
All claims expressed in this article are solely those of the authors and do not necessarily represent those of their affiliated organizations, or those of the publisher, the editors and the reviewers. Any product that may be evaluated in this article, or claim that may be made by its manufacturer, is not guaranteed or endorsed by the publisher.
References
Alaniz, A. J., Carvajal, M. A., Fierro, A., Vergara-Rodríguez, V., Toledo, G., Ansaldo, D., et al. (2021). Remote-sensing estimates of forest structure and dynamics as indicators of habitat quality for magellanic woodpeckers. Ecol. Indic. 126, 107634. doi:10.1016/j.ecolind.2021.107634
Babbar, D., Areendran, G., Sahana, M., Sarma, K., Raj, K., and Sivadas, A. (2021). Assessment and prediction of carbon sequestration using markov chain and InVEST model in sariska tiger reserve, India. J. Clean. Prod. 278, 123333. doi:10.1016/j.jclepro.2020.123333
Budnik, R. R., Conroy, J. D., Zweifel, R. D., Ludsin, S. A., and Marschall, E. A. (2020). Projecting future habitat quality of three midwestern reservoir fishes under warming conditions. Ecol. Freshw. Fish. 30 (1), 31–47. doi:10.1111/eff.12561
Cheng, W., Ma, C., Li, T., and Liu, Y. (2024). Construction of ecological security patterns and evaluation of ecological network stability under multi-scenario simulation: a case study in desert–oasis area of the Yellow River Basin, China. Land 13 (7), 1037. doi:10.3390/land13071037
Fahrig, L. (2017). Ecological responses to habitat fragmentation per se. Evol. Syst. 48 (1), 1–23. doi:10.1146/annurev-ecolsys-110316-022612
Gashaw, T., Bantider, A., Zeleke, G., Alamirew, T., Jemberu, W., Worqlul, A. W., et al. (2021). Evaluating InVEST model for estimating soil loss and sediment export in data scarce regions of the abbay (upper Blue Nile) basin: implications for land managers. Environ. Challenges 5, 100381. doi:10.1016/j.envc.2021.100381
Guan, H., Bai, Y., Tang, Y., Zhang, C., and Zou, J. (2023). Spatial identification and optimization of ecological network in desert-oasis area of Yellow River Basin, China. Ecol. Indic., 147. doi:10.1016/j.ecolind.2023.109999
Han, C., Zheng, J., Han, W., Lu, B., Yu, W., Wang, Z., et al. (2024). Research on habitat quality in arid urban agglomerations: influencing mechanisms and multi-scenario simulations. Land Degrad. Dev. 35 (6), 2256–2273. doi:10.1002/ldr.5058
Jokar Arsanjani, J., Helbich, M., Kainz, W., and Darvishi Boloorani, A. (2013). Integration of logistic regression, markov chain and cellular automata models to simulate urban expansion. Int. J. Appl. Earth Observation Geoinformation 21, 265–275. doi:10.1016/j.jag.2011.12.014
Kadaverugu, A., Nageshwar Rao, C., and Viswanadh, G. K. (2020). Quantification of flood mitigation services by urban green spaces using InVEST model: a case study of hyderabad city, India. Model. Earth Syst. Environ. 7 (1), 589–602. doi:10.1007/s40808-020-00937-0
Kong, X., Fu, M., Zhao, X., Wang, J., and Jiang, P. (2022). Ecological effects of land-use change on two sides of the Hu Huanyong Line in China. Land Use Policy 113, 105895. doi:10.1016/j.landusepol.2021.105895
Kunwar, R. M., Evans, A., Mainali, J., Ansari, A. S., Rimal, B., and Bussmann, R. W. (2018). Change in forest and vegetation cover influencing distribution and uses of plants in the kailash sacred landscape, Nepal. Environ. Dev. Sustain. 22 (2), 1397–1412. doi:10.1007/s10668-018-0254-4
Lai, J., Qi, S., Chen, J., and Guo, J. (2025). Changes in habitat quality and their driving forces in the coastal zone of Hainan island: insights from 20 years of research and future projections. Ecol. Front. 45 (3), 621–633. doi:10.1016/j.ecofro.2024.12.010
Li, H., Chen, J., Ling, M., Chen, Z., Lan, Y., Huang, Q., et al. (2025). A framework for dynamic assessment of soil erosion and detection of driving factors in alpine grassland ecosystems using the RUSLE-InVEST (SDR) model and geodetector: a case study of the source region of the Yellow River. Ecol. Inf. 85, 102928. doi:10.1016/j.ecoinf.2024.102928
Li, L., Huang, X., Wu, D., and Yang, H. (2023). Construction of ecological security pattern adapting to future land use change in pearl River Delta, China. Appl. Geogr., 154. doi:10.1016/j.apgeog.2023.102946
Li, L., Wang, N., Hao, Z., Sun, B., Gao, B., Gou, M., et al. (2024a). Urbanization intensifies the imbalance between human development and biodiversity conservation: insights from the coupling analysis of human activities and habitat quality. Land Degrad. Dev. 35 (11), 3606–3626. doi:10.1002/ldr.5155
Li, X., Zhang, X., Feng, H., Li, Y., Yu, J., Liu, Y., et al. (2024b). Dynamic evolution and simulation of habitat quality in arid regions: a case study of the hexi region, China. Ecol. Model. 493, 110726. doi:10.1016/j.ecolmodel.2024.110726
Liang, X., Liu, X., Li, D., Zhao, H., and Chen, G. (2018b). Urban growth simulation by incorporating planning policies into a CA-based future land-use simulation model. Int. J. Geogr. Inf. Sci. 32 (11), 2294–2316. doi:10.1080/13658816.2018.1502441
Liang, X., Liu, X., Li, X., Chen, Y., Tian, H., and Yao, Y. (2018a). Delineating multi-scenario urban growth boundaries with a CA-based FLUS model and morphological method. Landsc. Urban Plan. 177, 47–63. doi:10.1016/j.landurbplan.2018.04.016
Lin, J. H. P., Yang, L., He, X., and Lu, S. &L. D. (2022). Predicting future urban waterlogging-prone areas by coupling the maximum entropy and FLUS model. Sustain. Cities Soc. 80, 103812. doi:10.1016/j.scs.2022.103812
Lin, W., Sun, Y., Nijhuis, S., and Wang, Z. (2020). Scenario-based flood risk assessment for urbanizing deltas using future land-use simulation (FLUS): guangzhou metropolitan area as a case study. Sci. Total Environ., 739. doi:10.1016/j.scitotenv.2020.139899
Hall, L. (1997). The habitat concept and a plea for standard terminology. Wiley behalf Wildl. Soc. 25 (1), 173–182. Available online at: https://www.jstor.org/stable/3783301.
Liu, Q., Zhang, Q., Yan, Y., Zhang, X., Niu, J., and Svenning, J.-C. (2020). Ecological restoration is the dominant driver of the recent reversal of desertification in the Mu us desert (China). J. Clean. Prod. 268, 122241. doi:10.1016/j.jclepro.2020.122241
Liu, X., Gou, Z., and Yuan, C. (2024). Application of human-centric digital twins: predicting outdoor thermal comfort distribution in Singapore using multi-source data and machine learning. Urban Clim. 58, 102210. doi:10.1016/j.uclim.2024.102210
Liu, X., Liang, X., Li, X., Xu, X., Ou, J., Chen, Y., et al. (2017). A future land use simulation model (FLUS) for simulating multiple land use scenarios by coupling human and natural effects. Landsc. Urban Plan. 168, 94–116. doi:10.1016/j.landurbplan.2017.09.019
Ma, R., Zhou, W., Ren, J., Huang, Y., and Wang, H. (2023). Multi-scenario simulation and optimization control of ecological security based on GeoSOS-FLUS model in ecological fragile area in northeast Qinghai-Tibet Plateau, China. Ecol. Indic., 151. doi:10.1016/j.ecolind.2023.110324
Mondal, M. S., Sharma, N., Garg, P. K., and Kappas, M. (2016). Statistical Independence test and validation of CA markov land use land cover (LULC) prediction results. Egypt. J. Remote Sens. Space Sci. 19 (2), 259–272. doi:10.1016/j.ejrs.2016.08.001
Moreira, M., Fonseca, C., Vergílio, M., Calado, H., and Gil, A. (2018). Spatial assessment of habitat conservation status in a macaronesian island based on the InVEST model: a case study of pico Island (Azores, Portugal). Land Use Policy 78, 637–649. doi:10.1016/j.landusepol.2018.07.015
Mortelliti, A., Amori, G., and Boitani, L. (2010). The role of habitat quality in fragmented landscapes: a conceptual overview and prospectus for future research. Oecologia 163 (2), 535–547. doi:10.1007/s00442-010-1623-3
M´elanie, B. F. S. C., Cabral, P., and David, J. ˜ (2024). Habitat quality on the edge of anthropogenic pressures: predicting the Brazilian Upper paraguay River basin. J. Clean. Prod. 459 (142546), 1–15.
Pratzer, M., Maillard, O., Baldi, G., Baumann, M., Burton, J., Fernandez, P., et al. (2025). Considering land use complexity and overlap is critical for sustainability planning. One Earth 8, 101247. doi:10.1016/j.oneear.2025.101247
Regolin, A. L., Oliveira-Santos, L. G., Ribeiro, M. C., and Bailey, L. L. (2021). Habitat quality, not habitat amount, drives Mammalian habitat use in the Brazilian pantanal. Landsc. Ecol. 36 (9), 2519–2533. doi:10.1007/s10980-021-01280-0
Thomas, E., Jansen, M., Chiriboga-Arroyo, F., Wadt, L. H. O., Corvera-Gomringer, R., Atkinson, R. J., et al. (2021). Habitat quality differentiation and consequences for ecosystem service provision of an Amazonian hyperdominant tree species. Front. Plant Sci. 12, 621064. doi:10.3389/fpls.2021.621064
Tang, J., Zhou, L., Dang, X., Hu, F., Yuan, B., Yuan, Z., et al. (2023). Impacts and predictions of urban expansion on habitat quality in the densely populated areas: a case study of the Yellow River Basin, China. Ecol. Indic. 151 (2023), 110320. doi:10.1016/j.ecolind.2023.110320
Walfrido, M. T. Roque, o. D., Morato, R. G., Morato, R. G., Medici, P. E., Chiaravalloti, R. M., et al. (2019). Sustainability agenda for the PantanalWetland: perspectives on a collaborative interface for science, policy, and decision making. Trop. Conservation Sci. 12, 1–30. doi:10.1177/1940082919872634
Wang, J., Wu, Y., and Gou, A. (2023). Habitat quality evolution characteristics and multi-scenario prediction in shenzhen based on PLUS and InVEST models. Front. Environ. Sci. 11. doi:10.3389/fenvs.2023.1146347
Wang, X., Liu, B., Chen, J., Arash, M., Zhang, B., Chang, Q., et al. (2025). Assessing the impact of land use change on habitat quality in zhongwei through multiscenario simulation using the PLUS and InVEST models. Sci. Rep. 15 (1), 12355. doi:10.1038/s41598-025-90965-6
Wang, X. B. L., Chen, J., MalekianArash, Bo Z., Chang, Q., and Liu, J. (2022). Research on evolution of population and economy spatial distribution pattern in ecologically fragile areas: a case study of Ningxia, China. Nat. Porifolio 15 (12355), 1–15. doi:10.3389/fenvs.2022.814569
Wang, Y., Liu, Y., Luo, Y., Wang, L., and Liu, R. (2024). Research on the relative threshold of sustainable development of the complex system in the yellow River basin. J. Clean. Prod. 472, 143448. doi:10.1016/j.jclepro.2024.143448
Wang, Y., Zhao, W., Zhang, Q., and Yao, Y.-B. (2019). Characteristics of drought vulnerability for maize in the eastern part of Northwest China. Sci. Rep. 9 (1), 964. doi:10.1038/s41598-018-37362-4
Wu, C. B., Cui, Y. Y., Zhen, J. L., and Huang, G. H. (2025a). Spatio-temporal change of habitat quality in northeast China: driving factors exploration based on land use and land cover change. Land Degrad. Dev. 36, 3742–3755. doi:10.1002/ldr.5596
Wu, Q., Cao, Y., Zhang, Y., Su, D., and Fang, X. (2025b). Linking ecosystem services trade-offs, human preferences and future scenario simulations to ecological security patterns: a novel methodology for reconciling conflicting ecological functions. Appl. Geogr., 176. doi:10.1016/j.apgeog.2025.103534
Wu, Y., Wang, J., and Gou, A. (2024). Research on the evolution characteristics, driving mechanisms and multi-scenario simulation of habitat quality in the guangdong-hong kong-macao greater Bay based on multi-model coupling. Sci. Total Environ., 924. doi:10.1016/j.scitotenv.2024.171263
Xiao, P., Zhou, Y., Li, M., and Xu, J. (2022). Spatiotemporal patterns of habitat quality and its topographic gradient effects of Hubei Province based on the InVEST model. Environ. Dev. Sustain. 25 (7), 6419–6448. doi:10.1007/s10668-022-02310-w
Xu, W., Song, J., Long, Y., Mao, R., Tang, B., and Li, B. (2023). Analysis and simulation of the driving mechanism and ecological effects of land cover change in the Weihe River basin, China. J. Environ. Manag. 344, 118320. doi:10.1016/j.jenvman.2023.118320
You, Y., Jiang, P., Wang, Y., Wang, W., Chen, D., and Hu, X. (2025). Using multi-scenario analyses to determine the driving factors of land use in inland River basins in arid northwest China. Land 14 (4), 787. doi:10.3390/land14040787
Zhang, J., Tang, R., Liu, W., Zhang, G., Hao, X., Gong, Y., et al. (2025). Spatiotemporal evolution and prediction of carbon storage in karst fault basin based on FLUS and InVEST models. Sustainability 17 (9), 3931. doi:10.3390/su17093931
Zhang, J., Yan, F., Su, F., Lyne, V., Wang, X., and Wang, X. (2024). Response of habitat quality to land use changes in the Johor river Estuary. Int. J. Digital Earth 17 (1). doi:10.1080/17538947.2024.2390439
Zhang, X., Liao, L., Xu, Z., Zhang, J., Chi, M., Lan, S., et al. (2022). Interactive effects on habitat quality using InVEST and GeoDetector models in Wenzhou, China. Land 11 (5), 630. doi:10.3390/land11050630
Zhang, Y., Yu, P., Tian, Y., Chen, H., and Chen, Y. (2023). Exploring the impact of integrated spatial function zones on land use dynamics and ecosystem services tradeoffs based on a future land use simulation (FLUS) model. Ecol. Indic. 150, 110246. doi:10.1016/j.ecolind.2023.110246
Keywords: habitat quality, land-use cover change, spatiotemporal evolution, multi-scenario simulation, ecological restoration, Yellow River Basin
Citation: Ma T, Cheng W and Yao W (2025) Spatiotemporal evolution and multi-scenario simulation of the land-use cover change and habitat quality in arid and semi-arid areas: a case study of the urban agglomeration along the Yellow River in Ningxia, China. Front. Environ. Sci. 13:1649302. doi: 10.3389/fenvs.2025.1649302
Received: 18 June 2025; Accepted: 15 July 2025;
Published: 07 August 2025.
Edited by:
Chong Jiang, Guangdong Academy of Science (CAS), ChinaReviewed by:
Stergios Tampekis, Agricultural University of Athens, GreeceZemin Zhi, Qinghai Normal University, China
Copyright © 2025 Ma, Cheng and Yao. This is an open-access article distributed under the terms of the Creative Commons Attribution License (CC BY). The use, distribution or reproduction in other forums is permitted, provided the original author(s) and the copyright owner(s) are credited and that the original publication in this journal is cited, in accordance with accepted academic practice. No use, distribution or reproduction is permitted which does not comply with these terms.
*Correspondence: Wenhao Cheng, Y2hlbmd3aEBueHUuZWR1LmNu