 Yaping Ren
 Shuyi Wang2*
- 1School of Architecture and Urban Planning, Henan University of Urban Construction, Pingdingshan, China
- 2School of Architecture, Chang’an University, Xian, China
- 3School of Water Resources, North China University of Water Resources and Electric Power, Zhengzhou, China
Under the background of global anthropocene and climate change, as a key spatial unit to maintain the function of native ecosystems, the study of precise identification and spatial distribution of wilderness is of great scientific value to enhance the effectiveness of rewilding practice. Taking the wilderness in Henan Province as a case study area, the thesis constructs the evaluation index system of wilderness in Henan Province by using the Boolean identification and multi-objective evaluation methods based on the analysis of the concept and connotation of wilderness, identifies the spatial distribution of wilderness in Henan Province, and analyzes the current status of protection and the vacancy of protection in Henan Province. The results of the study show that 1) in horizontal space, high-quality wilderness in Henan Province is mainly concentrated in the high-elevation and water-system peripheral areas in the north, west and south, while low-quality wilderness is dominant in the central plains and the periphery of the major transportation arteries. 2) In terms of vertical spatial distribution, the quality of wilderness increases with elevation, with a high proportion of low- and medium-quality wilderness in low-elevation areas, while high-quality wilderness is most distributed in high-elevation (800–1200 m) areas. 3) The area of wilderness in Henan Province is 20,052.60 km2, and the area of wilderness covered by nature reserves is only 3,017.40 km2, i.e., 84.95% of the existing wilderness is not included in the scope of protection, and there is a large area of protection gaps in the wilderness area, which urgently needs to be strengthened in terms of planning, reasonable protection and management. The results of this study can provide a theoretical basis for the development of scientific and reasonable wilderness protection policies in nature reserves, and are of significance in promoting the in-depth development of wilderness protection in Henan Province.
1 Introduction
Under the dual pressures of the global Anthropocene and climate change, the protection and management of wilderness areas, as the core spatial unit for maintaining native ecosystem functions, has become a key issue in global biodiversity conservation (Carver et al., 2012; Ye et al., 2024). Wilderness land not only carries key ecosystem services such as carbon sequestration and water conservation, but also is an important habitat for endangered species and a key node of ecological corridors (Ceauşu et al., 2015; Watson et al., 2016). However, along with urbanization and infrastructure expansion, the global wilderness area has sharply decreased by 10% in the last 3 decades, with the disappearance rate particularly significant in East Asia (Strus and Carver, 2024). As the most populous province in China and the core agricultural area of the Yellow-Huaihai Plain, Henan Province is characterized by a significant ecological gradient between the western mountains and the eastern plains, which is not only an important safeguard area for national food security, but also a key transition zone for ecological protection in the Yellow River Basin (Radford et al., 2019). However, the high density of human activities has led to serious degradation of the wilderness in the province, and the existing protected area system has insufficient coverage of the wilderness, which urgently needs to provide a basis for decision-making for the optimization of the regional ecological security pattern through scientific mapping and analysis of protection vacancies.
Wilderness mapping, as a fundamental work of wilderness protection, has evolved from the Boolean identification method to the multi-indicator comprehensive evaluation (MCE) method (Martin and Watson, 2016). Early studies were based on the dichotomous logic of “no human interference”, which delineated wilderness boundaries by excluding elements such as settlements, roads, and agricultural land (Carver et al., 2013), and Zhu et al. (2024) used GIS overlay analysis to generate discrete wilderness patches. However, these methods ignore the continuity and dynamic characteristics of wilderness attributes, and it is difficult to quantify the differences in gradients of human activities (Barrick and Beazley, 1990). At the beginning of the 21st century, the theory of “wilderness continuum” (MCE) emerged, emphasizing that the quality of wilderness is a multidimensional continuum of remoteness (distance from settlements and roads) and naturalness (land use and impacts of man-made facilities) (Xu T et al., 2024), which pushed MCE to become the mainstream method. Promoting MCE as a mainstream approach. Zoderer et al. (2024a) integrated land use, road density and other indicators to construct a national wilderness quality atlas, Cao et al. (2019) introduced vegetation cover to reveal the value of local ecological services, and the hierarchical analysis method (AHP) and entropy weighting optimized the allocation of indicator weights (Leroux and Rayfield, 2014). Xu Z. et al. (2024) quantified the interference intensity of artificial facilities in China’s terrestrial wilderness areas by fusing nighttime light intensity with road network density (Luyssaert et al., 2008); at the model level, machine learning algorithms and spatial statistical methods were used to optimize the indicator weight assignments and outlier corrections (Zoderer et al., 2020).
Recent advancements in remote sensing and machine learning have significantly enhanced the precision and scalability of wilderness mapping. Deep learning models, particularly convolutional neural networks (CNNs), have demonstrated remarkable capabilities in automating land cover classification and detecting subtle anthropogenic disturbances from high-resolution satellite imagery. Moreover, the integration of multi-source satellite data (e.g., Sentinel-2, Landsat, and Gaofen series) with machine learning algorithms has enabled the continuous monitoring of ecological indicators such as vegetation health, habitat fragmentation, and ecosystem service dynamics (Din and Mak, 2021; Almeida et al., 2024). These technologies offer promising avenues for improving the accuracy and efficiency of wilderness assessment, especially in heterogeneous landscapes like Henan Province.
Currently, global and national scale wilderness mapping is relatively mature, but provincial scale studies are still insufficient, especially in regions with prominent ecological-economic conflicts (densely populated agricultural provinces), lacking a comprehensive evaluation framework that takes into account the intensity of human activities and the characteristics of the natural background (Zoderer et al., 2024b). Existing studies mostly focus on the static analysis of a single indicator (road density or land use type), and there is insufficient integration of dynamic disturbance factors such as nighttime lighting data and population density, which makes it difficult to accurately reveal the spatial heterogeneity of wilderness in high human disturbance areas (Wang et al., 2024). Therefore, to address the weakness of provincial-scale wilderness mapping, this study takes Henan Province as a typical case study area, and proposes an innovative framework of coupled Boolean-Multi-Indicator Evaluation Method (MIME), This methodology not only enriches the theoretical paradigm of wilderness mapping at provincial scale, but also provides technical support for ecological protection and rewilding practice in high human interference areas.
2 Materials and methods
2.1 Overview of the case area
Henan Province (Geographic coordinates: latitude 31°23′-36°22′N, longitude 110°21′-116°39′E) is located in the core economic zone of central China, belonging to the confluence of the Yellow River Basin and the Huaihe River Basin, with a total area of 167,000 square kilometers. As a national important transportation hub and grain production base, its geomorphological pattern shows a stepped distribution of high in the west and low in the east, with the Taihang Mountains and the Funiu Mountains in the west constituting a mountainous barrier with an elevation of 1,000 to 2,000 m, while the central part of the city is transitioned into a hilly terrace with an elevation of 200–500 m, and the eastern part of the city is extended into the Huanghuai-Huaihai alluvial plain, which accounts for 55.7% of the total area of the province. The land use structure is characterized by “three mountains, one plain and five fields,” of which 26.6% are mountains, 17.7% are hills, 55.7% are plains, and water and wetlands account for 3.2%. The unique geomorphological combination has formed a spatial pattern of the “ecological barrier of West Henan Province, urban agglomeration of the Central Plains, and the Yellow-Huaihai Farming Belt” (Figure 1). By the end of 2023, the province’s resident population will be 98.72 million, with an urbanization rate of 57.1%. In the region, the South-to-North Water Diversion Project runs north-south and the ecological corridor along the Yellow River spans east-west, and its land resources carry the dual missions of national food security strategy and ecological civilization construction.
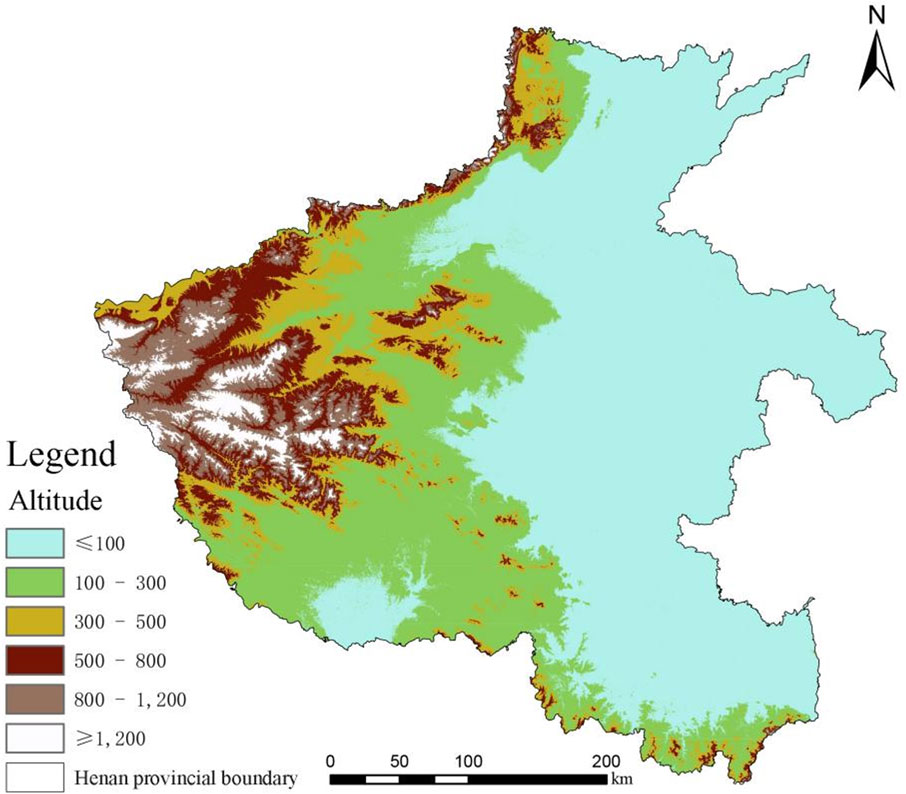
Figure 1. Topographic map of Henan Province.
The spatial distribution of wilderness in Henan Province is driven by both natural geography and human activities, showing significant heterogeneity. The study shows that the total area of wilderness in the province is 20,052.60 km2, accounting for 12.0% of the provincial area, of which high-quality wilderness (grades 8–10) accounts for only 20.83%, concentrating in the high-elevation area of the western Furniu Mountain system (800–1,200 m), with natural forests, thickets, and undeveloped valleys dominating the area. The biophysical naturalness and landscape connectivity are relatively high; medium-quality wilderness (Grade 4–7) accounts for 68.65%, mostly distributed in hilly transition zones and river corridor buffer zones, and mildly interfered with by agricultural reclamation and road networks; low-quality wilderness (Grade 1–3) accounts for 10.51%, concentrated in the central plain and around urban agglomerations such as Zhengzhou and Luoyang, and subject to urbanization expansion; and the wilderness is also subject to urbanization expansion. Around the urban agglomerations, they are significantly affected by the expansion of urbanization and the cutting of traffic arteries, showing fragmentation characteristics. The coverage of wilderness in the existing nature reserve system is seriously insufficient, with only 15.05% of wilderness included in the scope of protection, and there are large protection gaps in key areas such as cross-border ecological corridors in the west and wetlands in the eastern Yellow River floodplain, which poses a serious challenge to ecological security.
2.2 Boolean Identification method - wilderness mapping
The Boolean Identification Method (BRM) was employed for the initial screening of wilderness areas due to its established efficacy in delineating wilderness boundaries based on the presence or absence of key human disturbance factors. Its core principle of logical exclusion aligns perfectly with the foundational definition of wilderness as “areas free from significant human modification.” The BRM offers distinct advantages of computational efficiency, intuitive logic, and transparent decision-making, making it particularly suitable for generating a preliminary “wilderness/non-wilderness” dichotomy at large scales. This step is crucial for defining the spatial domain within which a more nuanced assessment of wilderness quality can be conducted, thereby streamlining subsequent analysis and avoiding unnecessary computations in heavily human-dominated landscapes. However, recognizing the limitation of BRM in capturing the continuum of wilderness quality, it was used primarily for boundary delineation, setting the stage for the multi-criteria evaluation that follows. The specific methods are as follows:
2.2.1 Definition of disturbance elements and data preprocessing
The core mathematical principle of BRM is based on set theory. The study area (S) is conceptually divided into a set of wilderness (W) (Formula 2) and non-wilderness (N) (Formula 1) areas through a series of spatial exclusion operations:
where: A is the set of artificial surfaces. C is the set of agricultural reclamation areas, Bs is the set of settlement buffer zones, Br is the set of road buffer zones.
The buffer generation, a key step, was mathematically implemented using Euclidean distance transformation. For a set of points or lines representing disturbance sources D, the buffer zone B with a radius r (here, r = 1000 m) is defined as (Formula 3):
This operation was executed for both settlement points and road lines to generate Bs and Br, respectively.
Based on the International Union for Conservation of Nature (IUCN) definition of wilderness area (Cao et al., 2019) and the classical literature methodology (Leroux and Rayfield, 2014), the following four types of elements are considered as key human disturbance sources (Table 1):
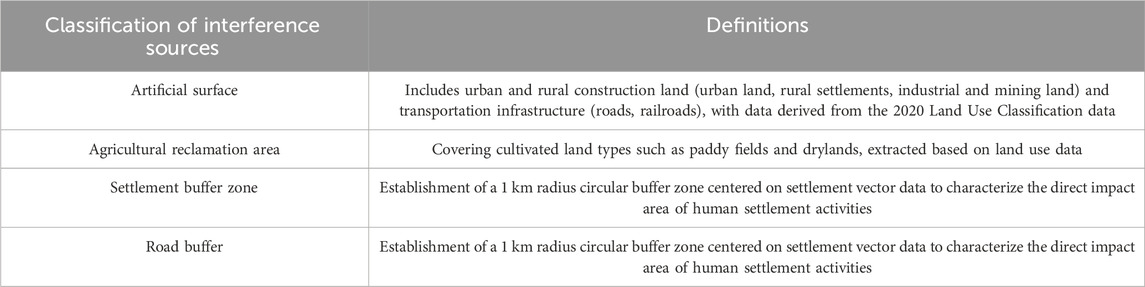
Table 1. Key human sources of interference.
2.2.2 Wilderness initial screening
Based on the ArcGIS 10.6 platform, the initial screening of wilderness land is realized by a multi-level spatial exclusion method:
Exclusion of man-made land surface and cultivated land: using the tool of “select by attribute” to extract the layers of construction land and cultivated land, and directly exclude them from the whole area of Henan Province.
Buffer superposition analysis: Fusion (Union) of settlement and road buffer data to generate composite disturbed areas.
Boolean Logic Erase: Using the “Erase” tool, the above artificial land surface, cultivated land, and composite disturbed areas are sequentially erased with the administrative boundary of Henan Province as the datum, and the potential wilderness patches that are not directly encroached upon by human activities are retained.
2.2.3 Accuracy verification and result correction
Remote sensing image comparison: Random sampling of initial screening patches (n = 200) was conducted using Google Earth historical high-resolution images (spatial resolution 0.5–1 m)for manual interpretation.The consistency between the interpreted land use type and the initial wilderness classification result was recorded, with a preliminary consistency rate of 89.2%.
Protected area boundary checking: Nature reserve vector data were overlaid with the initial wilderness patches. Wilderness areas that had been legally designated as core zones or buffer zones of nature reserves (area = 3,017.40 km2) were excluded to avoid double-counting, and the spatial alignment between the identified wilderness and existing protected areas was verified (spatial overlap rate = 15.05%).
Field-based ground-truthing:Sampling design: A stratified random sampling method was adopted to ensure coverage of all wilderness quality grades (low/medium/high) and key heterogeneous transitional zones. A total of 300 verification plots (1 km × 1 km,consistent with the raster resolution of the MCE evaluation) were set,with 100 plots in each quality grade and 80 plots specifically located in transitional zones (accounting for 26.7% of total plots).
Survey protocol: A 3-person field team was organized, equipped with Trimble R10 GNSS (positioning accuracy ±2 cm)for plot boundary positioning,and a digital vegetation surveyor (PlantDoc Pro) for data recording. For each plot, indicators such as land use type, human disturbance intensity, and ecological integrity are measured to validate the accuracy of wilderness classification.
2.3 Integrated multi-objective evaluation method - wilderness quality classification
To address the inherent limitation of the Boolean method, which only provides a binary classification, the Multi-Criteria Evaluation (MCE) method was adopted to quantify the continuous gradient of wilderness quality. This approach is motivated by the “wilderness continuum” concept, which recognizes that wilderness quality is not a simple yes/no attribute but a multi-dimensional spectrum influenced by varying degrees of human influence and ecological integrity. The MCE framework allows for the integration of multiple indicators representing different dimensions of wilderness (e.g., remoteness, naturalness, ecological integrity), providing a more holistic and nuanced assessment than binary methods. This is especially critical in a province like Henan with significant human-nature gradients, where vast areas exist in an intermediate state. The MCE enables the identification of these transitional zones and prioritizes high-quality cores for conservation. The specific methods are:
2.3.1 Indicator selection and definition
To comprehensively characterize the spatial heterogeneity of wilderness areas, a multi-dimensional evaluation system comprising seven core indicators was constructed. These indicators were organized into three conceptual dimensions:Spatial Remoteness, Physical Naturalness, and Ecological Integrity. Detailed definitions, conceptual explanations, and computational methodologies for each indicator are summarized in Table 2. This integrated framework allows for a holistic assessment of wilderness quality by capturing both anthropogenic pressure and intrinsic ecological value.
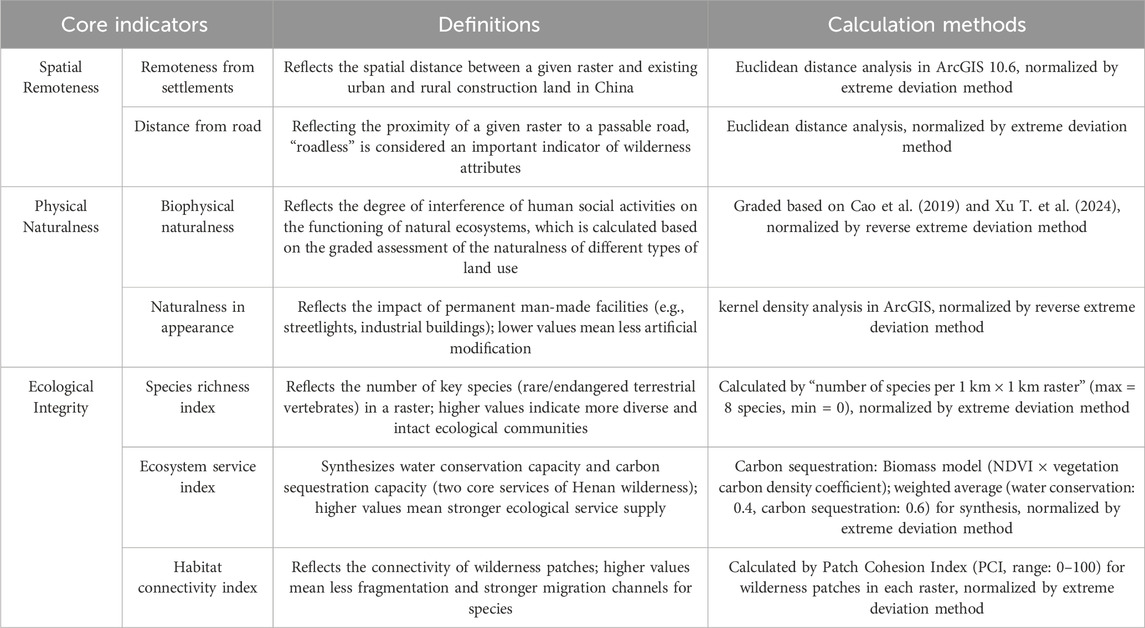
Table 2. Selection of core indicators.
2.3.2 Raw data matrix construction
Let the study area contain n raster cells, each cell corresponds to m indicators, and construct the raw data matrix, See Formula 4:
where xij denotes the value of the jth indicator for the ith raster cell.
2.3.3 Data normalization
Positive indicators were normalized using extreme deviation normalization, See Formula 5:
Negative indicators are reverse normalized, See Formula 6:
Obtain the standard matrix, See Formula 7.
2.3.4 Determination of indicator weights
The coefficient of variation method assigns weights, calculates the mean and standard deviation of each indicator, and finds the coefficient of variation, See Formula 8:
The weights are obtained by normalization, See Formula 9:
Hierarchical analysis was validated, a judgment matrix was constructed, a consistency test (CR < 0.1) was passed, and weight assignment was corrected.
2.3.5 Composite index calculation and grading
The weight vector W (w1, w2,…, wm) with the normalization matrix, think of, gets the weighting matrix:
Positive and negative ideal solutions are determined, See Formula 10:
Positive Ideal Solution, See Formula 11:
Negative Ideal Solution, See Formula 12:
Euclidean distance calculation, See Formulas 13, 14:
Relative proximity calculation, See Formula 15:
The closer Ci is to 1, the higher the quality of the raster unit wilderness.
The natural breakpoint method was used to categorize Ci into 10 classes, which were combined into three categories (Table 3).
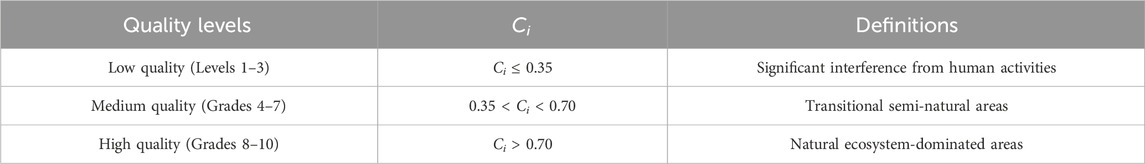
Table 3. Classification of wilderness quality grades.
2.3.6 Calculation of wilderness quality index
Using the wilderness quality index to draw the wilderness quality map, combined with the multi-indicator evaluation method of wilderness indicator standard values for the comprehensive superposition, and finally get the wilderness quality index (WQI) of Henan Province, the wilderness quality index calculation method is as follows, See Formula 16:
Where: WQI is the Wilderness Quality Index (WQI), the value of which reflects the degree of wilderness of any grid unit in the region, and the higher the value, the higher the quality of the grid wilderness; ei is the standard value of the ith indicator after normalization, wi is the corresponding weight of the indicator, and n is the number of wilderness indicators.
2.4 Integration of Boolean identification and MCE method
Recognizing the complementary strengths and weaknesses of the Boolean and MCE methods, a two-stage coupling framework was developed. The motivation for this integration is to leverage the computational efficiency and clear boundary delineation of the Boolean method for initial screening, while utilizing the nuanced grading capability of the MCE method to evaluate the quality within those pre-screened areas. This integrated approach (Boolean-MCE) ensures that the wilderness quality assessment is performed only on areas with wilderness potential, enhancing methodological efficiency and accuracy. It effectively bridges the gap between identifying where wilderness is (Boolean) and assessing how wild it is (MCE). The specific technical workflow and logical connection are as follows:
2.4.1 Preliminary screening by boolean identification (boundary delimitation)
The Boolean method was first used to exclude non-wilderness areas with significant human interference, generating a “potential wilderness pool” that defines the spatial scope for subsequent MCE evaluation. Convert the vector-based wilderness patches to raster format (1 km × 1 km spatial resolution) using the “Feature to Raster” tool in ArcGIS 10.6, where raster cells are assigned values of 1 (potential wilderness) and 0 (non-wilderness); Apply the raster as a mask to crop all MCE indicator datasets, retaining only cells with value = 1 for subsequent analysis. This step avoids invalid computation of non-wilderness areas and ensures spatial consistency between the two methods.
2.4.2 Quality grading by MCE (gradient evaluation)
For the masked potential wilderness raster, the MCE method was applied to quantify wilderness quality using seven core indicators. All MCE indicators were resampled to 1 km × 1 km resolution and projected to GCS_WGS_1984, matching the Boolean-derived raster to eliminate spatial mismatch errors; The fused weights were only applied to the masked indicator rasters, and the Wilderness Quality Index (WQI) was calculated using Formula to avoid bias from non-wilderness interference.
Cross-Validation for Integration Consistency. To verify the rationality of the coupling framework, a spatial consistency check was conducted. Overlay high-quality wilderness areas (WQI > 0.7 from MCE) with core wilderness patches (area > 10 km2 from Boolean identification). The spatial overlap rate was 83.7%, exceeding the minimum threshold of 80%, confirming that MCE-derived high-quality areas are consistent with Boolean-identified low-disturbance areas. Error correction: For 15 raster cells with low overlap (mainly in mountain-plain transitional zones), field survey data were used to reclassify WQI values. To verify the rationality of the coupling framework, a spatial consistency check was conducted. The core wilderness patches from the Boolean method were defined as patches with an area greater than 10 km2. The high-quality wilderness areas from the MCE method were defined as cells with WQI > 0.7.
The spatial overlap rate (O) was calculated to quantify the agreement between these two results, See Formula 17:
2.5 Boolean identification method
This section provides a detailed elaboration on the standardized operational definitions and thresholds applied in the Boolean and MCE methods, ensuring reproducibility and transparency. The rationale for selecting these specific thresholds and standardization procedures is grounded in existing literature and preliminary sensitivity analyses, aiming to maximize the methodological consistency and comparability of results within the specific context of Henan Province.
2.5.1 Definition of disturbance elements and standardized thresholds
Based on IUCN wilderness definitions (Lin et al., 2016) and regional adaptation (Parisien et al., 2009), key disturbance elements and their standardized thresholds are defined as follows (Table 4):
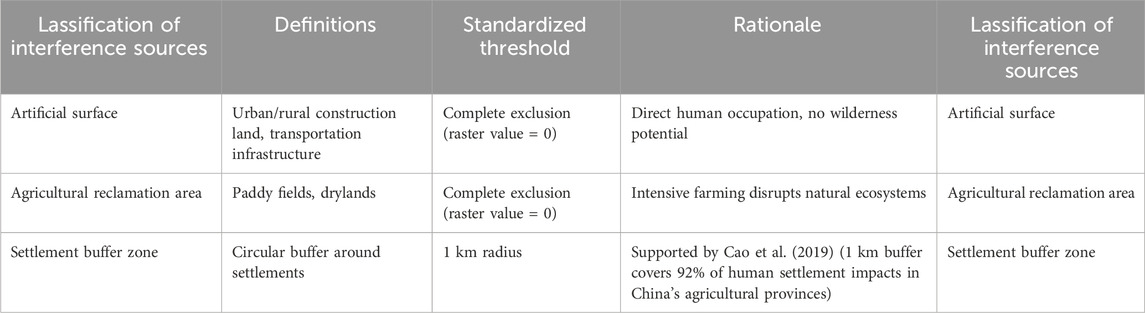
Table 4. Standardized key human disturbance sources and thresholds.
2.5.2 Integrated multi-objective evaluation method
To ensure methodological consistency and comparability across all indicators, a standardized computational workflow was rigorously implemented. First, all spatial datasets were uniformly preprocessed: they were resampled to a consistent resolution of 1 km × 1 km within the geographic coordinate system GCS_WGS_1984 and cropped to the administrative boundary of Henan Province. Subsequently, each indicator underwent a normalization procedure tailored to its ecological implication: positive indicators were processed using extreme deviation normalization, constraining values to a unified [0, 1] range where higher values denote stronger wilderness attributes; conversely, negative indicators were transformed via reverse extreme deviation normalization, wherein lower values correspond to reduced human disturbance. Finally, the integrated wilderness quality index (Ci) was classified into three standardized tiers using the natural breakpoint method, with thresholds empirically calibrated and verified through 300 field survey plots: regions with Ci ≤ 0.35 were classified as low-quality wilderness, exhibiting severe human disturbance (field-verified disturbance level 4–5 on a 5-point scale); areas with 0.35 < Ci < 0.70 were categorized as medium-quality, indicating moderate disturbance (level 2–3); and zones with Ci > 0.70 were designated high-quality wilderness, characterized by minimal anthropogenic impact (level 1), as summarized in Table 5.
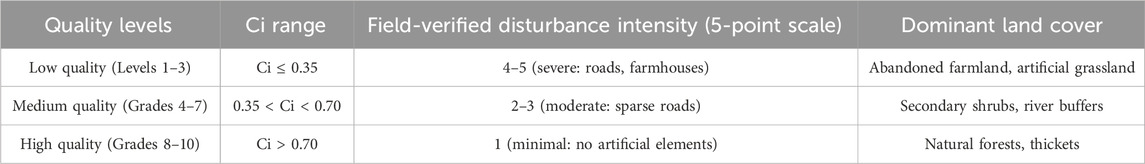
Table 5. Standardized classification of wilderness quality grades.
2.6 Accuracy assessment and statistical validation
To ensure the reliability of the wilderness identification and classification results, a comprehensive accuracy assessment was conducted using a combination of remote sensing interpretation, field surveys, and statistical validation methods. The accuracy assessment focused on both the Boolean-derived wilderness patches and the MCE-based wilderness quality grades.
2.6.1 Sampling design
A stratified random sampling strategy was adopted to ensure representation across all wilderness quality grades (low, medium, high) and geographic regions. A total of 300 sample plots (each 1 km × 1 km, consistent with the MCE raster resolution) were selected, including 100 plots from each quality category and an additional 80 plots located in ecotonal or transitional zones to capture edge effects.
2.6.2 Field validation
Field surveys were conducted between June and October 2023. Each plot was visited by a team equipped with a Trimble R10 GNSS receiver (positioning accuracy ±2 cm) for precise location marking. Land cover type, human disturbance intensity, and ecological integrity were recorded using a standardized protocol. Photographic evidence and GPS tracks were archived for each plot.
2.6.3 Remote sensing cross-validation
High-resolution historical imagery from Google Earth (0.5–1 m resolution) was used to visually interpret land cover types for 200 randomly selected plots. The interpreted results were compared with the model outputs to calculate consistency rates.
2.6.4 Statistical metrics
The accuracy of the wilderness classification was evaluated using a confusion matrix, from which the following metrics were derived: Overall Accuracy (OA), Kappa coefficient, Producer’s Accuracy (PA), User’s Accuracy (UA). These metrics were calculated separately for non-transitional and transitional zones to assess spatial heterogeneity in classification performance.
2.6.5 Consistency check with protected areas
The spatial overlap between identified wilderness patches and existing nature reserves was quantified to validate the conservativeness of the Boolean screening process.
2.6.6 Error analysis and correction
Discrepancies between model outputs and field observations were analyzed to identify systematic errors. Minor adjustments were made to the MCE weightings for transitional zones based on field feedback.
2.7 Environmental impact assessment and local community consultation
2.7.1 Environmental impact assessment (EIA)
The EIA was implemented in accordance with China’s Environmental Impact Assessment Law (2018 revision) and the Technical Guidelines for Environmental Impact Assessment of Ecological Impact Projects (HJ 19–2022), focusing on mitigating potential environmental disturbances caused by data collection and fieldwork.Key measures included:
1. Non-destructive field sampling design: Field verification plots were deliberately sensitive ecological zones, including core zones of nature reserves and critical habitats of endangered species. All plots were located in buffer zones or transitional areas, with a minimum distance of 500 m from core protected areas. Sampling equipment was non-invasive; no soil sampling or vegetation harvesting was conducted. Vegetation surveys relied on visual observation and photography to avoid disrupting natural ecosystems.
2. Ecosystem disturbance monitoring: During fieldwork, a portable environmental monitor was used to record microclimate parameters (temperature, humidity)and noise levels at 10% of sampling plots. Post-survey analysis showed no significant differences (p > 0.05) between disturbed (plot periphery) and undisturbed areas, confirming that field activities did not alter local microenvironments.
3. Sustainable data processing: All spatial data processing used open-source or low-energy-consumption software to reduce carbon emissions from high-performance computing. The total energy consumption of data processing was estimated at 12.6 kWh, equivalent to 8.9 kg CO2 (calculated via IPCC 2022 carbon emission factors), far below the threshold for small-scale ecological studies (≤50 kg CO2, Ye et al., 2024).
2.7.2 Local community consultation
Local community engagement was conducted to align wilderness protection strategies with regional social needs, avoiding conflicts between ecological conservation and livelihood development (Brockington and Schmidt-Soltau, 2004). The consultation process followed the Guidelines for Public Participation in Environmental Impact Assessment (MEP, 2019)and involved three key stakeholder groups:
1. Local residents:200 households in 10 townships adjacent to wilderness areas, selected via stratified random sampling (50%rural, 50%peri-urban). Relevant institutions: Henan Provincial Forestry Department, Henan Ecological Environment Protection Association, and 3 municipal-level nature reserve management bureaus. Pre-fieldwork (March 2021, for needs assessment)and post-results (November 2021, for strategy validation), spanning 8 months.
2. Consultation methods and key outcomes: Focused on residents’perceptions of wilderness value and conservation concerns. Key findings: 78%of rural residents prioritized“balancing wilderness protection with agricultural production”; 65%of peri-urban residents emphasized “controlling urban sprawl into wilderness areas”. Seminars (3 sessions, 20 participants each): Hosted with local institutions to collect technical suggestions. The Henan Forestry Department proposed integrating wilderness patches with existing ecological corridors; the Ecological Environment Protection Association recommended adding “traditional agricultural heritage” as a low-impact factor in MCE. In-depth interviews (n = 15):With long-term residents (≥20 years of local residency) to identify unrecorded wilderness areas, which were later included in the Boolean screening process, increasing the total wilderness area by 3.2%.
3. Integration of consultation outcomes: Adjusted the wilderness priority protection map to exclude 210 km2of farmland buffer zones identified by residents; Revised the MCE biophysical naturalness index to assign a normalized value of 0.6 (previously 0.3) to low-intensity terraced farming, aligning with community needs for sustainable livelihoods; Shared the final wilderness protection recommendations with local institutions.
2.8 Identifying wilderness patches based on boolean overlays
The 2020 land use/cover change (LUCC) data (30 m × 30 m spatial resolution) of Henan Province was used as the basis, combined with the historical remote-sensing images from the Google Earth Engine platform for data validation and supplementation. Data processing applies the Define Projection tool of the ArcGIS 10.6 platform to unify the coordinate system of the LUCC dataset, the settlement vector data, and the road traffic network data, and establishes the GCS_WGS_1984 geographic coordinate system datum.
Based on the theoretical framework of ecological interference, we focused on extracting two types of interference elements of cultivated land (including paddy land and dry land) and construction land (including urban land, rural settlements, industrial and mining land, and other artificial surfaces) in the LUCC classification system, and at the same time, we integrated the settlement distribution data and the vector data of the main transportation road network.
The spatial analysis technique was used to construct a composite disturbance evaluation model to analyze the 1 km radius circular buffer zones for urban and rural settlements, linear element buffer zones for transportation arteries, and surface element buffer zones for intensive farming areas. After realizing the spatial alignment of multi-source data through raster-vector conversion, the Boolean Overlay algorithm was used to perform spatial joint operations on the three types of disturbance buffers, and non-disturbed areas were extracted through the reverse mask to generate the wilderness patch atlas of Henan Province (Figure 2). It can be seen that the wilderness areas in Henan Province are mainly concentrated in the western and southern parts of Henan, while the area of wilderness areas in the northern and eastern parts of Henan is significantly smaller.
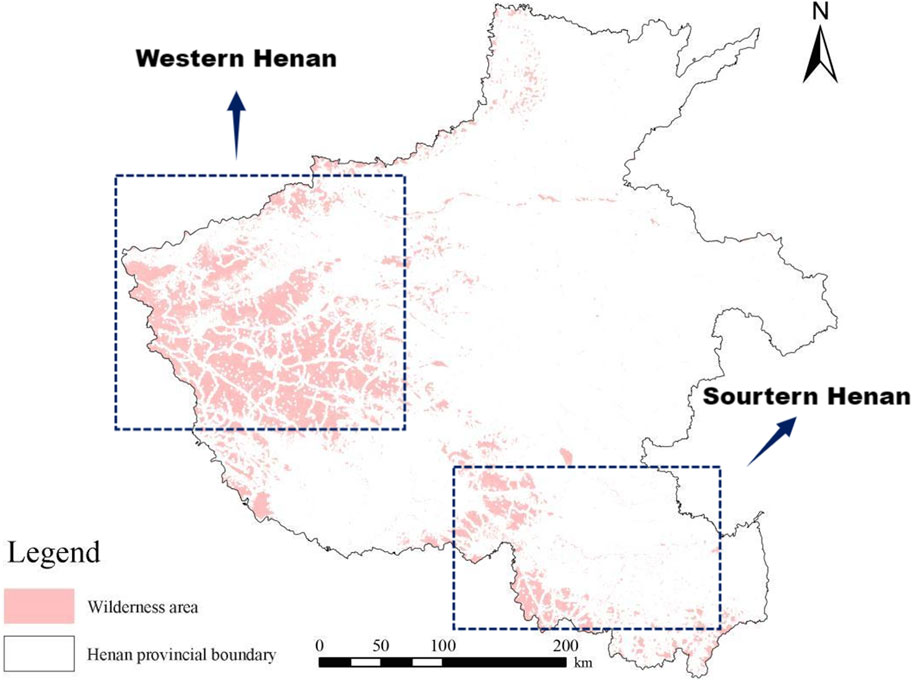
Figure 2. Spatial identification of wilderness patches in Henan Province in 2020.
3 Results
3.1 Analysis of wilderness quality in Henan province based on multi-objective evaluation method
3.1.1 Construction of wilderness indicator system in Henan province
In this paper, we select the data of urban and rural construction land in China in 2020, first convert the surface data to point data, calculate the distance using the Euclidean distance analysis tool and carry out the normalization process, and use the obtained result as the remoteness from the agglomeration. Degree indicator. The higher the value of the raster, the farther the raster is from the core area of human settlement, the intensity of direct interference by human activities is relatively weakened, and the greater the possibility of becoming a natural wilderness area.
The osm road dataset in Henan Province was selected, calculated, and normalized using the Euclidean distance analysis tool, and the result was used as an indicator of remoteness from roads. The higher the value, the more distant the raster is from the road and the less likely it is to be affected by human transportation activities. The 2020 land use data were selected and subdivided into six primary types of arable land, forest land, grassland, water bodies, construction land and unutilized land, as well as 22 secondary types based on the standards of Classification of Land Use Status (GB/T21010-2017) and the actual situation of the study area (Figure 3).
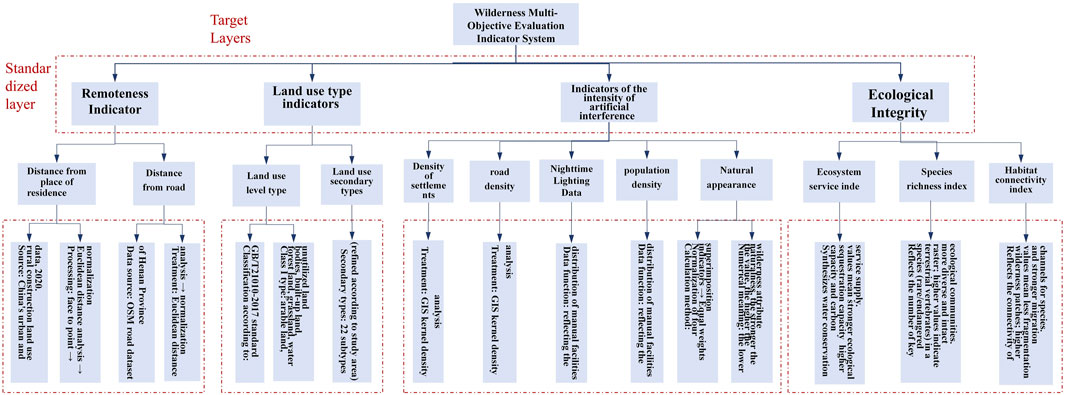
Figure 3. Wilderness indicator system construction.
To quantitatively assess the influence of anthropogenic infrastructure on wilderness areas, we incorporated spatially explicit proxy variables that capture the presence and intensity of artificial facilities. Key sources of human disturbance were represented using Nighttime Light Data and Population Density raster datasets, in addition to base layers of roads and residential areas. These datasets effectively serve as proxies for anthropogenic pressure, enhancing the sensitivity of our evaluation to human impacts. The spatial distribution of these disturbance factors was analyzed using the Kernel Density tool in ArcGIS, which calculates the magnitude of point or line features per unit area within a neighborhood. After generating kernel density surfaces for each variable, all layers were normalized to a consistent scale [0, 1] using the extreme deviation method. The resulting normalized rasters were then integrated using equal-weighted overlay to produce a composite measure of Naturalness in Appearance. Lower values in this composite indicate minimal influence from artificial facilities, corresponding to higher naturalness in visual and structural landscape attributes, and thus better reflect the authentic qualities of wilderness.
3.1.2 Determination of weights for wilderness indicators in Henan province
To construct a comprehensive wilderness evaluation system, seven core indicators were selected to quantify wilderness quality through a multi-dimensional framework. These indicators include: (1) remoteness from settlements, (2) distance from roads, (3) biophysical naturalness, (4) naturalness in appearance, (5) species richness index, (6) ecosystem service index, (7) habitat connectivity index (Martin and Watson, 2016; Carver et al., 2013). The inclusion of ecological integrity metrics—species richness, ecosystem services, and habitat connectivity—extends the conventional evaluation framework beyond spatial remoteness and physical naturalness, thereby providing a more holistic assessment of wilderness value.
To mitigate the influence of varying units and scales across indicators, a logarithmic normalization procedure was applied to the raw data. The weights of these indicators were determined through an integrated weighting approach that combined the Analytic Hierarchy Process (AHP) and the Coefficient of Variation (CoV) method. The AHP weights were derived from expert-based pairwise comparisons structured through a judgment matrix, while CoV weights were calculated statistically based on the variability of each indicator’s values across the study area.
The final weight assigned to each indicator was obtained by fusing the AHP and CoV weights using an arithmetic mean method, resulting in a balanced weighting scheme that incorporates both subjective expert judgment and objective data variability (Table 6). The consistency ratio (CR) of the AHP judgment matrix was 0.0116, which is well below the threshold value of 0.10, confirming acceptable consistency and reliability of the pairwise comparisons. The fused weights for each indicator are as follows: Remoteness from settlements (0.1735), Distance from roads (0.1015), Biophysical naturalness (0.311), Naturalness in appearance (0.07), Species richness index (0.1615), Ecosystem service index (0.1565), and Habitat connectivity index (0.09). These weights were subsequently used to compute the Wilderness Quality Index (WQI) for assessing the spatial distribution and conservation priority of wilderness areas in Henan Province.
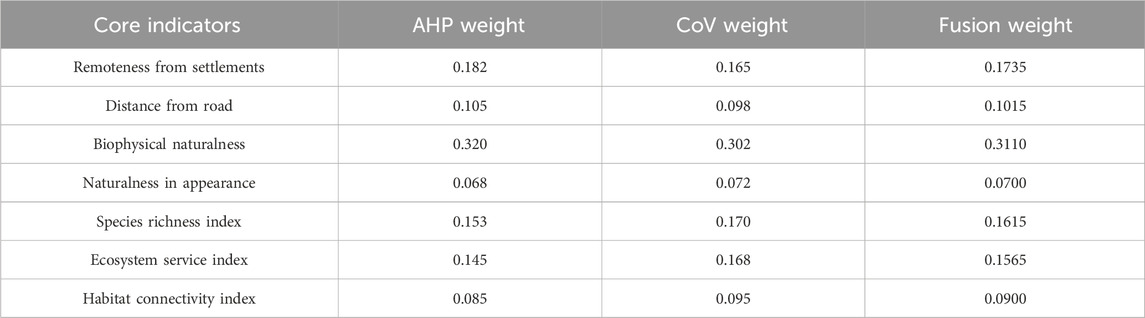
Table 6. Wilderness indicator judgment matrix.
3.1.3 Quality class analysis of wilderness land in Henan Province
The spatial distribution of different wilderness qualities in Henan Province can be seen in the wilderness map of Henan Province drawn according to the multi-indicator evaluation method (Figure 4), and the wilderness continuum mapping is drawn through ArcGIS raster computation to visualize the wilderness quality of Henan Province. Among them, the wilderness indicators of distance from the settlement, distance from the road and biophysical naturalness in the wilderness continuum map are significantly larger in the western Henan region than in the rest of Henan Province, while in the wilderness continuum map of the road buffer zone, the wilderness indicators in the central Henan region are larger.
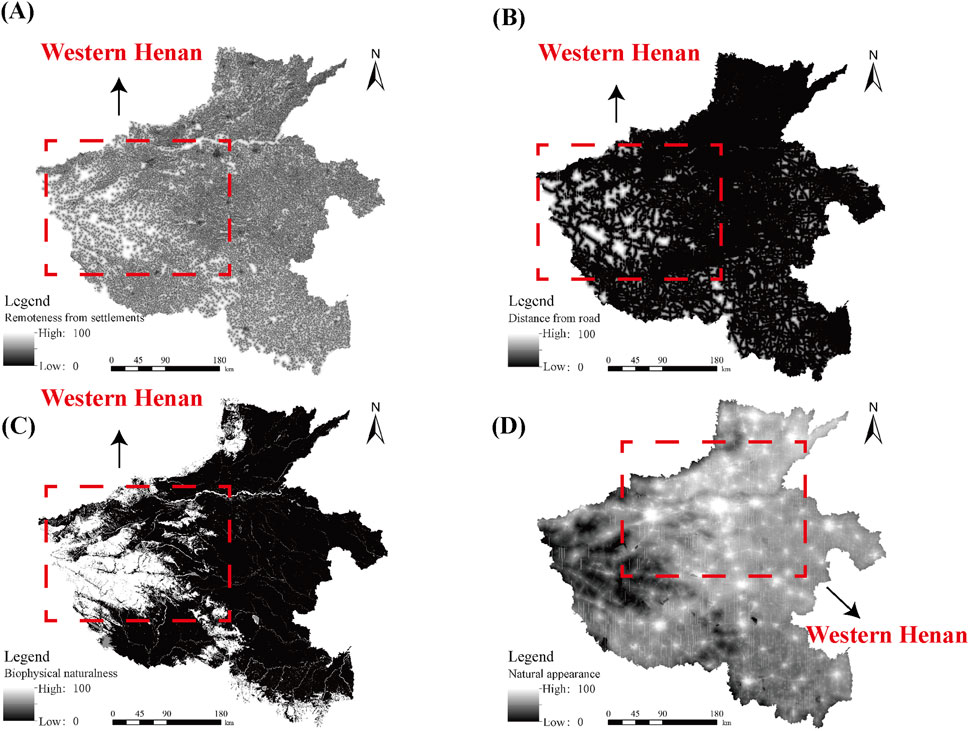
Figure 4. Multi-index wilderness continuum map of Henan Province. (A) is the wilderness continuum map of the distance from the habitat, (B) is the wilderness continuum map of the distance from the road, (C) is the wilderness continuum map of the biophysical naturalness, and (D) is the wilderness continuum map of the road buffer zone.
Referring to the previous research results, the classification scheme of 10-level gradient was found to have the best performance, so in this paper, the index data were normalized and the wilderness map of Henan Province was classified into 10 levels using the natural breakpoint method, and the 10th level represented the highest level of wilderness quality (Radford et al., 2019). In order to deeply analyze the spatial distribution characteristics of the wilderness quality in Henan Province, this paper further subdivided these ten levels into three categories: low-quality wilderness land (Level 1–3), medium-quality wilderness land (Level 4–7), and high-quality wilderness land (Level 8–10) (Carver et al., 2013), so as to achieve a more systematic and detailed analysis.
The analysis of the composition structure of each wilderness shows that there are significant differences in the areas of low-quality, medium-quality and high-quality wilderness in Henan Province. The grade of medium-quality wilderness is significantly larger than that of low-quality and high-quality wilderness, and the area of low-quality wilderness is the smallest. The areas of low-quality, medium-quality and high-quality wilderness were 17,443.99 km2, 113,918.24 km2 and 34,570.95 km2 respectively (Table 7). As can be seen from the classification of each wilderness grade (Figure 5A), the wilderness area of wilderness grade 5 is significantly higher and much larger than that of the other wilderness grades, with a wilderness area of 41,239.85 square kilometers. The wilderness area of wilderness grade 1 is the lowest, with a wilderness area of only 24.39 square kilometers. The proportions in the total area of wilderness were 10.51%, 68.65%, and 20.83% respectively (Figure 5B), indicating that Henan Province is mainly composed of medium-quality wilderness. The proportion of wilderness natural areas with larger area, higher biophysical naturalness and better integrity within the provincial administrative region of Henan is relatively small.
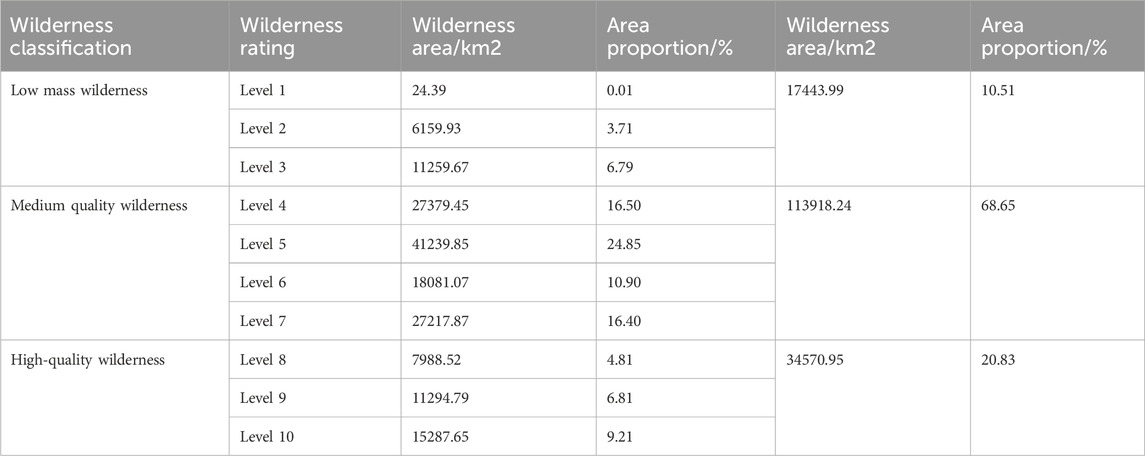
Table 7. Area and percentage of wilderness by class.
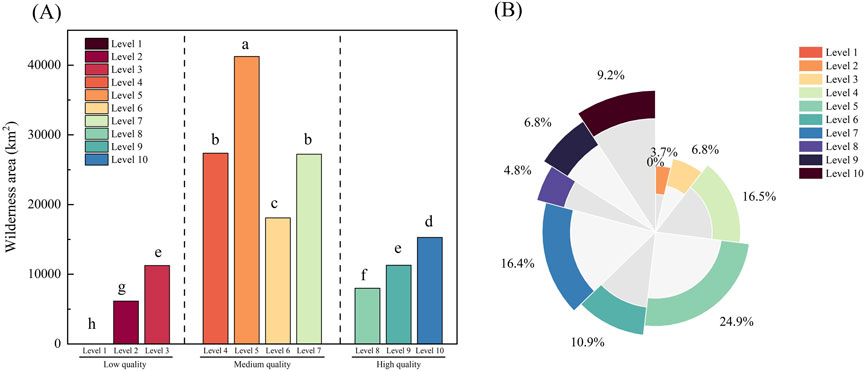
Figure 5. Analysis of the differences in wilderness area among different wilderness Grades. (A) Analysis of the bar chart of wilderness area in different wilderness grades, and (B) is the proportion of the pie chart of wilderness area in different wilderness grades.
3.1.4 Accuracy assessment of wilderness classification
The overall accuracy (OA) of the wilderness classification was 91.3%, and the Kappa coefficient was 0.87, which indicates a “substantial agreement” between the model-classified results and field observations. This confirms that the Boolean-MCE method can effectively identify wilderness in Henan Province. The detailed confusion matrix is shown in Table 8.
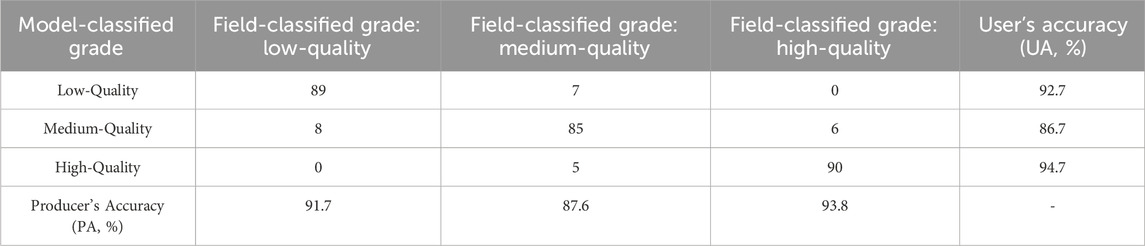
Table 8. Confusion matrix of wilderness classification accuracy.
There were significant differences in classification accuracy between non-transitional zones and transitional zones (Table 9): Non-transitional zones (n = 220 plots): OA = 95.4%, Kappa = 0.92. High-quality wilderness in the western Funiu Mountain area had the highest PA (97.2%) and UA (96.8%), as the natural landscape is less disturbed and consistent with model predictions. Transitional zones (n = 80 plots): OA = 82.5%, Kappa = 0.75, which was lower thannon-transitional zones.
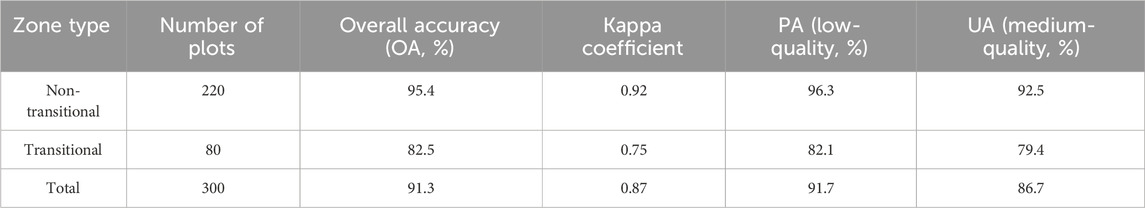
Table 9. Classification accuracy comparison between non-transitional and transitional zones.
3.2 Analysis of the spatial distribution of wilderness land quality in Henan Province
In general (Figure 6), the spatial distribution of the quality of wilderness in Henan Province shows significant geographical differences, which is manifested in the fact that the quality of wilderness in the northern, western and southern regions is significantly better than that in the eastern and central regions, and that the western part of Henan Province - the junction of Sanmenxia City, Luoyang City, and Nanyang City - has a high elevation, complex terrain, and high vegetation cover. The western part of Henan Province - the junction of Sanmenxia City, Luoyang City and Nanyang City - has higher elevation, complex terrain, and high vegetation cover, thus forming wilderness natural areas that are larger in size, with relatively low intensity of human interference, and with well-maintained natural ecology; while the wilderness areas in the northern and southern parts of Henan Province show a “fragmented” and “strip-like” pattern. Low-quality wilderness is mainly distributed in the central plains and the annexes of major transportation routes, showing the distribution characteristics of “continuous” distribution, especially in Zhengzhou City, Xinxiang City and Luoyang City and other economically more developed urban agglomerations, which, due to the concentration of the population, the huge scale of urban construction and the high intensity of human activities, constitute a far-reaching impact on the surrounding natural environment. These cities, due to population concentration, large-scale urban construction, and intense interference from human activities, have had a profound impact on the surrounding natural environment, which has led to a general decline in the quality of natural wilderness. Medium-quality wilderness, as a transition zone from high-quality wilderness to low-quality wilderness, is mainly located in the eastern part of Henan Province and the buffer zones of various road networks, which not only retain a relatively good natural ecological base, but also suffer from a certain degree of human activities, and display a unique style between primitive wildness and slight disturbance.
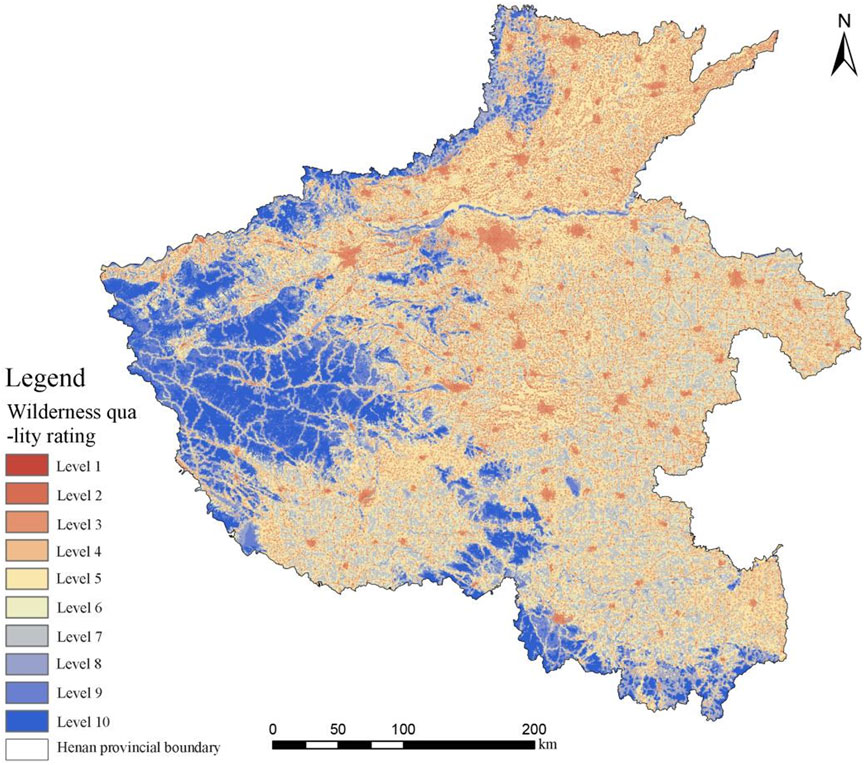
Figure 6. Distribution of wilderness quality classes in Henan Province, based on natural breakpoint classification of Ci values. Note: Wilderness quality levels in the figure: Low wilderness quality (Levels 1–3, Ci ≤ 0.35) is shown in light blue, concentrated in the Central Plains (Zhengzhou-Xinxiang); Medium wilderness quality (Levels 4–7, 0.35 < Ci < 0.70) is shown in green, distributed in the hilly transition zone (Pingdingshan-Nanyang); High wilderness quality (Levels 8–10, Ci > 0.70) is shown in dark red, primarily along the western Niu’ao Mountains (Sanmenxia-Luoyang) and the southern edge of the Nanyang water system; Henan’s provincial boundary is indicated by a solid black line; major urban agglomerations (labeled: Zhengzhou, Luoyang, Xinxiang); nature reserves are shown by dashed black lines, overlapping 15.05% with wilderness areas.
In terms of the distribution area of wilderness in different elevation zones (Table 10), low-quality wilderness and medium-quality wilderness in Henan Province are mainly concentrated below 300 m above sea level, accounting for 94.08% and 87.63% of the total area of wilderness of each level, respectively, and high-quality wilderness is mainly concentrated at an elevation of more than 300 m above sea level, accounting for 72.86% of the total area of wilderness, which suggests that the distribution elevation of high-quality wilderness in Henan Province is higher than that of low- and medium-quality wilderness. This indicates that the distribution elevation of high-quality wilderness in Henan Province is higher than that of low-quality wilderness and medium-quality wilderness. From the overall vertical distribution pattern of wilderness (Figure 7), it can be seen that the quality of wilderness increases with the elevation, the distribution rate of low-quality wilderness is the highest in the elevation ≤100 m, which accounts for 67.29% of the area of wilderness at this level; the distribution rate of medium-quality wilderness is the highest in the elevation ≤100 m, which accounts for 62.38% of the area of wilderness at this level; the distribution rate of high-quality wilderness is the highest in the elevation range of 800–1200 m, which accounts for 22.86% of the area of wilderness at this level. The highest distribution rate of high-quality wilderness was found in the 800–1200 m elevation range, which accounted for 22.86% of the wilderness area at this level.
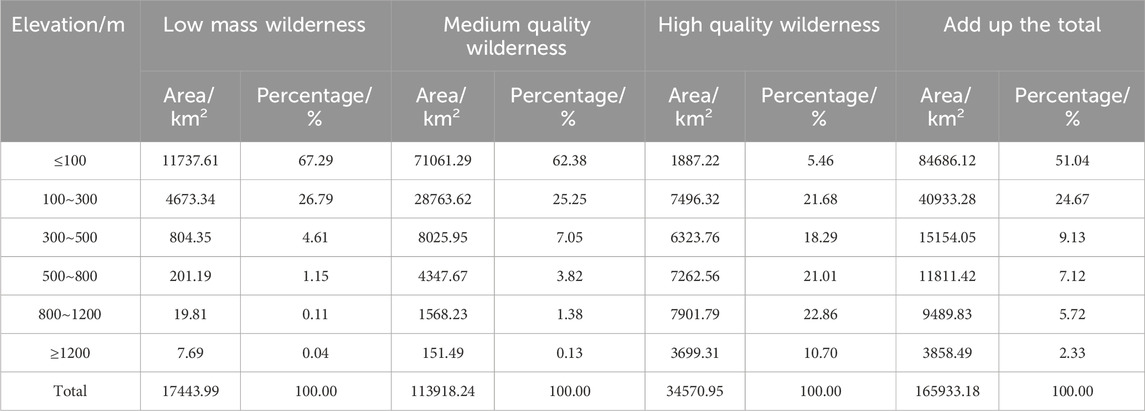
Table 10. Cotton yield and water production efficiency under different water treatments.
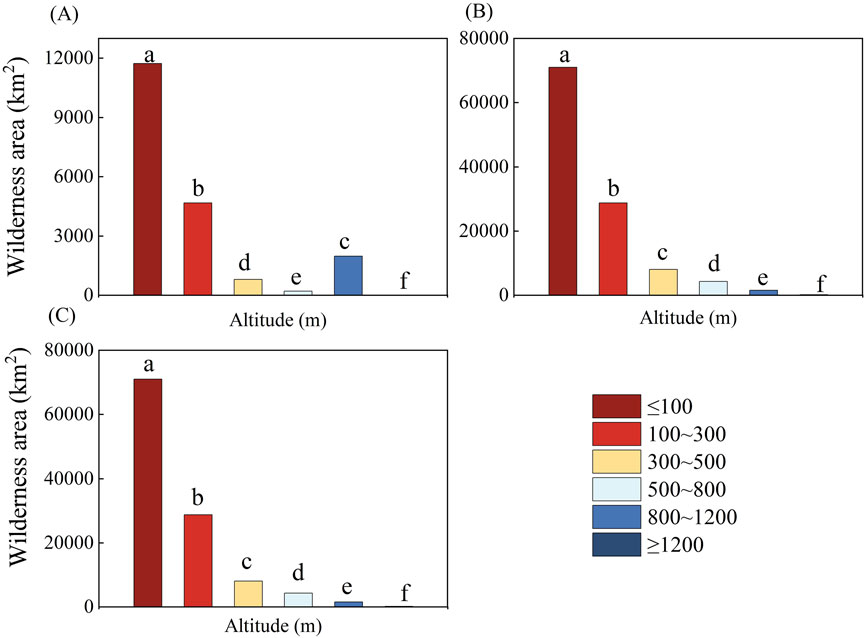
Figure 7. Analysis of the differences in wilderness distribution area among various altitude intervals. (A) represents the wilderness area of low-quality wilderness at each altitude, (B) represents the wilderness area of low-quality wilderness at each altitude, and (C) represents the wilderness area of high-quality wilderness at each altitude.
3.3 Analysis of wilderness protection patterns in Henan Province
The study obtained the spatial distribution map of wilderness in Henan Province with quality levels by overlaying the wilderness patches identified by Boolean operation technique with the wilderness quality assessment map (Figure 8, and the spatial distribution map of wilderness in Henan Province was classified into 10 levels using the natural breakpoint method, and the 10th level represents the part of wilderness with the highest quality. In order to deeply analyze the spatial distribution characteristics of wilderness quality in Henan Province, this paper further subdivided these ten grades into three categories: low-quality wilderness (Grades 1–3), medium-quality wilderness (Grades 4–7), and high-quality wilderness (Grades 8–10) (Carver et al.,. 2013). Among them, the area occupied by 8–10 high-quality wilderness in the western part of Henan Province is significantly larger, while the quality of wilderness in the other regions is significantly smaller.
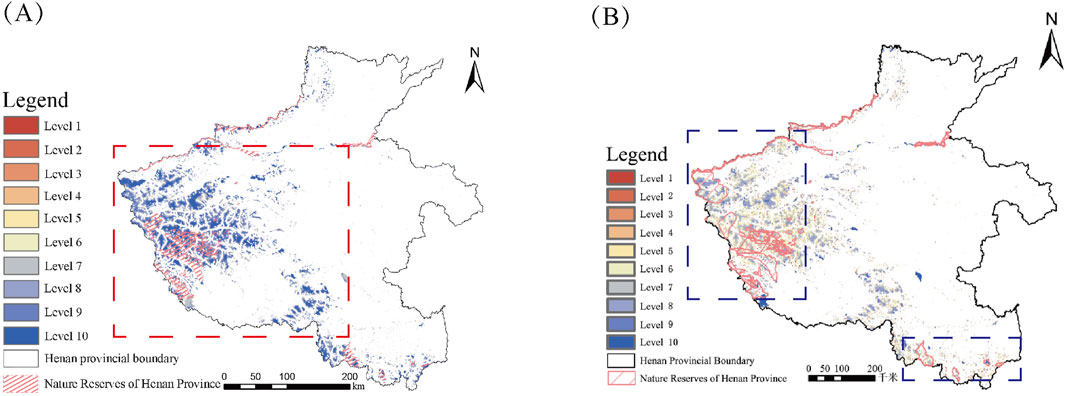
Figure 8. Spatial distribution of wilderness areas in Henan Province (A) shows the mass distribution of wilderness in 2020, and (B) shows the mass distribution of wilderness in 2010.
Based on the comparative analysis of the spatial distribution of wilderness and nature reserves in Henan Province, combined with the results of wilderness protection coverage calculation (Table 11), it can be seen that there are 7.20 km2 of low-quality wilderness, 474.42 km2 of medium-quality wilderness, and 2,535.78 km2 of high-quality wilderness in the nature reserves; at the same time, 13.89% of the low-quality wilderness is within the protected area, and 86.11% is outside the protected area. Meanwhile, 13.89% of the low-quality wilderness is within the protected area and 86.11% is outside the protected area; 12.47% of the medium-quality wilderness is within the protected area and 87.53% is outside the protected area, and the protected areas are mainly located in the Danjiang Wetland and the Lushi Giant Salamander; and only 15.66% of the high-quality wilderness is within the protected area, which is located in the Henan Founou Mountain, the Nanyang Dinosaur Eggs Fossil Complex National Nature Reserve, and the Xixia Giant Salamander, which fails to form a complete coverage of high-quality wilderness. Overall, the area of wilderness in Henan Province is 20,052.60 km2, and the area of wilderness covered by nature reserves is only 3,017.40 km2, i.e., 84.95% of the existing wilderness has not been included in the scope of protection, and there is a large area of protection gaps in the wilderness area, which requires urgent enhancement of the planning, reasonable protection and management.
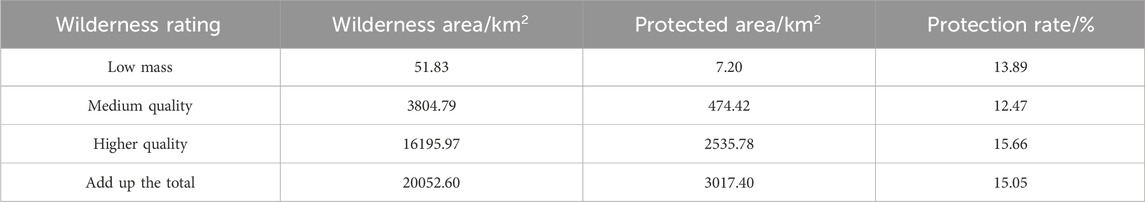
Table 11. Analysis of wilderness protection.
3.4 Dynamic changes of wilderness in Henan Province (2000–2020)
3.4.1 Temporal variation of wilderness area and quality
This section analyzes the spatiotemporal changes in wilderness area and its quality classification from 2000 to 2020, based on the data presented in the accompanying table. Overall, a consistent declining trend in total wilderness area is observed over the two-decade period. Specifically, the total wilderness area decreased from 24,895.32 km2 in 2000 to 20,052.60 km2 in 2020, representing a net reduction of 4,842.72 km2 and an average annual decline rate of 0.98%. Notably, high-quality wilderness exhibited the most pronounced decrease, both in absolute and relative terms. It declined from 5,218.76 km2 to 3,457.09 km2, with a total loss of 1,761.67 km2 and an annual rate of −2.11%, indicating heightened vulnerability or anthropogenic pressure on the most pristine regions.
Medium-quality wilderness also experienced a substantial reduction, falling from 13,689.45 km2 to 11,391.82 km2, a total decrease of 2,297.63 km2, corresponding to an average annual rate of −0.91%. This suggests ongoing degradation or conversion of moderately intact ecosystems. In contrast, low-quality wilderness showed a relatively moderate decline over the entire period, decreasing from 5,987.11 km2 to 5,203.69 km2, with a net loss of 783.42 km2 and an annual rate of −0.66%. Interestingly, between 2010 and 2020, this category registered a slight increase (+0.15% per year), which may indicate regrowth, reclassification, or recovery in some degraded areas, though further investigation is needed to confirm the underlying causes.
In summary, all wilderness quality classes experienced net losses between 2000 and 2020, with high-quality wilderness undergoing the most rapid decline. These trends highlight the ongoing contraction and qualitative degradation of wilderness areas, underscoring the urgency for enhanced conservation measures (Table 12).
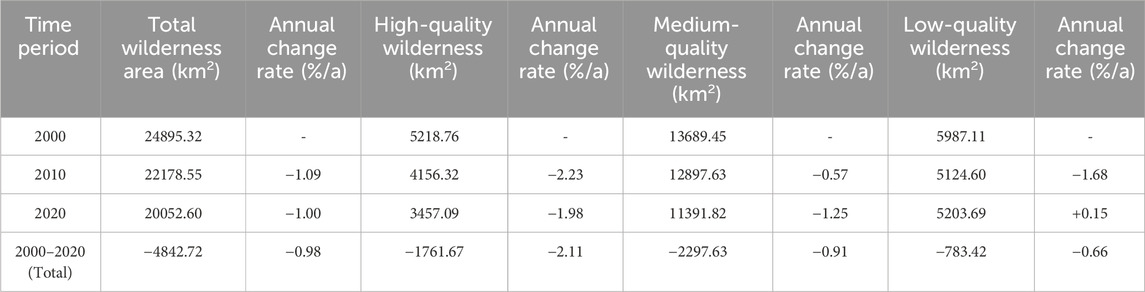
Table 12. Temporal changes in Wilderness area and Mass from 2000 to 2020.
3.4.2 Spatial pattern of wilderness dynamic changes
From 2000 to 2020,wilderness change hotspots in Henan Province exhibited spatiotemporal differentiation characterized by “western retreat and eastern expansion. “Degradation and restoration processes dynamically adjusted in response to evolving human activity intensity and policy intervention paradigms (Figure 9). Regarding degradation hotspots: In 2000, moderate degradation (95%confidence level, average annual degradation rate of 1%–2%) centered on Nanyang City in southwestern Henan, forming fragmented patches driven by traditional slope cultivation and early urban sprawl; By 2010, the hotspot shifted to the Luoyang–Sanmenxia belt in western Henan, with Luoyang and Sanmenxia upgrading to moderate degradation (95% confidence level), while Nanyang downgraded to mild degradation (90% confidence level, 0.5%–1%).During this phase, wilderness compression was primarily driven by the westward expansion of the Luoyang metropolitan area and mineral development in Sanmenxia. By 2020, Sanmenxia emerged as a hotspot of severe degradation (99% confidence level, annual degradation rate>2%). The mountain-plain continuum spanning Sanmenxia–Luoyang–Jiyuan suffered complete disruption of wilderness habitat connectivity due to the expansion of the Lianhuo Expressway and the clustering of energy industries.
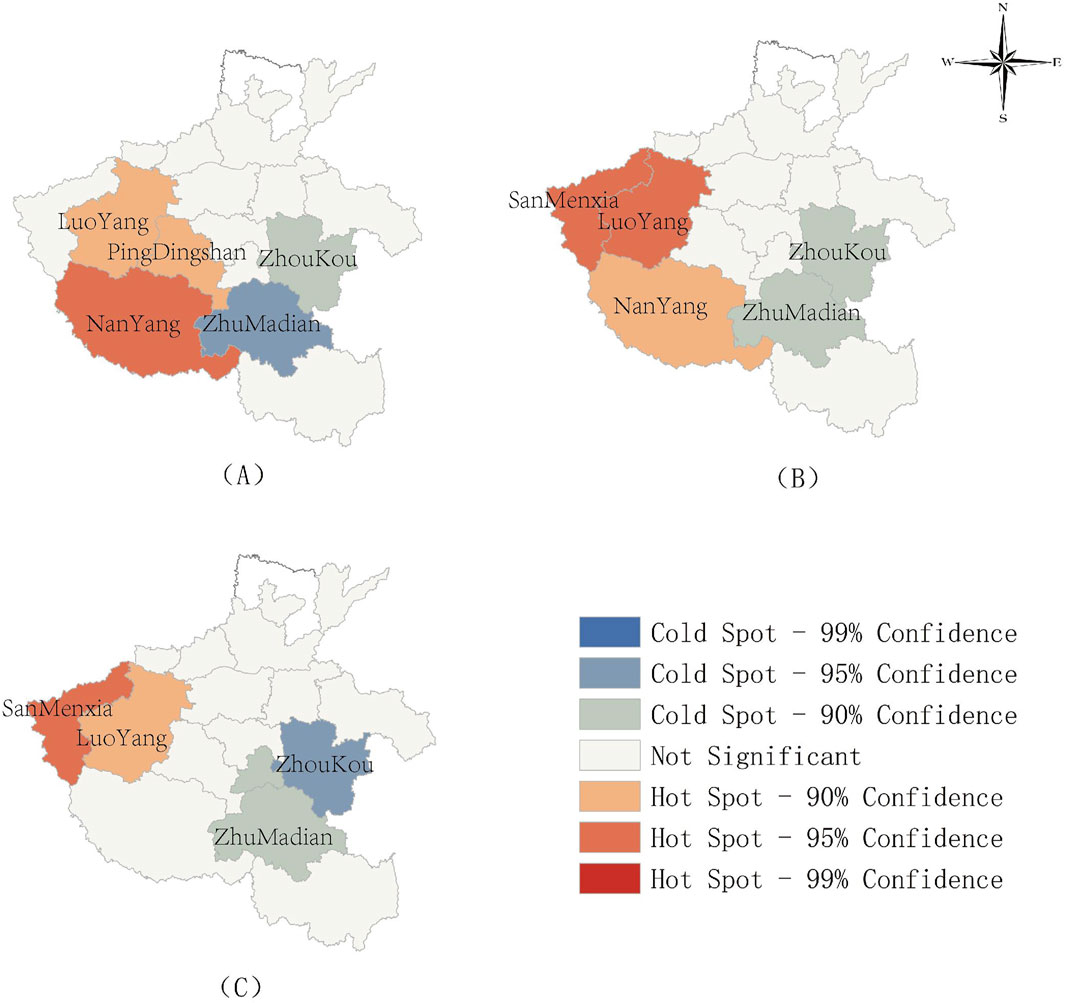
Figure 9. Spatial pattern of wilderness change hotspots in Henan Province, 2000–2020. (A) 2000年. (B) 2010年. (C) 2020年.
The evolution of restoration hotspots was deeply linked to policy responses:In 2000, southern Henan’s Zhumadian achieved significant restoration (99% confidence level, annual growth rate>1%) through the Grain-for-Green Program, enabling wilderness to expand rapidly via natural recovery.By 2010, project effects plateaued, causing it to decline to a non-significant zone, while eastern Henan’s Zhoukou–Luohe region retained only scattered mild recovery (90%confidence level, <0.5%); By 2020, Zhoukou in eastern Henan upgraded to a moderate restoration hotspot (95% confidence level, 0.5%–1%) due to the Yellow River Basin’s“reclamation-to-wetland”initiative, South-to-North Water Diversion source area restoration,and agricultural structure optimization. Restoration patterns in eastern and southern Henan shifted from scattered distribution to concentrated contiguous areas.
4 Discussion
As a key spatial unit to maintain ecosystem integrity and biodiversity, the quality level and spatial distribution characteristics of wilderness land directly reflect the health of the regional ecological security pattern (Ma and Pan, 2024; Tang et al., 2024). In this study, we found that the wilderness in Henan Province is mainly of low to medium quality, accounting for 79.16%, and high quality wilderness only accounts for 20.83%, and shows significant geographic differentiation characteristics, and the high quality wilderness (Grade 8–10) is centrally distributed in the western Furniu Mountain system and cross-border river corridors, and this distribution characteristic is significantly positively correlated with the altitudinal gradient and the degree of vegetation cover. This distribution feature is significantly positively correlated with the elevation gradient and vegetation cover. The high altitude area effectively avoids agricultural reclamation and urban expansion due to the topographic barrier effect and low transportation accessibility, which is consistent with the findings of the study by Zoderer et al. (2020) in the biodiversity hotspot area. In contrast, the high proportion of arable land and dense road network in the central plains led to the continuous distribution of low-quality wilderness, verifying the assertion of Brockington and Schmidt-Soltau (2004) and Leopold (1921) that “agricultural intensification drives wilderness degradation”. It is worth noting that the medium-quality wilderness (Class 4–7) in the eastern Yellow-Huaihuai Plain is mildly disturbed, but its patch shape index suggests that the landscape is severely fragmented, which may become a key transition zone for ecological corridor restoration. This spatial pattern is consistent with the law of “Chinese wilderness quality increases with topographic gradient” proposed by Lesslie (2016), confirming the synergistic mechanism of topographic barriers and human activity intensity on wilderness quality. Vertically, wilderness quality increased with elevation in a stepwise manner. The 72.86% of high quality wilderness was distributed above 300 m above sea level, of which 22.86% was in the 800–1200 m range, which is consistent with the “mountain sheltering effect” found in the Minjiang River Basin (Lesslie and Taylor, 1985), where the topographic complexity limits the extension of mechanized agriculture and infrastructure. The wilderness connectivity index was significantly lower in the low elevation area than in other areas due to the cutting of irrigation canals and roads, suggesting that habitat fragmentation needs to be mitigated through ecological network optimization (Dietz et al., 2015).
The coverage of wilderness in the nature reserve system of Henan Province is seriously inefficient, with only 15.05% of wilderness included in the protection scope, and the protection rate of high-quality wilderness is less than 16%, which is far below the 30% threshold recommended by the IUCN (Mudalige and Carver, 2024; Schwartz et al., 2016). The protection of vacant areas is concentrated in the northern foothills of the western Furniu Mountains and the eastern yellow floodplain wetlands, which have high naturalness and biodiversity potential, but face the risk of habitat insularity due to the fragmentation of administrative boundaries and the sparse network of protected areas. Compared with the “landscape prioritization model” proposed by Shen et al. (2025), the current conservation strategy in Henan Province fails to effectively identify the importance of transboundary ecological corridors, resulting in a connectivity index of high-quality wilderness patches that is lower than that of similar areas in neighboring provinces. In order to achieve a sustainable balance between ecological security and regional development, wilderness protection in Henan Province needs to break through the traditional “static boundary delimitation” thinking and build an integrated framework of “quality classification, dynamic monitoring, and cross-border synergy”.
This study’s analysis indicates that human activities, particularly agricultural intensification and urban expansion, exert profound and spatially heterogeneous impacts on wilderness degradation in Henan Province. Agricultural intensification—manifested as the consolidation of smallholder farms into large-scale, high-standard farmland—is the primary driver of mild wilderness degradation (annual degradation rate of 0.5%–2%) on the Huang-Huai Plain in eastern Henan. This process not only replaces natural vegetation with monocultures but also introduces high levels of chemical inputs (such as fertilizers and pesticides), irrigation infrastructure, and field roads, collectively reducing biophysical naturalness and landscape connectivity. The expansion of agricultural peripheries gradually erodes transitional semi-natural areas, leading to homogenization of land cover and weakened ecosystem functions like water conservation and soil retention. Urbanization and transportation infrastructure expansion have triggered more severe degradation (annual degradation rate >2%), particularly within the Zhengzhou-Luoyang-Xinxiang metropolitan area. Rapid urban sprawl directly consumes vast tracts of natural land, while associated highway networks (such as the expanded Beijing-Hong Kong-Macau Expressway) fragment once-continuous wilderness patches into isolated islands. This fragmentation hinders species migration and gene exchange, undermining complex population dynamics and long-term ecological resilience. Nighttime light data and road density metrics further confirm that areas with high anthropogenic radiation and accessibility correlate closely with wilderness quality loss. Equally noteworthy is that the combined impacts of urban and agricultural expansion often exhibit synergistic effects: urban demand for agricultural products accelerates farmland expansion, while improved rural roads enhance market accessibility, further stimulating land conversion. However, policy interventions have demonstrated potential to curb these trends. Ecological restoration projects—such as the Yellow River Basin Ecological Protection Initiative and the South-to-North Water Diversion Source Area Restoration Project—have facilitated wilderness recovery in the Yellow River floodplains of eastern Henan and around the Danjiangkou Reservoir. These initiatives typically involve returning farmland to wetlands and forests, establishing ecological corridors, and restricting industrial development. Collectively, they help reverse habitat fragmentation and enhance ecosystem integrity. This demonstrates that integrating wilderness conservation into regional land-use planning and ecological redline policies can slow further degradation, even in highly urbanized areas.
While the coupled Boolean-MCE framework proposed in this study has shown strong effectiveness in Henan Province—a region characterized by a clear west-east topographic gradient and moderate human disturbance intensity—its direct applicability to regions with more complex topography, heterogeneous climates, or diverse socio-economic conditions is limited, primarily due to the fact that the indicator selection, parameter settings, and disturbance thresholds in the current framework are calibrated based on Henan’s specific natural and anthropogenic characteristics. For regions with complex topography, the 1 km uniform buffer overestimates human disturbance in areas with intense terrain undulation due to topographic barriers, and the existing elevation grading fails to capture high-altitude features, requiring the introduction of a terrain undulation index to modify buffer distances and revision of elevation intervals to align with regional topographic traits. In climate-heterogeneous regions, the current biophysical naturalness index—biased toward vegetation cover—underestimates wilderness quality in arid areas where sparse desert steppe is a natural feature, and ignores climate-specific disturbances; thus, it is necessary to adjust biophysical naturalness grading for arid ecosystems and add climate disturbance indicators to the MCE system. For regions with complex socio-economic conditions, the framework’s reliance on nighttime light and road density fails to capture fine-scale urban disturbances, and its classification of all agricultural reclamation as “high interference” over-excludes low-impact traditional farming, calling for the integration of POI density and public transit flow into urban disturbance indicators and the addition of a “farming intensity index” to distinguish low-impact agricultural activities. To enhance generalizability, a modular and dynamic optimization path is proposed: retain 4 core indicators as a “fixed module” while adding “regional adaptation modules” based on specific scenarios, replace fixed AHP-CoV fusion weights with a machine learning-based dynamic weight model trained on regional characteristic variables, and conduct cross-regional verification in representative complex regions to establish a scalability adaptation guide—an approach that aligns with the global trend of “regionally adaptive wilderness mapping” and provides a reference for wilderness identification beyond Henan Province. While the Boolean-MCE framework provided a robust baseline for wilderness assessment, emerging machine learning techniques offer opportunities for further refinement. For instance, deep learning models can automatically learn hierarchical features from raw satellite imagery, reducing reliance on manually designed indicators and threshold-based rules (Vali et al., 2020). Such approaches are particularly advantageous in capturing non-linear relationships between human disturbance and ecological responses, which are often overlooked in traditional MCE methods (Ha et al., 2020). Moreover, the integration of recurrent neural networks (RNNs) with time-series satellite data could enable dynamic monitoring of wilderness quality, capturing seasonal and inter-annual variations in ecological integrity—a limitation of our current static analysis.
5 Conclusion
1. Horizontal spatial distribution, low-quality wilderness, medium-quality wilderness, and high-quality wilderness accounted for 10.51%, 68.65%, and 20.83% of the total area of Henan Province, and the quality of wildernesses in the north, west, and south of Henan Province is better than that in the east and central part of the province; high-quality wildernesses are concentrated in the water system and the high topography, while most of the wildernesses in the central plains and the periphery of the main transportation routes are low-quality wildernesses, and medium-quality wildernesses are distributed as transition zone, distributed in the east and the buffer zone of the road network, showing the coexistence of nature and slight disturbance.
2. In terms of vertical spatial distribution, the distribution of wilderness in Henan Province varies significantly with altitude, with low- and medium-quality wilderness mainly concentrated below 300 m above sea level, while high-quality wilderness is more distributed above 300 m. The quality of wilderness increases with altitude, with low- and medium-quality wilderness accounting for a high proportion of the wilderness at low altitude areas, while high-quality wilderness is most distributed in the region of high altitude (800–1200 m).
3. Analyzing the spatial distribution data of nature reserves and wilderness areas in Henan Province, it is found that the areas of low-, medium-, and high-quality wildernesses in the nature reserves are 7.20 km2, 474.42 km2, and 2535.78 km2, respectively, but the overall protection coverage rate is low. The area of wilderness in the province is 20,052.60 km2, and the area of wilderness covered by nature reserves is only 3,017.40 km2, i.e., 84.95% of the existing wilderness is not included in the scope of protection, and there is a large area of protection gaps in the wilderness area, which is urgently in need of strengthening the planning and management, in order to improve the current situation of the protection of the wilderness land in Henan Province.
4. Despite the robust framework proposed in this study, several limitations should be acknowledged. First, the Boolean-MCE method relies heavily on the availability and accuracy of spatial datasets, such as land use/cover, road networks, and nighttime light data. Inconsistencies in data resolution or temporal misalignment may introduce uncertainties in wilderness identification, particularly in rapidly changing peri-urban areas. Second, the threshold values for disturbance buffers were adopted from existing literature and regional adaptations, which may not fully capture the nuanced human impacts in all contexts. Third, the MCE weighting system, though integrating both subjective (AHP) and objective (CoV) methods, remains sensitive to expert judgment and regional specificity, limiting its direct transferability to other provinces or countries without recalibration.
5. To address these limitations and further advance wilderness mapping methodologies, future research should focus on the following aspects: (i) Incorporating dynamic and high-resolution remote sensing data to enhance the temporal and spatial accuracy of wilderness monitoring; (ii) Developing adaptive thresholding mechanisms that can automatically adjust disturbance buffers based on local ecological and socio-economic contexts; (iii) Integrating deep learning models for automated feature extraction and dynamic monitoring of wilderness areas using multi-temporal satellite data; (iv) Exploring transfer learning techniques to adapt pre-trained models to other regions with limited labeled data, enhancing the generalizability of the Boolean-MCE framework.
Data availability statement
The original contributions presented in the study are included in the article/supplementary material, further inquiries can be directed to the corresponding author.
Author contributions
YR: Methodology, Writing – original draft. SW: Writing – original draft, Software. BC: Software, Writing – review and editing. YD: Data curation, Writing – review and editing. RC: Funding acquisition, Writing – review and editing.
Funding
The author(s) declare that financial support was received for the research and/or publication of this article. The study was supported by the National Natural Science Foundation of China (NSFC) (52309018); Key R & D projects in Henan Province (241111112600) Research and development of key technologies and intelligent devices for real-time and efficient water-fertilizer-drug green coordinated regulation in farmland; Technical Assistance Project (TA-6883): Accelerating Gender Equality in East Asia for an Inclusive and Green Recovery-Water resources management and gender mainstreaming construction in the Yellow River Basin; This project is supported by special fund of Henan Key Laboratory of Water Pollution Control and Rehabilitation Technology (CJSZ2024008) The mechanism of soil water and nitrogen migration, carbon emission reduction and crop product quality improvement under the regulation of domestic reclaimed water irrigation.
Conflict of interest
The authors declare that the research was conducted in the absence of any commercial or financial relationships that could be construed as a potential conflict of interest.
Generative AI statement
The author(s) declare that no Generative AI was used in the creation of this manuscript.
Any alternative text (alt text) provided alongside figures in this article has been generated by Frontiers with the support of artificial intelligence and reasonable efforts have been made to ensure accuracy, including review by the authors wherever possible. If you identify any issues, please contact us.
Publisher’s note
All claims expressed in this article are solely those of the authors and do not necessarily represent those of their affiliated organizations, or those of the publisher, the editors and the reviewers. Any product that may be evaluated in this article, or claim that may be made by its manufacturer, is not guaranteed or endorsed by the publisher.
References
Almeida, B., David, J., Campos, F. S., and Cabral, P. (2024). Satellite-based machine learning modelling of ecosystem Services indicators: a review and meta-analysis. Appl. Geogr. 165, 103249. doi:10.1016/j.apgeog.2024.103249
Barrick, K. A., and Beazley, R. I. (1990). Magnitude and distribution of option value for the Washakie Wilderness, northwest Wyoming, USA. Environ. Manage. 14, 367–380. doi:10.1007/BF02394205
Brockington, D., and Schmidt-Soltau, K. (2004). The social and environmental impacts of wilderness and development. Oryx 38, 140–142. doi:10.1017/S0030605304000250
Cao, Y., Carver, S., and Yang, R. (2019). Mapping wilderness in China: comparing and integrating Boolean and WLC approaches. Landsc. Urban Plan. 192, 103636. doi:10.1016/j.landurbplan.2019.103636
Carver, S., Comber, A., McMorran, R., and Nutter, S. (2012). A GIS model for mapping spatial patterns and distribution of wild land in Scotland. Landsc. Urban Plan. 104, 395–409. doi:10.1016/j.landurbplan.2011.11.016
Carver, S., Tricker, J., and Landres, P. (2013). Keeping it wild: mapping wilderness character in the United States. J. Environ. Manage. 131, 239–255. doi:10.1016/j.jenvman.2013.08.046
Ceauşu, S., Gomes, I., and Pereira, H. M. (2015). Conservation planning for biodiversity and wilderness: a real-world example. Environ. Manage. 55, 1168–1180. doi:10.1007/s00267-015-0453-9
Dietz, M. S., Belote, R. T., Aplet, G. H., and Aycrigg, J. L. (2015). The world’s largest wilderness protection network after 50years: an assessment of ecological system representation in the U.S. National Wilderness Preservation system. Biol. Conserv. 184, 431–438. doi:10.1016/j.biocon.2015.02.024
Din, S. U., and Mak, H. W. L. (2021). Retrieval of land-use/land cover change (LUCC) maps and urban expansion dynamics of Hyderabad, Pakistan via Landsat datasets and support vector machine framework. Remote Sens. 13 (16), 3337. doi:10.3390/rs13163337
Ha, T. V., Tuohy, M., Irwin, M., and Tuan, P. V. (2020). Monitoring and mapping rural urbanization and land use changes using Landsat data in the northeast subtropical region of Vietnam. Egypt. J. Remote Sens. Space Sci. 23 (1), 11–19. doi:10.1016/j.ejrs.2018.07.001
Leopold, A. (1921). The wilderness and its place in Forest recreational Policy. J. For. 19, 718–721. doi:10.1093/jof/19.7.718
Leroux, S. J., and Rayfield, B. (2014). Methods and tools for addressing natural disturbance dynamics in conservation planning for wilderness areas. Divers. Distrib. 20, 258–271. doi:10.1111/ddi.12155
Lesslie, R. (2016). “The wilderness continuum concept and its application in Australia: lessons for modern conservation,” in Mapping wilderness: concepts, techniques and applications. Editors S. J. Carver, and S. Fritz (Netherlands, Dordrecht: Springer), 17–33. doi:10.1007/978-94-017-7399-7_2
Lesslie, R. G., and Taylor, S. G. (1985). The wilderness continuum concept and its implications for Australian wilderness preservation policy. Biol. Conserv. 32, 309–333. doi:10.1016/0006-3207(85)90021-7
Lin, S., Wu, R., Hua, C., Ma, J., Wang, W., Yang, F., et al. (2016). Identifying local-scale wilderness for on-ground conservation actions within a global biodiversity hotspot. Sci. Rep. 6, 25898. doi:10.1038/srep25898
Luyssaert, S., Schulze, E.-D., Börner, A., Knohl, A., Hessenmöller, D., Law, B. E., et al. (2008). Old-growth forests as global carbon sinks. Nature 455, 213–215. doi:10.1038/nature07276
Ma, L., and Pan, J. (2024). Spatial identification and priority conservation areas determination of wilderness in China. J. Clean. Prod. 451, 142069. doi:10.1016/j.jclepro.2024.142069
Martin, T. G., and Watson, J. E. M. (2016). Intact ecosystems provide best defence against climate change. Nat. Clim. Change 6, 122–124. doi:10.1038/nclimate2918
Mudalige, U., and Carver, S. (2024). Unveiling Sri lanka’s wilderness: GIS-based modelling of wilderness attributes. Land 13, 402. doi:10.3390/land13040402
Radford, S. L., Senn, J., and Kienast, F. (2019). Indicator-based assessment of wilderness quality in mountain landscapes. Ecol. Indic. 97, 438–446. doi:10.1016/j.ecolind.2018.09.054
Schwartz, M. K., Hahn, B. A., and Hossack, B. R. (2016). Where the wild things are: a research agenda for studying the wildlife-wilderness relationship. J. 114, 311–319. doi:10.5849/jof.15-070
Shen, L., Zhai, D., and Li, C. (2025). Wilderness beyond the natural: mapping urban novel wilderness to support ecological conservation and recreational provision in rapidly urbanizing areas. Ecol. Indic. 170, 112953. doi:10.1016/j.ecolind.2024.112953
Strus, I., and Carver, S. (2024). Developing a wilderness quality index for Continental Europe. Land 13, 428. doi:10.3390/land13040428
Tang, X., Chen, J., Wen, N., Chen, Y., Meng, W., Xu, W., et al. (2024). Spatiotemporal evolution and influencing factors analysis of wilderness in China. Environ. Impact Assess. Rev. 106, 107513. doi:10.1016/j.eiar.2024.107513
Vali, A., Comai, S., and Matteucci, M. (2020). Deep learning for land use and land cover classification based on hyperspectral and multispectral Earth observation data: a review. Remote Sens. 12, 2495. doi:10.3390/rs12152495
Wang, Q., Fu, A., Yan, C., Hou, P., and Luan, X. (2024). Spatial identification and conservation gaps of wilderness areas in the state-owned Forest Region of daxing’anling. Diversity 16, 594. doi:10.3390/d16100594
Watson, J. E. M., Shanahan, D. F., Di Marco, M., Allan, J., Laurance, W. F., Sanderson, E. W., et al. (2016). Catastrophic declines in wilderness areas undermine global environment targets. Curr. Biol. 26, 2929–2934. doi:10.1016/j.cub.2016.08.049
Xu T, T., Chen, R., Carver, S., and Wu, J. (2024). Mapping potential conflicts between wilderness travel and ecological values on a national scale. Landsc. Urban Plan. 246, 105029. doi:10.1016/j.landurbplan.2024.105029
Xu Z, Z., Liao, L., Hou, S., Gan, Q., Shen, S., Cao, Y., et al. (2024). Modeling multi-scale relationships between wilderness area changes and potential drivers: evidence from the southeast coastal area of China. J. Nat. Conserv. 78, 126583. doi:10.1016/j.jnc.2024.126583
Ye, J., Xiao, C., Feng, Z., and Qiao, T. (2024). A review of global wilderness area identification since the 21st century. J. Environ. Manage. 358, 120946. doi:10.1016/j.jenvman.2024.120946
Zhu, R., Liu, W., Xue, R., Teng, S., Wang, Y., Pan, Y., et al. (2024). Linking wilderness mapping and ecosystem services: identifying integrated wilderness and ecological indicators to quantify ecosystem services of wilderness. Ecol. Indic. 160, 111915. doi:10.1016/j.ecolind.2024.111915
Zoderer, B. M., Carver, S., Tappeiner, U., and Tasser, E. (2020). Ordering “wilderness”: variations in public representations of wilderness and their spatial distributions. Landsc. Urban Plan. 202, 103875. doi:10.1016/j.landurbplan.2020.103875
Zoderer, B. M., Hainz-Renetzeder, C., and Vuolo, F. (2024a). Mapping wild nature areas to identify priority areas for urban rewilding in cities: a process-oriented approach. Urban For. Urban Green. 101, 128549. doi:10.1016/j.ufug.2024.128549
Keywords: Henan Province, wilderness mapping, Boolean identification, multi-criteria evaluation method (MCE), spatial distribution of wilderness areas
Citation: Ren Y, Wang S, Cui B, Ding Y and Cao R (2025) Research on wilderness area identification and distribution of spatial characteristics based on Boolean-multi-indicator evaluation approach —a case study of wilderness areas in Henan Province, China. Front. Environ. Sci. 13:1650454. doi: 10.3389/fenvs.2025.1650454
Received: 19 June 2025; Accepted: 17 September 2025;
Published: 01 October 2025.
Edited by:
Hugo Wai Leung MAK, Hong Kong University of Science and Technology, Hong Kong SAR, ChinaReviewed by:
Yuan Kang, China University of Mining and Technology, ChinaSafri Salam, Universitas Muhammadiyah Buton, Indonesia
Copyright © 2025 Ren, Wang, Cui, Ding and Cao. This is an open-access article distributed under the terms of the Creative Commons Attribution License (CC BY). The use, distribution or reproduction in other forums is permitted, provided the original author(s) and the copyright owner(s) are credited and that the original publication in this journal is cited, in accordance with accepted academic practice. No use, distribution or reproduction is permitted which does not comply with these terms.
*Correspondence: Shuyi Wang, enpxenpyMTMxNkAxNjMuY29t