 Yanjun Hou
 Juemei Wu
 Yanxi Guo
- 1Department of Geography, Xinzhou Teachers University, Xinzhou, China
- 2Faculty of Geography Science, Shanxi Normal University, Taiyuan, China
Assessment and predictive analysis of the ecological environment quality of river basins are important for achieving coordinated development between ecological protection and high-quality development. In this study, we simulated and analyzed the spatiotemporal patterns of future land use and habitat quality in the Yellow River Basin using the PLUS and InVEST models. The results show that: (1) from 2000 to 2020, grassland, cultivated land, and forest land dominated the land categories, with a continuous loss of cultivated land and rapid expansion of construction land; (2) under the natural development scenario (NG-S), construction land expanded significantly; under the ecological protection scenario (EP-S), grassland increased; under the cultivated land protection scenario (AP-S), cultivated and construction land increased while ecological land decreased; and under the coordinated development scenario (CEPAP-S), cultivated land and grassland increased slightly; (3) overall stability was observed from 2000 to 2020, but with an internal trend of “polarization”; and (4) in the future, only the EP-S and CEPAP-S scenarios are projected to improve habitat quality, whereas other scenarios would lead to degradation.
1 Introduction
Habitat quality refers to an ecosystem’s ability to provide suitable living conditions for individual organisms and populations (Hillard et al., 2017). It serves, to some extent, as an indicator of biodiversity within a given region and aids in assessing the overall health of the ecosystem (Sharp et al., 2018; Du et al., 2023). Habitat quality directly influences the sustainable development of a locality (Wang and Wang, 2023). Globally, habitat degradation is recognized as a primary driver of biodiversity loss (Newbold et al., 2020). By impairing essential ecosystem services such as water conservation and soil retention, habitat degradation threatens environmental security, food production, and human wellbeing, thereby posing a direct challenge to achieving the United Nations Sustainable Development Goals (SDGs) (Wood et al., 2018; Chaplin-Kramer et al., 2019). Therefore, understanding the spatial and temporal dynamics of habitat quality changes is of significant scientific importance for aligning ecological conservation efforts with regional development goals (Wang and Wang, 2023).
The evolution of habitat quality is influenced by various factors, with land use and land cover change (LUCC) being the most significant anthropogenic driver (Newbold et al., 2020). LUCC disrupts the dynamics of material and energy flows by causing landscape fragmentation, habitat loss, and reduced connectivity, which subsequently lead to declines in biodiversity and degradation of ecosystem functions (Haddad et al., 2015; Allan et al., 2014). Therefore, investigating the spatiotemporal patterns of habitat quality, projecting future trajectories, and analyzing their relationship with land use changes are essential for promoting regional sustainability.
Land use simulation is a critical approach for analyzing and forecasting future land use dynamics (Jia et al., 2025). Commonly used models in this field include CLUE-S (Kucsicsa et al., 2019), FLUS (Liu et al., 2017), and CA-Markov (Jana et al., 2022). While these models can predict spatial patterns of land use change to some extent, they have limitations in accurately capturing the evolution of patch morphology and the complexities of edge diffusion during intricate transitions among land use types (Shi et al., 2021; Liang et al., 2021). The PLUS (Patch-generating Land Use Simulation) model addresses these limitations by integrating the Land Expansion Analysis Strategy (LEAS) with a multi-class stochastic patch generation mechanism (CARS), thereby improving simulation accuracy and providing a spatially explicit representation of complex land use evolution processes (Liang et al., 2021; Hu et al., 2022). This integration effectively overcomes the constraints of traditional CA-Markov and FLUS models, offering advantages such as high-precision simulation capabilities and rapid computational performance. Moreover, the PLUS model demonstrates proficiency in accurately simulating the complex development of diverse land use patches (Li et al., 2021; Hu et al., 2022).
In the context of expanding from traditional biodiversity conservation to ecosystem service optimization (Ouyang et al., 2020) and sustainable development pathway decision-making, habitat quality in the Yellow River Basin of China has been extensively studied. For example, Yang et al. (2021) evaluated the spatial and temporal dynamics of habitat quality in the Yellow River Basin from 2000–2018. Similarly, Liu et al. (2024) assessed habitat quality specifically within the Inner Mongolia segment of the basin, covering the years 2000–2020. Li et al. (2024) further investigated spatial and temporal variations in habitat quality along the main stem of the Yellow River. Despite these contributions, relatively few studies have employed an integrated approach combining the PLUS model and the InVEST model to analyze habitat quality in this region. The PLUS model enhances the accuracy and computational efficiency of simulating complex land use evolution processes by incorporating the LEAS and the CARS mechanism (Liang et al., 2021; Hu et al., 2022). Concurrently, the InVEST model, characterized by its modular architecture, minimal data requirements, and strengths in spatial visualization (Sharp et al., 2018), has emerged as a pivotal tool for quantifying habitat quality changes under multiple scenarios. Integrating these two models within the PLUS–InVEST coupling framework (Li et al., 2021) advances habitat quality research from mere pattern description toward a comprehensive paradigm encompassing mechanism analysis, scenario simulation, and policy optimization. The present study applies this coupled modeling approach to examine the future evolution of land use spatial patterns and habitat quality in the Yellow River Basin for the years 2030, 2040, and 2050. The findings aim to provide critical insights to inform sustainable land use planning, ecological conservation, and the promotion of high-quality development within the basin.
2 Materials and methods
2.1 Study area
The Yellow River Basin (95°53′–119°05′E and 32°10′–41°50′N) is the second-longest river system in China (Figure 1). The Yellow River is often revered as the “Mother River of China.” Its basin covers a total drainage area of 795,000 km2, including 42,000 km2 of the interior basin. The watershed spans approximately 1900 km from east to west and 1,100 km from west to south. Its source lies near Yueguzonglie Qu. The river traverses a diverse landscape, flowing through nine provinces—Qinghai, Sichuan, Gansu, Ningxia, Inner Mongolia, Shanxi, Shaanxi, Henan, and Shandong—before emptying into the Bohai Sea. Its course crosses terrain marked by significant elevation differences, with higher elevations in the west and lower elevations in the east. The basin serves as a crucial ecological barrier but is also widely regarded as ecologically fragile. In recent years, rapid economic development and increasing human activity have led to growing ecological and environmental issues in the Yellow River Basin (Xu and Wang, 2020), including soil erosion, biodiversity loss, and land desertification, which have degraded the regional ecosystem. Consequently, China proposed a national strategy for ecological protection and high-quality development of the Yellow River Basin (Zhao et al., 2020), intensifying efforts to safeguard and manage the region. This study offers a scientific basis for the ecological governance and environmental restoration of this region.
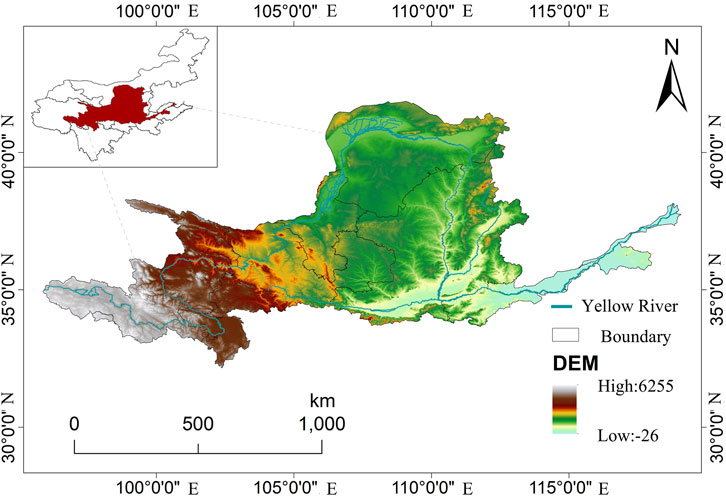
Figure 1. Schematic of the yellow river basin.
2.2 Materials
In this study, we used land use, climate, environmental, and socioeconomic data from the study area. Land use raster data from 2000 to 2020 were sourced from the Resources and Environmental Data Sharing Center, Chinese Academy of Sciences, Beijing, China (https://www.resdc.cn/), with a classification accuracy of over 95%. Land use is classified into six main categories: arable land, forest, grassland, water bodies, construction, and unused land. The soil data were compiled by Gao Yixin, Li Jin, and colleagues at the Nanjing Institute of Soil Research, Chinese Academy of Sciences, and adapted according to the FAO soil classification system. To support data processing, all raster data were clipped using the official standard map boundaries of China, uniformly resampled to a resolution of 30 m × 30 m, and reprojected to the Krasovsky_1940_Albers coordinate system. The Yellow River Basin features a highly fragile ecosystem characterized by heterogeneous land use patterns, complex topography, and significant variations in soil fertility and climatic conditions. Land use, elevation, slope gradient, and soil type directly influence vegetation coverage and ecological stability. Mean temperature and precipitation determine hydrothermal regimes, thereby affecting ecosystem typology and productivity. Distances to river networks, roads, and administrative centers reflect anthropogenic disturbance intensity, while GDP and population density quantify socioeconomic development levels and human pressure. Collectively, these factors shape habitat quality, serving as critical indicators for robust ecological assessment and conservation in the basin. Additionally, 11 land-use driving factor datasets were generated using Euclidean distance calculations in ArcGIS, as shown in Table 1. In the LEAS module of the PLUS model, these variables are used to determine the development probability and driving factor intensity for each type of land use.
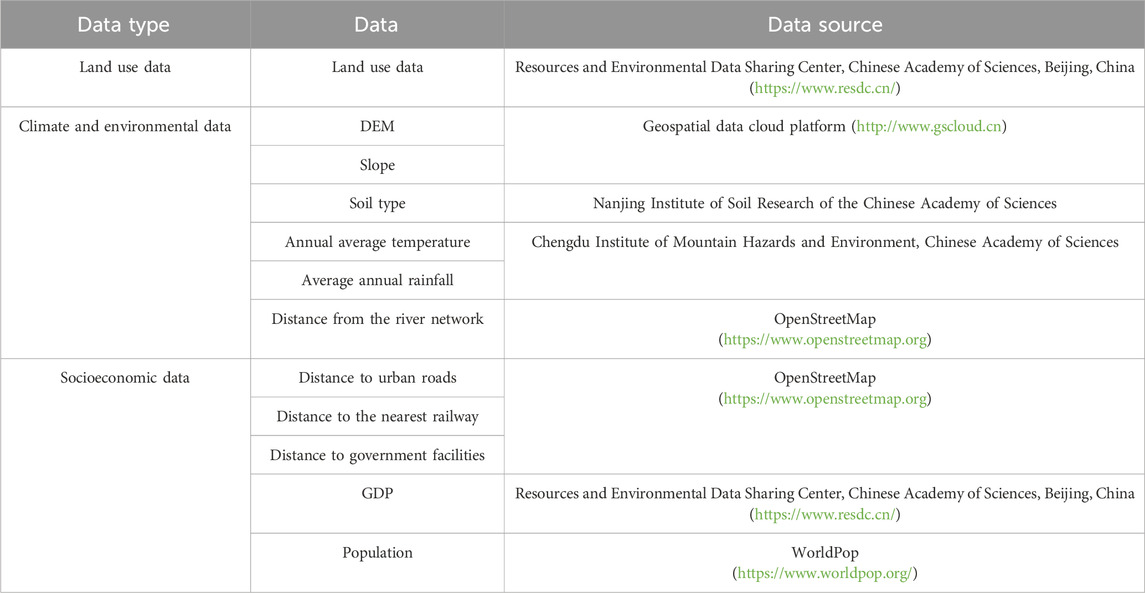
Table 1. Data source information table.
2.3 Methods
2.3.1 PLUS model
The PLUS model is a land-use change simulation model that integrates two models, namely, the Land Expansion Analysis Strategy (LEAS) rule-based mining framework and the multiclass random seed mechanism-based cellular automata (CA) model. The LEAS module uses an ensemble classifier based on decision trees. Random samples were drawn from the initial training dataset using the random forest algorithm to determine the development probability and magnitude of drivers for each type of land use,
Where
The development probability map generated by the LEAS module serves as input for the CA module, which generates new land use patches based on these probability values. In the CARS module, the mechanisms of random seed and multi-type random patch generation are based on a gradually decreasing threshold and are combined to simulate the spontaneous emergence of land-use patches under the constraint of development probability (Liang et al., 2021; Jia et al., 2025). When the neighborhood effect of land type k is equal to 0 under the Monte Carlo method, the overall development probability surface of each land type
Where
The operational procedure of the PLUS model employed in this study is outlined as follows:
1. LEAS module and CA model utilizing multi-class random patch seeds: This research focuses on the Yellow River Basin, using land use datasets from 2000, 2010, and 2020. Areas exhibiting land use changes were extracted and sampled, after which the random forest algorithm was applied to identify underlying land use change patterns. Expansion data from 2000 to 2010, along with eleven driving factors, were input into the LEAS module to derive development probabilities for each land use category during the 2000–2010 period and to simulate the land use configuration for 2020. Following accuracy validation, land use data from 2010 to 2020, together with the same set of driving factors, were input into the LEAS module to obtain development probabilities for that period. Subsequently, using the CA model based on multi-class random patch seeds, land use patterns for the Yellow River Basin were projected for 2030, 2040, and 2050 under a natural development scenario.
2. Neighborhood weights and transition matrix: Based on the empirical conditions of the study area and relevant literature (Liang et al., 2021; Jia et al., 2025), conversion rules between land use types were established, where a value of “1” indicates permissible conversion between two land categories and “0” indicates prohibited conversion. Simultaneously, by integrating the land use transition matrix from 2000 to 2020 with the actual regional context, neighborhood factor weights for each land use type were determined as follows: cropland (0.658), forestland (0.085), grassland (0.418), water bodies (0.198), built-up land (0.768), and unused land (0.097).
2.3.2 Situation setting translation
Scenario I: Natural Growth Scenario (NG-S). This scenario follows historical change patterns and is based mainly on the land use transfer probability matrix from 2010 to 2020 in the Yellow River Basin, as well as suitable distribution probabilities used to set simulation conditions.
Scenario II: Eco-Priority Scenario (EP-S). In this scenario, ecological protection is prioritized (Ding et al., 2021). When setting domain weights, the probability of forest land transferring to construction land decreases by 50%, the probability of grassland transferring to construction land decreases by 20%, and the probabilities of arable land and water bodies transferring to construction land decrease by 30%. Conversely, the probability of arable land transferring to forest land and grassland increases by 30%.
Scenario III: Arable Land Protection Scenario (AP-S). This scenario focuses on protecting arable land. When assigning domain weights, the probability of arable land transferring to other land uses decreases by 50%, while other land uses maintain their natural development trends.
Scenario IV: Economic Development Scenario (ED-S). This scenario emphasizes economic development. In terms of domain weights, the probabilities of arable land, forest land, and grassland transferring to construction land increase by 20%, while the probabilities of construction land transferring to forest land, grassland, water bodies, and unused land decrease by 30%.
Scenario V: Coordinated Development of Ecological Protection and Arable Land Protection Scenario (CEPAP-S). This scenario balances ecological protection and arable land protection. In terms of domain weights, the probability of arable land transferring to forest land increases by 30%, while the probabilities of arable land transferring to grassland, water bodies, construction land, and unused land decrease by 50%. The probability of forest land transferring to construction land decreases by 50%, the probability of grassland transferring to construction land decreases by 20%, and the probability of water bodies transferring to construction land decreases by 30%.
2.3.3 InVEST model
Land use and land cover are intrinsically linked to habitat quality, with the intensity of human activity serving as a primary driver of land-use change. In this study, habitat quality (HQ) in the Yellow River Basin was assessed using the HQ module of the InVEST model. This module evaluates the effects of threat factors on habitat quality by incorporating land-use data and the spatial interactions between threats and habitat types. The primary input data required for this module include land use/land cover (LULC) maps, major threat factors, the weights and impact distances of threat sources, and the sensitivity of each LULC type to specific threats. These parameters were assigned based on the InVEST Model User’s Guide and established methodologies from prior research (Yang et al., 2021), with detailed configurations presented in Table 2. The results were spatially quantified to represent habitat degradation and biodiversity loss in the study area. Areas experiencing high human disturbance tended to have lower habitat quality. HQ degradation was calculated using Equation 3:
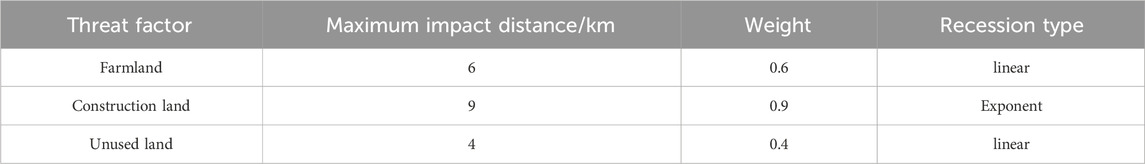
Table 2. The weight and maximum influence distance of the threat factor.
Where
where
Habitat quality was assessed using Equation 5:
Where
In this study, cultivated land, construction land, and unused land were selected as threat factors affecting HQ. The model inputs included maximum influence distance, weight, decline type, and the sensitivity of each land-use type to each threat factor. Specific parameters are listed in Tables 2, 3 (Tallis et al., 2013; Chen et al., 2023; Li et al., 2024a; Limin et al., 2019; Jia et al., 2025).
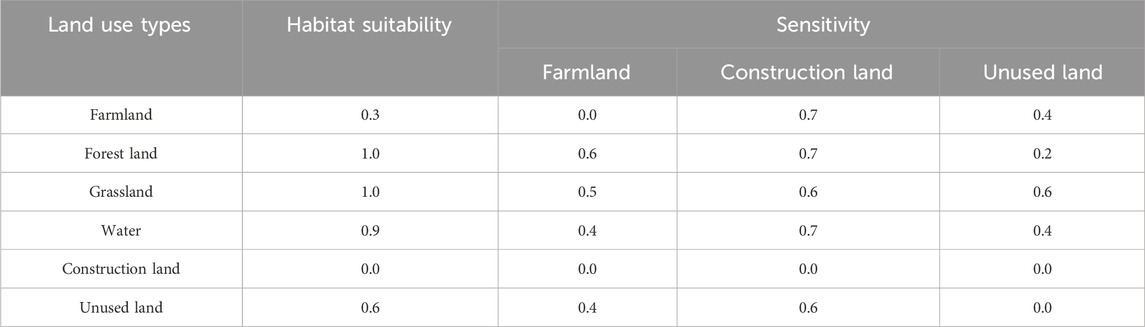
Table 3. Sensitivity of different land use types to habitat threat factors.
3 Results and analysis
3.1 Spatial patterns of land use
The cultivated land area in the Yellow River Basin decreased continuously from 2000 to 2020, with a total reduction of 12,779.43 km2 over the 20-year period (Figure 2). This reduction was primarily due to the conversion of cultivated land into grassland, forest land, and construction land. Unused land also showed a consistent decline, decreasing by 8,089.29 km2, mainly transitioning to grassland. In contrast, forest land, grassland, water bodies, and construction land increased by 3,340.29 km2, 4,185.29 km2, 1,379.64 km2, and 11,933.49 km2, respectively, during the same period. Among these, the expansion of construction land was the most significant, largely driven by the conversion of cultivated land.
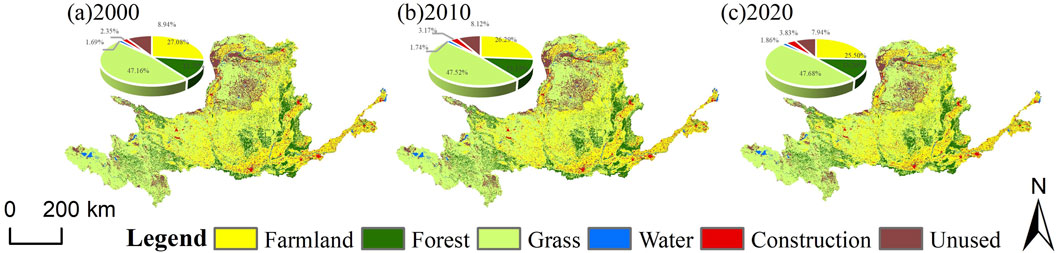
Figure 2. Spatial distributions of land use in the Yellow River Basin from 2000 to 2020.Yellow: Arable land; Light green: Grassland; Red: Built-up land; Green: Forest; Blue: Water bodies; Brown: Unused land. (a) 2000. (b) 2010. (c) 2020.
The spatial distribution and land-use changes in the Yellow River Basin from 2000 to 2020 are shown in Figure 2. During this period, cultivated land, forest land, and grassland were the dominant land-use types, accounting for 86.37%–87.03% of the total area. Grassland had the largest share, ranging from 47.18% to 47.69%, and was primarily distributed in the Yellow River source area, the Hetao Plain, and the Loess Plateau region. Cultivated land was the second most prevalent type, covering 25.48%–27.06% of the basin, mainly concentrated in the Liupan Mountains, Hetao Plain, Guanzhong Plain, Zhongtiao Mountains, and the lower reaches of the Yellow River. Notably, cultivated land exhibited both fragmented and clustered distribution patterns. Forest land ranked third, accounting for 12.79%–13.20% of the total area, and was primarily located in the Qinling, Lüliang, and Zhongtiao Mountains. Unused land, construction land, and water bodies accounted for less than 10% of the total area. The proportion of unused land comprised 7.94%–8.94%, and this land type was primarily found in the Maowusu Desert and the Kubuqi Desert. Construction land accounted for 2.35%–3.82%, and was mainly concentrated in the lower plain regions of the Yellow River Basin. Water bodies constituted the smallest proportion, accounting for 1.69%–1.86%, with most water bodies being distributed along the main river and its tributaries. Among the water bodies, lakes were primarily found in the Qinghai section of the Yellow River Basin.
3.2 Land use simulation
This study was based on land-use data from 2010 and used the PLUS model to predict the spatial layout of land use in 2020. The accuracy of the simulation results was evaluated by calculating kappa coefficients. We found that the kappa coefficient was 0.85, indicating that the simulated results were consistent with the actual spatial layout of land use. In addition, it demonstrated the robust applicability of the PLUS model (Figure 3).
1. In the NG-S scenario, the urban land area in 2050 will increase by 9,465.73 km2 compared with 2020, with a growth rate of 30.61%, and the water body area will increase by 1,434.75 km2, with a growth rate of 9.54%. The other four land types will show a decreasing trend. (2) In the ED-S scenario, the grassland area in 2050 will increase by 9,466.18 km2 compared with 2020, with a growth rate of 2.45%. The other five land types will show a decreasing trend. (3) In the AP-S scenario, the farmland area in 2050 will increase by 5,870.17 km2 compared with 2020, with a growth rate of 2.85%, and the urban land area will increase by 2,125.81 km2, with a growth rate of 6.87%. The other four land types will show a decreasing trend. (4) In the EP-S scenario, the urban land area in 2050 will increase by 13,233.47 km2 compared with 2020, with a growth rate of 42.79%; the water body area will increase by 308.29 km2, with a growth rate of 2.05%; and the grassland area will increase by 61.40 km2, with a growth rate of 0.02%. The other three land types will show a decreasing trend. (5) In the CEPAP-S scenario, the farmland area in 2050 will increase by 1,524.15 km2 compared with 2020, with a growth rate of 0.74%, and the grassland area will increase by 7,810.77 km2, with a growth rate of 2.02%. The other four land types will show a decreasing trend.
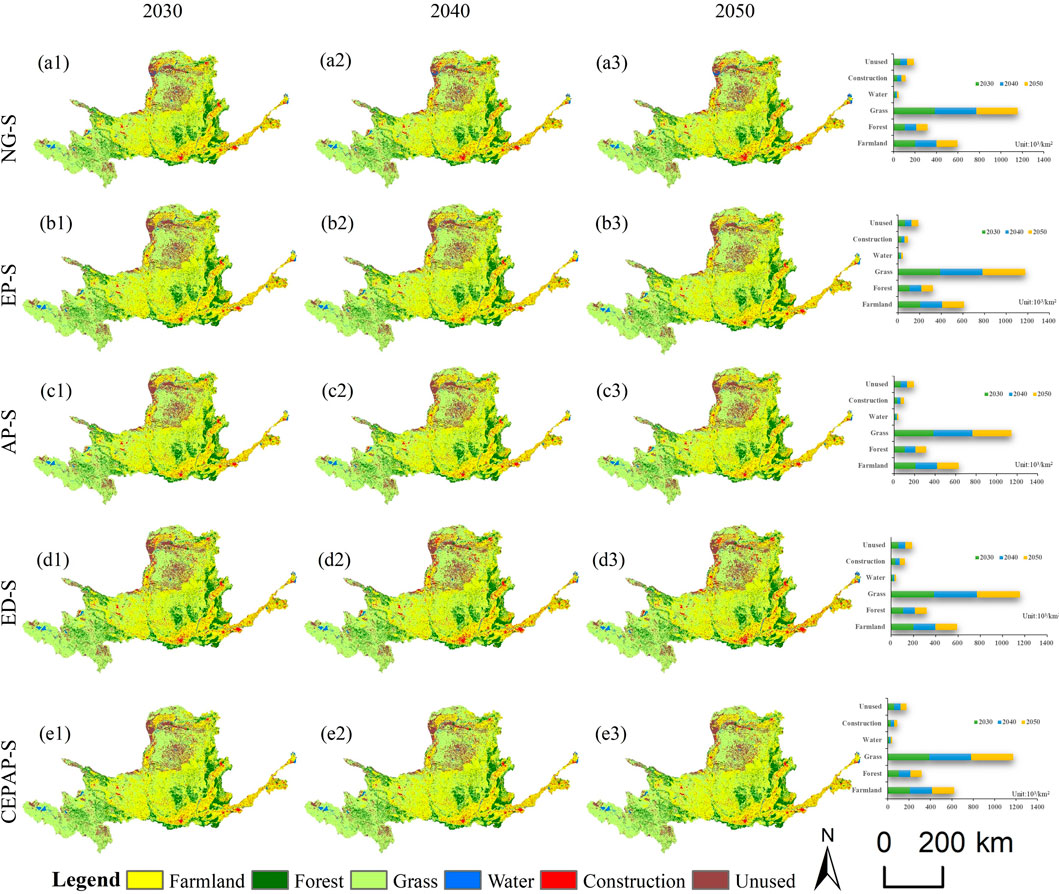
Figure 3. 2030-2050 Land Use Distribution Map of the Yellow River Basin under Different. Rows (Scenarios): (a1, a2, a3) Natural Growth Scenario (NG-S); (b1, b2, b3) Eco-Priority Scenario (EP-S); (c1, c2, c3) Arable Land Protection Scenario (AP-S); (d1, d2, d3) Economic Development Scenario (ED-S); (e1, e2, e3) Coordinated Ecological and Arable Protection Scenario (CERAP-S). Columns (Years): Left to right: 2030, 2040, 2050. Land Use Types: Yellow: Farmland; Light green: Grassland; Red: Built-up land; Green: Forest; Blue: Water bodies; Brown: Unused land.
3.3 Temporal and spatial characteristics of habitat quality
Based on previous studies and the specific conditions of the Yellow River Basin, we applied the natural break method to divide habitat quality into five levels: low (0.0–0.2), relatively low (0.2–0.4), medium (0.4–0.6), relatively high (0.6–0.8), and high (0.8–1.0). Higher habitat quality coefficients indicate better habitats and richer biodiversity (Figure 4).
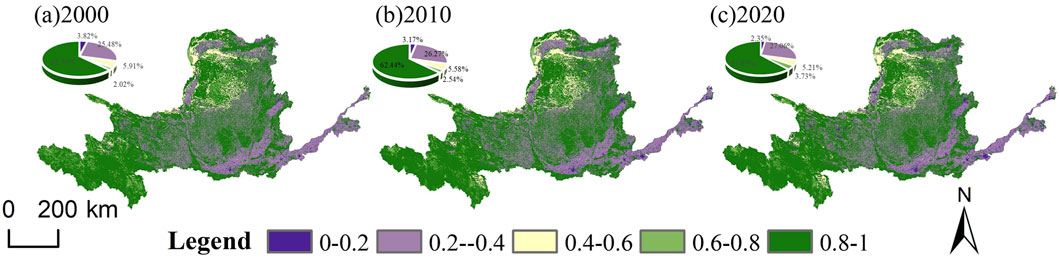
Figure 4. Spatial distribution of habitat quality in the Yellow River basin from 2000 to 2020. Purple: poor-value area (0.0–0.2); light purple: low-value area (0.2–0.4); light yellow: intermediate-value area (0.4–0.6); light green: moderate-value area (0.6–0.8); dark green: high-value area (0.8–1). (a) 2000. (b) 2010. (c) 2020.
The habitat quality indices of the Yellow River Basin for 2000, 2010, and 2020 were 0.7471, 0.7476, and 0.7471, respectively, with the average of these 20 years being 0.7473. During this time, overall habitat quality remained relatively stable and at a good level. In terms of changes in the area and proportion of different habitat quality grades, the low-, medium-, and high-value regions experienced continuous growth, with area increases of 11,933.93 km2, 5,711.85 km2, and 8,905.22 km2, corresponding to proportion increases of 1.48%, 0.70%, and 1.11%, respectively. In contrast, the lower- and higher-value areas showed consistent declines, with area decreases of 12,779.43 km2 and 13,805.14 km2, and proportion decreases of 1.58% and 1.71%, respectively. Overall, the changes in habitat quality grades in the Yellow River Basin from 2000 to 2020 did not follow a simple pattern of increase or decrease but a complex pattern involving both positive and negative changes.
From the perspective of spatial distribution, between 2000 and 2020, the overall habitat quality in the Yellow River Basin was primarily dominated by high- and low-value areas, with a small proportion of low-, medium-, and high-value areas. Low-value areas were mainly distributed in the Hetao Plain and the plains of the lower Yellow River, accounting for 2.35%–3.83% of the total basin area. These areas were largely composed of construction land and subjected to significant human disturbance. Relatively low-value areas, comprising 25.48%–27.06% of the basin, were primarily located in the Loess Plateau and lower plain regions, dominated by agricultural land and also affected by substantial human activity. Medium-value areas were concentrated in the Maowusu Sandy Land and the Kubuqi Desert, representing 5.21%–5.91% of the total area. These areas were mostly covered by unused land and experienced relatively low levels of human interference.
Relatively high-value areas were mainly located in the upper reaches of the Yellow River, accounting for 2.02%–3.73% of the total area. Grasslands formed the principal land-cover type in these zones, which exhibit minimal human disturbance. The high-value areas were concentrated in the upper and middle reaches of the Yellow River basin, comprising 61.65%–62.76% of the total area. Forests and grasslands dominated these regions and were characterized by low levels of human activity interference.
3.4 Habitat quality simulation
Based on the land use simulation results, the InVEST model was used to determine the spatial distribution of habitat quality and changes in area across different levels in the Yellow River Basin from 2030 to 2050 (Figure 5). Between 2030 and 2050, the average habitat quality values in the Yellow River Basin under various scenarios are as follows: 0.7461, 0.7446, and 0.7387 for the NG-S scenario; 0.7499, 0.7523, and 0.7539 for the EP-S scenario; 0.7433, 0.7412, and 0.7388 for the AP-S scenario; 0.7444, 0.7425, and 0.7414 for the ED-S scenario; and 0.7486, 0.7493, and 0.7501 for the CEPAP-S scenario, which combines ecological protection and farmland protection. Among these five scenarios, the average habitat quality ranks as follows: EP-S > CEPAP-S > NG-S > ED-S > AP-S.
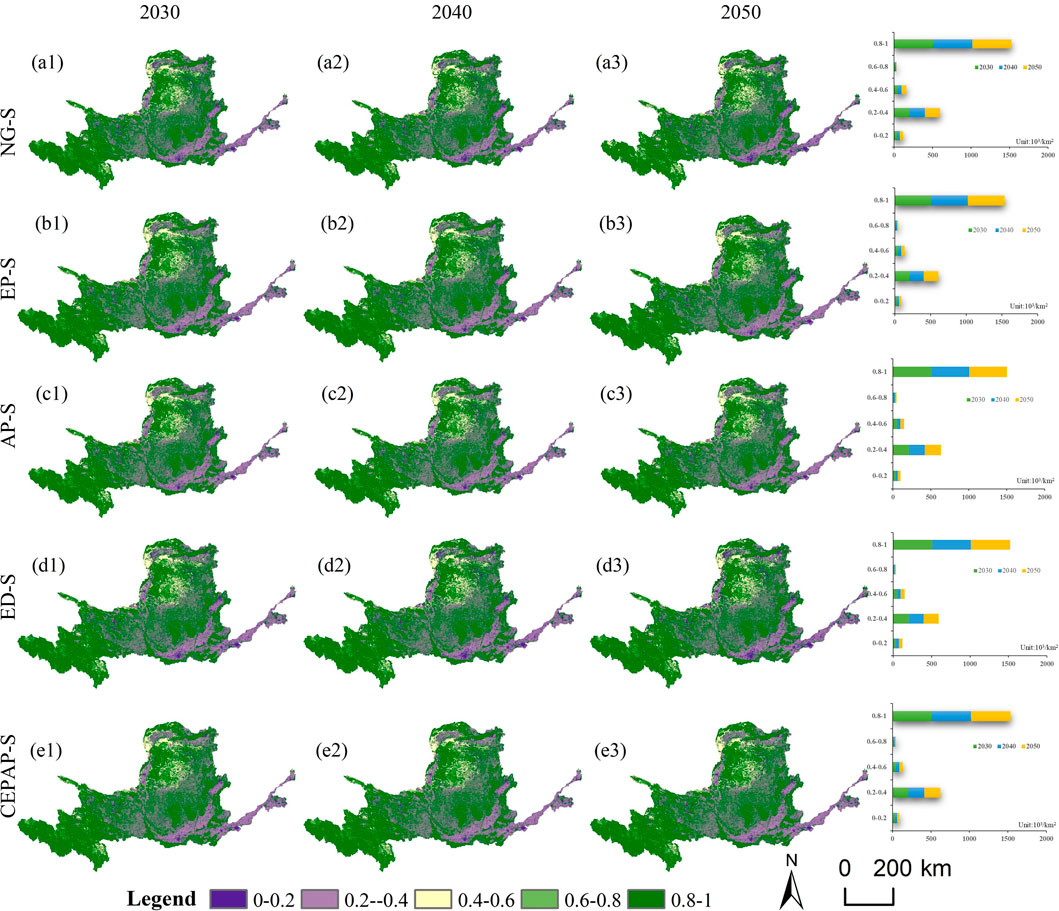
Figure 5. 2030-2050 Yellow River Basin Habitat Quality Distribution Map. Rows (Scenarios): (a1, a2, a3) Natural Growth Scenario (NG-S); (b1, b2, b3) Eco-Priority Scenario (EP-S); (c1, c2, c3) Arable Land Protection Scenario (AP-S); (d1, d2, d3) Economic Development Scenario (ED-S); (e1, e2, e3) Coordinated Ecological and Arable Protection Scenario (CERAP-S). Columns (Years): Left to right: 2030, 2040, 2050. Habitat Quality Classes: purple: poor-value area (0.0–0.2); light purple: low-value area (0.2–0.4); light yellow: intermediate-value area (0.4–0.6); light green: moderate-value area (0.6–0.8); dark green: high-value area (0.8–1).
Compared with 2020, the average habitat quality in the Yellow River Basin from 2030 to 2050 varies depending on the scenario. Under the NG-S, AP-S, and ED-S scenarios, habitat quality declines by 1.12%, 1.11%, and 0.76%, respectively. In contrast, under the EP-S and CEPAP-S scenarios, habitat quality increases by 0.91% and 0.40%, respectively.
Under the NG-S scenario: From 2020 to 2050, the areas classified as low-value and medium-value zones exhibited continuous growth trends, with 30-year increases of 30.61% and 34.49%, respectively. Conversely, the areas of low-medium-value, medium-high-value, and high-value zones showed continuous declines, with 30-year reductions of 4.46%, 10.06%, and 3.13%, respectively. Under the EP-S scenario: The area of high-value zones demonstrated a continuous growth trend, increasing by 1.57% over 30 years. In contrast, the areas of low-value, low-medium-value, medium-value, and medium-high-value zones exhibited continuous declines, with 30-year reductions of 2.76%, 2.36%, 5.33%, and 2.88%, respectively. Under the AP-S scenario: The areas of low-value, low-medium-value, and medium-value zones displayed continuous growth trends, increasing by 6.87%, 2.85%, and 4.30% over 30 years, respectively. Conversely, the areas of medium-high-value and high-value zones showed continuous reductions, declining by 9.19% and 1.84% over the same period. Under the ED-S scenario: From 2020 to 2050, the areas of low-value and medium-value zones showed continuous growth trends, with 30-year increases of 42.79% and 4.35%, respectively. Conversely, the areas of low-medium-value, medium-high-value, and high-value zones exhibited continuous declines, with 30-year reductions of 5.72%, 25.72%, and 0.02%, respectively. Under the CEPAP-S scenario: The areas of low-medium-value and high-value zones demonstrated continuous growth trends, increasing by 0.74% and 1.05% over 30 years, respectively. Conversely, the areas of low-value, medium-value, and medium-high-value zones exhibited continuous declines, with 30-year reductions of 2.37%, 10.82%, and 10.62%, respectively.
4 Discussion
This research integrates the PLUS and InVEST models to analyze land use dynamics and changes in habitat quality from 2000 to 2020, while also projecting future trends from 2030 to 2050 under five distinct scenarios. This spatiotemporal analysis provides valuable insights to guide ecological conservation and sustainable development strategies within the Yellow River Basin. The findings reveal that land use changes are a critical driver of habitat quality, which in turn significantly impacts ecosystem stability and biodiversity. Between 2000 and 2020, the upper reaches of the Yellow River Basin were predominantly covered by forests and grasslands, whereas agricultural land was more common in downstream areas. Consequently, habitat quality exhibited a pronounced spatial gradient from west to east, with higher values in the western headwaters and lower values in the eastern plains, reflecting the uneven distribution of ecological land types.
The patterns of habitat quality change identified in this study for the Yellow River Basin closely align with findings from previous research (Yang et al., 2021). Over the past 2 decades, the basin has experienced a persistent decline in farmland alongside a substantial expansion of construction land, which has increased cumulatively by 11,933.49 km2. This dynamic has created an unsustainable feedback loop, directly constraining ecological space and resulting in a polarized distribution of habitat quality. In downstream regions characterized by intense anthropogenic disturbance, habitat fragmentation has intensified due to the proliferation of construction activities, leading to a 1.48% increase in low-quality habitat areas. Conversely, high-quality ecological core zones in the upper and middle reaches have shown a modest but stable growth of 1.11%. However, critical transitional areas, such as desertified farmland, continue to experience degradation.
Multi-scenario simulations highlight the complexities inherent in policy regulation. For example, while the ecological protection scenario facilitates a 1.57% increase in high-quality habitat, it does not prevent a 42.79% rise in low-quality areas under the economic development scenario. Additionally, the farmland protection scenario is associated with a 6.87% increase in construction land, exacerbating competition for resources between agricultural and ecological spaces and underscoring the limitations of implementing isolated policy measures.
The observed spatial differentiation results from the cascading effects of land use changes. The rigid expansion of construction land directly disrupts continuous vegetation cover, fragmenting biological migration corridors in downstream regions. In addition, the scattered conversion of farmland to forest and grassland occurs without establishing a systematic ecological network, leading to delayed restoration in sandy transitional zones such as the Mu Us Desert, where the median habitat area proportion remains low, ranging from 5.21% to 5.91%. Furthermore, the ecological benefits of converting unused land to grassland are limited by vegetation homogeneity.
To address these challenges, future management strategies should adopt spatially differentiated approaches: strictly prohibiting development activities in the upstream Qinling Mountains and the core ecological zones of the Heyuan grasslands; implementing a composite restoration model incorporating herbaceous plants, shrubs, and trees in the midstream Mu Us and Kubuqi sandy areas; and rigorously limiting the expansion of construction land downstream while enhancing ecological connectivity through three-dimensional greening techniques. Concurrently, establishing a cross-provincial ecological compensation system is imperative to harmonize farmland protection with ecological restoration objectives, thereby mitigating policy fragmentation and preventing implementation failures, as demonstrated by the coordinated development scenario where the farmland growth rate is limited to 0.74%.
This study has several limitations. Parameters within the InVEST model, such as threat factor weights and maximum impact distances, are assigned based on expert judgment. This approach inadequately captures the nuanced threat effects associated with subdivided categories of construction land, potentially resulting in an assessment bias of up to 15% (Chen et al., 2023; Li et al., 2024b). Furthermore, land use projections are anchored to the 2020 baseline and do not account for recent policy interventions, such as the 2021 Yellow River Basin Ecological Protection Outline. This omission raises concerns about the validity of the farmland protection scenarios (AP-S/CEPAP-S), given that farmland area shows only a marginal increase of 0.74%.
Future research will incorporate machine learning techniques to more precisely quantify threat gradients across subdivided construction land types and to establish an empirically derived weight allocation framework. Additionally, relevant policies, including the farmland constraints stipulated in the 2021″Yellow River Basin Ecological Protection Outline,” will be integrated by translating them into land-use transition probability matrices within the AP-S scenario. To further refine farmland protection strategies, iterative Monte Carlo simulations will be employed to optimize pathway selection.
5 Conclusion
This study analyzed the spatial and temporal characteristics of land use change and habitat quality in the Yellow River Basin from 2000 to 2020. Based on the PLUS model, land use and habitat quality patterns were simulated under multiple scenarios for the years 2030, 2040, and 2050. The main conclusions are as follows:
1. From 2000 to 2020, land use in the Yellow River Basin exhibited a conflicting pattern of continuous loss of arable land and rapid expansion of construction land. The basin is dominated by grassland, farmland, and forests. Spatially, farmland is concentrated in the Hetao Plain and downstream plains, forest land is distributed in mountainous areas such as the Qinling Mountains, and unused land is mainly found in the Mu Us and Kubuqi sandy regions. Land use changes under different scenarios were as follows: Natural Growth (NG-S) scenario: construction land expanded by 30.61%, water bodies increased by 9.54%, while other land types declined; - Ecological Protection (EP-S) scenario: grassland increased somewhat, and ecological space slightly improved; - Arable Land Protection (AP-S) scenario: farmland and construction land increased by 2.85% and 6.87%, respectively, but ecological land types continued to decrease; - Coordinated Development (CEPAP-S) scenario: slight increases in farmland and grassland, indicating that single-policy approaches struggle to balance ecological and agricultural needs.
2. Habitat quality in the Yellow River Basin remained generally stable from 2000 to 2020, but internal “polarization” has emerged: both low- and high-value areas expanded simultaneously, while the mid-to-low transitional zones continued to shrink. Spatially, low-value areas are concentrated in downstream urban belts, whereas high-value areas dominate forest and grassland regions in the upper and middle reaches. Future simulations show that ecological protection (EP-S) and coordinated development (CEPAP-S) are the only improvement paths, while the remaining scenarios lead to degradation. Although ecological protection can promote the growth of high-value areas, it cannot reverse the expansion of low-value areas.
Data availability statement
The original contributions presented in the study are included in the article/supplementary material, further inquiries can be directed to the corresponding author.
Author contributions
YH: Methodology, Conceptualization, Writing – review and editing, Writing – original draft. JW: Formal Analysis, Software, Writing – review and editing. YG: Writing – review and editing, Data curation.
Funding
The author(s) declare that financial support was received for the research and/or publication of this article. This research was funded by the Special Project “Double First-Class” in Surveying Science and Technology at Henan Polytechnic University: Research on the trade-offs and optimization of ecosystem services in typical river basins of the Yellow River Midstream, grant number GCCRC202303.
Conflict of interest
The authors declare that the research was conducted in the absence of any commercial or financial relationships that could be construed as a potential conflict of interest.
Generative AI statement
The author(s) declare that no Generative AI was used in the creation of this manuscript.
Any alternative text (alt text) provided alongside figures in this article has been generated by Frontiers with the support of artificial intelligence and reasonable efforts have been made to ensure accuracy, including review by the authors wherever possible. If you identify any issues, please contact us.
Publisher’s note
All claims expressed in this article are solely those of the authors and do not necessarily represent those of their affiliated organizations, or those of the publisher, the editors and the reviewers. Any product that may be evaluated in this article, or claim that may be made by its manufacturer, is not guaranteed or endorsed by the publisher.
References
Allan, E., Bossdorf, O., Dormann, C. F., Prati, D., Gossner, M. M., Tscharntke, T., et al. (2014). Interannual variation in land-use intensity enhances grassland multidiversity. Proc. Natl. Acad. Sci. U. S. A. 111, 308–313. doi:10.1073/pnas.1312213111
Chaplin-Kramer, R., Sharp, R. P., Weil, C., Bennett, E. M., Pascual, U., Arkema, K. K., et al. (2019). Global modeling of nature’s contributions to people. Science 366, 255–258. doi:10.1126/science.aaw3372
Chen, S., Huang, Y., and Jin, Y. (2023). Spatiotemporal change of habitat before and after the implementation of grain for Green project in the middle reaches of the yellow River. Arid Zone Res. 40, 456–468. doi:10.13866/j.azr.2023.03.12
Ding, Q., Chen, Y., Bu, L., and Ye, Y. (2021). Multi-Scenario Analysis of Habitat Quality in the Yellow RiverDelta by Coupling FLUS with InVEST Model. Int. J. Environ. Res. Public Health. 18, 2389. doi:10.3390/ijerph18052389
Du, F., Chen, S., and Pu, J. (2023). Spatio-temporal evaluation of land use change and habitat quality in southeastern Fujian from 2000 to 2020. Res. Soil Water Conservation 30, 345–356. doi:10.13869/j.cnki.rswc.2023.06.032
Haddad, N. M., Brudvig, L. A., Clobert, J., Davies, K. F., Gonzalez, A., Holt, R. D., et al. (2015). Habitat fragmentation and its lasting impact on earth's ecosystems. Sci. Adv. 1, e1500052. doi:10.1126/sciadv.1500052
Hillard, E. M., Nielsen, C. K., and Groninger, J. W. (2017). Swamp rabbits as indicators of wildlife habitat quality in bottomland hardwood forest ecosystems. Ecol. Indic. 79, 47–53. doi:10.1016/j.ecolind.2017.03.024
Hu, F., Zhang, Y., Guo, Y., Zhang, P., Lyu, S., and Zhang, C. (2022). Spatial and temporal changes in land use and habitat quality in the weihe River basin based on the PLUS and InVEST models and predictions. Arid. Land Geogr. 45, 1125–1136. doi:10.12118/j.issn.1000-6060.2021.510
Jana, A., Jat, M. K., Saxena, A., and Choudhary, M. (2022). Prediction of land use land cover changes of a river basin using the CA—Markov model. Geocarto Int. 37, 14127–14147. doi:10.1080/10106049.2022.2086634
Jia, H., Zhang, J., Liu, L., Liu, J., and Yang, S. (2025). Variation and multi-scenario simulation of habitat quality in the gonghe Basin, China. J. Desert Res. 45, 29. doi:10.7522/j.issn.1000-694X.2024.00138
Kucsicsa, G., Popovici, E. A., Balteanu, D., Grigorescu, I., Dumitraşcu, M., and Mitrică, B. (2019). Future land use/cover changes in Romania: regional simulations based on CLUE-S model and CORINE land cover database. Landsc. Ecol. Eng. 15, 75–90. doi:10.1007/s11355-018-0362-1
Li, C., Wu, Y., Gai, B., Zheng, K., Wu, Y., and Li, C. (2021). Multi-scenario simulation of ecosystem service value for optimization of land use in the sichuan-Yunnan ecological barrier, China. Ecol. Indic. 132, 108328. doi:10.1016/j.ecolind.2021.108328
Li, X., Chen, D., Zhang, B., and Cao, J. R. (2024a). Spatio-temporal evolution and trade-off/synergy analysis of ecosystem services in regions of rapid urbanization: a case study of the lower Yellow river region. Environ. Sci. 45, 5372–5384. doi:10.13227/j.hjkx.202309242
Li, X., Zhang, Y., Gao, Y., Li, Y., Zhang, X., Dong, J., et al. (2024b). Habitat quality assessment in the yellow river mainstream. J. Henan Normal Univ. Nat. Sci. 52, 8–15. doi:10.16366/j.cnki.1000-2367.2022.10.21.0004
Liang, X., Guan, Q., Clarke, K. C., Liu, S., Wang, B., and Yao, Y. (2021). Understanding the drivers of sustainable land expansion using a patch—generating land use simulation (PLUS) model: a case study in wuhan, China. Comput. Environ. Urban Syst. 85, 101569. doi:10.1016/j.compenvurbsys.2020.101569
Limin, D., Shanlin, L., Bernard, L. J., Wu, J., Yu, D., Zhou, W., et al. (2019). The influence of land use change on the spatial-temporal variability of habitat quality between 1990 and 2010 in Northeast China. J. For. Res. 30, 2227–2236. doi:10.1007/s11676-018-0771-x
Liu, X., Xun, L., Xia, L., Xu, X., Ou, J., Chen, Y., et al. (2017). A future land use simulation model (FLUS) for simulating multiple land use scenarios by coupling human and natural effects. Landsc. & Urban Plan. 168, 94–116. doi:10.1016/j.landurbplan.2017.09.019
Liu, R., Zhao, Y., Chi, W., Liu, Z., and Chen, G. (2024). Assessment of habitat quality in the yellow river basin in Inner Mongolia from 1990 to 2020. Geocarto Int. 41, 674–683. doi:10.13866/j.azr.2024.04.13
Newbold, T., Oppenheimer, P., Etard, A., and Williams, J. J. (2020). Tropical and mediterranean biodiversity is disproportionately sensitive to land-use and climate change. Nat. Ecol. & Evol. 4, 1630–1638. doi:10.1038/s41559-020-01303-0
Ouyang, Z, Song, C, Zheng, H, et al. (2020) Using gross ecosystem product (GEP) to value nature in decision making. Proceedings of the National Academy of Sciences 117: 14593–14601.
Sharp, R., Tallis, H. T., Ricketts, T., Guerry, A. D., Wood, S. A., et al. (2018). “InVEST 3.2.0 user's guide. The natural capital project, Stanford university, University of Minnesota, the nature conservancy,” in World wildlife fund.
Shi, M., Wu, H., Fan, X., Jia, H., Dong, T., He, P., et al. (2021). Trade-offs and synergies of multiple ecosystem services for different land use scenarios in the yili river valley, China. Sustainability 13, 1577. doi:10.3390/su13031577
Tallis, H., Ricketts, T., and Guerry, A. (2013). InVEST user's guide: integrated valuation of environmental services and tradeoffs. Stanford. Stanford, CA: The Natural Capital Project.
Wang, Q., and Wang, H. (2023). Evaluation for the spatiotemporal patterns of ecological vulnerability and habitat quality: implications for supporting habitat conservation and healthy sustainable development. Environ. Geochem. Heath 45, 2117–2147. doi:10.1007/s10653-022-01328-3
Wood, S. L., Jones, S. K., Johnson, J. A., Brauman, K. A., Chaplin-Kramer, R., Fremier, A., et al. (2018). Distilling the role of ecosystem services in the sustainable Development goals. Ecosyst. Serv. 29, 70–82. doi:10.1016/j.ecoser.2017.10.010
Xu, Y., and Wang, C. S. (2020). Ecological protection and high-quality development in the yellow River basin: framework, path, and countermeasure. Bull. Chin. Acad. Sci. 35, 9. doi:10.16418/j.issn.1000-3045.20200425002
Yang, J., Xie, B. P., and Zhang, D. G. (2021). Spatial-temporal evolution of habitat quality and its influencing factors in the yellow river Basin based on InVEST model and GeoDetector. J. Desert Res. 41, 12–22. doi:10.7522/j.issn.1000-694X.2021.00026
Zhang, S., Han, L., and Cao, (2024). Habitat quality assessment of the weihe Basin based on the InVEST model. J. Lanzhou Univ. Nat. Sci. 60, 159–166.
Zhao, J. J., Liu, Y., Zhu, Y. K., Qin, S., Wang, Y., and Miao, C. (2020). Spatiotemporal differentiation and influencing factors of the coupling and coordinated development of new urbanization and ecological environment in the yellow River basin. Resour. Sci. 42, 159–171. doi:10.18402/resci.2020.01.16
Keywords: habitat quality, plus model, InVEST model, land use type, yellow river basin
Citation: Hou Y, Wu J and Guo Y (2025) Spatial-temporal evolution and prediction of habitat quality in the Yellow River Basin. Front. Environ. Sci. 13:1650777. doi: 10.3389/fenvs.2025.1650777
Received: 20 June 2025; Accepted: 11 August 2025;
Published: 29 August 2025.
Edited by:
Liang Yuan, China Three Gorges University, ChinaReviewed by:
Svitlana Delehan, Uzhhorod National University, UkraineDonglin Li, Qujing Normal University, China
Copyright © 2025 Hou, Wu and Guo. This is an open-access article distributed under the terms of the Creative Commons Attribution License (CC BY). The use, distribution or reproduction in other forums is permitted, provided the original author(s) and the copyright owner(s) are credited and that the original publication in this journal is cited, in accordance with accepted academic practice. No use, distribution or reproduction is permitted which does not comply with these terms.
*Correspondence: Yanjun Hou, eWpob3UxMjIzQDE2My5jb20=