 Jing Xu
 Mengxin Zhu
- School of Business, Qingdao University of Technology, Qingdao, Shandong, China
The 2020 Climate Ambition Summit (CAS) was a multilateral process that brought together the international community to strengthen climate action. During the summit, the Chinese government pledged to reduce the CO2 emission levels per unit GDP seen in 2005 by more than 65% by 2030. Trade-off between carbon reduction and economic growth under 2030 carbon reduction target requires careful consideration. Using this target, we constructed a drag model of emission reduction constraints on economic growth on the basis of Romer’s classical hypothesis. Partial least-squares (PLS) regression was applied to this model to eliminate multicollinearity problems. The results show that the drag effect of carbon emissions (CEs) on economic growth is 0.0378. It indicates that if China were to fulfill 2030 emission reduction target pledged at the CAS, there would be an average annual GDP reduction of more than 3.78%, influenced by existing technology and structural parameters for the production function. We also present suggestions for promoting the green technological innovation and improving production efficiency.
1 Introduction
The economy in China is thriving because of reform and an open policy: the economic growth rate has exceeded 10% annually for nearly 10 years since joining the WTO in 2001, growth that is not commonly seen worldwide. Nowadays, China is not only the largest developing country, but also the second largest economy after the United States (World Bank database; https://data.worldbank.org/). Economic development has been rapid in the automotive, real estate, heavy chemical, and power sectors in China. This has accelerated industrialization, urbanization, and modernization, but at the cost of enormous energy expenditure and rapidly increasing carbon emissions (CEs). According to the World Bank database, CEs in China in 2005 surpassed those in the United States to top the global emissions ranking. In 2020, China accounted for approximately 17.23% of global GDP and 32.6% of global CEs. The atmospheric concentration of greenhouse gases, dominated by CEs, continues to rise and is regarded as the most important cause of global climate change. As the world’s greatest carbon emitter, China is under pressure to pledge to reduce its emissions during international climate negotiations. The pace at which China can reduce CEs has attracted much attention worldwide.
1.1 The summary of the CE reduction process in China
On the United Nations Climate Chang Conference (COP15) in Copenhagen in 2009, China reiterated its CE reduction (CER) targets, pledging to reduce CEs per unit GDP by 40%–45% by 2020 in comparison to 2005. March 2011 was the first time the CER target of a 17% reduction in CEs per unit GDP by 2015 in comparison to 2010 was set as a binding indicator in the 12th Five-Year Plan (2011–2015). The national CE intensity decreased by 45.8% in 2018 in comparison to 2005 according to the Green Book of Climate Change (2019) released by the Chinese Academy of Social Sciences and the China Meteorological Administration, confirming that China fulfilled the Copenhagen commitments ahead of schedule.
In December 2015, China announced a new target for its Nationally Determined Contributions (NDCs) at COP21 in Paris: the aim was to reach peak CEs by 2030, with efforts to achieve this goal as soon as possible. This would reduce the CE intensity by 60%–65% in 2030 in comparison to 2005. In March 2016, the 13th Five-Year Plan further proposed that the CE intensity in 2020 would decrease by 18% in comparison to 2015, with promotion of the creation of a unified national CE market. According to the Green Book of Climate Change (2021), the CE intensity in 2020 had decreased by 18.8% in comparison to 2015, exceeding the binding targets of the 13th Five-Year Plan.
In September 2020, at the 75th Session of the United Nations General Assembly (UNGA), China clearly proposed the goals of peaking CEs before 2030 and achieving carbon neutrality before 2060 (the “dual carbon” target). At the Climate Ambition Summit (CAS) in December 2020, China pledged to reduce CEs per unit GDP by more than 65% by 2030 in comparison to 2005. The above was also the latest target for its NDCs.
1.2 An overview of CEs in China
Figure 1 shows an upward trend for both CEs and GDP. CEs and GDP increased 12.6-fold and 61-fold by 2021 in comparison to 1971, respectively. Especially joining the WTO, China became the world’s factory and achieved great economic development. The extensive economic growth model led to huge CEs. CEs soared from 3553 million tons in 2001–9150 million tons in 2011, representing an annual growth rate of 9.99%. Controlling the increasing CEs and achieving green transformation has become urgent for China. With China’s commitments to CER in the Copenhagen and Paris agreements, CEs has exhibited fluctuating growth from 2012 to 2021, representing an annual growth rate of 2.17%.
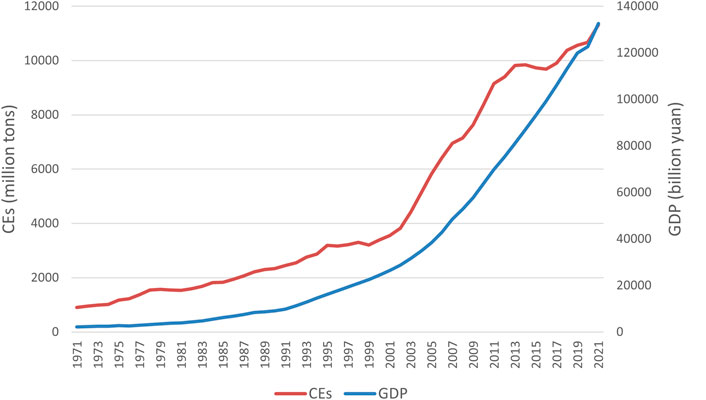
Figure 1. CEs and GDP in China between 1971 and 2021. Source: International energy agency (IEA) and China statistical yearbook (CSY).
Figure 2 shows the CEs per capita and GDP per capita in China and the world average. From a population perspective, the countries and regions with the highest per capita CEs levels are oil-producing countries, whose economies heavily rely on fossil fuel exports, as well as some developed countries. In 2021, the G7 countries, accounting for 9.36% of the world population, generated 22.53% of global CEs. The United States lead the way in per capita CEs, at 3.1 times the world average. In 2021, the per capita CEs level in China was 7.5 tons per person, which is lower than the 16.1 tons per person in the United States but higher than the 4.26 tons per person in the world average. Thus, China is not the largest CEs contributor from a per capita perspective. Although China was the second largest economy, all 98.99 million rural poor people were lifted out of poverty in 2020. The GDP per capita in China was 11223.3 US dollars, which just exceed the world average of 11100.3 US dollars in 2021. Hence, developing the economy and improving people’s livelihoods remain the top priority for China.

Figure 2. CEs per capita and GDP per capita in China and the world average. Source: IEA and the World Bank database.
Figure 3 shows the difference in CE intensity among the top four economies in the world in 2021. The CE intensities of the top three developed economies are lower than the world average. Leading green technologies, comprehensive green product standards, and domestic green development policies have significantly lowered CE intensities in these countries. By contrast, the CE intensity of China is higher than the world average. However, CE intensity in China is generally showing a downward trend. China actively implements energy-saving and CER policies for high-quality economic development. The increase in the proportion of renewable energy used has promoted a transition to green energy, and technological progress has improved energy efficiency. It is clear that the CE intensity in China is beginning to approach the world average, and decarbonization is accelerating.
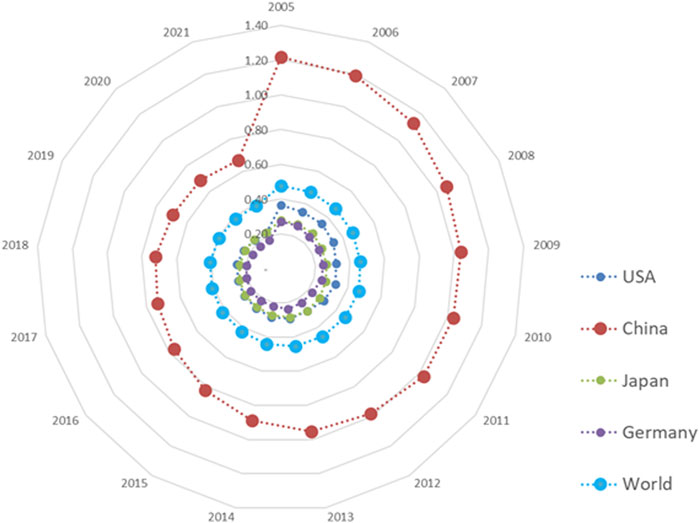
Figure 3. Carbon emission intensity of major countries and regions. (unit: kg/US dollar) Source: IEA.
China has made efforts to reduce CEs over a long period. It reflects the urgent need for national transformation to a green economy. However, China is the largest developing country and have a population of 1.412 billion. The GDP per capita remained lower than the world average until 2021. It is still an arduous task to develop the economy and improve people’s livelihoods. Environmental protection goal cannot be achieved at the cost of the economic development (Peng et al., 2020). In this context, the question arises as to what the potential growth drag caused by CEs under the China’s 2030 carbon reduction target at the CAS will be, and what the economic cost will be. These vital questions need to be explored and answered urgently at the juncture of economic transformation in China. In this research, we innovatively extend the classic Romer’s growth drag model by incorporating CER policies to enhance its practical application and explanatory power. Based on Chinese empirical data, we focus on measuring the drag effect of CEs on economic growth under 2030 CER target using a Johansen cointegration test, partial least squares (PLS) regression, and a drag equation (Figure 4). Considering that most countries have established carbon neutrality schedules, this article attempts to provide reference for how to achieve a win-win situation of the environment and the economy under CE constraints. Finally, study results can also serve as a reference for formulating CER policies and assessing economic effects.
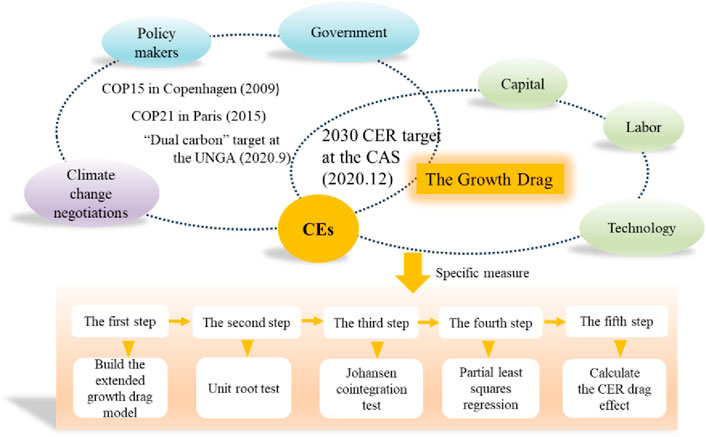
Figure 4. Research framework.
The structure of this study is organized as follows. Sect. 2 give literature review. Sect. 3 presents the growth drag model under 2030 CER target at the CAS. Sect. 4 details the study data. Sect. 5 is describing empirical results and relative analysis. Section 6 concludes and presents the suggestions.
2 Literature review
The relationship between CEs and economic growth has been widely reviewed and can be categorized into five types. (1) Economic expansion triggers environmental pollutants (Yasin et al., 2025; Sun and Zhang, 2024). Under the extensive economic development model, rapid expansion of industry, manufacturing, and transportation, which use a lot of fossil-fuel energy, will harm the environment. Models such as Kaya-LMDI (Nwani et al., 2023), STIRPAT (Sun and Zhang, 2024), ARDL (Rahman and Kashem, 2017; Ghorbal and Ben Youssef, 2024), the spatial econometric model (Shakiru et al., 2024), and the decoupling model (Tong and Sun, 2024), among many other methods, have been used to verify the influence of economic growth on CEs. (2) Many literatures focus on the unidirectional Granger causality from CEs to economic growth. In comparison to developed countries, most developing countries tend to have a late economic start, and there is an extensive development mode of “exchanging the environment for the economy” and “polluting first and then treatment”. Lee and Yoo (2016), Xuan (2025), and Avazdahandeh (2024), Georgescu et al. (2024) found that CEs will induce economic growth in the case of Korea, Brunei, China and South-East European Countries, respectively. (3) There is no causal link between the two variables (Salahuddin and Gow, 2014; Dissanayake, et al., 2023). (4) There is bidirectional causality between the two variables (Menon et al., 2023; Dissanayake, et al., 2023). (5) Many studies have focused on an inverted U-shaped relationship between CEs and economic growth, known as the Environmental Kuznets Curve (EKC) hypothesis (Ganda, 2025; Lau and Tsai, 2024). However, the results of the study are not consistent. Empirical result from Farooq et al. (2024) showed an inverted N-shaped relationship EKC in India.
The drag growth theory originated from the research on the relationship between the non-renewable resources and economic growth. Dasgupta and Heal (1974) found that a growing economy in the long run only exist if the non-renewable resources are inessential in production. Nordhaus (1992) used the extended Cobb-Douglas production function to investigate the drag effect of resources on the American economic growth. Uri (1995) relied on cointegration techniques and found the scarcity of crude oil has affected economic growth in the U.S. over 1889–1992. Huang and He (2023) indicated that resources may be a driver or a drag on economic growth, depending on the nation. Guan et al. (2024) indicated that energy structure and scale effect have slight negative effects on regional productivity. Based on 27 European Union, Okuneviciute Neverauskiene et al. (2025) found that the transition to renewable energy sources will have a smaller negative impact on economic growth when the country is more dependent on imported energy sources. Based on the endogenous economic growth model, Romer (2001) proposed the Drag Growth Model, generally refers to the difference between the natural resource unconstrained and natural resource constrained economic growth rate. Since then, many scholars estimated the growth drag caused by energy, water, and land. Zhao et al. (2019) compute the direct and indirect growth drag caused by land-energy in the Yangtze River Delta in China. Xu et al. (2018) investigated the coal drag effect is 0.0252 in China. Yu et al. (2023) reported China’s growth drags caused by energy-water. Xiao and Liu (2023) found that industrial pollution control can alleviate growth drag. Su et al. (2024) indicated that water and land resources have a drag effect on urban-rural economic growth.
In light of worsening environmental pollution and strict CER policies, essential production factors are no longer just capital and labor in the traditional sense. CEs are a negative product (known as a non-consensual output) (Shah et al., 2024). The cost of removing a negative product is not fundamentally different from the production costs of purchasing labor and machinery. Moreover, with the establishment and improvement of the CE market, production decisions taken by enterprises are not only affected by the cost of CE removal but are also constrained by whether they can purchase sufficient CE permits (Fan et al., 2023). Therefore, the significance of CEs is not fundamentally different from that of other production factors. However, few studies focus on the drag effect caused by CEs. Li et al. (2020) estimated the drag effect of CEs on China’s economic growth and urban economic growth. Zhou et al. (2022) explored the economic growth drag effect and its spatial differences in China under the constraints of resources and environment (i.e., industrial SO2 discharge).
To sum up, based on “Growth Drag” model, most existing studies focus on the growth drag caused by resources. The few studies focused on the drag effect of CEs that have been published did not explore the growth drag under established CER targets. One thing to note is that, the empirical study measuring the growth drag without considering resource or environmental policies may lead to biased results. Given the stringent binding nature of such policies, they would inevitably impose stricter pollution controls and reinforce the constrained pathways in the growth drag model. Although Yu et al. (2023) investigate energy-water drag effect under carbon mitigation, the study adopts a scenario simulation approach rather than examining the growth drag under existing policies. Studies on the CEs drag effect under established CER policy need to be supplemented and improved. From this perspective, our work fills this gap in already-existing research. It first extends the Romer’s growth drag model by incorporating the CER policy to enhance model’s practical applicability. The empirical results will more reasonable and accurately reflect reality. The extended model could also be applied to calculate the growth drag under the environmental and resource policies, such as energy, water, and land policies. To meet CER targets, governments need to not only follow a low-carbon development path but also consider the economic costs of CER. In this study, we quantify the economic burden under the existing CER target. Empirical results can provide more practical suggestions to balance CER and economic growth. Moreover, China is the greatest carbon emitter and second largest economy, so it is an interesting case to explore.
3 Methods
3.1 The growth drag model
In the classic Solow model, capital, labor, and technological progress factors affect output changes on the equilibrium growth path. The form of production function is assumed as shown in Equation 1:
where Y presents economic growth, K is capital stock, A is technological progress, and L denotes labor. AL is called effective labor and is introduced in a Harold-neutral form. It is assumed that the returns to scale remain constant and that the input factors other than capital, labor, and technological progress are relatively unimportant. As shown in Equation 2, a dot above a variable represents the derivative with respect to time. Labor and technology are given exogenous growth rates of n and g, respectively. However, the Solow model does not consider the pressure of environmental factors on output. Thus, CEs need to be added to the Solow model to allow realistic analyses. The expanded economic growth model, simplified using the Cobb-Douglas production function, is shown in Equation 3:
This study leads to the following Equations 4, 5:
where
Equation 6 can be converted to logarithmic form, in Equation 7:
The simplified form is, in Equation 8:
where
The per capita output growth rate on the balanced growth path is:
Equation 10 is the unit labor growth rate under CE constraints. To determine the drag on growth, the growth rate level on the equilibrium growth path without CE constraints must be obtained. Therefore, assuming that the economy is in an unconstrained state, the CE consumption rate is n, that is,
Similar methods are applied to estimate the per capita output growth rate without CE constraints, bringing Equation 12 into Equation 9, we can get Equation 13:
The growth drag due to CE constraints is represented by the difference between Equations 14, 10:
By analyzing Equation 15, the growth drag caused by CE is determined by the CE elasticity coefficient (
3.2 Johansen cointegration test
Two tests are typically used to determine cointegration between variables: the Engle-Granger (EG) test based on nonequilibrium, errors and the Johansen-Juselius cointegration test based on vector autoregressive models. In comparison to the EG test, the Johansen test does not require division of variables into endogenous and exogenous classes and can provide all cointegration relationships (Tang et al., 2016). Therefore, we adopted the Johansen cointegration test to detect the long run relationship between LNY, LNK, LNL, and LNCOE.
3.3 Partial least squares regression
PLS regression combines the characteristics of principal component analysis, canonical correlation analysis, and multiple linear regression analysis (Wold et al., 1983). This multivariate statistical analysis method reorganizes variables information instead of removing variables. The components are extracted with the strongest explanatory power for both the independent and dependent variables to eliminate noise interference. PLS method effectively solves the problems of multiple correlations and limited sample sizes. Regression conclusions obtained are more robust and accurate when PLS is used.
The main steps of PLS are as follows. (1) The components
According to the PLS regression, a
4 Data
4.1 Variables and data
We used data from 1971 to 2021 for our study (Table 1). The data of CEs could be derived from the World Bank database (Barkat et al., 2024), IEA database (Xu and Yao, 2023), or BP statistical yearbook (Song and Zhang, 2019). Many scholars (Li et al., 2020) calculated CEs form available energy consumption according to the IPCC guidelines. Due to the limit period (1990–2020) in the World Bank database, this study employs CEs (1971–2021) from International Energy Agency, 2025. Referring to Yu et al. (2023) and Xu et al. (2018), the economic growth is represented by GDP. To calculate the capital stock, this study utilizes the method of Zhang et al. (2007), that is
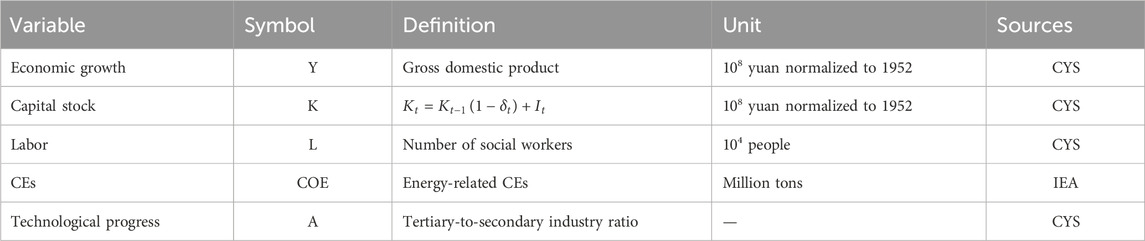
Table 1. Variable and data sources.
4.2 Data description
The variables involved in the PLS regression are economic growth, stock capita, labor and CEs. As shown in Table 2, the standard deviation of labor is small, whereas those of other variables are relatively large. This suggests that there are significant changes in economic growth, capital stock, and CEs in China over the 1971–2021 study period.
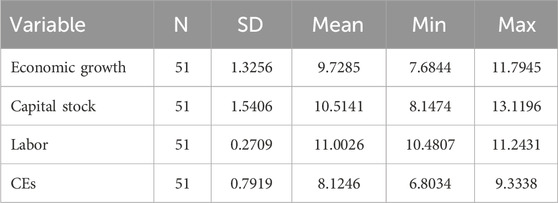
Table 2. Descriptive statistics.
5 Empirical results and analysis
5.1 Unit root test
As our sample size is only 51, we apply the Ng-Perron test to examine the stationarity of all the variables (Ng and Perron, 2001). The results are reported in Table 3. Therefore, as GDP (LNY), capital stock (LNK), labor (LNL), and carbon emissions (LNCOE) are stationary in I(1), we could continue to check whether there is a cointegration relationship among the variables.
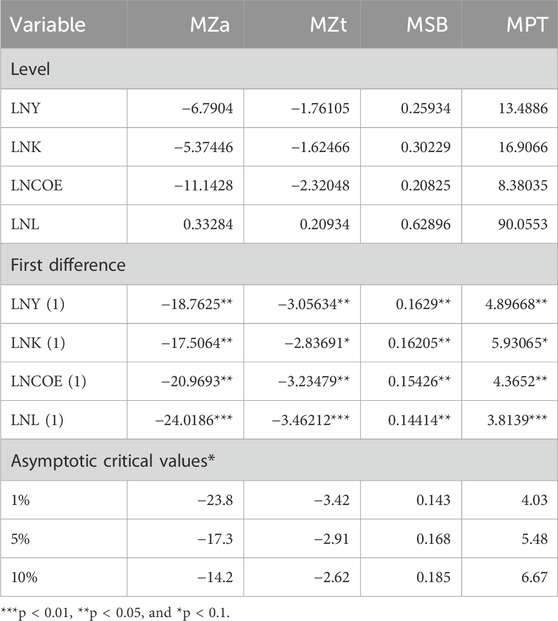
Table 3. Results for the Ng-Perron unit root test.
5.2 Johansen cointegration test
Johansen cointegration technique is applied to investigate the existence of a cointegration relationship between LNY, LNK, LNL, and LNCOE. As shown in Table 4, both the trace statistical test and the maximum eigenvalue test reject the original hypothesis at a significance level of 5%. This result indicates that at least one long-term relationship exists between the four variables. Hence, the PLS regression can be conducted.
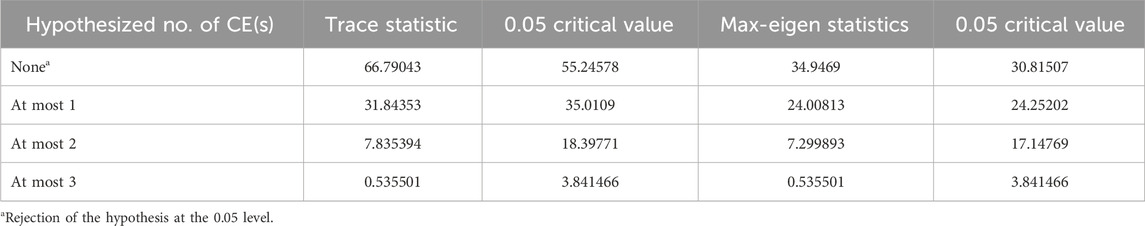
Table 4. Results for the Johansen cointegration test.
5.3 PLS regression
According to PLS theory, selection of all components for regression is not required. Thus, we chose the number of components via cross-validation Q2(cum), which is a measure of the marginal contribution of the extracted component to the precision of the model (Xu et al., 2018). As shown in Table 5, the cross-validity for selecting one component exceeded the threshold of 0.0975, indicating excellent regression. Hence, component
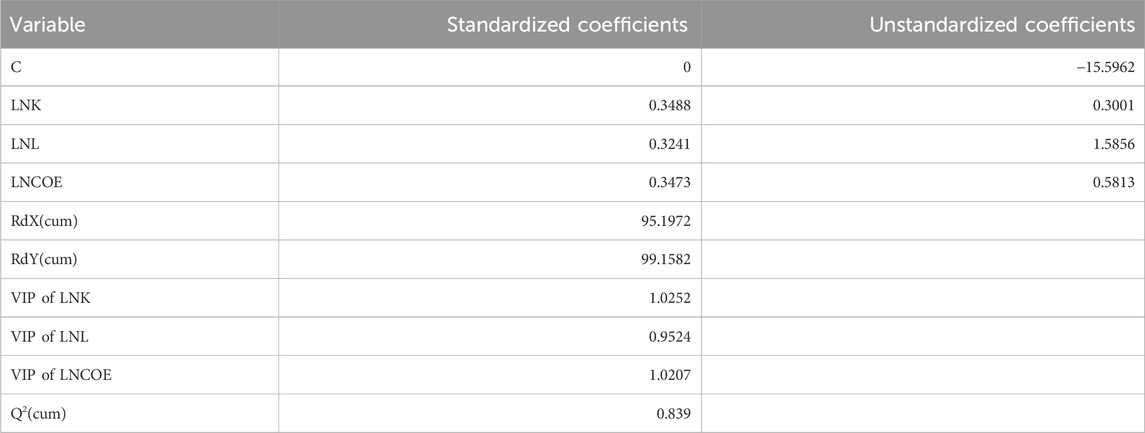
Table 5. Results for PLS regression.
Figure 5.
Based on the coefficients in Table 5, capital stock, CEs, and labor have a positive influence on economic growth. Specifically, every 1% increase in capital stock, CEs, and labor promoted economic growth by 34.88%, 34.73%, and 32.41% respectively. The coefficient of capital stock is high, indicating that economic growth mainly relies on the input of fixed capital. Our result is consistent with that of Yu et al. (2023) and Su et al. (2024). Notably, excessive reliance on capital may exacerbate resource consumption (Wang and Lin, 2020). Therefore, increasing capital efficiency is crucial to control resource consumption and CEs. The influence of CEs on economic growth is less than that of capital stock and greater than that of labor, indicating that economic growth in China is still at the expense of resources and environment. Li et al. (2020) reach similar conclusions in their study, reporting that the extensive economic growth mode in China, characterized by high-input, high-consumption, high-emission, high-pollution, and low-output should be fundamentally transformed to intensive growth mode. From a labor perspective, China is facing a severe aging population, and labor supply has entered a limited supply state from the past unlimited supply state. However, with the huge employment population base, labor resources is still an important driving force for economic development, according to Xu et al. (2018).
5.4 CER drag effect
In December 2020, China announced its new NDCs at the CAS. By 2030, China’s CEs per unit GDP will be reduced by more than 65% in comparison to 2005. This means that the CE intensity will be reduced by more than 65% in 25 years. Therefore, the average annual growth rate of carbon intensity (
According to the growth rate formula
Based on the drag effect model, four main factors should be paid more attention to reduce CEs. First, the CE drag effect is proportional to the CE elasticity coefficient
Second, the CE drag effect is proportional to the growth rate of carbon intensity (
Third, the drag effect of CEs on economic growth is proportional to the elastic factor for capital stock (
Fourth, the CE drag effect is inversely proportional to technological progress (g). Greater technological progress contributes positively to saving energy consumption and promoting economic productivity (Alfalih, 2025), which will thus reduce the drag effect of CEs. Renewable energy technologies are promoting the energy transition from fossil fuels to renewable energy use, with enhancing efficiency and reducing costs (Li et al., 2024; Kumar et al., 2025). The application of advanced technologies such as AI and machine learning enables precise control of production processes, optimized resource allocation, improved energy efficiency, and reduction of CEs at the source (Selvam et al., 2025; Abdessadak et al., 2025). Technologies like carbon capture, utilization, and storage (CCUS) have also made continuous breakthroughs, emerging as a critical pathway to reduce CEs (Zhu et al., 2025; Melhim and Isaifan, 2025). Wang et al. (2024) find that technological progress tends to favor the use of capital and energy, while saving the labor. Wang et al. (2023) indicate the global carbon efficiency improvement is mainly due to the change of technology progress. More attention should be paid to investment in energy-saving technology and developing key technologies for a low-carbon economy. Enhancement of technological progress can be vital in achieving green and sustainable development in China.
6 Conclusion
At the CAS in December 2020, China pledged to reduce CEs per unit GDP by more than 65% by 2030 in comparison to 2005. Using this CER target, we investigate the CE drag effect in China using Romer’s growth drag framework. The drag equation results show that if China fulfills the 2030 CER target at the CAS, the drag effect of reducing CEs on economic growth would exceed 3.78% if all other things were equal. This means that annual economic growth rate will decline by more than 3.78% in comparison to the previous year. China needs to strike a balance between economic growth and carbon reduction under 2030 CER target. In addition, under the “dual carbon” target, numerous existing studies have predicted the year during which China’s CEs will peak (Mi et al., 2017; Lin and Li, 2024; Huang et al., 2025). However, regardless of when CEs in China peak, the CE drag effect may still exist. The reason is that the drag effect of CEs on economic growth is also influenced by technological progress, capital elasticity, and the growth rate of carbon intensity. If the three factors remain high, the CE drag effect will not reduce.
According to the empirical result, the following suggestions are drawn. First, a “dual control” strategy for CEs could be promoted. On the one hand, it is necessary to control the total amount of CEs by reducing energy consumption, promoting energy transition, and increasing the proportion of clean energy forms such as wind, hydro, solar, biomass, and geothermal. On the other hand, the CE intensity should be controlled. CEs can be reduced via technological innovation and improvements in production processes. The urgent task is to optimize the extensive economic growth model, and improve resource utilization efficiency. Second, we should increase our reliance on high-quality and efficient capital investment. More attention should be focused on increasing capital efficiency rather than just increasing the amount of capital. We should incentivize enterprises to invest in high-efficiency equipment and phase out energy-intensive machinery to achieve energy conservation, that is, to promote capital-for-energy substitution. It is necessary to transform the industrial structure by adjusting the industrial core towards high-tech industries and eliminating the outdated production capacity. Third, we should focus on green and low-carbon technologies. For example, clean and efficient use of coal, exploration and development of oil and gas resources and coal-bed methane, and the development and utilization of carbon-free technologies, such as new and clean-energy technologies, could effectively promote low-carbon transformation and high-quality development.
This research has several limitations. First of all, this paper maintains the assumption of the Romer’s growth drag model, that is, the constant returns to scale. Future research could relax this assumption or introduce Constant Elasticity of Substitution (CES) production functions to improve the model’s evaluative performance. In addition, given that China’s current CER policies are based on intensity-cap rather than absolute-cap, this study extends the growth drag model under intensity-cap policy. With the pursuit of carbon neutrality, the implementation of carbon budget systems will emerge as a critical policy framework. Another issue in future studies is to calculate the CE drag effect under an absolute carbon cap policy. Finally, this study employs energy-related CE data due to the data limitation. As China is undergoing a significant energy transition, CEs from land use and household consumption should not be underestimated in the future. We should focus on precisely measuring CEs in future studies.
Data availability statement
Publicly available datasets were analyzed in this study. This data can be found here: Carbon emissions data were sourced from International Energy Agency (IEA) database, and all other data were taken from the China Statistical Yearbook (CSY). China statistical yearbook (2024). Beijing, China: National Bureau of Statistics. International Energy Agency (IEA). http://www.iea.org.
Author contributions
JX: Resources, Funding acquisition, Project administration, Software, Formal Analysis, Writing – review and editing, Methodology, Conceptualization, Validation, Data curation, Writing – original draft, Visualization, Supervision, Investigation. MZ: Formal Analysis, Data curation, Methodology, Writing – original draft, Software. XC: Writing – review and editing, Resources, Validation, Investigation, Supervision, Formal Analysis, Methodology.
Funding
The author(s) declare that financial support was received for the research and/or publication of this article. We gratefully acknowledge financial support from Natural Science Foundation of Shandong Province (ZR2023QG042), project leader: JX.
Acknowledgments
We thank International Science Editing for editing this manuscript.
Conflict of interest
The authors declare that the research was conducted in the absence of any commercial or financial relationships that could be construed as a potential conflict of interest.
Generative AI statement
The author(s) declare that no Generative AI was used in the creation of this manuscript.
Any alternative text (alt text) provided alongside figures in this article has been generated by Frontiers with the support of artificial intelligence and reasonable efforts have been made to ensure accuracy, including review by the authors wherever possible. If you identify any issues, please contact us.
Publisher’s note
All claims expressed in this article are solely those of the authors and do not necessarily represent those of their affiliated organizations, or those of the publisher, the editors and the reviewers. Any product that may be evaluated in this article, or claim that may be made by its manufacturer, is not guaranteed or endorsed by the publisher.
References
Abdessadak, A., Ghennioui, H., Thirion-Moreau, N., Elbhiri, B., Abraim, M., and Merzouk, S. (2025). Digital twin technology and artificial intelligence in energy transition: a comprehensive systematic review of applications. Energy Rep. 13, 5196–5218. doi:10.1016/j.egyr.2025.04.060
Alfalih, A. A. (2025). Assessing the impact of green technological innovation and human capabilities on renewable energy supply: evidence from the top-greenest countries. Sustain. Energy Technol. Assessments 73, 104152. doi:10.1016/j.seta.2024.104152
Avazdahandeh, S. (2024). A new look at the CO2 haven hypothesis using gravity model European Union and China. Sci. Rep. 14 (1), 18610. doi:10.1038/s41598-024-69611-0
Barkat, K., Alsamara, M., and Mimouni, K. (2024). Beyond economic growth goals: can foreign aid mitigate carbon dioxide emissions in developing countries? J. Clean. Prod. 471, 143411. doi:10.1016/j.jclepro.2024.143411
China Statistical Yearbook (2024). China statistical yearbook. Beijing, China: National Bureau of Statistics.
Dasgupta, P., and Heal, D. G. (1974). The optimal depletion of exhaustible resources. Rev. Econ. Stud. 41, 3–28. doi:10.2307/2296369
Dissanayake, H., Perera, N., Abeykoon, S., Samson, D., Jayathilaka, R., Jayasinghe, M., et al. (2023). Nexus between carbon emissions, energy consumption, and economic growth: evidence from global economies. Plos One 18 (6), e0287579. doi:10.1371/journal.pone.0287579
Fan, X. S., Chen, K. L., and Chen, Y. J. (2023). Is price commitment a better solution to control carbon emissions and promote technology investment? Manag. Sci. 69 (1), 325–341. doi:10.1287/mnsc.2022.4365
Farooq, U., Bhanja, N., Rather, S. R., and Dar, A. B. (2024). From pollution to prosperity: using inverted N-shaped environmental Kuznets curve to predict India’s environmental improvement milestones. J. Clean. Prod. 434, 140175. doi:10.1016/j.jclepro.2023.140175
Ganda, F. (2025). Testing the environmental Kuznets curve hypothesis in South Africa using the ARDL approach. Nat. Resour. Forum 49 (1), 67–99. doi:10.1111/1477-8947.12377
Georgescu, I. A., Oprea, S. V., and Bara, A. (2024). Investigating the relationship between macroeconomic indicators, renewables and pollution across diverse regions in the globalization era. Appl. Energy 363, 123077. doi:10.1016/j.apenergy.2024.123077
Ghorbal, S., and Ben Youssef, S. (2024). Scrutinizing the role of renewable energy and patents in pollution abatement and economic growth in South Korea. Energy& Environ. 35 (6), 3232–3252. doi:10.1177/0958305x231164685
Guan, H. J., Wang, H. X., Sun, Z. Z., and Zhao, A. W. (2024). Regional productivity in the transformation of China's energy structure -estimation of the restricted cost function. Appl. Econ. 56 (60), 9121–9139. doi:10.1080/00036846.2023.2298659
Hong, Y. X. X., Jiang, X. L., Xu, H., and Chang, Yu (2024). The impacts of China's dual carbon policy on green innovation: evidence from Chinese heavy-polluting enterprises. J. Environ. Manag. 350, 119620. doi:10.1016/j.jenvman.2023.119620
Hu, W. Q., Liu, Y. Q., Wu, C. H., and Tsai, S. B. (2020). An empirical study on government direct environmental regulation and heterogeneous innovation investment. J. Clean. Prod. 254, 120079. doi:10.1016/j.jclepro.2020.120079
Huang, W. T., and He, J. (2023). Impact of energy intensity, green economy, and natural resources development to achieve sustainable economic growth in Asian countries. Resour. Policy 84, 103726. doi:10.1016/j.resourpol.2023.103726
Huang, C., Fu, S. C., Chan, K. C., Wu, C. L., and Chao, C. Y. H. (2025). Evaluating China's 2030 carbon peak goal: post-COVID-19 systematic review. Renew. and Sustain. Energy Rev. 209, 115128. doi:10.1016/j.rser.2024.115128
IEA (2021). An energy sector Roadmap to carbon neutrality in China. Available online at: https://iea.blob.core.windows.net/assets/bcf51d31-b7c6-4183-944f-707d05021356/AnenergysectorroadmaptocarbonneutralityinChina.pdf.
International Energy Agency (IEA) (2025). International energy agency (IEA). Available online at: http://www.iea.org.
Kumar, L., Sharma, K., Pathak, P., and Khedlekar, U. K. (2025). Optimizing renewable energy integration using advanced mathematical modeling with storage and emission constraints for resilient and sustainable energy systems. Comput. and Industrial Eng. 208, 111379. doi:10.1016/j.cie.2025.111379
Lau, H. C., and Tsai, S. C. (2024). A longitudinal study on the history of energy transition and its implications on global decarbonization. Energy& Fuels 38 (14), 13115–13130. doi:10.1021/acs.energyfuels.4c01587
Lee, S. R., and Yoo, S. H. (2016). Energy consumption, CO2 emissions, and economic growth in Korea: a causality analysis. Energy Sources Part B-economics Plan. Policy 11 (5), 412–417. doi:10.1080/15567249.2011.635752
Li, J. J., Shi, J. G., Li, H., Duan, K. F., Zhang, R., and Xu, Q. W. (2020). Drag effect of carbon emissions on the urbanisation process: evidence from China’s Province panel data. Processes 8 (9), 1171. doi:10.3390/pr8091171
Li, Z., Du, B. L., Petersen, N., Liu, P., and Wirsum, M. (2024). Potential of hydrogen and thermal storage in the long-term transition of the power sector: a case study of China. Energy 307, 132512. doi:10.1016/j.energy.2024.132512
Lin, C. X., and Li, X. J. (2024). Carbon peak prediction and emission reduction pathways exploration for provincial residential buildings: evidence from Fujian Province. Sustain. Cities Soc. 102, 105239. doi:10.1016/j.scs.2024.105239
Melhim, S. H., and Isaifan, R. J. (2025). The energy-economy nexus of advanced air pollution control technologies: pathways to sustainable development. Energies 18 (9), 2378. doi:10.3390/en18092378
Meng, M., and Niu, D. (2011). Modeling CO2 emissions from fossil fuel combustion using the logistic equation. Energy 36, 3355–3359. doi:10.1016/j.energy.2011.03.032
Menon, B. G., Sahadev, S., Mahanty, A., Praveensal, C. J., and Asha, G. (2023). Trivariate causality between economic growth, energy consumption, and carbon emissions: empirical evidence from India. Energy Efficiency 2023 16 (5), 41. doi:10.1007/s12053-023-10118-4
Mi, Z. F., Wi, Y. M., Wang, B., Meng, J., Zhu, L., Shan, Y. L., et al. (2017). Socioeconomic impact assessment of China's CO2 emissions peak prior to 2030. J. Clean. Prod. 142, 2227–2236. doi:10.1016/j.jclepro.2016.11.055
National Development and Reform Commission (2024). Promote energy conservation and carbon reduction at a higher level and with greater quality. Available online at: https://www.ndrc.gov.cn/fzggw/wld/zcx/lddt/202405/t20240514_1386175.html.
Ng, S., and Perron, P. (2001). Lag length selection and the construction of unit root tests with good size and power. Econometrica 69, 1519–1554. doi:10.1111/1468-0262.00256
Nordhaus, W. D. (1992). Lethal model 2: the limits to growth revisited. Brookings Papers on Economic Activity 2, 1–59.
Nwani, C., Usman, O., Okere, K. I., and Bekun, F. V. (2023). Technological pathways to decarbonisation and the role of renewable energy: a study of European countries using consumption-based metrics. Resour. Policy 83, 103738. doi:10.1016/j.resourpol.2023.103738
Okuneviciute Neverauskiene, L., Dirma, V., Tvaronaviciene, M., and Danileviciene, I. (2025). Assessing the role of renewable energy in the sustainable economic growth of the European union. Energies 18 (4), 760. doi:10.3390/en18040760
Peng, B., Sheng, X., and Wei, G. (2020). Does environmental protection promote economic development? From the perspective of coupling coordination between environmental protection and economic development. Environ. Sci. Pollut. Res. 27, 39135–39148. doi:10.1007/s11356-020-09871-1
Rahman, M. M., and Kashem, M. A. (2017). Carbon emissions, energy consumption and industrial growth in Bangladesh: empirical evidence from ARDL cointegration and Granger causality analysis. Energy Policy 110, 600–608. doi:10.1016/j.enpol.2017.09.006
Ren, S. H., Jiao, X. M., Zheng, D. Z., Zhang, Y. N., Xie, H. P., and Zhang, R. (2025). Impact of carbon neutrality goals on China's coal industry: mechanisms and evidence. Energies 18 (7), 1672. doi:10.3390/en18071672
Romer, D. (2001). Advanced macroeconomics. 2nd ed. The Mc Graw-Hill Companies, Shanghai: Shanghai University of Finance and Economic Press.
Salahuddin, M., and Gow, J. (2014). Economic growth, energy consumption and CO2 emissions in Gulf Cooperation Council countries. Energy 73, 44–58. doi:10.1016/j.energy.2014.05.054
Selvam, D. C., Devarajan, Y., Raja, T., and Vickram, S. (2025). Advancements in water electrolysis technologies and enhanced storage solutions for green hydrogen using renewable energy sources. Appl. Energy 390, 125849. doi:10.1016/j.apenergy.2025.125849
Shah, W. U. H., Hao, G., Yan, H., Zhu, N., Yasmeen, R., and Dinca, G. (2024). Role of renewable, non-renewable energy consumption and carbon emission in energy efficiency and productivity change: evidence from G20 economies. Geosci. Front. 15 (4), 101631. doi:10.1016/j.gsf.2023.101631
Shakiru, T. H., Liu, X. H., Liu, Q., and Khan, M. A. (2024). Spatial-structural analysis of macroeconomic factors' impact on carbon emissions in East Africa: a spatial econometric panel study. Environ. Sci. Pollut. Res. Int. 31 (39), 51883–51901. doi:10.1007/s11356-024-34653-4
Shen, G. F., Ru, M. Y., Du, W., Zhu, X., Zhong, Q. R., Chen, Y. L., et al. (2019). Impacts of air pollutants from rural Chinese households under the rapid residential energy transition. Nat. Commun. 10, 3405. doi:10.1038/s41467-019-11453-w
Shi, B. B., Zhu, G. Y., and Li, N. (2024). Does economic growth targets setting lead to carbon emissions? An empirical study from China. J. Environ. Manag. 368, 122084. doi:10.1016/j.jenvman.2024.122084
Song, Y., and Zhang, M. (2019). Research on the gravity movement and mitigation potential of Asia’s carbon dioxide emissions. Energy 170, 31–39. doi:10.1016/j.energy.2018.12.110
Su, K. Q., He, D. W., Wang, R. X., Han, Z., and Deng, X. Z. (2024). Assessment of natural resource endowment and urban-rural integration for sustainable development in Xinjiang, China. J. Clear Prod. 450, 142046. doi:10.1016/j.jclepro.2024.142046
Sun, Y. M., and Zhang, G. Z. (2024). Analysis of the measurement of transportation carbon emissions and the emission reduction path in the Yangtze River economic belt under the background of “dual carbon” goals. Goals. Energies 17 (14), 3364. doi:10.3390/en17143364
Tang, C. F., Tan, B. W., and Ozturk, I. (2016). Energy consumption and economic growth in Vietnam. Renew. Sustain. Energy Rev. 54, 1506–1514. doi:10.1016/j.rser.2015.10.083
Tong, K. K., and Sun, S. Y. (2024). Multi-dimensional decoupling analysis in the context of energy use: dynamic well-being, resource, and impact decoupling relationships in China. Appl. Energy 359, 122726. doi:10.1016/j.apenergy.2024.122726
Uri, N. D. (1995). A reconsideration of effect of energy scarcity on economic growth. Energy 20 (1), 1–12. doi:10.1016/0360-5442(94)00053-6
Wang, X. L., Wei, Y. W., and Shao, Q. L. (2020). Decomposing the decoupling of CO2 emissions and economic growth in China’s iron and steel industry. Resour. Conservation Recycl. 152, 104509. doi:10.1016/j.resconrec.2019.104509
Wang, Q., Zhang, C., and Li, R. R. (2023). Does renewable energy consumption improve environmental efficiency in 121 countries? A matter of income inequality. Sci. Total Environ. 882, 163471. doi:10.1016/j.scitotenv.2023.163471
Wang, J. Y., Guan, H. J., and Zhao, A. W. (2024). Regional productivity in the energy structure transition of the Yellow River Basin in China - estimation based on a restricted cost function. Appl. Energy 375, 124178. doi:10.1016/j.apenergy.2024.124178
Wold, S. (1994). “PLS for multivariate linear modeling,” in Chemometric methods in molecular design (Weinheim, Germany: Verlag-Chemie), 1994, 195–218.
Wold, S., Albano, C., Dunn, W. J., Esbensen, K., Hellberg, S., and Johansson, E. (1983). “Pattern recognition: finding and using regularities in multivariate data,” in Food research and data analysis (London: Applied Science Publishers), 147–188.
Xiao, X. D., and Liu, Y. B. (2023). Is China's environmental governance model a win-win for energy conservation and economic development? Emerg. Mark. Finance Trade 59 (2), 324–337. doi:10.1080/1540496x.2022.2101360
Xie, Z. H., Wu, R., and Wang, S. J. (2021). How technological progress affects the carbon emission efficiency? Evidence from national panel quantile regression. J. Clean. Prod. 307, 127133. doi:10.1016/j.jclepro.2021.127133
Xu, Z. W., and Yao, L. M. (2023). Reality check and determinants of carbon emission flow in the context of global trade: Indonesia being the centric studied country. Environ. Dev. Sustain. 25 (10), 11973–11997. doi:10.1007/s10668-022-02562-6
Xu, J., Zhou, M., and Li, H. L. (2018). The drag effect of coal consumption on economic growth in China during 1953-2013. Resour. Conservation Recycl. 129, 326–332. doi:10.1016/j.resconrec.2016.08.027
Xuan, V. N. (2025). Determinants of carbon dioxide emissions in technology revolution 6.0: new insights from Brunei. Energy Strategy Rev. 57, 101633. doi:10.1016/j.esr.2024.101633
Yasin, I., Ahmad, N., Amin, S., Sattar, N., and Hashmat, A. (2025). Does agriculture, forests, and energy consumption foster the carbon emissions and ecological footprint? fresh evidence from BRICS economies. Environ. Dev. Sustain. 27 (6), 13235–13255. doi:10.1007/s10668-023-04456-7
Yu, X. X., Chen, Y. F., Jiang, M. D., Zhong, G. Y., Xu, H. C., Shen, X. M., et al. (2023). The drag effects of energy-water constraints on China’s economic growth under carbon mitigation goals. Front. Earth Sci. 10, 1059903. doi:10.3389/feart.2022.1059903
Zhang, J., Wu, G. Y., and Zhang, J. P. (2007). Estimating chinas provincial capital stock. Working paper series, China center for economic studies. Shanghai, China: Fudan University.
Zhao, C. J., Wu, Y. M., Ye, X. Y., Wu, B. J., and Kudva, S. (2019). The direct and indirect drag effects of land and energy on urban economic growth in the Yangtze River Delta, China. Environ. Dev. Sustain. 21, 2945–2962. doi:10.1007/s10668-018-0168-1
Zhou, Y. J., Li, D., Li, W. F., Mei, D., and Zhong, J. Y. (2022). Drag effect of economic growth and its spatial differences under the constraints of resources and environment: empirical findings from China’s yellow river basin. Environ. Res. Public Health 19 (5), 3027. doi:10.3390/ijerph19053027
Keywords: China’s 2030 carbon reduction target, drag, carbon emissions, economic growth, partial least squares
Citation: Xu J, Zhu M and Che X (2025) The drag effect of carbon emissions on China’s economic growth under 2030 carbon emission reduction target. Front. Environ. Sci. 13:1651189. doi: 10.3389/fenvs.2025.1651189
Received: 21 June 2025; Accepted: 20 August 2025;
Published: 04 September 2025.
Edited by:
Jaime Moll de Alba, United Nations Industrial Development Organization, AustriaCopyright © 2025 Xu, Zhu and Che. This is an open-access article distributed under the terms of the Creative Commons Attribution License (CC BY). The use, distribution or reproduction in other forums is permitted, provided the original author(s) and the copyright owner(s) are credited and that the original publication in this journal is cited, in accordance with accepted academic practice. No use, distribution or reproduction is permitted which does not comply with these terms.
*Correspondence: Jing Xu, eHVqaW5nQHF1dC5lZHUuY24=