 Yalamareddy Kiranmai1*
 M. P. Potdar1*
 D. P. Biradar1V. B. Kuligod2
 Aditya Kamalakar Kanade1
 Brajendra Parmar3Vaibhav Malunjkar4
- 1Department of Agronomy, University of Agricultural Sciences, Dharwad, Karnataka, India
- 2Department of Soil Science and Agricultural Chemistry, University of Agricultural Sciences, Dharwad, Karnataka, India
- 3Department of Soil Science and Agricultural Chemistry, ICAR- Indian Institute of Rice Research, Hyderabad, Telangana, India
- 4Centre of Excellence on Digital Technologies for Smart and Precision Agriculture, Mahatma Phule Krishi Vidyapeeth, Rahuri, Maharashtra, India
Introduction: Early detection of moisture stress in maize is vital for sustainable irrigation management, improved water-use efficiency, and stable yields under water-limited conditions. This study aimed to (i) evaluate the sensitivity of vegetation indices for detecting water stress, (ii) analyze their relationship with kernel yield, and (iii) assess their correlation with the Crop Water Stress Index (CWSI).
Methods: A field experiment was conducted during the 2021–22 rabi season at the University of Agricultural Sciences, Dharwad, under nine irrigation regimes in a randomized complete block design (RCBD). Multispectral imagery was acquired using a MicaSense RedEdge multispectral sensor mounted on an Unmanned Aerial Vehicle (UAV) to derive the Normalized Difference Vegetation Index (NDVI), Renormalized Difference Vegetation Index (RDVI), Soil-Adjusted Vegetation Index (SAVI), Optimized Soil-Adjusted Vegetation Index (OSAVI), and Transformed Chlorophyll Absorption in Reflectance Index (TCARI).
Results: Irrigation limited to the knee-high stage or omitted at tasseling and silking significantly reduced vegetation indices and kernel yield (ANOVA, p ≤ 0.05). NDVI, RDVI, SAVI, and OSAVI exhibited strong positive correlations with yield, confirming their effectiveness in capturing reductions in canopy vigour, chlorophyll activity, and photosynthetic capacity under stress. By contrast, TCARI increased with stress, reflecting its sensitivity to pigment degradation. The Crop Water Stress Index (CWSI), derived from canopy temperature, supported these spectral responses and highlighted the high vulnerability of reproductive stages to water deficit.
Discussion: UAV-based multispectral indices, when combined with ground-based CWSI, provide a robust framework for early stress detection and precision irrigation in maize. These results demonstrate the potential of remote sensing technologies to improve water-use efficiency and advance climate-smart agricultural practices in water-scarce regions.
1 Introduction
Maize (Zea mays L.), a member of the Poaceae family, is a vital cereal crop that ranks third in global production after wheat and rice (Food and Agriculture Organization of the United Nations, 2024). Its high yield potential has earned it the title “Queen of Cereals” (Erenstein et al., 2022). However, maize is highly susceptible to water stress, which remains a major constraint to productivity across diverse environments. Yield losses may exceed 80% when drought coincides with sensitive growth stages such as flowering and grain filling (Zipper et al., 2016).
Water stress arising from drought, water scarcity, or waterlogging—is one of the most critical abiotic constraints under increasing climate variability (Rani et al., 2022; Leng and Hall, 2019). Maize yield losses of 25%–50% have been reported during flowering and silking, and about 21% during grain filling, depending on environmental conditions (Széles, 2023). Omission of irrigation during tasseling or cob formation can be particularly devastating, with reductions ranging from 66 to over 90% (Jing et al., 2023). Climate change has further intensified the frequency and severity of drought episodes, posing a serious threat to the sustainability of maize-based production systems (Fahad et al., 2017; Lobell et al., 2014).
Drought stress disrupts several critical physiological processes, including chlorophyll fluorescence, silk emergence, and kernel set (Zhang et al., 2022). It also induces oxidative stress and hormonal imbalances that accelerate leaf senescence. These processes restrict photosynthesis and assimilate partitioning, ultimately compromising biomass accumulation and grain yield (Mugo et al., 2020; Farooq et al., 2017; Hussain et al., 2019). Increasingly erratic rainfall patterns and prolonged droughts across major maize-growing regions therefore represent a significant threat to food security in rainfed agroecosystems (Lesk et al., 2016; Hatfield and Dold, 2019).
Efforts to mitigate drought stress in maize span genetic, agronomic, and technological strategies. Breeding programs that combine conventional and molecular approaches have developed drought-resilient cultivars (Prasanna et al., 2021). Agronomic measures such as mulching, conservation tillage, and regulated deficit irrigation enhance water retention and improve efficiency under drought conditions (Kharrou et al., 2011; Meena et al., 2023). Technological innovations—including precision irrigation and remote sensing—enable real-time, site-specific water management (Zhang et al., 2022). Recent reviews further highlight the potential of UAV-based platforms for agricultural monitoring and stress detection (Zheng et al., 2024; Xiao et al., 2025). As climate change continues to disrupt precipitation regimes, integrated approaches that combine breeding, agronomy, and digital technologies are essential to strengthen maize resilience and sustain yields in water-limited regions (IPCC, 2021; Reynolds et al., 2020).
Early detection of drought stress before visible wilting is critical for optimizing irrigation scheduling and safeguarding yield (Zhao et al., 2005). Remote sensing has proven valuable for said purpose, with satellites offering broad coverage but limited by coarse resolution, low revisit frequency, and atmospheric interference. UAV’s overcome these constraints by providing flexible, high-resolution data at the farm scale and at lower operational costs, enabling timely decision-making (Yang et al., 2025; Sharma et al., 2025). Recent advances include improved canopy temperature extraction, CWSI calibration, and enhanced temporal representativeness of UAV-derived indices (Zhang et al., 2019). Reviews emphasize integrating UAV-based thermal and multispectral imaging to optimize irrigation and reduce drought-induced yield losses (Wang et al., 2024; Cheng et al., 2023). Multispectral sensors such as the Mica Sense Red Edge capture narrow band reflectance that can be transformed into vegetation indices for monitoring plant moisture and vigor (Yan et al., 2022).
Recent studies have extended UAV applications by combining multispectral and thermal data with machine learning. Kapari et al. (2024), Kapari et al. (2025) demonstrated that UAV-derived indices integrated with learning algorithms improve phenology-specific CWSI quantification and enable early stress detection. Liu et al. (2023) proposed methods for continuous, high-resolution CWSI retrieval, underscoring the precision and practicality of UAV remote sensing for site-specific irrigation management. Foundational work through 2023 established the value of UAV monitoring, while research in 2024–2025 advanced the field by integrating multispectral–thermal fusion with machine learning, improving early detection and irrigation guidance. These developments also highlight the need to evaluate complementary vegetation indices for pre-symptomatic monitoring.
Vegetation indices offer concise, practical tools for stress detection, each with advantages and limitations (Haboudane et al., 2002). NDVI (Normalized Difference Vegetation Index; Rouse et al., 1974) quantifies canopy greenness but saturates in dense canopies and is influenced by soil background. RDVI (Renormalized Difference Vegetation Index; Roujean and Bréon, 1995) enhances sensitivity to canopy density and biomass while reducing soil influence, though interpretation can be complex. SAVI (Soil-Adjusted Vegetation Index; Huete, 1988) corrects for soil brightness in sparse canopies but requires calibration of the soil factor, while OSAVI (Optimized SAVI; Rondeaux et al., 1996) simplifies this adjustment, though with reduced adaptability across soils. TCARI (Transformed Chlorophyll Absorption in Reflectance Index; Haboudane et al., 2004) improves chlorophyll estimation and reduces soil/atmospheric interference but requires reliable blue-band data and canopy calibration.
Thermal metrics complement spectral indices by directly assessing canopy water status. The CWSI, based on canopy-to-air temperature differences, detects stomatal closure and reduced transpiration before visual symptoms appear (Zhang et al., 2019; Zhou et al., 2021). Accurate calibration is essential: the lower baseline varies across growth stages, while the upper baseline tends to remain stable (Zhang et al., 2019). Integration of multispectral and thermal imaging, supported by advances in parameterization and inversion algorithms, has further improved the accuracy of drought detection and yield estimation (Liu et al., 2023; Song et al., 2024; Liang et al., 2024).
Despite these advances, research on early-stage spectral detection of maize water stress remains limited. Kapari et al. (2025) demonstrated the value of UAV-derived CWSI across multiple phenological stages, while Kapari et al. (2024) combined UAV multispectral data with machine learning to estimate CWSI in smallholder systems. These studies underscore the growing trend of integrating spectral indices with learning-based approaches. Identifying effective vegetation indices for pre-symptomatic stress detection using multispectral sensors such as the Mica Sense Red Edge therefore remains a priority.
The current research focused on assessing maize hybrid NK-6240 under nine irrigation regimes in the tropical wet and dry climate of Dharwad. Irrigation applied at critical growth stages was treated as the independent factor, while vegetation indices (NDVI, RDVI, SAVI, OSAVI, TCARI), CWSI, and kernel yield were considered as dependent variables. These indices were selected to capture complementary aspects of maize physiology, including canopy vigor, chlorophyll status, soil–canopy interactions, and thermal stress responses. While the present study focused on evaluating each vegetation index individually, emerging fusion approaches such as composite indices and machine learning integration offer considerable potential to further enhance stress detection and represent an important direction for future research. Specifically, this study aimed to (i) identify vegetation indices capable of detecting maize water stress prior to visible wilting, (ii) examine relationships between stress indices (spectral and thermal) and yield, and (iii) evaluate correlations among CWSI, vegetation indices, and yield.
2 Materials and methods
2.1 Experimental site and soil characteristics
The field experiment was conducted during the rabi season of 2021–22 at the Main Agricultural Research Station, University of Agricultural Sciences, Dharwad (15°29′N, 74°59′E; 678 m above mean sea level), located in the Northern Transitional Zone (Zone-8) of Karnataka, India. The soil at the experimental site was medium-deep black clay, slightly alkaline (pH 7.8), with an electrical conductivity of 0.32 dS m−1, low organic carbon (0.46%), low available nitrogen (278 kg N ha−1), medium available phosphorus (35 kg P2O5 ha−1), and high potassium (393 kg K2O ha−1). Textural analysis by the international pipette method (Piper, 1966) indicated 8.30% coarse sand, 14.58% fine sand, 20.80% silt, and 56.32% clay, classifying the soil as clay. Bulk density was 1.32 g cm−3 (Black, 1967). The soil had a field capacity of 30.52% at 0–15 cm and 31.68% at 15–30 cm depth (Dastane, 1972), and a permanent wilting point of 18.02% and 18.78% at the respective depths (Veihmeyer and Hendrickson, 1949).
2.2 Weather conditions during the experiment
During the crop-growing period, a total of 57.2 mm of rainfall was recorded across three events, all of which occurred after the dough stage (R4) and thus did not interfere with treatment imposition (Figure 1). All irrigation treatments were implemented as planned without deviations. Although the experiment was conducted in a single season (2021–22 rabi), the methodology remains robust and reproducible. The results are further interpreted in the context of recent UAV-based multispectral sensing and precision irrigation studies (Kapari et al., 2024; Kapari et al., 2025; Liu et al., 2023), ensuring their continued relevance to contemporary agricultural practices.
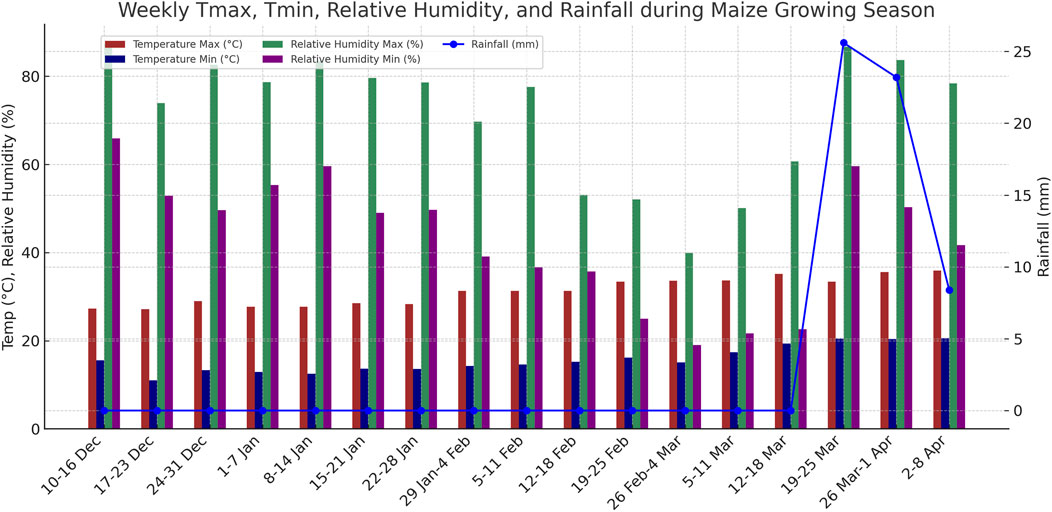
Figure 1. Weekly maximum and minimum temperature (°C), relative humidity (%), and rainfall (mm) recorded at the experimental site during the maize growing season.
2.3 Experimental design and crop management
The experiment was arranged in a randomized complete block design (RCBD) with nine irrigation treatments and three replications. The maize hybrid NK-6240 was selected as it is widely cultivated in the region and recommended for rabi maize production. It is also known for its high yield potential and adaptability to local agro-climatic conditions. Sowing was carried out at a spacing of 60 × 20 cm, corresponding to a plant population of approximately 83,333 plants ha−1, as per regional recommendations to ensure optimum growth and yield performance under irrigated conditions. Fertilizers were applied at 150:65:65 N:P2O5: K2O kg ha−1, with 50% of nitrogen and full dose of phosphorus and potassium applied as basal, and remaining 50% of nitrogen top-dressed at 35 days after sowing (DAS). UAV-based aerial imagery was also acquired to document the experimental layout and canopy development across irrigation treatments, as illustrated in Figure 2.
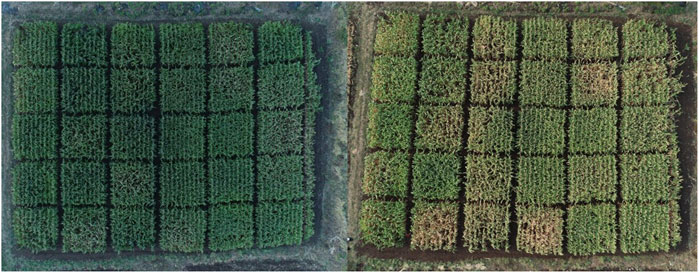
Figure 2. Aerial view of the experimental field captured with a UAV at the tasseling stage (left) and the dough stage (right).
2.4 Irrigation treatments and water management
Irrigation was scheduled according to the treatment plan: (T1) at all growth stages (VE, V4, V8, VT, R1, R3, R4), (T2) skipping irrigation at tasseling (VT), (T3) skipping irrigation at silking (R1), (T4) skipping irrigation at milky stage (R3), (T5) skipping irrigation at VT and R1, (T6) skipping irrigation at VT and R3, (T7) skipping irrigation at R1 and R3, (T8) skipping irrigation at all critical stages (VT, R1, R3), and (T9) irrigation only upto knee-high stage (V8). Irrigation was provided to each plot using a 2-inch siphon pipe at a discharge rate of 2.5 L s−1. To prevent lateral water movement and ensure treatment integrity, earthen bunds (30 cm height) were constructed around each plot, and buffer channels (0.5 m wide) were maintained between adjacent plots. Stage-wise water applied and total water for each treatment is presented in Table 1.
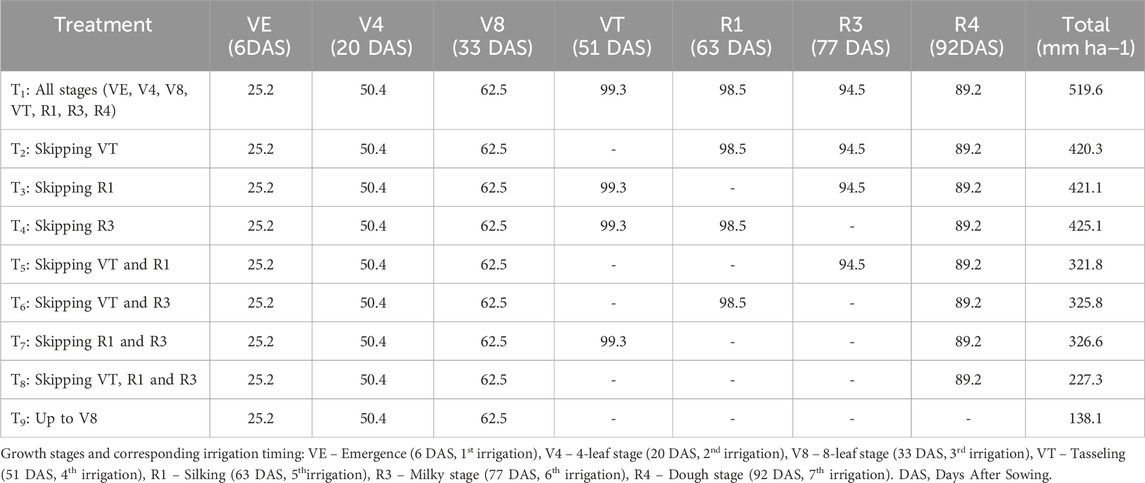
Table 1. Stage-wise irrigation schedule and total water applied (mm ha−1) for maize under different moisture stress treatments.
2.5 Data acquisition: UAV and ground-based measurements
Multispectral images of maize were acquired at the dough stage (R4) using a DJI Phantom 4 quadcopter UAV (SZ DJI Technology Co., Ltd., Shenzhen, China). The UAV was equipped with a GPS-assisted navigation system, four brushless motors, and an intelligent LiPo battery, enabling a flight duration of approximately 25–28 min. For imaging, it was integrated with a MicaSense RedEdge multispectral camera (Mica Sense Inc., Seattle, WA, United States). The sensor captures five spectral bands—blue (475 nm), green (560 nm), red (668 nm), red-edge (717 nm), and near-infrared (840 nm)—with a bandwidth of 10–20 nm. It also features a global shutter, 12-bit radiometric resolution, and a cosine-corrected irradiance sensor to account for varying light conditions, ensuring consistent reflectance measurement.
Prior to the UAV flight, preparations included battery charging and inspection, mission planning for flight path and altitude, GPS lock verification, and safety checks for wind and weather conditions. Radiometric calibration was performed using the manufacturer’s reference panel, and the sensor was mounted in a nadir orientation to minimize angular effects. Detasseling was carried out to avoid tassel interference with canopy reflectance. The UAV flight was executed at an altitude of 45 m, with images captured at one-second intervals; the entire field was covered in approximately 4–5 min, and flights were completed before 11:00 a.m. to minimize variation in solar illumination. To ensure dataset comparability, GreenSeeker measurements (NDVI) were collected immediately after the UAV flight, with a time gap of about 10 min.
The raw multispectral images were then processed using Pix4Dmapper software (version 4.8.0; Pix4D, 2023). The workflow included geotagging of individual images using flight metadata, followed by stitching and mosaicking to generate high-resolution orthomosaic maps. Radiometric correction was performed in Pix4Dmapper by applying sensor-specific adjustments (vignetting, irradiance, and exposure) and by using reflectance calibration panel images acquired before and after each flight. This ensured that the resulting orthomosaics represented consistent surface reflectance suitable for vegetation index calculation and subsequent analysis.
NDVI measurements were recorded with a GreenSeeker during the tasseling, silking, milky, and dough (R4) stages. For each plot, ten readings were collected at evenly spaced positions across the central rows, and the mean value was used for analysis. Measurements were consistently taken between 09:30 and 11:30 a.m. on clear days to minimize variability and ensure repeatability. Although NDVI was recorded at multiple reproductive stages, only the R4 stage values are presented in the results to enable direct comparability with UAV-derived NDVI collected at the same stage.
UAV imagery was processed in Pix4DMapper to generate orthomosaic maps for each spectral band. Vegetation indices—including NDVI, RDVI, SAVI, OSAVI, and TCARI—were subsequently calculated from reflectance values using ArcGIS, following established remote sensing protocols (Zheng et al., 2021).
2.6 Spectral vegetation indices and crop water stress index (CWSI)
2.6.1 Normalized difference vegetation index (NDVI)
It is a widely used remote sensing index calculated using the difference between near-infrared (NIR) and red (RED) light reflectance values. It serves as a reliable indicator of vegetation greenness and biomass and is extensively applied in agriculture for early detection of crop stress caused by drought, nutrient deficiency, or disease, enabling timely management interventions and improved yield predictions. NDVI can become less sensitive in very dense canopies and may be influenced by soil background, atmospheric conditions, and sensor angle. It was calculated as shown in Equation 1, following Rouse et al. (1974):
where.
• NIR = Reflectance in near-infrared band (840 nm, unit less reflectance)
• RED = Reflectance in red band (668 nm, unit less reflectance)
2.6.2 Renormalized difference vegetation index (RDVI)
RDVI is a vegetation index designed to improve sensitivity to changes in canopy structure and biomass, particularly in areas with dense vegetation. The formula for RDVI is given in Equation 2. It reduces the influence of soil background and enhances the detection of subtle differences in vegetation vigor compared to NDVI, making it useful for monitoring crop health and stress. Its performance may be affected in areas with very sparse or extremely dense vegetation, and it can be influenced by soil reflectance and atmospheric conditions.
Where.
• NIR = Reflectance in near-infrared band (840 nm, unit less reflectance)
• RED = Reflectance in red band (668 nm, unit less reflectance)
2.6.3 Soil adjusted vegetation index (SAVI)
SAVI is a modified vegetation index developed to reduce the influence of soil brightness in areas with sparse vegetation or exposed soil. By accounting for soil background effects, SAVI provides a more accurate estimation of vegetation health and biomass, making it particularly valuable for monitoring crop stress. Its sensitivity may decrease in very dense canopies, and the index can still be affected by heterogeneous soil reflectance or extreme soil brightness variations. SAVI was calculated as shown in Equation 3, following Huete (1988):
where.
• NIR = Reflectance in near-infrared band (840 nm)
• RED = Reflectance in red band (668 nm)
• L = Soil adjustment factor (dimensionless, commonly set as 0.5)
Here, the soil adjustment factor (L = 0.5) functions as a hyper-parameter, which can be varied according to canopy density to optimize index sensitivity.
2.6.4 Optimized soil-adjusted vegetation index (OSAVI)
OSAVI is an improved version of the Soil-Adjusted Vegetation Index (SAVI), specifically designed to further reduce the influence of soil brightness in areas with low or moderate vegetation cover. It enhances the detection of vegetation vigour and canopy greenness compared to SAVI by optimizing the soil adjustment factor. Its accuracy can be affected in very sparse or extremely dense canopies, and in fields with highly reflective soils. OSAVI values may be influenced by soil and background variations. OSAVI was calculated as shown in Equation 4, following Rondeaux et al. (1996):
where.
• NIR = Reflectance in near-infrared band (840 nm, unit less reflectance)
• RED = Reflectance in red band (668 nm, unit less reflectance)
• 0.16 = Soil adjustment constant (dimensionless), optimized for low vegetation cover
2.6.5 Transformed chlorophyll absorption in reflectance index (TCARI)
TCARI builds upon chlorophyll absorption features and is designed to reduce the influence of soil background and atmospheric conditions. It incorporates a term based on green band (around 550 nm) reflectance to improve sensitivity to chlorophyll content across a wide range of concentrations, making it a reliable index for estimating chlorophyll in various vegetation types. It can be less accurate under very sparse canopies or mixed soil-vegetation conditions, and its performance depends on proper sensor calibration and consistent illumination. TCARI was calculated as shown in Equation 5, following Haboudane et al. (2004):
where.
• RedEdge = Reflectance in red-edge band (∼700 nm, unitless reflectance)
• RED = Reflectance in red band (668 nm, unit less reflectance)
• Green = Reflectance in green band (∼550 nm, unitless reflectance)
• The coefficients (3 and 0.2) embedded in the formula act as hyper-parameters that enhance sensitivity to chlorophyll variation while reducing background noise.
2.6.6 Crop water stress index (CWSI)
Canopy temperature was measured using a portable hand-held infrared thermometer to calculate the Crop Water Stress Index (CWSI), which quantifies the degree of water stress in maize and supports precise irrigation scheduling (Idso et al., 1981). CWSI values range from 0 (no stress) to 1 (maximum stress). To minimize soil interference, the infrared thermometer was positioned at a 120° angle perpendicular to the crop row, at a height of 30 cm above the canopy and a horizontal angle of 15°. At each sampling site, three canopy temperature (Tc) readings were taken, and the mean was used to represent the site temperature. Concurrently, field air temperature (Ta) and relative humidity (RH) were measured using a hygrometer. CWSI was calculated using the empirical model proposed by Idso et al. (1981), as shown in Equation 6.
Where, dTm = (Tc -Ta), dTLL and dTUL are lower and upper limits of canopy and air temperature difference respectively. Baselines were calculated as:
where VPD is the vapor pressure deficit, VPG is the vapor pressure gradient, and m and b are slope and intercept obtained from regression between Tc–Ta and VPD under well-watered plots.
In practice, the non-water-stressed baseline (LL) shifted considerably across phenological stages, while the upper baseline (UL) remained nearly constant (<0.1 °C difference between stages), consistent with Zhang et al. (2019). Therefore, most of the variability in CWSI values was explained by LL, while UL contributed little to discrimination of stress.
Canopy temperature measurements were conducted between 10:00 and 12:00 h at tasseling (VT), silking (R1), milky (R3), and dough (R4) stages to capture phenology-specific stress dynamics. This approach enabled early and reliable detection of water stress, complementing UAV-based multispectral observations and providing actionable information for irrigation management.
2.7 Kernel yield
Kernel yield was determined by harvesting all cobs from the net plot area at full maturity. The harvested cobs were dried to a constant weight and shelled using a maize sheller. The kernels were then cleaned and weighed. The kernel weight was recorded on a per-plot basis and extrapolated to hectare basis, with the final yield expressed in kilograms per hectare (kg ha−1).
2.8 Statistical analysis
Data from the field experiment was analysed using analysis of variance (ANOVA) under a randomized complete block design (RCBD) to evaluate treatment effects at a significance level of p = 0.05. Treatment means were compared using Duncan’s Multiple Range Test (DMRT). Variability across replications was expressed as standard deviation (SD), reported with the means in the tables. In addition, pooled standard error of mean (SEm) values was calculated and are presented in the bottom rows of the tables for reference. Correlation analysis was performed using all plot-level data (27 observations; nine treatments × three replications) to capture the full variability. Correlation heat maps were used to depict the strength and direction of associations among vegetation indices, CWSI, and kernel yield.
To complement the inferential analysis, supplementary visualizations were generated to aid interpretation. Boxplots were used to illustrate the distribution, variability, and treatment effects for kernel yield and vegetation indices, highlighting patterns and potential outliers. For clarity, significance groupings from DMRT were presented only in tables, while boxplots were reserved for visualizing distributions without additional lettering.
All analyses were performed in R software (version 4.2.2). The ggplot2 package (v3.4.0) was used to generate boxplots and other visualizations, while the corrplot package (v0.92) was employed for correlation matrices. This workflow ensured both statistical rigor and clear visualization of treatment effects and inter-variable relationships.
3 Results and discussion
3.1 Weather conditions and their relevance to stress imposition
Crop growth and yield are strongly influenced by prevailing weather conditions. During the crop growth period, a total of 57.2 mm of rainfall was received across three events. Importantly, all rainfall occurred after the dough (R4) stage, so it did not interfere with the planned irrigation treatments (Figure 1). At the early vegetative stages, daytime temperatures averaged 29 °C, while night temperatures dropped to ∼13 °C. Elevated relative humidity during this period created favorable conditions for infestation by fall armyworm (Spodoptera frugiperda). The outbreak was effectively controlled through timely insecticide applications, preventing further spread. These weather conditions, particularly the absence of rainfall until R4, provided a controlled environment for studying water stress. Similar controlled dry periods have been shown to enhance the precision of irrigation trials and stress detection (Zhu and Burney, 2022).
3.2 NDVI response under different irrigation regimes
NDVI values differed significantly among irrigation treatments (Figures 3 and 4). Although GreenSeeker NDVI was measured at multiple reproductive stages, only the R4 stage values are presented here to ensure direct comparability with UAV-derived NDVI acquired at the same stage. The highest MSS-based NDVI (0.76) and GreenSeeker-based NDVI (0.78) were recorded under full irrigation (T1). These values were statistically comparable (p > 0.05) to those obtained when irrigation was skipped at tasseling (T2: MSS 0.71; GreenSeeker 0.72), silking (T3: MSS 0.70; GreenSeeker 0.71), or milky stage (T4: MSS 0.72; GreenSeeker 0.73). This indicates that skipping irrigation at a single critical stage did not significantly reduce canopy vigor, suggesting compensatory responses under mild stress, as also reported by Xu et al. (2022).
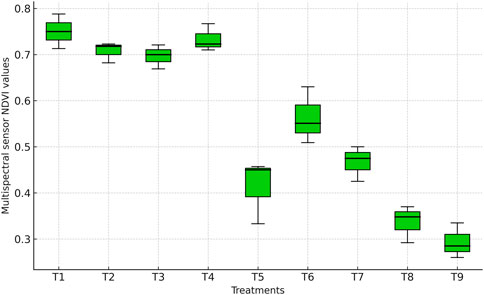
Figure 3. Boxplot showing NDVI values derived from the multispectral sensor across irrigation treatments.
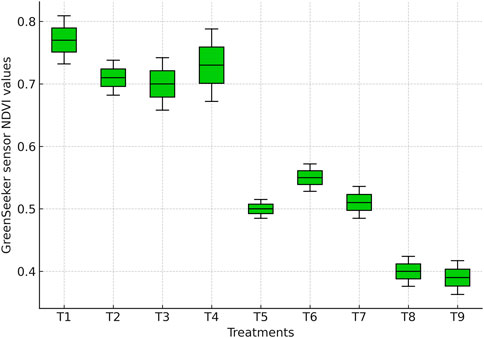
Figure 4. Boxplot showing NDVI values measured using a GreenSeeker handheld sensor across irrigation treatments.
In contrast, skipping irrigation at two consecutive stages resulted in sharp NDVI reductions (p ≤ 0.05). Irrigation skipped at tasseling and silking (T5: MSS 0.45; GreenSeeker 0.48), tasseling and milky (T6: MSS 0.51; GreenSeeker 0.53), and silking and milky stages (T7: MSS 0.49; GreenSeeker 0.51) produced values 30%–40% lower than T1. These reductions are also evident in the NDVI values (Figures 3, 4), where water-stressed treatments show distinct declines compared with fully irrigated plots. Such declines reflect impaired canopy development, chlorophyll loss, and reduced photosynthetic efficiency, consistent with earlier findings that NDVI decreases under drought due to senescence and diminished leaf area (Zhang et al., 2019; Liu et al., 2022).
The lowest NDVI values were recorded when irrigation was applied only up to knee-high (T8: MSS 0.38; GreenSeeker 0.40) or withheld at all critical stages (T9: MSS 0.37; GreenSeeker 0.39), corresponding to a ∼50% reduction relative to T1 (p ≤ 0.05). These severe declines highlight the sensitivity of NDVI to prolonged water deficit, as limited vegetative growth and canopy senescence reduce near-infrared reflectance and increase red reflectance.
Although NDVI remained statistically comparable when irrigation was skipped at only one stage (T2–T4), yield reductions still occurred, reflecting the varying sensitivity of reproductive stages. Water stress at silking restricts pollination and fertilization (Li et al., 2024), tasseling stress lowers pollen viability and silk receptivity (Klocke et al., 2019), and milky-stage stress reduces kernel filling (Irmak et al., 2019). Thus, even when NDVI values were unaffected statistically, reproductive processes were disrupted.
Overall, NDVI proved to be a sensitive indicator of water status and canopy health in maize. The boxplots clearly demonstrate that severe or prolonged water deficits substantially reduce NDVI, emphasizing the importance of continuous irrigation during both vegetative and reproductive phases to sustain crop productivity.
3.3 RDVI as an indicator of water stress
RDVI values differed significantly among irrigation treatments (Figure 5). The highest value was observed under full irrigation (T1: 0.75), followed by treatments where irrigation was skipped at tasseling (T2: 0.67), silking (T3: 0.64), or milky stage (T4: 0.70). These values were statistically comparable to each other (p > 0.05), indicating that skipping irrigation at only one critical stage did not significantly reduce canopy vigor. This suggests that maize can tolerate brief water stress without major loss of canopy greenness, consistent with the findings of Song et al. (2019).
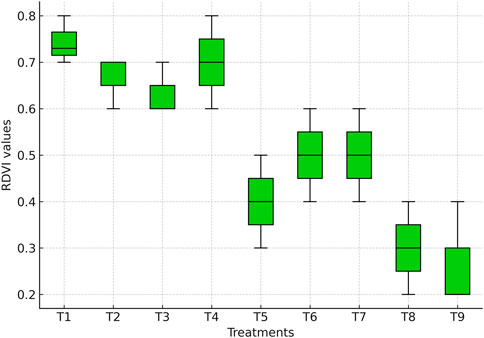
Figure 5. Boxplot showing RDVI values derived from the multispectral sensor across irrigation treatments.
In contrast, RDVI declined significantly when irrigation was skipped at two consecutive stages (p ≤ 0.05). Treatments T5 (tasseling + silking: 0.38), T6 (tasseling + milky: 0.49), and T7 (silking + milky: 0.50) recorded 30%–45% lower RDVI compared with T1. These patterns are also evident in the RDVI values (Figure 5), where stressed treatments show clear reductions in canopy vigor compared with fully irrigated plots. Such declines reflect restricted canopy expansion, reduced leaf area, and limited light interception, which lower near-infrared reflectance relative to red reflectance, resulting in decreased RDVI values (Gao, 1996; Delegido et al., 2023).
The lowest RDVI values were observed when irrigation was applied only up to the knee-high stage (T8: 0.29) or withheld throughout critical stages (T9: 0.26), corresponding to a ∼65% decline relative to T1 (p ≤ 0.05). These treatments highlight the severe impact of early termination or complete withdrawal of irrigation, leading to canopy senescence, reduced photosynthetic activity, and impaired crop growth.
Overall, these findings demonstrate that RDVI is a robust indicator of water stress in maize, particularly under prolonged or severe deficits. Its strong sensitivity to vegetation vigor and chlorophyll status aligns with earlier reports (Zhang et al., 2019), confirming its utility for monitoring crop water status under varying irrigation regimes.
3.4 SAVI response to irrigation treatments
SAVI values differed significantly among irrigation treatments (Figure 6). The highest values were recorded under full irrigation (T1: 0.84), which were statistically comparable (p > 0.05) to treatments where irrigation was skipped at tasseling (T2: 0.80), silking (T3: 0.81), or milky stage (T4: 0.83). This indicates that skipping irrigation at only one critical stage did not significantly affect canopy vigor, suggesting that maize can compensate for short-term water stress by maintaining leaf area and greenness. Similar compensatory responses were reported by Zhang et al. (2019) and Teodoro et al. (2024).
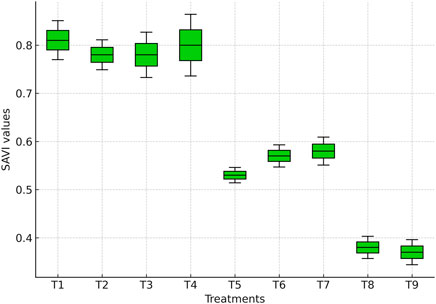
Figure 6. Boxplot showing SAVI values derived from the multispectral sensor across irrigation treatments.
In contrast, skipping irrigation at two consecutive stages significantly reduced SAVI (p ≤ 0.05). Treatments T5 (tasseling + silking: 0.52), T6 (tasseling + milky: 0.56), and T7 (silking + milky: 0.58) showed 30%–40% lower SAVI compared with T1. These reductions reflect decreased chlorophyll content, limited photosynthetic activity, and impaired canopy development, with the most pronounced declines under T5, highlighting the sensitivity of tasseling and silking to water deficits. These patterns are also evident in the SAVI values (Figure 6), where treatments subjected to consecutive irrigation skips show visibly reduced canopy vigor compared with fully irrigated treatments. Such responses are consistent with earlier reports linking reproductive-stage stress to reduced kernel set and yield (Irmak et al., 2019).
The lowest SAVI values were observed when irrigation was applied only up to the knee-high stage (T8: 0.37) or withheld at all critical stages (T9: 0.36), representing a ∼55% decline relative to T1 (p ≤ 0.05). These results illustrate the severe impact of prolonged water stress on canopy cover, as restricted vegetative growth and reduced leaf expansion limit light interception and NIR reflectance while enhancing red reflectance. This explains the sharp decline in SAVI under extreme stress. Overall, these findings underscore the sensitivity of SAVI to water availability and its reliability in distinguishing between moderate and severe stress conditions in maize.
3.5 OSAVI sensitivity to water deficit
OSAVI values varied significantly among irrigation treatments (Figure 7). The highest value was recorded under full irrigation (T1: 0.72), which was statistically comparable (p > 0.05) to treatments where irrigation was skipped at tasseling (T2: 0.67), silking (T3: 0.68), or milky stage (T4: 0.71). This indicates that skipping irrigation at only one critical stage did not significantly affect canopy vigor, suggesting a compensatory response by maize under mild water stress. Similar tolerance has been reported by Zhang et al. (2019).
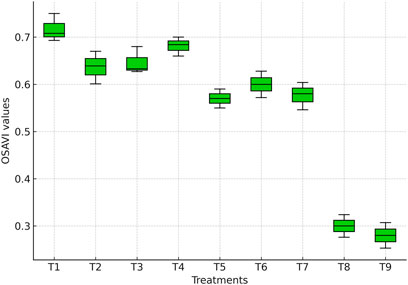
Figure 7. Boxplot showing OSAVI values derived from the multispectral sensor across irrigation treatments.
In contrast, withholding irrigation at two consecutive stages significantly reduced OSAVI. Treatments T5 (tasseling + silking: 0.53), T6 (tasseling + milky: 0.56), and T7 (silking + milky: 0.55) exhibited 25%–30% lower OSAVI compared with T1 (p ≤ 0.05). These reductions are also evident in the OSAVI values (Figure 7), where stressed treatments show visibly reduced canopy vigor compared with fully irrigated plots. Such declines reflect impaired canopy structure, reduced chlorophyll content, and limited photosynthetic activity. Since OSAVI minimizes soil background effects, its reductions here primarily capture vegetation stress rather than soil noise, in line with findings of Colović et al. (2022).
The lowest OSAVI values were observed in treatments irrigated only up to the knee-high stage (T8: 0.29) or where irrigation was withheld at all critical stages (T9: 0.28), corresponding to nearly 60% reduction compared to T1 (p ≤ 0.05). Such sharp declines highlight the severity of early and prolonged water stress, which restricts vegetative growth, accelerates canopy senescence, and reduces leaf water content. UAV-based studies further confirm strong correlations between OSAVI and crop water status, demonstrating its reliability for precision irrigation scheduling and high-throughput stress detection in maize (Mndela et al., 2023).
3.6 TCARI and chlorophyll degradation under stress
TCARI values differed significantly among irrigation treatments (Figure 8). The lowest values were recorded under full irrigation (T1: 0.11), indicating high chlorophyll preservation and healthy vegetation. Similar values were observed when irrigation was skipped only at the milky stage (T4: 0.13), and these treatments were statistically comparable to T1 (p > 0.05). In contrast, irrigation applied only up to the knee-high stage (T8: 0.32) and complete irrigation withdrawal across all stages (T9: 0.34) resulted in the highest TCARI values, representing ∼65–70% higher readings relative to T1 (p ≤ 0.05), indicating severe chlorophyll degradation.
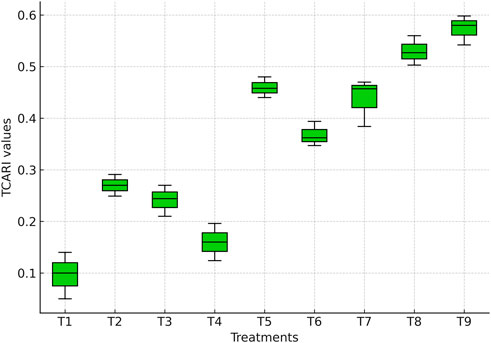
Figure 8. Boxplot showing TCARI values derived from the multispectral sensor across irrigation treatments.
Dual-stage irrigation skips also produced significantly higher TCARI values compared with T1. Treatments T5 (tasseling + silking: 0.29), T6 (tasseling + milky: 0.26), and T7 (silking + milky: 0.27) recorded more than double the values of fully irrigated treatments, reflecting accelerated chlorophyll breakdown under combined reproductive-stage stress (p ≤ 0.05). These patterns are also evident in the TCARI values (Figure 8), where stressed treatments show elevated values corresponding to severe pigment loss.
These variations in TCARI reflect the crop’s physiological adaptation to water availability, particularly in maintaining chlorophyll integrity and canopy health. Since TCARI is inversely related to chlorophyll content (Haboudane et al., 2004; Zarco-Tejada et al., 2003), the higher values observed under T8 and T9 confirm the loss of chlorophyll pigments and accelerated senescence. Early vegetative irrigation, while beneficial for root establishment, proved insufficient to sustain chlorophyll stability through flowering and grain filling, which are highly sensitive to water deficits (Anjum et al., 2011; Tardieu, 2012).
By contrast, the lower TCARI values in T1 and T4 indicate effective preservation of chlorophyll and photosynthetic activity under well-watered or moderately stressed conditions, supporting delayed senescence and prolonged biomass accumulation (Ali et al., 2019; Fang et al., 2020). Treatments involving dual irrigation skips (T5–T7) recorded the highest stress responses, particularly when tasseling and silking coincided with water deficit. These stages represent peak metabolic and reproductive activity. Under stress, nutrient mobility, chloroplast stability, and hormonal balance are reduced, leading to rapid canopy senescence and increased reflectance in the red band (Zhang et al., 2019; Avni et al., 2020).
Overall, the observed trends confirm that strategic irrigation scheduling especially ensuring water availability during tasseling and silking is critical for maintaining chlorophyll content and canopy health, as reflected in lower TCARI values (González-Dugo et al., 2014; Liu et al., 2023; Zhou et al., 2021).
The spatial variability of these vegetation indices is further illustrated in Figure 9, where panels 9a–9e show the spatial patterns of NDVI, RDVI, SAVI, OSAVI, and TCARI, respectively. These maps provide a clear visual comparison of water-stressed and irrigated treatments and complement the boxplot analyses.
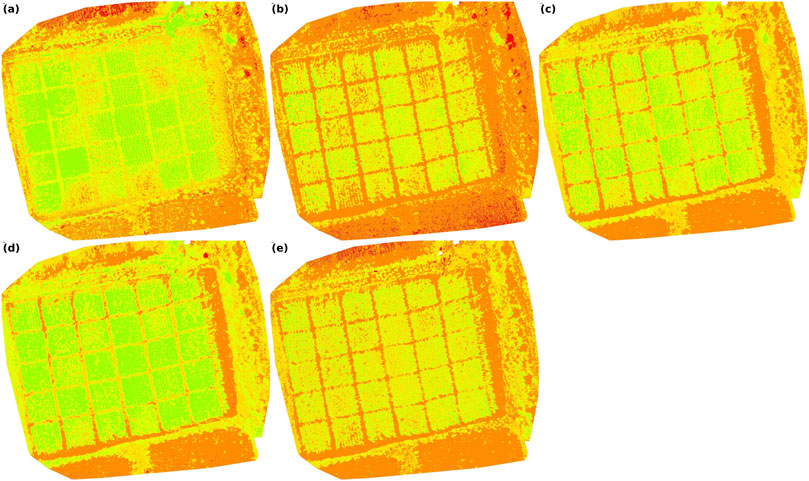
Figure 9. Spatial variability maps generated using Pix4Dmapper: (a) NDVI, (b) RDVI, (c) SAVI, (d) OSAVI, and (e) TCARI.
3.7 CWSI
3.7.1 CWSI response under different irrigation regimes
CWSI values varied significantly across irrigation regimes and growth stages (Table 2). At tasseling, the lowest CWSI was recorded under full irrigation (T1: 0.22) and was statistically comparable with single skips at silking (T3: 0.22), milky (T4: 0.23), or both silking and milky stages (T7: 0.20) (p > 0.05). In contrast, skipping irrigation at both tasseling and silking (T5: 0.43), tasseling and milky (T6: 0.42), or all three stages (T8: 0.40) nearly doubled CWSI compared with T1 (p ≤ 0.05).
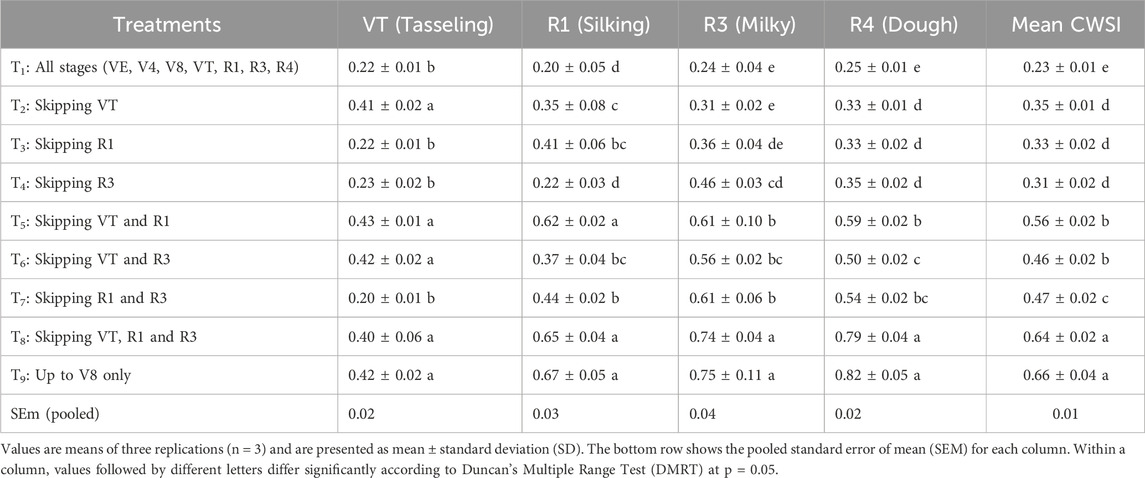
Table 2. CWSI of maize as influenced by moisture stress at critical crop growth stages.
At silking, CWSI remained lowest under T1 (0.20), followed by T4 (0.22). The highest values occurred when irrigation was restricted to vegetative phases (T8: 0.65; T9: 0.67) or withheld at both tasseling and silking (T5: 0.62), representing a threefold increase relative to T1 (p ≤ 0.05). This confirms the high sensitivity of silking to water deficit, when pollination and fertilization are most vulnerable.
At the milky stage, full irrigation (T1: 0.24) and single skips (T2: 0.31; T3: 0.36) maintained significantly lower CWSI values than treatments irrigated only up to knee-high (T8: 0.74; T9: 0.75). These values were more than three times higher than T1, showing early vegetative irrigation alone cannot sustain reproductive-stage requirements.
At the dough stage, the lowest CWSI was again maintained under T1 (0.25), while T8 (0.79) and T9 (0.82) recorded the highest values, nearly threefold greater than T1 (p ≤ 0.05).
When averaged across all stages, mean CWSI was lowest under T1 (0.23), followed by single-stage skips (T2–T4: 0.31–0.35). Dual-stage skips produced intermediate values (T5–T7: 0.46–0.56), while the highest means were observed under T8 (0.64) and T9 (0.66), approximately three times greater than T1.
These results demonstrate that CWSI reliably reflects the magnitude of water stress, with the greatest sensitivity at tasseling and silking. High values under T5–T9 confirm that reproductive stages are most vulnerable to water deficit, as stress reduces leaf cooling, canopy conductance, and transpiration efficiency (González-Dugo et al., 2014). Conversely, consistently low values in T1 confirm optimal canopy water status and effective stomatal regulation under well-watered condition.
3.7.2 Non-water-stressed baseline derivation
The CWSI was derived using stage-specific non-water-stressed (LL) and non-transpiring (UL) baselines following Idso et al. (1981). Regressions of canopy–air temperature difference (Tc–Ta) against vapor pressure deficit (VPD) showed strong linear relationships (R2 = 0.84–0.92) across VT, R1, R3, and R4 stages (Figure 10). These regressions provided reliable estimates of the LL baseline, which shifted considerably across phenological stages. The slope decreased from −2.82 °C k Pa−1 at tasseling to −1.32 °C kPa−1 at dough, while the intercept declined from 3.07 °C to 1.15 °C, reflecting changes in canopy architecture and transpiration cooling capacity during crop development.
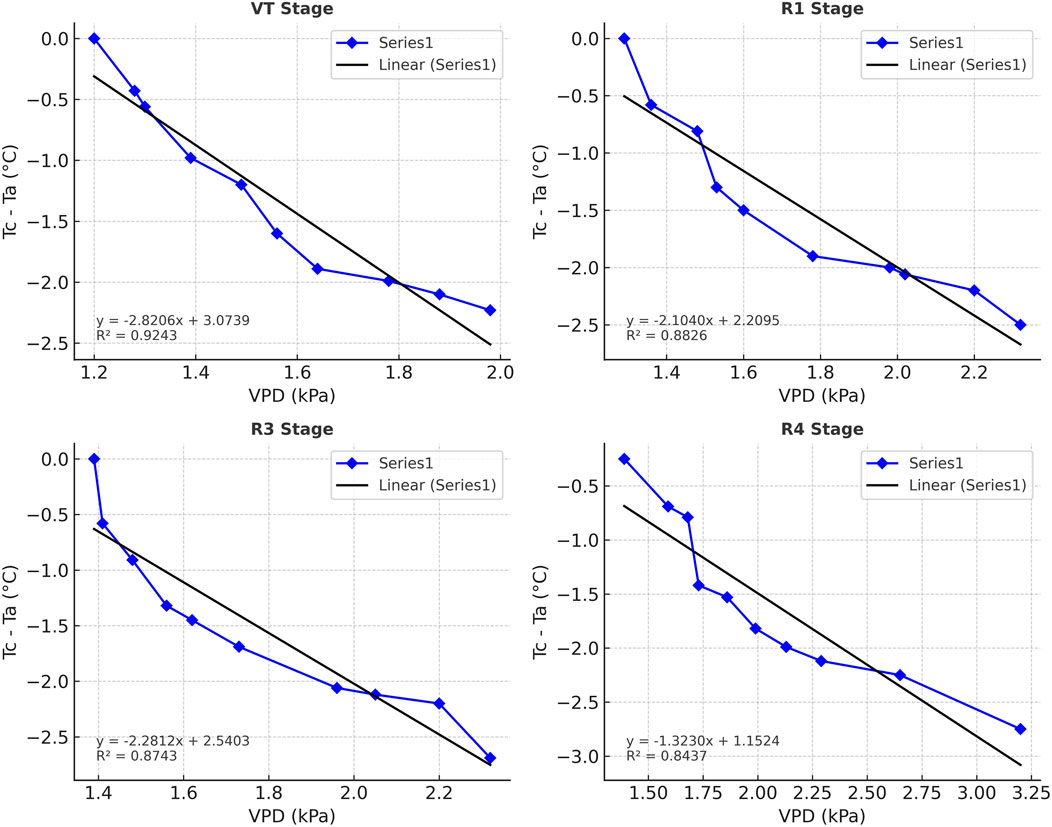
Figure 10. Relationship between canopy–air temperature difference (Tc–Ta) and vapor pressure deficit (VPD) at different maize growth stages. Scatter points show observed Tc–Ta values.
Although both LL and UL were established, UL values derived from the vapor pressure gradient (VPG) exhibited minimal variability (<0.1 °C) across growth stages. This finding agrees with Zhang et al. (2019), who reported that CWSI variability is predominantly influenced by LL, whereas UL remains nearly constant. Consequently, LL served as the primary driver of stress detection in this study, while UL contributed little to discrimination across treatments.
High CWSI values correspond to stomatal closure, reduced transpiration, and canopy heating, effects that are most pronounced during reproductive stages when maize water demand peaks (Zia et al., 2021). Tasseling and silking are particularly sensitive, as stress directly reduces pollination, fertilization, and kernel set. In contrast, low CWSI under T1 reflects optimal transpiration cooling and water status, as also observed in earlier studies (Sadras and Milroy, 1996; González-Dugo et al., 2014).
Overall, the use of stage-specific baselines provided a robust framework for quantifying canopy stress. The findings confirm that irrigation applied throughout vegetative and reproductive phases minimizes stress, whereas early-stage irrigation alone is inadequate. This approach, consistent with Idso et al. (1981) and later UAV-based applications (Zhang et al., 2019), highlights CWSI as a reliable indicator of maize water status and stress resilience across irrigation regimes.
3.8 Kernel yield response to irrigation treatments
Kernel yield varied significantly across irrigation regimes (Figure 11). The highest yield was recorded under full irrigation (T1: 7,040.7 kg ha−1), which was significantly higher (p ≤ 0.05) than all other treatments. Skipping irrigation at tasseling (T2: 5,744.7 kg ha−1) or silking (T3: 5,874.7 kg ha−1) reduced yield by 18%–20% compared with T1, while skipping irrigation at the milky stage (T4: 6,411.0 kg ha−1) caused a smaller decline (9%).
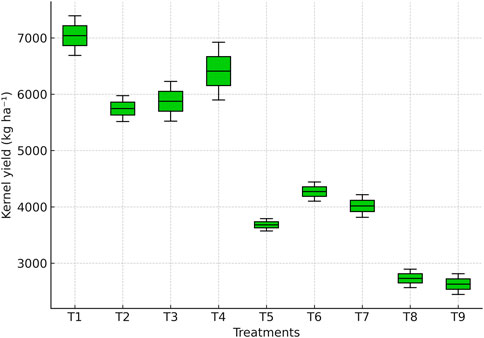
Figure 11. Boxplot showing kernel yield of maize across irrigation treatments.
More severe yield reductions were observed under dual-stage irrigation skips. Yield under tasseling + silking (T5: 3,681.3 kg ha−1) was 47.7% lower than T1, while tasseling + milky (T6: 4,271.3 kg ha−1) and silking + milky (T7: 4,016.0 kg ha−1) reduced yields by 39.3% and 42.9%, respectively. The lowest yields were recorded when irrigation was applied only up to the knee-high stage (T8: 2,729.7 kg ha−1) or withheld during all reproductive stages (T9: 2,628.3 kg ha−1), corresponding to 61%–63% yield losses compared with T1.
These results highlight the importance of irrigation during reproductive phases. Water deficit at tasseling and silking (T5–T7) drastically reduced yields, consistent with earlier findings that stress during these stages’ limits pollen viability, silk receptivity, and kernel initiation (Daryanto et al., 2016; Song et al., 2019).
The extremely low yields in T8 and T9 confirm that early irrigation alone cannot sustain water requirements during reproductive stages, leading to severe assimilate shortages for grain filling. Similar conclusions were drawn by Fereres and Soriano (2007), Pandey et al. (2000), and Farooq et al. (2017), who reported that early stress restricts canopy development, biomass accumulation, and yield potential.
Interestingly, yields from T8 and T9 were statistically comparable to those in multi-stage skips, indicating that both prolonged early stress and severe late stress can equally limit kernel production. Stress during kernel filling reduces kernel number and weight, as also reported by Zhang et al. (2019). Although maize tolerates mild vegetative stress, reproductive-stage water deficits directly reduce photosynthetic activity and assimilate partitioning to kernels, resulting in major productivity losses.
Overall, kernel yield trends confirm that irrigation at tasseling, silking, and milky stages is indispensable for securing high maize yield, while skipped irrigation during these critical phases results in irreversible losses.
3.9 Relationships between CWSI, vegetation indices, and kernel yield
Mean CWSI, derived from stage-specific non-water-stressed baselines (LL) with UL values remaining nearly constant across stages, showed strong correlations with both vegetation indices and grain yield (Figure 12). CWSI was negatively correlated with NDVI (r = −0.98), RDVI (r = −0.99), SAVI (r = −0.99), and OSAVI (r = −0.88), while TCARI exhibited a strong positive correlation (r = 0.96). As canopy stress intensified, vegetation indices declined markedly, reflecting reduced chlorophyll content, weaker canopy development, and diminished photosynthetic activity.
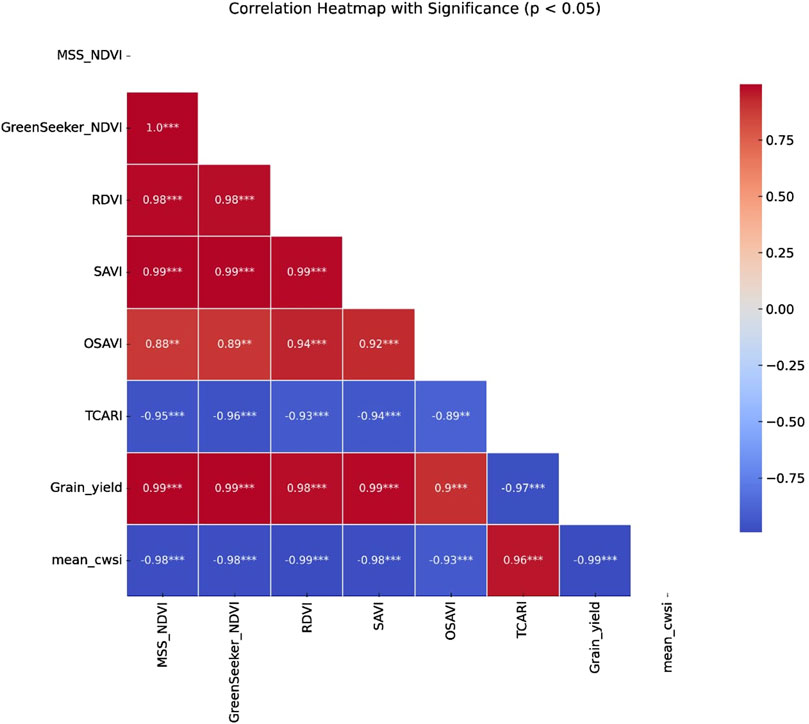
Figure 12. Correlation heatmap showing relationships among vegetation indices, the Crop Water Stress Index (CWSI), and yield. Values represent Pearson correlation coefficients, with significance indicated by asterisks.
Grain yield was also closely associated with these stress indicators. Yield declined sharply with increasing CWSI (r = −0.99, p < 0.001), whereas it showed strong positive correlations with NDVI (r = 0.99), RDVI (r = 0.98), SAVI (r = 0.99), and OSAVI (r = 0.90). In contrast, TCARI correlated negatively with yield (r = −0.97), consistent with its sensitivity to stress-induced pigment degradation and reduced photosynthetic capacity.
Overall, the integration of thermal (CWSI) and spectral indicators (NDVI, RDVI, SAVI, OSAVI, TCARI) provided a comprehensive picture of crop stress and yield response. While spectral indices captured canopy chlorophyll status and biomass accumulation, CWSI reflected stomatal regulation and transpiration cooling. Recent studies (Hatfield and Prueger, 2010; Zhang et al., 2019; Yetik and Candogan, 2023; Liu et al., 2023) similarly highlight that combining spectral and thermal data enhances the accuracy of stress detection and yield prediction. Moreover, indices incorporating soil-adjustment parameters, such as SAVI (L = 0.5) and OSAVI (C = 0.16), consistently performed better, as these formulations reduce soil background effects, in line with recent advances emphasizing parameter calibration for robustness across environments (Song et al., 2024; Liang et al., 2024).
3.10 Methodological innovations and comparative evaluation
This study introduces key advances in maize water stress detection. First, UAV multispectral indices at the R4 stage were integrated with stage-specific ground-based CWSI measurements (VT, R1, R3, and R4). This directly linked canopy spectral responses with physiological stress and yield, offering more reliable detection than using spectral or thermal indicators alone.
UAV imaging was timed at R4, when irrigation treatments ended and stress effects were fully expressed. This captured cumulative stress impacts while reducing the need for multi-date campaigns. CWSI was calibrated locally using well-irrigated plots to derive stage-specific LL baselines. Although both LL and UL were estimated, UL varied minimally (<0.1 °C), consistent with Zhang et al. (2019). Thus, LL provided the main source of variability, improving the robustness of stress quantification compared with theoretical models.
The experimental design, with nine irrigation treatments and systematic stage omissions, created a rigorous stress gradient. This enabled a thorough evaluation of index sensitivity and yield response. The combined use of UAV multispectral indices and calibrated thermal indices demonstrates strong potential for precision irrigation, improving water use efficiency and stabilizing yields under limited water supply.
3.11 Transferability and cross-regional applicability
Present study was conducted under tropical wet–dry conditions at the Main Agricultural Research Station, University of Agricultural Sciences, Dharwad, with site-specific calibration of CWSI baselines and UAV imaging at R4. While the results provide robust local insights, broader applicability requires validation in diverse agro-ecological settings.
Recent studies suggest strategies for scaling UAV- and index-based stress detection. Cheng et al. (2023) emphasized standardized calibration protocols for cross-regional comparability, while Zhang et al. (2019) highlighted domain-adaptation approaches to reduce site-specific bias. Together, these methods can enhance the robustness and transferability of stress detection frameworks.
Integrated approach combining UAV multispectral indices with stage-specific CWSI—shows strong potential for adaptation in other environments, provided local calibration is performed. Since UL was nearly constant under local conditions, future studies should test whether it is applicable across different climates. If confirmed, LL-based calibration offers a simplified but reliable framework for cross-regional applications.
4 Conclusion
Spectral indices (NDVI, RDVI, SAVI, OSAVI, and TCARI), together with the thermal-based Crop Water Stress Index (CWSI), effectively characterized maize water stress across contrasting irrigation regimes. NDVI-based indices declined under stress, TCARI increased with pigment degradation, and grain yield was strongly correlated with both, confirming their value as reliable predictors of productivity under water-limited conditions.
CWSI, calibrated with stage-specific non-water-stressed (LL) baselines, proved particularly robust during reproductive stages, when water deficits most sharply increased canopy stress. Although both LL and the non-transpiring upper limit (UL) were derived, UL varied little across stages, while LL accounted for most of the variability. Indices incorporating soil or canopy adjustments (SAVI, OSAVI), combined with calibrated CWSI, provided the most consistent discrimination among treatments, underscoring the value of integrating spectral and thermal indicators.
A key limitation was the restricted spectral configuration of the MicaSense RedEdge sensor, which contains only blue, green, red, red-edge, and NIR bands. As a result, only a limited set of widely validated indices (NDVI, RDVI, SAVI, OSAVI, TCARI) could be derived in this study. Other indices that are highly sensitive to canopy water status and pigment dynamics—such as the Water Index (WI), the green-based Normalized Difference Water Index (NDWI), the Chlorophyll Index green (CIgreen), the Chlorophyll Index red-edge (CIred-edge), and the Normalized Difference Red-edge Index (NDred-edge) could not be computed due to spectral constraints. Similarly, indices requiring shortwave infrared (SWIR) bands, including the Normalized Difference Moisture Index (NDMI) and certain Normalized Water Index (NWI) formulations, were also beyond the capability of this sensor. Another limitation was that UAV imaging was conducted only at the dough (R4) stage; although this captured cumulative stress, multi-stage imaging would provide a more dynamic picture of stress progression.
Despite these constraints, the study demonstrates the strong potential of UAV-based multispectral and thermal sensing to guide precision irrigation. Future research should (i) implement multi-stage UAV monitoring, (ii) incorporate SWIR-capable sensors to broaden the range of water-related indices, (iii) integrate spectral and thermal metrics using machine learning approaches, and (iv) further validate LL/UL baseline behaviour across environments to strengthen the transferability of CWSI-based assessments.
Data availability statement
The original contributions presented in the study are included in the article/supplementary material, further inquiries can be directed to the corresponding authors.
Author contributions
YK: Conceptualization, Formal Analysis, Investigation, Methodology, Supervision, Writing – original draft, Writing – review and editing, Resources. MP: Conceptualization, Data curation, Investigation, Methodology, Resources, Supervision, Writing – review and editing, Writing – original draft. DB: Data curation, Formal Analysis, Writing – review and editing, Conceptualization, Investigation, Methodology, Supervision. VK: Data curation, Formal Analysis, Writing – review and editing, Validation. AKK: Data curation, Formal Analysis, Investigation, Software, Writing – review and editing. BP: Data curation, Formal Analysis, Investigation, Writing – review and editing. VM: Data curation, Formal Analysis, Investigation, Software, Writing – review and editing.
Funding
The author(s) declare that no financial support was received for the research and/or publication of this article.
Conflict of interest
The authors declare that the research was conducted in the absence of any commercial or financial relationships that could be construed as a potential conflict of interest.
Generative AI statement
The author(s) declare that no Generative AI was used in the creation of this manuscript.
Any alternative text (alt text) provided alongside figures in this article has been generated by Frontiers with the support of artificial intelligence and reasonable efforts have been made to ensure accuracy, including review by the authors wherever possible. If you identify any issues, please contact us.
Publisher’s note
All claims expressed in this article are solely those of the authors and do not necessarily represent those of their affiliated organizations, or those of the publisher, the editors and the reviewers. Any product that may be evaluated in this article, or claim that may be made by its manufacturer, is not guaranteed or endorsed by the publisher.
References
Ali, M., Li, Q., Liang, H., Ashraf, U., Adnan, M., Rizwan, M., et al. (2019). Performance characterization of the UAV chemical application based on CFD simulation. Agronomy 9 (6), 308. doi:10.3390/agronomy9060308
Anjum, S. A., Xie, X. Y., Wang, L. C., Saleem, M. F., Man, C., and Lei, W. (2011). Morphological, physiological and biochemical responses of plants to drought stress. Afr. J. Agric. Res. 6 (9), 2026–2032. doi:10.5897/AJAR10.027
Avni, R., Nave, M., Eilam, T., Sela, H., Alekperov, C., Peleg, Z., et al. (2020). Genomic adaptation of wild emmer wheat to drought stress and its impact on chlorophyll content. Plant J. 103 (6), 1915–1930. doi:10.1111/tpj.14863
Black, C. A. (1967). Methods of soil analysis. Part I: physical and mineralogical properties, including statistics of measurement and sampling. Madison, WI: American Society of Agronomy. p. 770. doi:10.2134/agronmonogr9.1
Cheng, M., Sun, C., Nie, C., Liu, S., Yu, X., Bai, Y., et al. (2023). Evaluation of UAV-based drought indices for crop water conditions monitoring: a case study of summer maize. Agric. Water Manag. 287, 107862. doi:10.1016/j.agwat.2023.107862
Colović, M., Yu, K., Todorović, M., Cantore, V., Hamze, M., Albrizio, R., et al. (2022). Hyperspectral vegetation indices to assess water and nitrogen status of sweet maize crop. Agronomy 12, 2181. doi:10.3390/agronomy12092181
Daryanto, S., Wang, L., and Jacinthe, P. A. (2016). Global synthesis of drought effects on maize and wheat production. PLoS One 11 (5), e0156362. doi:10.1371/journal.pone.0156362
Dastane, N. G. (1972). A practical manual for water use research in agriculture. Pune: Navbharat Prakashan. 2nd edition. p. 72–75.
Delegido, J., Verrelst, J., Alonso, L., Moreno, J., and Camps-Valls, G. (2023). Remote sensing of vegetation water content: a review of methods and applications. Remote Sens. Environ. 280, 113234. doi:10.1016/j.rse.2022.113234
Erenstein, O., Jaleta, M., Sonder, K., Mottaleb, K., and Prasanna, B. M. (2022). Global maize production, consumption and trade: trends and R&D implications. Food Secur. 14, 1295–1319. doi:10.1007/s12571-022-01288-7
Fahad, S., Bajwa, A. A., Nazir, U., Anjum, S. A., Farooq, A., Zohaib, A., et al. (2017). Crop production under drought and heat stress: plant responses and management options. Front. Plant Sci. 8, 1147. doi:10.3389/fpls.2017.01147
Fang, Y., Wang, L., Xin, Z., Zhao, L., An, X., Hu, Q., et al. (2020). High resolution melting and insertion site-based polymorphism markers for wheat variability analysis and candidate genes selection at drought and heat MQTL loci. Agronomy 10, 1294. doi:10.3390/agronomy10091294
Farooq, M., Hussain, M., Wahid, A., and Siddique, K. H. M. (2017). Physiological and agronomic approaches for improving water-use efficiency in crop plants. Agric. Water Manag. 178, 136–145. doi:10.1016/j.agwat.2016.08.019
Fereres, E., and Soriano, M. A. (2007). Deficit irrigation for reducing agricultural water use. J. Exp. Bot. 58 (2), 147–159. doi:10.1093/jxb/erl165
Food and Agriculture Organization of the United Nations (FAO) (2024). World food and agriculture – statistical yearbook 2024. Rome, Italy: Food and Agriculture Organization of the United Nations. doi:10.4060/cd2971en
Gao, B.-C. (1996). NDWI—a normalized difference water index for remote sensing of vegetation liquid water from space. Remote Sens. Environ. 58, 257–266. doi:10.1016/S0034-4257(96)00067-3
González-Dugo, V., Zarco-Tejada, P. J., and Fereres, E. (2014). Applicability and limitations of using the crop water stress index as an indicator of water deficits in citrus orchards. Agric. For. Meteorology 198–199, 94–104. doi:10.1016/j.agrformet.2014.08.003
Haboudane, D., Miller, J. R., Tremblay, N., Zarco-Tejada, P. J., and Dextraze, L. (2002). Integrated narrow-band vegetation indices for prediction of crop chlorophyll content: modeling and validation. Remote Sens. Environ. 81, 416–426. doi:10.1016/S0034-4257(02)00018-4
Haboudane, D., Miller, J. R., Pattey, E., Zarco-Tejada, P. J., and Strachan, I. B. (2004). Hyperspectral vegetation indices and novel algorithms for predicting green LAI of crop canopies: modeling and validation. Remote Sens. Environ. 90, 337–352. doi:10.1016/j.rse.2003.12.013
Hatfield, J. L., and Dold, C. (2019). Water-use efficiency: advances and challenges in a changing climate. Front. Plant Sci. 10, 103. doi:10.3389/fpls.2019.00103
Hatfield, J. L., and Prueger, J. H. (2010). Value of using canopy temperature to quantify water stress. Crop Sci. 50 (6), 2204–2210. doi:10.2135/cropsci2010.03.0163
Huete, A. R. (1988). A soil-adjusted vegetation index (SAVI). Remote Sens. Environ. 25, 295–309. doi:10.1016/0034-4257(88)90106-X
Hussain, H. A., Men, S., Hussain, S., Chen, Y., Ali, S., Zhang, S., et al. (2019). Comparative evaluation of the nutritive, mineral, and antinutritive composition of Musa sinensis L. (banana) and Musa paradisiaca L. (plantain) fruit compartments. Plants 8 (12), 598. doi:10.3390/plants8120598
Idso, S. B., Jackson, R. D., Pinter, P. J., Reginato, R. J., and Hatfield, J. L. (1981). Normalizing the stress-degree-day parameter for environmental variability. Agric. Meteorol. 24, 45–55. doi:10.1016/0002-1571(81)90032-7
IPCC (2021). Climate change 2021: the physical science basis. Contribution of working group I to the sixth assessment report of the intergovernmental panel on climate change. Cambridge: Cambridge University Press. doi:10.1017/9781009157896
Irmak, S., Odhiambo, L. O., and Djaman, K. (2019). Impact of limited irrigation on maize yield and water productivity during critical growth stages. In: Extension paper no. 1409. Lincoln, NE: University of Nebraska–Lincoln.
Jing, L., Weng, B., Yan, D., Zhang, S., Bi, W., and Yan, S. (2023). The persistent impact of drought stress on the resilience of summer maize. Front. Plant Sci. 14, 1016993. doi:10.3389/fpls.2023.1016993
Kapari, M., Sibanda, M., Magidi, J., Mabhaudhi, T., Nhamo, L., and Mpandeli, S. (2024). Comparing machine learning algorithms for estimating the maize crop water stress index (CWSI) using UAV-acquired remotely sensed data in smallholder croplands. Drones 8 (2), 61. doi:10.3390/drones8020061
Kapari, M., Sibanda, M., Magidi, J., Nhamo, L., Mpandeli, S., and Mabhaudhi, T. (2025). “Remote sensing maize water stress in smallholder farms: a systematic review of progress, challenges, and the way forward using earth observation data,” in Enhancing water and food security through improved agricultural water productivity. Editors T. Mabhaudhi, V.G.P. Chimonyo, A. Senzanje, and P. P. Chivenge (Singapore: Springer). doi:10.1007/978-981-96-1848-4_4
Kharrou, M. H., Er-Raki, S., Chehbouni, A., Duchemin, B., Simonneaux, V., LePage, M., et al. (2011). Water use efficiency and yield of winter wheat under different irrigation regimes in semi-arid Morocco. Agric. Sci. 2 (3), 273–282. doi:10.4236/as.2011.23036
Klocke, N. L., Currie, R. S., and Tomsicek, D. J. (2019). Corn yield response to deficit irrigation during early vegetative and reproductive growth stages. Agron. J. 111 (3), 1142–1152. doi:10.2134/agronj2019.03.0214
Leng, G., and Hall, J. (2019). Crop yield sensitivity of global major agricultural countries to droughts and the projected changes in the future. Sci. Total Environ. 654, 811–821. doi:10.1016/j.scitotenv.2018.10.434
Lesk, C., Rowhani, P., and Ramankutty, N. (2016). Influence of extreme weather disasters on global crop production. Nature 529, 84–87. doi:10.1038/nature16467
Li, Y., Huang, S., Meng, Q., Li, Z., Fritschi, F. B., and Wang, P. (2024). Pre-silking water deficit in maize induced kernel loss through impaired silk growth and ovary carbohydrate dynamics. Plant Environ. Interact. 5, e10141. doi:10.1002/pei3.10141
Liang, S., He, T., Huang, J., Jia, A., Zhang, Y., Cao, Y., et al. (2024). Advancements in high-resolution land surface satellite products: a comprehensive review of inversion algorithms, products, and challenges. Sci. Remote Sens. 10, 100152. doi:10.1016/j.srs.2024.100152
Liu, Y., Yang, Y., Zhang, X., and Xu, X. (2022). Improving water markets in Spain: lesson-drawing from the murray-darling basin in Australia. Agric. Water Manag. 259, 107224. doi:10.1016/j.agwat.2021.107224
Liu, H., Zhang, C., Zhang, L., Zheng, Z., He, Q., and Baroni, C. (2023). NDVI analysis for monitoring land-cover evolution on selected deglaciated areas in the Gran Paradiso group (Italian Western alps). Remote Sens. 15, 3847. doi:10.3390/rs15153847
Lobell, D. B., Roberts, M. J., Schlenker, W., Braun, N., Little, B. B., Rejesus, R. M., et al. (2014). Greater sensitivity to drought accompanies maize yield increase in the U.S. midwest. Science 344 (6183), 516–519. doi:10.1126/science.1251423
Meena, M. D., Meena, A. L., Meena, H. R., and Kumar, R. (2023). Water-saving agronomic practices for enhancing water-use efficiency in maize. Agric. Water Manag. 278, 108111. doi:10.1016/j.agwat.2022.108111
Mndela, Y., Ndou, N., and Nyamugama, A. (2023). Irrigation scheduling for small-scale crops based on crop water content patterns derived from UAV multispectral imagery. Sustainability 15 (15), 12034. doi:10.3390/su151512034
Mugo, S., Beyene, Y., Crossa, J., Ochieng, J., and Prasanna, B. M. (2020). Progress in developing drought-tolerant maize for Sub-Saharan Africa. Crop Sci. 60 (2), 651–665. doi:10.1002/csc2.20031
Pandey, R. K., Maranville, J. W., and Admou, A. (2000). Deficit irrigation and nitrogen effects on maize in a Sahelian environment. Agric. Water Manag. 46 (1), 1–13. doi:10.1016/s0378-3774(00)00073-1
Prasanna, B. M., Cairns, J. E., Zaidi, P. H., Beyene, Y., Makumbi, D., Gowda, M., et al. (2021). Beat the stress: breeding for climate resilience in maize for the tropical rainfed environments. Theor. Appl. Genet. 134, 1729–1752. doi:10.1007/s00122-021-03773-7
Rani, A., Kumar, S., and Singh, R. (2022). Waterlogging stress in maize: physiological responses and tolerance mechanisms. Front. Plant Sci. 13, 905234. doi:10.3389/fpls.2022.905234
Reynolds, M., Langridge, P., and Izanloo, A. (2020). Climate change and crop improvement: key opportunities for genetic advancement. J. Exp. Bot. 71 (22), 6692–6700. doi:10.1093/jxb/eraa485
Rondeaux, G., Steven, M., and Baret, F. (1996). Optimization of soil-adjusted vegetation indices. Remote Sens. Environ. 55, 95–107. doi:10.1016/0034-4257(95)00186-7
Roujean, J.-L., and Bréon, F.-M. (1995). Estimating PAR absorbed by vegetation from bi-directional reflectance measurements. Remote Sens. Environ. 51, 375–384. doi:10.1016/0034-4257(94)00114-3
Rouse, J. W., Haas, R. H., Schell, J. A., and Deering, D. W. (1974). Monitoring vegetation systems in the great plains with ERTS. In: Proceedings of the Third Earth Resources Technology Satellite-1 Symposium. Washington, DC: NASA. 309–317.
Sadras, V. O., and Milroy, S. P. (1996). Soil-water thresholds for the responses of leaf expansion and gas exchange: a review. Field Crops Res. 47, 253–266. doi:10.1016/0378-4290(96)00014-7
Sharma, H., Sidhu, H., and Bhowmik, A. (2025). Remote sensing using unmanned aerial vehicles for water stress detection: a review focusing on specialty crops. Drones 9, 241. doi:10.3390/drones9040241
Song, L., Jin, J., and He, J. (2019). Effects of severe water stress on maize growth processes in the field. Sustainability 11 (18), 5086. doi:10.3390/su11185086
Song, J., Huang, J., Huang, H., Xiao, G., Li, X., Li, L., et al. (2024). Improving crop yield estimation by unified model parameters and state variable with Bayesian inference. Agric. For. Meteorology 355, 110101. doi:10.1016/j.agrformet.2024.110101
Széles, A., Horváth, É., Simon, K., Zagyi, P., and Huzsvai, L. (2023). Maize production under drought stress: nutrient supply, yield prediction. Plants 12 (18), 3301. doi:10.3390/plants12183301
Tardieu, F. (2012). Any trait or trait-related allele can confer drought tolerance: just design the right drought scenario. J. Exp. Bot. 63 (1), 25–31. doi:10.1093/jxb/err269
Teodoro, P. E., Teodoro, L. P. R., Baio, F. H. R., Nascimento, M., Cargnelutti Filho, A., Ribeiro, L. P., et al. (2024). High-throughput phenotyping in maize and soybean genotypes using vegetation indices and computational intelligence. Plant Methods 20, 164. doi:10.1186/s13007-024-01294-0
Veihmeyer, F. J., and Hendrickson, A. H. (1949). Methods of measuring field capacity and permanent wilting percentage of soils. Soil Sci. 68 (1), 75–94. doi:10.1097/00010694-194907000-00007
Wang, Z., Ding, J., Zhang, J., Li, Y., Liu, X., Chen, H., et al. (2024). UAV hyperspectral analysis of secondary salinization in drip-irrigated cotton fields under mulch: feature selection, spectral transformation and machine learning modeling. Front. Plant Sci. 15, 1358965. doi:10.3389/fpls.2024.1358965
Xiao, G., Huang, J., Zhuo, W., Huang, H., Song, J., Du, K., et al. (2025). Progress and perspectives of crop yield forecasting with remote sensing: a review. IEEE Geoscience Remote Sens. Mag., 2–32. doi:10.1109/MGRS.2025.3571906
Xu, D., Li, X., Wu, J., Wang, Z., Zhao, Q., Li, Y., et al. (2022). Influence of topographic shading on the mass balance of the high Mountain Asia glaciers. Remote Sens. 14, 1576. doi:10.3390/rs14071576
Yan, L., Li, X., Xu, J., and Zhang, Y. (2022). Dynamic relationship of urban and rural water shortage risks based on the economy–society–environment perspective. Agriculture 12, 148. doi:10.3390/agriculture12020148
Yang, N., Zhang, Z., Yang, X., Dong, N., Xu, Q., Chen, J., et al. (2025). Evaluation of crop water status using UAV-based images data with a model updating strategy. Agric. Water Manag. 312, 109445. doi:10.1016/j.agwat.2025.109445
Yetik, O., and Candoğan, B. N. (2023). Chlorophyll response to water stress and the potential of using crop water stress index in sugar beet farming. Sugar Tech 25, 57–68. doi:10.1007/s12355-022-01184-6
Zarco-Tejada, P. J., Miller, J. R., Noland, T. L., Mohammed, G. H., and Sampson, P. H. (2003). Scaling-up and model inversion methods with narrowband optical indices for chlorophyll content estimation in closed forest canopies. Remote Sens. Environ. 84 (4), 562–575. doi:10.1016/S0034-4257(02)00128-4
Zhang, L., Zhang, H., Niu, Y., and Han, W. (2019). Mapping maize water stress based on UAV multispectral remote sensing. Remote Sens. 11 (6), 605. doi:10.3390/rs11060605
Zhang, Y., Zhang, D., Li, W., Wu, Y., Zhou, Y., and Zhao, J. (2022). Physiological responses of maize to drought stress and rewatering. Front. Plant Sci. 13, 859508. doi:10.3389/fpls.2022.859508
Zhao, D., Reddy, K. R., Kakani, V. G., and Reddy, V. R. (2005). Nitrogen deficiency effects on plant growth, leaf photosynthesis, and hyperspectral reflectance properties of sorghum. Eur. J. Agron. 22 (4), 391–403. doi:10.1016/j.eja.2004.06.005
Zheng, J., Fu, H., Li, W., Wu, W., Yu, L., Yuan, S., et al. (2021). Growing status observation for oil palm trees using Unmanned Aerial Vehicle (UAV) images. ISPRS J. Photogrammetry Remote Sens. 173, 95–121. doi:10.1016/j.isprsjprs.2021.01.008
Zheng, J., Yuan, S., Li, W., Fu, H., Yu, L., and Huang, J. (2024). A review of individual tree crown detection and delineation from optical remote sensing images: current progress and future. IEEE Geoscience Remote Sens. Mag. 13, 209–236. doi:10.1109/MGRS.2024.3479871
Zhou, J., Cheng, Q., Zheng, Y., and Yang, X. (2021). Evaluation of crop water stress index (CWSI) for maize under different irrigation regimes. Agric. Water Manag. 246, 106665. doi:10.1016/j.agwat.2020.106665
Zhu, P., and Burney, J. (2022). Untangling irrigation effects on maize water and heat stress alleviation using satellite data. Hydrology Earth Syst. Sci. 26 (2), 827–840. doi:10.5194/hess-26-827-2022
Zia, S., Du, W., Hassan, M. A., Liu, X., Zhu, M., Jia, H., et al. (2021). Evaluating the sensitivity of water-stressed maize chlorophyll and structure based on UAV-derived vegetation indices. Comput. Electron. Agric. 185, 106174. doi:10.1016/j.compag.2021.106174
Keywords: Normalized Difference Vegetation Index (NDVI), Renormalized Difference Vegetation Index (RDVI), Soil-Adjusted Vegetation Index (SAVI), Optimized Soil-Adjusted Vegetation Index (OSAVI), Transformed Chlorophyll Absorption in Reflectance Index (TCARI), Crop Water Stress Index (CWSI), Unmanned Aerial Vehicle (UAV), MicaSense RedEdge
Citation: Kiranmai Y, Potdar MP, Biradar DP, Kuligod VB, Kanade AK, Parmar B and Malunjkar V (2025) Moisture stress assessment in rabi maize through UAV-mounted multispectral sensor. Front. Environ. Sci. 13:1651422. doi: 10.3389/fenvs.2025.1651422
Received: 21 June 2025; Accepted: 22 September 2025;
Published: 10 October 2025.
Edited by:
Juergen Pilz, University of Klagenfurt, AustriaReviewed by:
Zhenguo Zhang, Xinjiang Agricultural University, ChinaJuepeng Zheng, Sun Yat-sen University, China
Firozeh Solimani, Politecnico di Bari, Italy
Copyright © 2025 Kiranmai, Potdar, Biradar, Kuligod, Kanade, Parmar and Malunjkar. This is an open-access article distributed under the terms of the Creative Commons Attribution License (CC BY). The use, distribution or reproduction in other forums is permitted, provided the original author(s) and the copyright owner(s) are credited and that the original publication in this journal is cited, in accordance with accepted academic practice. No use, distribution or reproduction is permitted which does not comply with these terms.
*Correspondence: Yalamareddy Kiranmai, eS5raXJhbm1haXJlZGR5Mjg1QGdtYWlsLmNvbQ==; M. P. Potdar, cG90ZGFybXBAdWFzZC5pbg==