 Adeline Umugwaneza1,2,3,4
 Xi Chen1,2,5,6,7*
 Tie Liu1,2,5,6,7Aboubakar Gasirabo3,4Jeanine Umuhoza1,2,3,4Edovia Dufatanye Umwali1,2,3,4Enan Muhire Nyesheja3,4Solange Uwamahoro1,2Albert Poponi Maniraho1,2,3,4
- 1State Key Laboratory of Desert and Oasis Ecology, Xinjiang Institute of Ecology and Geography, Chinese Academy of Sciences, Urumqi, China
- 2University of Chinese Academy of Sciences, Beijing, China
- 3University of Lay Adventists of Kigali (UNILAK), Kigali, Rwanda
- 4Joint Research Center for Natural Resources and Environment in East Africa, Kigali, Rwanda
- 5Key Laboratory of Ecological Safety and Sustainable Development in Arid Lands, Xinjiang Institute of Ecology and Geography, Chinese Academy of Sciences, Urumqi, China
- 6Zhejiang University of Technology, Hangzhou, Zhejiang, China
- 7Research Center for Ecology and Environment of Central Asia, Chinese Academy of Sciences, Beijing, China
East Africa (EA) is becoming more vulnerable to drought, a crisis amplified by climate change, which affects regional livelihoods and food security dependent on rain-fed agriculture. Drought dynamics are not completely understood by current drought assessment methods, as they often neglect to integrate meteorological, agricultural, and hydrological factors. This study addressed this gap by developing the Integrated Drought Index (IDI) using an entropy weighting method. The IDI combines five individual indices and incorporates standardized yield residuals series (SYRS) to capture the multifaceted drought-related impacts on cropland in East Africa from 2001 to 2020. The outcomes revealed overall interannual variations in drought conditions in the study area, with 2005 being particularly severe, affecting 87.3% of the total area. 16.8% and 29.2% experienced extreme and severe drought, respectively. Furthermore, comparisons with standardized drought indices and EM-DAT drought ratios validated the performance of the IDI, demonstrating its high effectiveness in capturing various aspects of drought compared to single-factor indices. SYRS analysis for wheat, dry beans, and maize showed significant yield losses in years of severe drought. With notable yield losses in 2005 and 2008, when drought conditions affected about 87% and 60% of the total area, respectively, maize indicated the highest susceptibility to water stress. These findings highlight the urgent need for adaptive strategies, including drought-tolerant crop varieties, improved water management, and enhanced early warning systems. These are essential to strengthen the resilience of EA to drought, ensuring food security and sustainable livelihoods amidst an increasingly variable climate.
1 Introduction
Drought is an increasingly concerning environmental challenge with widespread consequences, both globally and regionally. In recent decades, drought events have become more severe and repeated globally, having a significant impact on agriculture, water supplies, ecosystems, and communities (Carrão et al., 2016; UNISDR, 2018). This is closely linked to the changing climate patterns and anthropogenic factors, such as deforestation and water overuse, which influence climate drought through altered precipitation patterns, low water content in the soil, triggering an agricultural drought, and hydrological drought through decreased water availability in rivers and reservoirs. These extended periods of below-average precipitation and high temperatures disrupt hydrological cycles, lead to water scarcity, and threaten food production, particularly in regions heavily reliant on rain-fed agriculture (West et al., 2019; Kew et al., 2021).
The diverse climate of Africa and its dependence on agriculture fed by rain as a means of economic growth makes the continent vulnerable to droughts. The consequences of persistent droughts have severely affected the lives of many people across the continent (Atwoli et al., 2022; Khan and Gomes, 2022). In East Africa (EA), drought poses an enduring challenge and threatens the accomplishment of the sustainable development goals—SDGs, notably SDG-15, SDG-2, and SDG-1—life on land, zero hunger, and no poverty, respectively. The recurring droughts lead to diminished agricultural productivity, water shortages, livestock losses, and food deficits, exacerbating poverty and threatening the livelihoods of numerous small-scale farmers who depend on rain-fed farming (Haile et al., 2019; Ayugi et al., 2022). Amidst these challenges faced by the region, there is a gap in a holistic and unified strategy for dealing with and adjusting to drought. This kind of approach is crucial to guarantee food security and enhance the capacity to withstand adversity in the EA region.
Drought evaluation has been categorized into meteorological, hydrological, and agricultural domains in earlier studies. While assessing several drought-related factors, these categories offer an extensive understanding of its implications (Hayes et al., 2011; Saha et al., 2023). Several drought indices, including the reconnaissance drought index—RDI, standardized precipitation evapotranspiration index—SPEI, and standardized precipitation index—SPI have been used to characterize drought events and their severity (McKee et al., 1993; Vicente-Serrano et al., 2010). While these indices have been invaluable tools for assessing drought, they are not without their shortcomings. These meteorological indices primarily consider meteorological aspects, failing to capture the full hydrological and agricultural dimensions of drought. Indices of hydrological drought, such as the streamflow drought index—SDI, surface water supply index—SWSI, standardized runoff-discharge index—SRI, evaluate water availability (Shafer and Dezman, 1982; Shukla and Wood, 2008; Nalbantis and Tsakiris, 2009). Indices of agricultural drought, like the soil moisture deficit index—SMDI, vegetation health index—VHI, or crop moisture index—CMI, measure the impact of drought on crops (Palmer, 1968; Kogan, 1995; Narasimhan and Srinivasan, 2005). However, these approaches neglect the interconnectedness of meteorological, hydrological, and agricultural conditions that collectively affect crop production and food security.
While these individual dimensions offer important insights into specific aspects of drought, they often fall short of providing a comprehensive understanding of the overall drought scenario (Dikici, 2020). Several studies have highlighted the significance of such integrated approaches in drought assessment (Sepulcre-Canto et al., 2012; Balint et al., 2013; Vyas et al., 2015). Studies like Balint et al. (2013) and Shilenje et al. (2019) have proposed a combined index of drought in the region but failed to consider hydrological drought indices. Other previous studies have also shown similar gaps. For instance, Gidey et al. (2018) focused on meteorological and agricultural droughts in Ethiopia but did not include hydrological aspects. Likewise, Masih et al. (2014) examined drought patterns in sub-Saharan Africa but primarily emphasized meteorological drought without integrating agricultural and hydrological dimensions. Globally, studies like Hao and Singh (2015) and Beguería et al. (2010) have developed multi-scalar drought indices but often overlooked the comprehensive integration of all three types of drought. These gaps in existing research highlight the need for a more inclusive approach to drought assessment.
Drought management for extensive areas requires an integrated index that can reflect all possible driving factors. In EA, assessing the impact of drought on cropland using a specific index that integrates, hydrological, meteorological and agricultural drought remains largely unexplored. The absence of such an index limits the comprehension of the full extent and impact of drought events, especially in regions like EA where these factors are interconnected. This study bridges existing gaps by proposing an Integrated Drought Index (IDI) that combines three drought categories to provide a comprehensive assessment, improving evaluation and monitoring. Specifically, the study built an IDI and assessed its impact on crop yield in the region, offering actionable insights to strengthen drought resilience and food security in EA. Hence, an IDI approach serves as a reliable tool for early warning systems and resource allocation.
2 Materials and methods
2.1 Description of the study area
In this study, East Africa (EA) comprising 14 countries including Zimbabwe, Zambia, Uganda, Sudan South, Tanzania, Somalia, Rwanda, Mozambique, Malawi, Eritrea, Kenya, Ethiopia, Djibouti and Burundi, is situated between latitudes 10°N and 20°S and longitudes 20°E and 50°E, covering an area of 7,374,936 km2 (Figure 1). A diverse range of elevations, characterizes the region with the highest point being Mount Kilimanjaro in Tanzania, reaching approximately 5,885 m above sea level. Conversely, it features some of the lowest elevations on the continent, such as the Danakil Depression in Ethiopia, an arid desert basin approximately 125 m below sea level, known for its extreme heat and harsh environmental conditions (Camberlin, 2018).
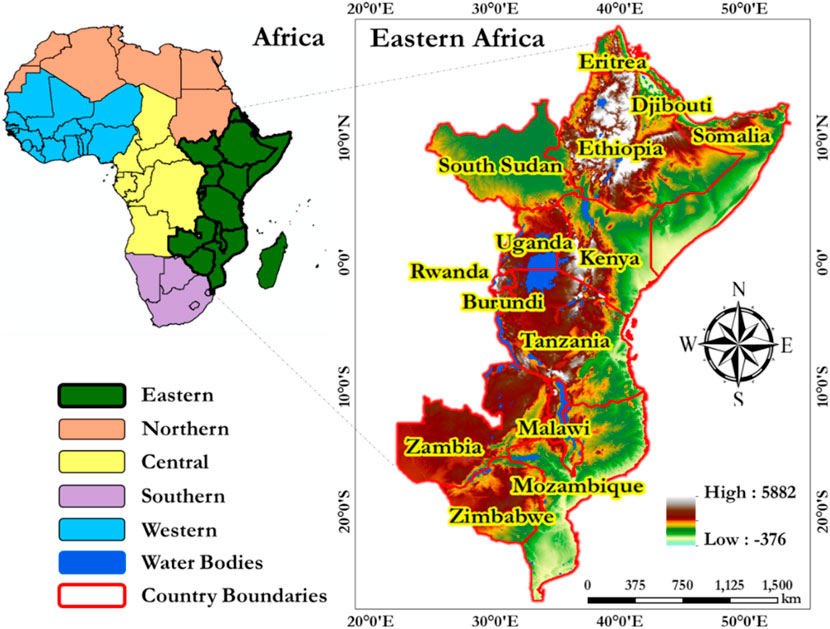
Figure 1. Location of East Africa region.
Situated along the equator, EA exhibits a varied climate with average annual temperatures typically around 15 °C, descending below freezing at higher altitudes. Lowland areas are characterized by significantly higher temperatures, with average annual temperatures often exceeding 30 °C and peak temperatures surpassing 40 °C. Rainfall distribution is also variable, with regions like the Lake Victoria basin, mountainous areas, and coastal islands receiving over 1,498.6 mm of annual rainfall, while other parts of the region typically receive an average of 762 mm. Generally, EA has two major rainy seasons: October to December—OND and March to May—MAM (Nicholson, 2017; Ongoma and Chen, 2017). The OND season results from the tropical rain belt moving south and is affected by atmospheric events like ENSO (Ogwang et al., 2016; Roy and Troccoli, 2024). The MAM season, which contributes significantly to the season of agriculture in EA, concurs with the shift of the tropical rain belt towards the Northern Hemisphere (Adhikari et al., 2015; Rigden et al., 2020).
In EA, smallholders provide up to 90% of the production in agriculture, making agriculture an important sector to national economies (Salami et al., 2010; Wiggins and Keats, 2013). Cropland covers about 21.7% of the total area. This study considered three major crops in the region: maize (corn), dry beans, and wheat. Agricultural practices and land management influence soil moisture, with irrigated areas generally maintaining higher levels. Overall, EA’s soil moisture is highly influenced by seasonal rainfall, topographical variations, and land use practices. Hydrological conditions in EA are marked by vulnerability to both seasonal variability and long-term changes, affecting water availability and exacerbating drought conditions. Artificial drainage systems, including canals and ditches, are used to manage water runoff, but their effectiveness varies (UNEP, 2006).
2.2 Datasets
The study utilized a comprehensive array of remote sensing and climate datasets to investigate various environmental parameters over a two-decade period from 2001 to 2020 (Table 1). The primary data sources are NASA’s moderate resolution imaging spectroradiometer—MODIS products, which provide critical vegetation indices, near-infrared (Umugwaneza et al., 2022) and mid-infrared (MIR) data at 1 km monthly resolution (MOD13A3), evapotranspiration estimates (AET) at 0.5 km 8-day intervals (MOD16A2), and land surface temperature at 1 km 8-day intervals (MOD11A2). Precipitation data is sourced from the climate hazards group infrared precipitation with station data—CHIRPS at 0.05° monthly resolution (https://www.chc.ucsb.edu/data/chirps). Using gridded data, the standardized precipitation evapotranspiration index—SPEI offers drought assessment at 0.5° monthly resolution (https://spei.csic.es/database.html). TerraClimate contributes the palmer drought severity index—PDSI and runoff data at 0.04° monthly resolution (https://climate.northwestknowledge.net/TERRACLIMATE/). Soil moisture data were obtained from the ESA CCI (European Space Agency’s Climate Change Initiative) at 0.25° monthly resolution. The spatial resolution was set at 1 × 1 km, owing the varying spatial resolutions of the gathered data. Lastly, the Food and Agriculture Organization’s Statistical Database—FAOSTAT provide annual crop yield and harvest area data (https://www.fao.org/faostat/en/#data/QCL).
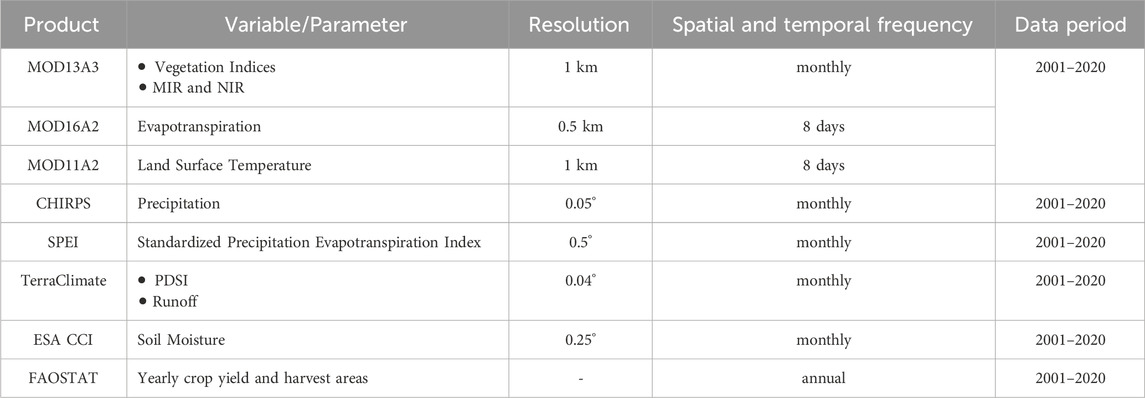
Table 1. Datasets.
2.3 Methods
2.3.1 Outline of the steps of the research
This study developed an Integrated Drought Index (IDI) to assess drought impacts on crop yields in East Africa through four key stages. First, multiple drought indices (meteorological, agricultural, and hydrological) were analyzed and classified into drought severity (Tables 2, 3), then integrated into the IDI using entropy weighting, with spatial processing and analysis conducted in ArcGIS Pro. Five indices contributed to IDI formulation, while four standardized indices and historical EM-DAT records validated the results. Second, IDI dynamics were evaluated over 20 years using linear regression slope analysis. Third, crop yield data were standardized (SYRS) to isolate climate-driven variability. Finally, Pearson correlation analysis quantified relationships between yield anomalies and drought severity.
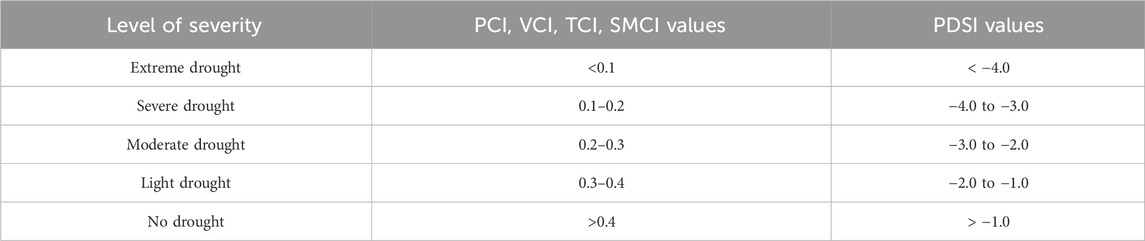
Table 2. Range of the single drought indices (Alley, 1985; Kogan, 1995; Zhang and Jia, 2013).
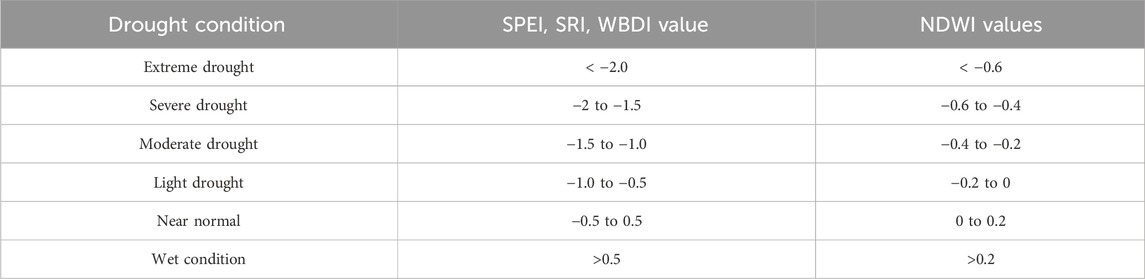
Table 3. Drought condition categories based on SPEI, SRI and WBDI (Shukla and Wood, 2008; Sur et al., 2020).
2.3.2 Meteorological drought
a) PCI—Precipitation Condition index
According to Du et al. (2013), PCI offers details regarding the meteorological drought. Therefore, PCI was calculated to account precipitation deficiency using CHIRPS precipitation data (Equation 1).
Where PR (precipitation), PRmn, and PRmx stand for minimum and maximum values of precipitation, respectively.
b) SPEI—Standardized Precipitation Evapotranspiration Index
By quantifying temperature, potential evapotranspiration, and precipitation, the SPEI index is used to indicate the level of the drought. SPEI has been widely employed for investigating vegetation reactions to drought, offering credible information for drought study (Byakatonda et al., 2018). Global drought monitoring can benefit from the long-term, reliable data provided by SPEI base v2.8 of the global SPEI database. The potential evapotranspiration estimated by FAO-56 Penman-Monteith is more accurate than the projected results of the Thornthwaite PET estimation (Vicente-Serrano et al., 2013).
c) PDSI—Palmer Drought Severity Index
The PDSI is a widely used metric to estimate the duration of drought condition, reflecting the balance among moisture supply and demand. To analyze drought conditions, this study utilized the PDSI values derived from the Terra Climate dataset, which provides high-resolution, monthly climate data. The Terra Climate dataset integrates global weather station observations, topographic data, and satellite-derived information to deliver consistent and comprehensive climate variables (Abatzoglou et al., 2018).
This study employed the SPEI data at different period scales (12- and 3-month), and PDSI from 2001 to 2020 to evaluate IDI performance.
2.3.3 Agricultural drought
a. VCI—Vegetation condition index
For monitoring agricultural drought, like assessing changes in vegetation within time and space as well as the beginning and severity of drought, the VCI is a reliable index (Kogan, 1995; 2001). Considering the concept that plants receive insufficient water during droughts, Kogan (1995) developed the VCI, which was standardized using the normalized difference vegetation index—NDVI, the maximum and minimum values Equation 2. While monthly or seasonal VCI analysis would provide more granular drought monitoring, all analyses in this study were conducted on an annual basis to align with the temporal resolution of available crop yield data. Despite this limitation, the VCI remains valuable as it effectively distinguishes meteorologically-induced vegetation stress from other factors, providing crucial insights into drought impacts on agriculture at the annual scale (Kogan, 1995; Quiring and Ganesh, 2010; Dikici, 2022).
Where NDVImn and NDVImx represent the NDVI, minimum and maximum values.
b. TCI—Temperature Condition Index
Developed by Kogan (1995), TCI is a critical component while agricultural drought is being assessed, providing a comprehensive evaluation of temperature stress on vegetation. The TCI quantifies the deviation of current temperature conditions from long-term average temperatures, highlighting periods of extreme temperature that can adversely affect crop health and yield. The TCI is a standard LST (land surface temperature) that uses minimum and maximum LST values Equation 3:
c. SMCI—Soil Moisture Condition Index
The SMCI is an essential metric used to assess agricultural drought by quantifying soil moisture levels. This methodology outlines the processes and techniques used to calculate the SMCI, providing an inclusive understanding of soil moisture changes and their impacts for crop health. By standardizing these measurements, the SMCI offers a reliable and consistent indicator of soil moisture conditions, enabling accurate monitoring and early warning of agricultural droughts. This calculation (Equation 4) follows the method used by Kogan et al. (2003).
Where SM, SMmn and SMmx represent soil moisture, minimum and maximum values, respectively.
2.3.4 Hydrological drought
a) SRI—Standardized Runoff Index
Shukla and Wood (2008) developed the SRI to evaluate hydrological drought taking into account stream flow data. It implicates adapting an appropriate distribution to stream data of a specific location. The obtained standardized Gaussian distribution with mean zero and unit variance is then converted to obtain the SRI by estimating the PDF (probability density function) and GDF (gamma distribution function). In this study, the GDF is deployed to analysis SRI, the GDF is defined as follow:
Where Γ is an ordinary GDF, α and β are the shape and scale factors respectively. The cdf (cumulative distribution function) of GDF can be evaluated by:
Where f(x) is the fitted distribution’s probability density function, and is the observed runoff data.
Where
b) WBDI—Water Budget-Based Drought Index
Sur et al. (2020) recommended the WBDI, which was developed by employing the water balance perspective and input parameters including evapotranspiration and precipitation. The primary driver for the water balance evaporation is temperature changes, which influence the condition of water (Oki and Kanae, 2006; Kim et al., 2021). To validate the IDI in this study, the WBDI was therefore used as a reference index. According to the water budget equation below, the WBDI is expressed as the variation between evaporation and precipitation as surface runoff and sub-surface runoff (Equation 8):
Where R is the potential runoff (mm), dS is soil moisture change (mm), AE is actual evaporation (mm), PR is the precipitation (mm) and z denotes the standardization. As runoff potential in the region, this result is expressed with the following index (Equation 9):
By defining a hydrological drought through projected runoff, the WBDI, derived using the water balance method, employs a short-term predictive approach, compared to monitoring the drought conditions and current precipitation through evaporation.
c) NDWI—Normalized Difference Water Index
The NDWI is a remote sensing index commonly used to assess water content in vegetation and soil. While NDWI is not typically used directly for drought evaluation, integrating NDWI into drought evaluation can be a valuable component of a broader analysis and improve the understanding of drought dynamics (Jiang et al., 2013). Therefore, for IDI validation purpose, the NDWI was used as a reference index. The green and near-infrared bands are subtracted, and the resulting value is divided by the sum of the two bands to determine the NDWI (Ji et al., 2009). The NDWI estimation approach is expressed in Equation 10.
2.3.5 SYRS—Standardized yield residual series
For the study area, the agricultural data for the period 2001–2020 consist of two categories of information: production (hg/ha) and area. The effectiveness of combined indices is often assessed considering crop yield. Using agricultural data on dry beans, wheat, and maize in the EA, this study assessed the relationship between IDI and crop yield. The agriculture sector has experienced an increase in crop production due to technological improvements such as cropping, management strategies, irrigation infrastructure, mechanization, high crop yield varieties, and cropping. Standardized yield residual series (SYRS) is a powerful tool for isolating the effects of drought on crop yields by removing long-term trends associated with agricultural improvements. Therefore, data of crop yields cannot be therefore used to determine a direct relationship between drought and yield. Consequently, yield data were de-trended using the linear regression approach in order to eliminate the linear/technological trend prior to the drought analysis (Potopova et al., 2016; Hussain et al., 2018). This approach is especially valuable in data-scarce environments, where traditional yield assessments may fail to capture the true extent of drought-induced losses. Overall, SYRS enhance the accuracy of drought impact assessments, supporting evidence-based interventions to strengthen agricultural resilience in drought-prone regions. The SYRS was computed using the formula below (Equation 11):
Where cyi is the residual of the de-trended crop yield, σ corresponds to the standard deviation, and μ indicates the average of residuals of the yield after de-trending. The yield categories based on the SYRS values are given in (Table 4).
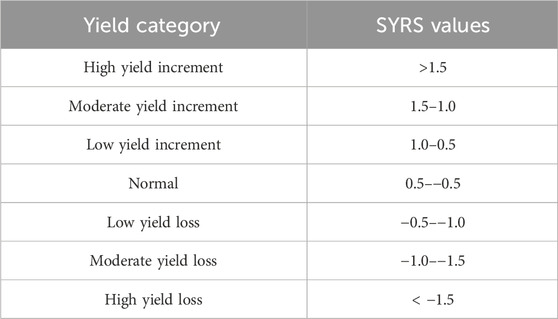
Table 4. The categories for crop yield based on the SYRS value.
2.3.6 Developing the integrated drought index (IDI)
This study combined the five drought indices from 2001 to 2020. These indices represent the agricultural drought (TCI, SMCI, and VCI), the meteorological drought (PCI), and the hydrological drought (SRI). Entropy weight method was employed as a method to develop the integrated drought index. To ensure consistency within the drought category, all drought index values were normalized to a scale of 0–1. In information theory, entropy is commonly employed to quantify the disorganized degree of information (Topcu, 2022). The entropy weight is employed to account for variations in the index across several schemes. The variation between the indices in different scenarios is greater and the information presented for the ultimate decision is more valuable when the entropy weight is higher. Conversely, there is less of a variance in the index within schemes. To provide accurate relative weights based on the variability of each individual, the entropy weight was established (Waseem et al., 2015). Entropy is a method for weighting indices. After standardizing the matrix generated from the indices, each index’s entropy is determined using the equation below Equation 12.
Wherein:
Where,
The determined value 'w' is a degree of the useful data of each indicator; the higher the value, the more valuable the information acquired from that index. The IDI was proposed using the entropy weighting method, and its equation is as follows (Equation 15):
Where
2.3.7 Linear regression analysis
In this study, IDI dynamics were examined using the slope analysis approach (Jiang et al., 2017). If the slope is greater than zero, the trend that is changing increases; if the slope is less than zero, the trend decreases; and a slope of zero indicates no change trend. The following Equation 16 was employed.
Where
2.3.8 Evaluate the impact of drought on crop yield
The impact of drought on crop yields was assessed by evaluating the correlation between IDI and SYRS. A quantitative technique that indicates the degree of relationship among variables is known as a correlation analysis (Mitchell and Miller, 2008). The Pearson correlation coefficient is often employed in geographic studies to assess the accuracy and correlations between different indices. The Pearson’s correlation was computed using the RStudio software to investigate the IDI association with other indices for validation as well to assess the impact of drought to crop yield. The formula is as follows Equation 17:
Where n is the total number of sample sequences.
2.3.9 Validation of the integrated drought index (IDI)
Since there are no accurate ground-truth observations of the severity and extent of droughts, validating drought indices is a constant challenge. In this study, standardized drought indices for different drought types were validated against the IDI using Pearson correlation analysis (described in Section 2.3.6), which quantified their statistical relationships across the study region. Moreover, the EM-DAT drought periods (Table 5) were taken as a reference as well as previous scientific reports on drought assessment in the region. The EM-DAT (https://public.emdat.be/data) database is gathered from several sources, including press agencies, insurance companies, on-governmental organizations, UN agencies, and research institutes (Bayissa, 2018).
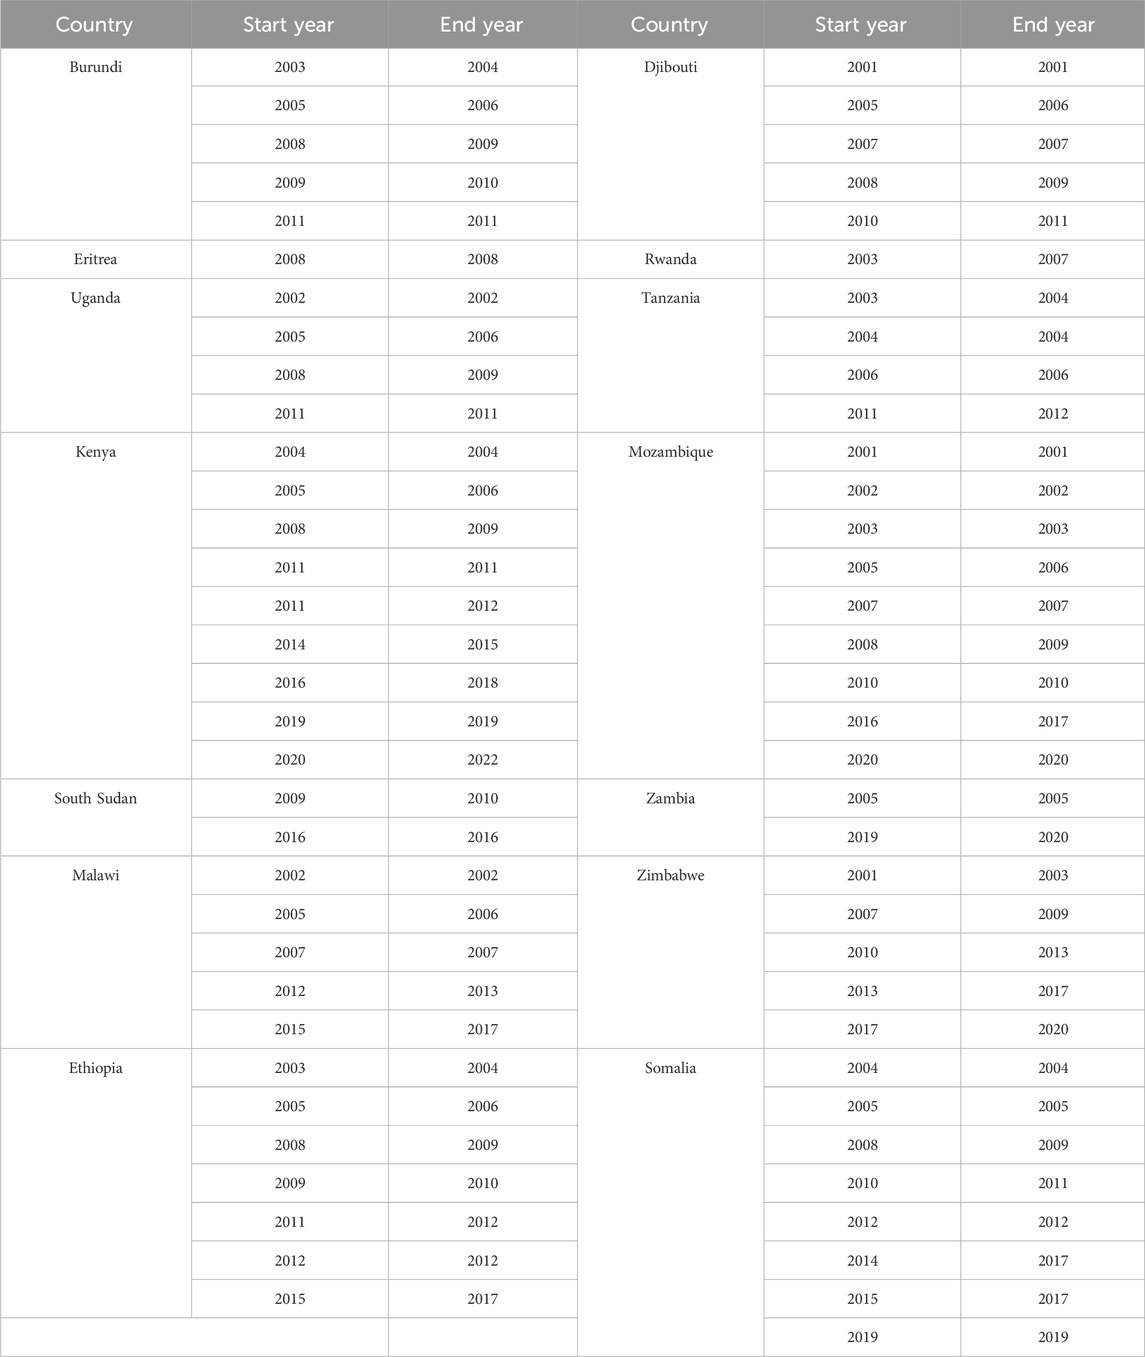
Table 5. Drought events recorded in the emergency events database (2001–2020).
3 Results
3.1 Spatial patterns of drought severity across East Africa (2001–2020)
The analysis of the integrated drought index (IDI) from 2001 to 2020 in East Africa (EA) provides a detailed understanding of drought conditions over this period (Figure 2), with pronounced variability across the region. To quantify the spatial extent of drought, the percentage of affected area was calculated by dividing the number of pixels classified under drought intensity level by the total valid pixels in the study area and multiplying by 100. With 87.3% of the study area-experiencing drought condition, 2005 stands out as an exceptionally severe year. The distribution of drought intensity was as follows: 16.8% of the region experienced extreme drought, 29.2% severe drought, 25.5% moderate drought, and 15.7% light drought. Only 12.7% of the area was classified as having no drought, highlighting the widespread impact of drought conditions during this year.
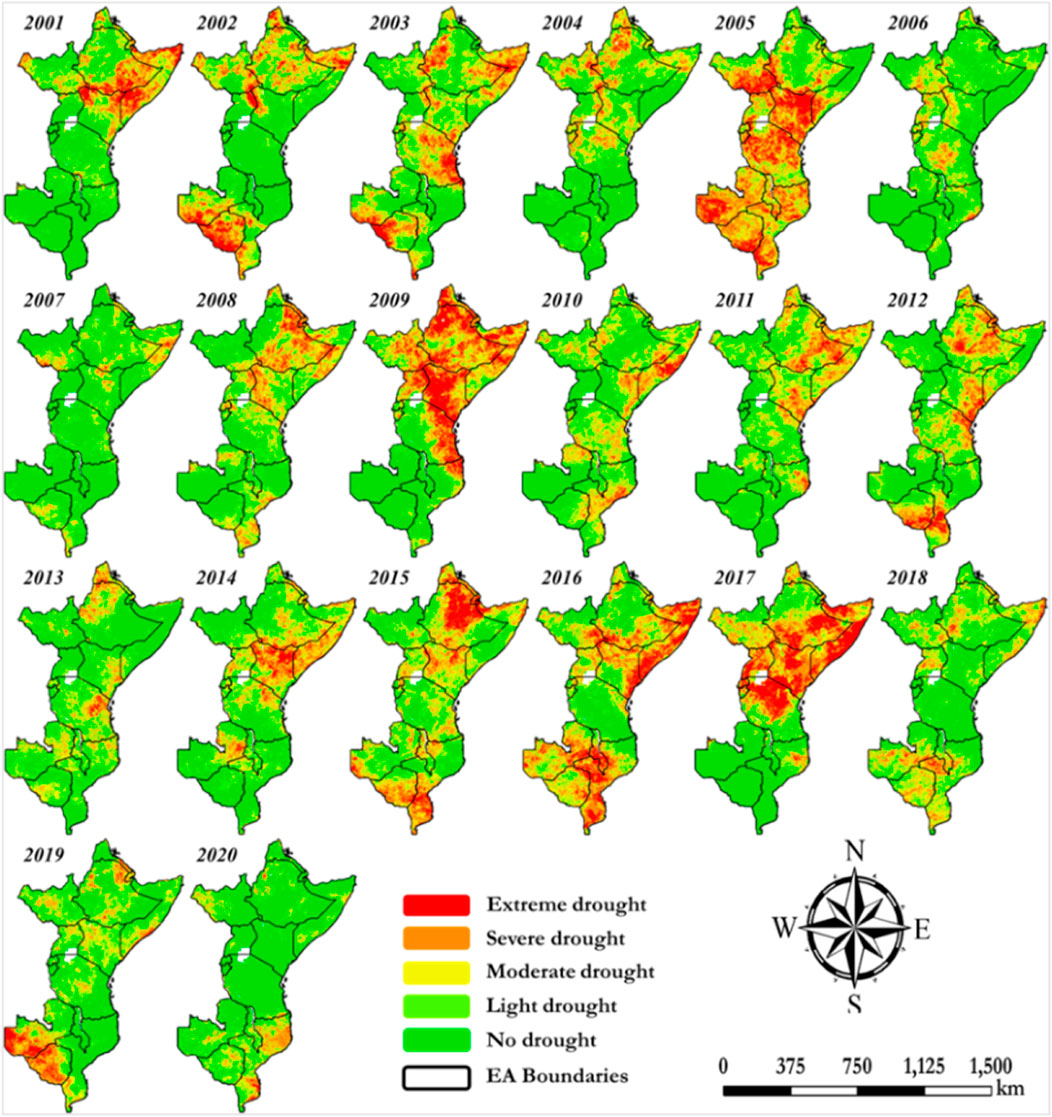
Figure 2. The spatial distribution of the IDI from 2001 to 2020.
Other notable drought years include 2009, 2016 and 2017 were observed to experience drought condition compared to the other study periods. In contrast, 2020 exhibited less overall drought, except for the southern region, where Mozambique experienced extreme to moderate drought conditions. The 2019, IDI results show a mixed scenario, with the central region of EA experiencing moderate drought while the southwestern region faced extreme drought conditions. This spatial differentiation underscores the heterogeneous nature of drought impacts within the region. In 2014 was another critical year, particularly for Kenya, which suffered from extreme drought conditions. Neighboring countries during the same year experienced severe to moderate drought. Conversely, 2007 was a relatively favorable year, with about 66.6% of the total area not experiencing drought conditions. This implies that nearly half of the area had adequate moisture levels, contrasting sharply with the more severe drought years.
3.2 Evaluating IDI performance
To evaluate how the IDI performs in monitoring drought events in the study area, standardized drought indices were compared to the IDI, namely, the SPEI, PDSI, and WBDI indices, using Pearson correlation. By using a combination of SPEI, PDSI, and WBDI, the evaluation covers different dimensions of drought (meteorological, agricultural, and hydrological). This multi-dimensional approach ensures that the IDI is robust and effective across various drought impacts and conditions. The highest correlation was observed between IDI and NDWI as well as IDI and PDSI, covering the major area (Figure 3). The correlation values between IDI and the above-mentioned indices intense between 0.6 and 1. A high correlation between the IDI and NDWI suggests that the IDI effectively captures the influence of drought on surface water bodies. Since NDWI is directly related to water content in vegetation and soil, a strong correlation would validate that the IDI accurately reflects water stress conditions (Amalo et al., 2018; Shashikant et al., 2021). Moreover, the SPEI was used at three different time scale, namely, 12- and 3-month. A high correlation was observed between IDI and SPEI-3 (Figure 3a). The northeastern part of South Sudan, Tanzania and the southwestern part of the study area, the correlation value ranged between 0.3 and 1. Furthermore, the variety of areas exhibiting strong consistency and significant correlation declined with increasing time scale. The coefficients of correlation between IDI and 12-month index predominantly fell within the range of 0–0.3. The strong positive correlation between IDI and WBDI was noticed in the north part of the study area, some parts in Somalia, Kenya, and in the southern part of Mozambique. The correlation between WBDI and IDI allows for an assessment of the IDI’s performance, which incorporates numerous parts of the hydrological cycle, ensuring a comprehensive methodology for drought monitoring (Sur et al., 2020; Kim et al., 2021).
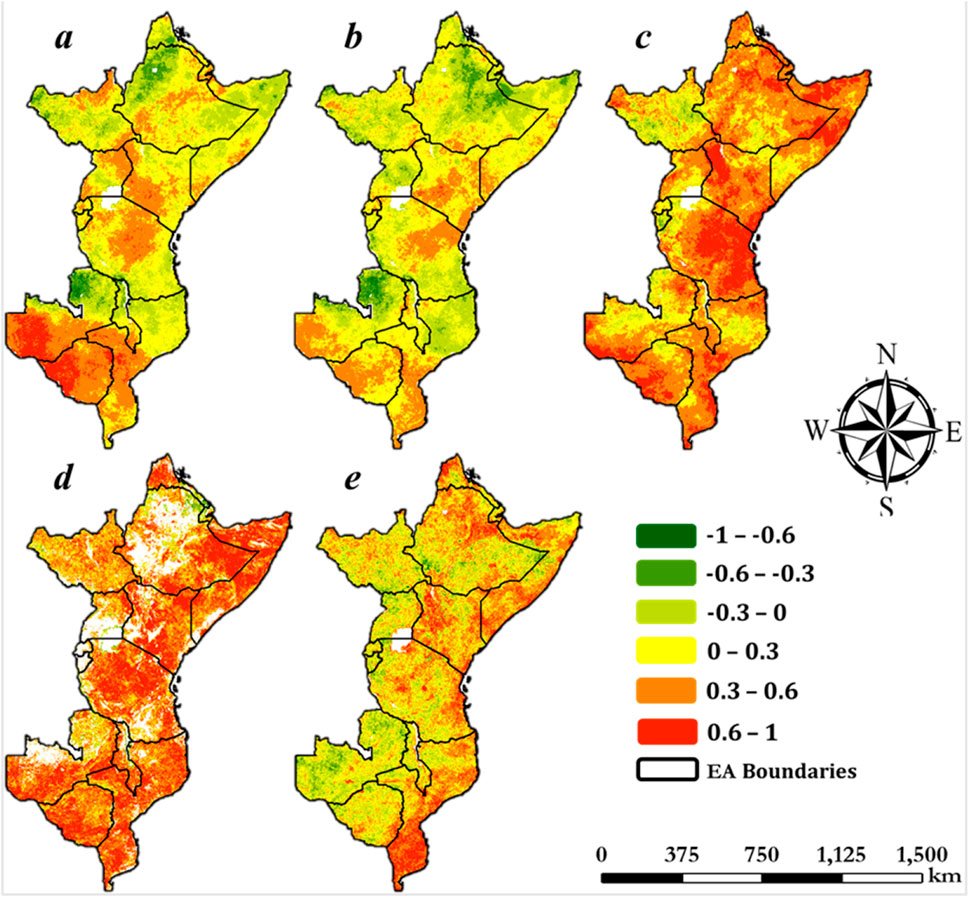
Figure 3. IDI correlation maps with: (a) SPEI-3, (b) SPEI-12, (c) PDSI, (d) NDWI, and (e) WBDI.
Furthermore, the EM-DAT drought events are used as a reference for evaluating the IDI, considering their reporting of prolonged drought events. According to the EM-DAT report (Table 5), 10 out of 14 countries in the study area were impacted by drought events in 2005, validating the performance of the IDI (Figure 2). EM-DAT reported the drought conditions in countries like Kenya and Mozambique for 13 and 12 years, respectively, during the study period, which confirms the accuracy of using IDI for drought assessments purpose.
3.3 The variability of SYRS
Based on the standardized yield residuals (SYRS), where values > 0.5 indicate yield increments and values < -0.5 signify yield losses, the study investigated the number of years with low yields (SYRS ≤ −0.5) for three crop types: maize, dry beans, and wheat. The findings (Figure 4) indicate that dry beans and wheat experienced seven low-yielding years during the study period, while maize had five such years. Notably, 2005 and 2019 were particularly challenging for dry beans, as they experienced the most significant yield losses (SYRS ≤ −1.5) during these years. Conversely, moderate yield increments for dry beans (1.0 ≤ SYRS ≤1.5) were observed in 2015, 2009, 2014, and 2001. For maize, the most significant yield decreases occurred in 2005 and 2008, correlating with severe drought conditions. During these years, approximately 87% and 60% of the study area, respectively, were affected by drought, as indicated in the relevant Figure 2. This suggests a strong relationship between drought occurrences and maize yield losses. On the other hand, the year 2001 was notable for the highest yield increment (SYRS ≥1.5).
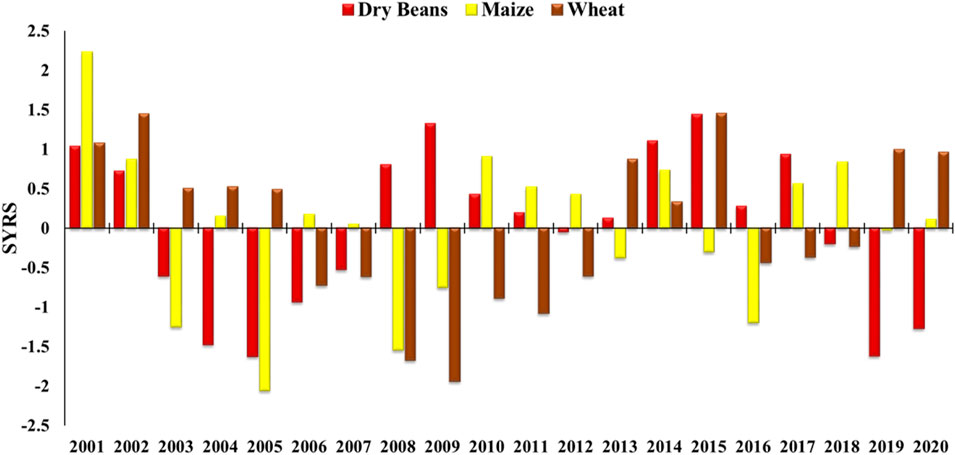
Figure 4. The SYRS’s temporal variability for dry beans, maize, and wheat during the 2001–2020.
Wheat, similar to dry beans, faced seven low-yielding years, the yield data also showed variability influenced by drought conditions. The uppermost yield losses were observed in 2009 and 2008, with a notable moderate yield loss in 2011. These years were marked by adverse conditions that negatively affected wheat production. Moderate yield increments for wheat were recorded in 2001, 2002, and 2015.
Figure 5 provides an analysis of SYRS for agricultural production of dry beans, maize, and wheat across EA countries between 2001 and 2020. In terms of wheat production, Burundi showed significant variability, with a notable improvement in 2018 (SYRS = 3.46) contrasting sharply with underperformance in 2011 (−1.34). Ethiopia’s performance fluctuated, showing positive residuals in 2015 (2.08) among a mix of positive and negative deviations. Mozambique experienced a substantial positive anomaly in 2010 (3.52) but generally showed negative residuals in subsequent years. Rwanda’s wheat yields fluctuated over time, with recent years indicating improvement. Regarding maize production, Burundi showed strong positive residuals recently, notably in 2018 (1.89). Tanzania had high positive deviations in the early 2000s (2.86 in 2001, 1.77 in 2002) but more moderate fluctuations in later years. Rwanda experienced a series of positive residuals from 2009 to 2013, peaking in 2010 (1.94). South Sudan had a notable positive spike in 2007–2008 but generally showed negative residuals in subsequent years. Ethiopia’s maize yields fluctuated considerably, with strong positive deviations in 2006 (1.77) and in 2018–2019 (1.68 and 1.44 respectively).
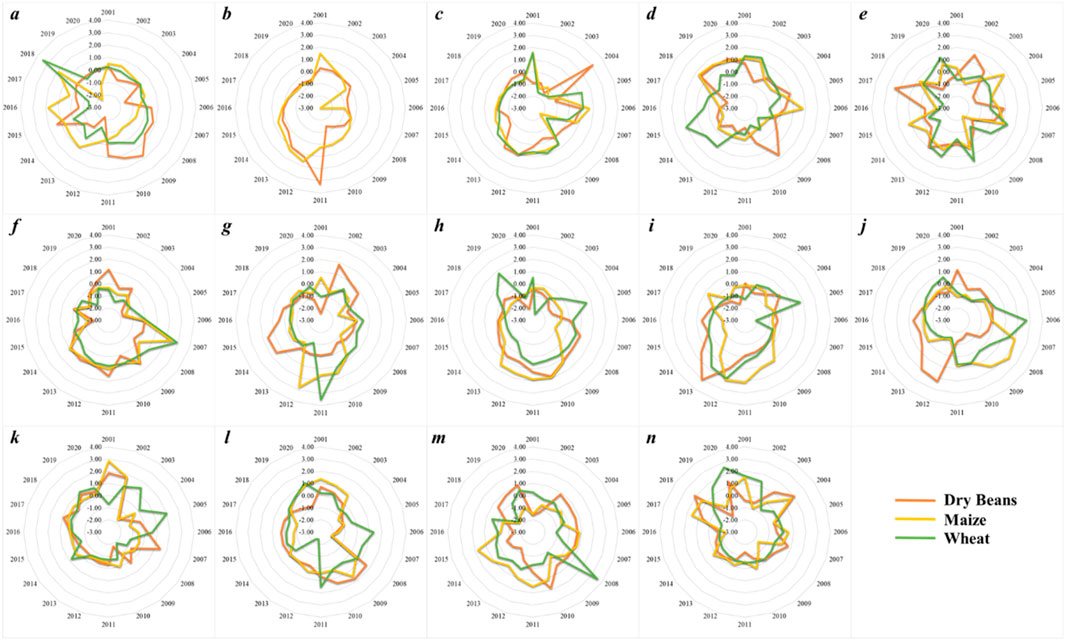
Figure 5. Temporal variability of the SYRS for dry beans, maize, and wheat during the 2001–2020 for each country in the study area: (a) Burundi, (b) Djibouti, (c) Eritrea, (d) Ethiopia, (e) Kenya, (f) Malawi, (g) Mozambique, (h) Rwanda, (i) Somalia, (j) South Sudan, (k) Tanzania, (l) Uganda, (m) Zambia and (n) Zimbabwe.
For dry bean production, Djibouti had an extreme positive residual in 2011 (3.28), indicating a significantly better-than-expected yield. Ethiopia showed strong positive residuals in recent years (1.51 in 2018, 1.35 in 2019, and 1.28 in 2020), suggesting improving yields. Kenya demonstrated high variability, with a strong positive residual in 2017 (2.36) contrasting sharply with a severe negative residual in 2020 (−0.61). Rwanda demonstrated a period of positive residuals from 2008 to 2013 but ended with a significant negative residual in 2020 (−2.01). Burundi had a significant drop in yield in 2005 but showed an increase in 2007. Tanzania started the period with strong positive residuals but showed more moderate fluctuations in later years.
3.4 Drought dynamics from 2001 to 2020
The analysis of drought dynamics from 2001 to 2020 (Figure 6), based on the linear regression approach, reveals significant interannual variations using IDI across EA. The IDI values fluctuated between −0.03 and 0.029, indicating variability in drought severity and frequency over the two-decade period. A notable finding is that drought conditions intensified in 56.4% of the study area. The regions most affected by this increase include South Sudan, Ethiopia, Somalia, Kenya, and Tanzania. This trend underscores a growing vulnerability to drought in these countries. Conversely, 43.6% of the study area saw a decline in drought conditions, with the most significant improvements observed in the southern part of Somalia, central Uganda, Malawi, and Mozambique. South Sudan and Tanzania, in particular, experienced a marked increase in drought conditions compared to other countries in the study area. This increase highlights the urgent need for targeted interventions in these regions to address the escalating drought risk. Generally, the drought dynamics from 2001 to 2020 demonstrate a complex and uneven pattern of drought impacts across EA. While some regions have seen improvements, others continue to face significant challenges.

Figure 6. Spatial distribution of annual change trends in drought based on IDI from 2001 to 2020 (a) annual change trends in IDI. Red indicates drought increase, while blue shows drought decrease; (b) significance (p-value) of the change trends in IDI.
3.5 Drought impact on crop production
When evaluating the IDI, the crop yield is employed as an independent variable. In this study, correlation coefficient analysis was used to investigate the effect of drought on crop production. Based on the selected crop types, it was clear that the drought had a direct impact on the crop yield in the study area. During the study period, the association between SYRS of maize and IDI was stronger than for dry beans and wheat, indicating that drought has a greater impact on maize yield (Figure 7b). The correlation between wheat and IDI showed a negative correlation rather than a positive one; about 54.6% of the total area felt a negative correlation. For this period of 20 years, it was noticed that wheat was affected by drought in countries like Kenya, a large part of Zambia, Malawi, the southern part of Mozambique, and Tanzania. Drought has mostly affected maize and dry bean yields in Eritrea, Ethiopia, Kenya, Tanzania, Rwanda, Malawi, Zambia, and Zimbabwe compared to other countries. This implies that variations in agricultural productivity in the study area might be reflected in variations in the IDI.
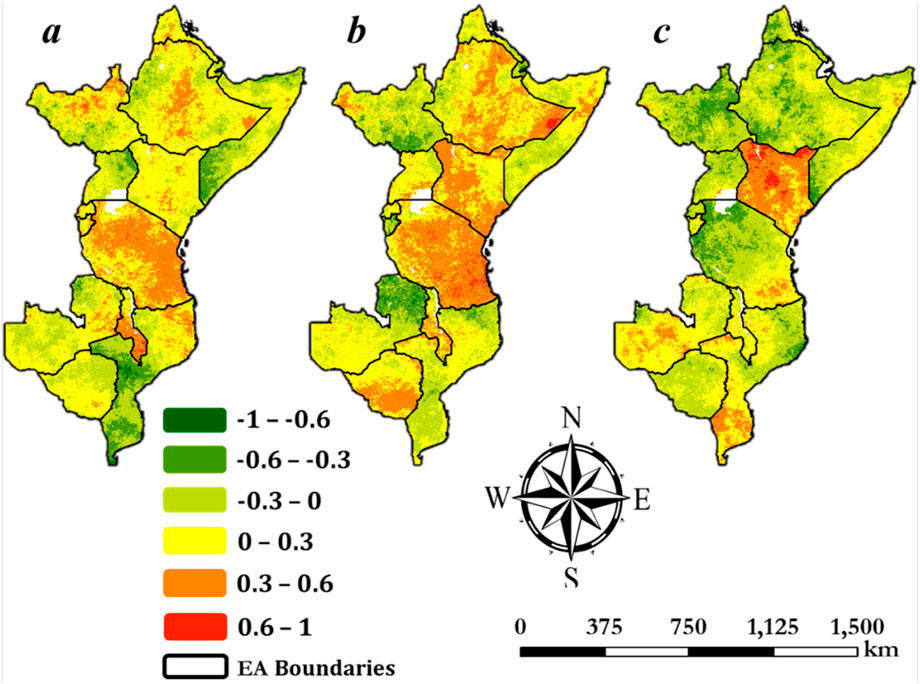
Figure 7. Pearson correlation coefficient (r) values between the annual (a) Dry beans, (b) Maize and (c) Wheat production and IDI.
4 Discussion
The spatial distribution analysis of the IDI for EA from 2001 to 2020 reveals critical insights into drought dynamics in the region. The use of an entropy weighting method to combine five individual indices has proven effective in capturing the multifaceted nature of drought conditions (Wang et al., 2023). This comprehensive approach ensures that the IDI reflects various dimensions of drought, including meteorological, agricultural, and hydrological aspects, providing a robust tool for monitoring and managing drought impacts (Mishra and Singh, 2010; Hao and Singh, 2015). The results indicate that 2005 was a particularly severe drought year, with 87.3% of the study area experiencing drought conditions. This outcome is in line with earlier studies that have highlighted 2005 as one of the driest years in recent history for EA, severely affecting agriculture and water resources (Williams and Funk, 2011; Nicholson, 2014; Shukla et al., 2014). The years 2009 and 2016 exhibited widespread drought conditions, though with distinct spatial patterns—2009 primarily affected the northeastern regions (e.g., Somalia, Ethiopia) (Funk et al., 2015), while in 2016 drought conditions were concentrated in the central and southern zones (e.g., Tanzania, Mozambique) (Nicholson, 2017). Notably, 2017 showed intensified drought in Kenya and South Sudan, aligning with reported crop failures in these regions (AghaKouchak et al., 2020). In contrast, 2007 and 2020 represented relatively mild drought years, with over 60% of the study area experiencing near-normal. The high percentage of areas affected by extreme and severe drought conditions suggests significant stress on water resources, agriculture, and livelihoods. These findings align with previous studies that have reported recurrent and severe droughts in EA, often made worsened by climate variability and change (Funk et al., 2008; Dai, 2011; Lyon and DeWitt, 2012; Omondi et al., 2014).
The validation of IDI against these standardized indices confirms its utility as a holistic drought-monitoring tool. By integrating meteorological, agricultural, and hydrological drought dimensions, IDI provides a more complete picture of drought impacts compared to single-component indices. Recent reviews, such as those by Zougmoré et al. (2021) and Salack et al. (2022), have urged the usage of integrated indices to strengthen the resilience of farming systems to drought in EA. In this study, other standardized drought indices such as the SPEI, PDSI, and WBDI were used to validate the performance of IDI. This underlines the robustness and multidimensional nature of the IDI. The correlation analysis revealed that IDI has a high correlation with these standardized indices, particularly with SPEI and PDSI, indicating its effectiveness in capturing various dimensions of drought conditions. The strong positive correlation between IDI and SPEI, especially at shorter time scales, demonstrates the suitability of the IDI to reflect short-term meteorological drought conditions. This finding aligns with recent studies that emphasize the significance of considering several temporal periods to broadly understand drought dynamics. For instance, Bhukya et al. (2023) emphasized the critical role of short-term indices in capturing the immediate impacts of meteorological droughts on agriculture.
The high correlation between IDI and PDSI further validates the capability of IDI to capture long-term agricultural and hydrological drought conditions. PDSI is widely used for its sensitivity to soil moisture conditions, which directly affect agricultural productivity. The alignment of IDI with PDSI emphasized that IDI effectively incorporates the influence of drought on soil moisture and, consequently, on agriculture. Recent studies, such as those by Gebrechorkos et al. (2019), have underscored the necessity of indices like PDSI in understanding long-term drought impacts on agricultural yields in EA. Moreover, the positive correlation between IDI and WBDI highlights the potential of IDI to account for hydrological drought. WBDI, which considers the balance between water demand and supply, is crucial for understanding the availability of water resources for various uses. The strong correlation with WBDI indicates that IDI successfully integrated hydrological aspects of drought, making it a comprehensive tool for drought monitoring and assessment. Studies by Lottering et al. (2021) and Ndiritu (2021) have shown that comprehensive indices that include hydrological components are essential for effective drought management in EA, where water scarcity is a critical issue.
The analysis of standardized yield residuals (SYRS) provides critical insights into the influence of drought on crop yields in EA over the study period. The investigation into low-yielding years for maize, dry beans, and wheat reveals significant insights into the susceptibility of these crops to drought conditions. The severe yield losses for dry beans in 2005 and 2019 align with previous studies that have identified 2005 as one of the driest years in EA, significantly affecting agricultural productivity (Nicholson, 2014; Shukla et al., 2014). The substantial yield losses for maize in 2005 and 2008 correlate with severe drought conditions affecting approximately 87% and 60% of the study area, respectively, underscoring the vulnerability of maize to water stress (Lobell et al., 2011; Cairns et al., 2013). These results are in line with findings by Funk et al. (2008), which highlighted the severe impacts of drought on maize yields in EA during extreme drought years. The high correlation between drought occurrences and maize yield losses underscores the critical relationship between drought and agricultural productivity in EA. This relationship has been well reported in previous research, which has emphasized the adverse effects of drought on crop yields and the need for resilient agricultural practices (Rockström et al., 2010; Lipper et al., 2014). The findings emphasize the importance of implementing adaptive management strategies, such as improved drought-tolerant crop varieties and water management (Funk et al., 2008; Thornton et al., 2014).
The drought dynamics in EA from 2001 to 2020, using the IDI and a linear regression approach, reveals significant interannual variations in drought conditions over the two-decade period. The finding that drought conditions intensified in 56.4% of the study area, particularly in regions such as South Sudan, Ethiopia, Somalia, Kenya, and Tanzania, is consistent with previous studies that have documented increasing frequency and intensity of drought in EA as a result of climate change and variability (Williams and Funk, 2011; Lyon and DeWitt, 2012). These regions have been identified as highly vulnerable to drought, with significant impacts on agriculture, water resources, and livelihoods. For instance, Funk et al. (2008) highlighted the severe effects of drought on southern and eastern Africa food security, exacerbated by warming sea surface temperatures in the Indian Ocean.
The outcomes of this study regarding the impact of drought on crop yields in EA are consistent with earlier research that has highlighted the susceptibility of agriculture to climate variability and drought in the region. Studies by Lobell et al. (2011) and Cairns et al. (2013) have shown that maize, in particular, is highly susceptible to drought, with significant yield losses recorded during drought periods. The higher correlation coefficients between maize yield and the IDI compared to dry beans and wheat further support the notion that maize is more affected by water stress, which coincides with the outcomes of these earlier studies. Similarly, the negative correlation between wheat yield and IDI in certain areas, as observed in this study, is consistent with the complex relationship between wheat production and drought (Sivakumar et al., 2005; Trnka et al., 2011). The negative correlation observed in some regions highlights the need for a nuanced understanding of the effect of drought on diverse crops and the various factors that contribute to yield variability. The widespread impact of drought on maize and dry bean yields in countries such as Eritrea, Ethiopia, Kenya, Tanzania, Rwanda, Malawi, Zambia, and Zimbabwe, as identified in this study, is in line with the findings of Funk et al. (2008) and Shiferaw et al. (2014). These studies have documented the severe effects of drought on food security and livelihoods in these countries, emphasizing the importance of adaptive management approaches to mitigate the effect of drought on crop production.
5 Conclusion
The comprehensive analysis of drought conditions in East Africa (EA) from 2001 to 2020 using the integrated drought index (IDI) has provided critical insights into drought dynamics in the region. The IDI developed using an entropy weighting method captures the multifaceted nature of drought, incorporating meteorological, agricultural, and hydrological aspects. The analysis demonstrates that drought conditions have intensified notably in many parts of the region, particularly affecting rainfed agricultural systems where crops like maize show heightened vulnerability to water stress. South Sudan and Tanzania emerged as particularly vulnerable regions. The strong correlations of the IDI with established drought indices and its ability to reflect crop yield fluctuations demonstrate its effectiveness as a drought-monitoring tool. The impact on agriculture was evident, with maize yields showing the highest sensitivity to drought conditions. Maize, dry beans and wheat have all experienced substantial yield losses during severe drought years, with maize showing the highest susceptibility to water stress. The findings highlight how drought effects cascade through ecosystems, with vegetation stress and soil moisture deficits translating directly into measurable crop yield reductions. Importantly, the research underscores that drought impacts are not uniform across the region, with some areas experiencing worsening conditions while others show relative resilience. To summarize, this study offers an extensive understanding of drought phenomena in EA, highlighting its increasing severity and widespread impact on agriculture. The findings highlight the urgency for adaptive strategies to enhance the region’s resilience to drought, ensuring food security and sustainable livelihoods despite a changing climate. Future research should integrate climate change projections with drought assessments—using downscaled models to capture regional variability while refining seasonal-scale drought-crop relationships—and incorporating socio-economic factors to develop climate-smart agricultural strategies for this vulnerable region.
Data availability statement
The original contributions presented in the study are included in the article/supplementary material, further inquiries can be directed to the corresponding author.
Author contributions
AU: Conceptualization, Data curation, Formal Analysis, Investigation, Methodology, Software, Validation, Visualization, Writing – original draft. XC: Funding acquisition, Project administration, Supervision, Writing – review and editing. TL: Conceptualization, Funding acquisition, Project administration, Supervision, Writing – review and editing. AG: Data curation, Software, Visualization, Writing – review and editing. JU: Data curation, Methodology, Software, Writing – review and editing. EM: Data curation, Methodology, Software, Writing – review and editing. EN: Formal Analysis, Methodology, Writing – review and editing. SU: Software, Writing – review and editing. AM: Formal Analysis, Writing – review and editing.
Funding
The author(s) declare that financial support was received for the research and/or publication of this article. The Tianshan Talent Project of Xinjiang Uygur Autonomous Region (2022TSYCLJ0056) the Joint CAS-MPG Research Project (HZXM20225001MI).
Acknowledgments
The Alliance of International Science Organizations scholarship for Young Talents is acknowledged for its contributions to the doctorate studies of which this work is a part.
Conflict of interest
The authors declare that the research was conducted in the absence of any commercial or financial relationships that could be construed as a potential conflict of interest.
Generative AI statement
The author(s) declare that no Generative AI was used in the creation of this manuscript.
Publisher’s note
All claims expressed in this article are solely those of the authors and do not necessarily represent those of their affiliated organizations, or those of the publisher, the editors and the reviewers. Any product that may be evaluated in this article, or claim that may be made by its manufacturer, is not guaranteed or endorsed by the publisher.
References
Abatzoglou, J. T., Dobrowski, S. Z., Parks, S. A., and Hegewisch, K. C. (2018). TerraClimate, a high-resolution global dataset of monthly climate and climatic water balance from 1958–2015. Sci. data 5 (1), 170191–12. doi:10.1038/sdata.2017.191
Adhikari, U., Nejadhashemi, A. P., and Woznicki, S. A. (2015). Climate change and eastern Africa: a review of impact on major crops. Food Energy Secur. 4 (2), 110–132. doi:10.1002/fes3.61
AghaKouchak, A., Chiang, F., Huning, L. S., Love, C. A., Mallakpour, I., Mazdiyasni, O., et al. (2020). Climate extremes and compound hazards in a warming world. Annu. Rev. earth Planet. Sci. 48 (1), 519–548. doi:10.1146/annurev-earth-071719-055228
Alley, W. M. (1985). The Palmer drought severity index as a measure of hydrologic drought 1. JAWRA J. Am. Water Resour. Assoc. 21 (1), 105–114. doi:10.1111/j.1752-1688.1985.tb05357.x
Amalo, L. F., Ma’rufah, U., and Permatasari, P. A. (2018). Monitoring 2015 drought in West Java using normalized difference water index (NDWI). IOP Conf. Ser. Earth Environ. Sci. doi:10.1088/1755-1315/149/1/012007
Atwoli, L., Erhabor, G. E., Gbakima, A. A., Haileamlak, A., Ntumba, J.-M. K., Kigera, J., et al. (2022). COP27 Climate Change Conference: urgent action needed for Africa and the world. Lancet Oncol. 23 (12), 1486–1488. doi:10.1016/S1473-3099(22)00696-X
Ayugi, B., Eresanya, E. O., Onyango, A. O., Ogou, F. K., Okoro, E. C., Okoye, C. O., et al. (2022). Review of meteorological drought in Africa: historical trends, impacts, mitigation measures, and prospects. Pure Appl. Geophys. 179 (4), 1365–1386. doi:10.1007/s00024-022-02988-z
Balint, Z., Mutua, F., Muchiri, P., and Omuto, C. T. (2013). Monitoring drought with the combined drought index in Kenya Developments in earth surface processes, 16. Elsevier, 341–356. doi:10.1016/B978-0-444-59559-1.00023-2
Bayissa, Y. (2018). Developing an impact-based combined drought index for monitoring crop yield anomalies in the Upper Blue Nile Basin, Ethiopia. CRC Press.
Beguería, S., Vicente-Serrano, S. M., and Angulo-Martínez, M. (2010). A multiscalar global drought dataset: the SPEIbase: a new gridded product for the analysis of drought variability and impacts. Bull. Am. meteorological Soc. 91 (10), 1351–1354.
Bhukya, S., Tiwari, M. K., and Patel, G. R. (2023). Assessment of spatiotemporal variation of agricultural and meteorological drought in Gujarat (India) using remote sensing and GIS. J. Indian Soc. Remote Sens. 51 (7), 1493–1510. doi:10.1007/s12524-023-01715-y
Byakatonda, J., Parida, B., Moalafhi, D., and Kenabatho, P. K. (2018). Analysis of long term drought severity characteristics and trends across semiarid Botswana using two drought indices. Atmos. Res. 213, 492–508. doi:10.1016/j.atmosres.2018.07.002
Cairns, J. E., Hellin, J., Sonder, K., Araus, J. L., MacRobert, J. F., Thierfelder, C., et al. (2013). Adapting maize production to climate change in sub-Saharan Africa. Food Secur. 5, 345–360. doi:10.1007/s12571-013-0256-x
Camberlin, P. (2018). Climate of eastern Africa Oxford research encyclopedia of climate science. doi:10.1093/acrefore/9780190228620.013.512
Carrão, H., Naumann, G., and Barbosa, P. (2016). Mapping global patterns of drought risk: an empirical framework based on sub-national estimates of hazard, exposure and vulnerability. Glob. Environ. Change 39, 108–124. doi:10.1016/j.gloenvcha.2016.04.012
Dai, A. (2011). Drought under global warming: a review. Wiley Interdiscip. Rev. Clim. Change 2 (1), 45–65. doi:10.1002/wcc.81
Dikici, M. (2020). Drought analysis with different indices for the Asi Basin (Turkey). Sci. Rep. 10 (1), 20739. doi:10.1038/s41598-020-77827-z
Dikici, M. (2022). Drought analysis for the Seyhan Basin with vegetation indices and comparison with meteorological different indices. Sustainability 14 (8), 4464. doi:10.3390/su14084464
Du, L., Tian, Q., Yu, T., Meng, Q., Jancso, T., Udvardy, P., et al. (2013). A comprehensive drought monitoring method integrating MODIS and TRMM data. Int. J. Appl. Earth Observation Geoinformation 23, 245–253. doi:10.1016/j.jag.2012.09.010
Funk, C., Dettinger, M. D., Michaelsen, J. C., Verdin, J. P., Brown, M. E., Barlow, M., et al. (2008). Warming of the Indian Ocean threatens eastern and southern African food security but could be mitigated by agricultural development. Proc. Natl. Acad. Sci. 105 (32), 11081–11086. doi:10.1073/pnas.0708196105
Funk, C., Peterson, P., Landsfeld, M., Pedreros, D., Verdin, J., Shukla, S., et al. (2015). The climate hazards infrared precipitation with stations—a new environmental record for monitoring extremes. Sci. data 2 (1), 150066–21. doi:10.1038/sdata.2015.66
Gebrechorkos, S. H., Hülsmann, S., and Bernhofer, C. (2019). Long-term trends in rainfall and temperature using high-resolution climate datasets in East Africa. Sci. Rep. 9 (1), 11376. doi:10.1038/s41598-019-47933-8
Gidey, E., Dikinya, O., Sebego, R., Segosebe, E., and Zenebe, A. (2018). Using drought indices to model the statistical relationships between meteorological and agricultural drought in Raya and its environs, Northern Ethiopia. Earth Syst. Environ. 2, 265–279. doi:10.1007/s41748-018-0055-9
Haile, G. G., Tang, Q., Sun, S., Huang, Z., Zhang, X., and Liu, X. (2019). Droughts in East Africa: Causes, impacts and resilience. Earth-science Rev. 193, 146–161. doi:10.1016/j.earscirev.2019.04.015
Hao, Z., and Singh, V. P. (2015). Drought characterization from a multivariate perspective: a review. J. Hydrology 527, 668–678. doi:10.1016/j.jhydrol.2015.05.031
Hayes, M., Svoboda, M., Wall, N., and Widhalm, M. (2011). The Lincoln declaration on drought indices: universal meteorological drought index recommended. Bull. Am. meteorological Soc. 92 (4), 485–488.
Hussain, H. A., Hussain, S., Khaliq, A., Ashraf, U., Anjum, S. A., Men, S., et al. (2018). Chilling and drought stresses in crop plants: implications, cross talk, and potential management opportunities. Front. plant Sci. 9, 393. doi:10.3389/fpls.2018.00393
Ji, L., Zhang, L., and Wylie, B. (2009). Analysis of dynamic thresholds for the normalized difference water index. Photogrammetric Eng. and Remote Sens. 75 (11), 1307–1317. doi:10.14358/PERS.75.11.1307
Jiang, D., Fu, J., Zhuang, D., and Xu, X. (2013). Dynamic monitoring of drought using HJ-1 and MODIS time series data in northern China. Nat. Hazards 68, 337–350. doi:10.1007/s11069-013-0626-x
Jiang, L., Bao, A., Guo, H., and Ndayisaba, F. (2017). Vegetation dynamics and responses to climate change and human activities in Central Asia. Sci. Total Environ. 599, 967–980. doi:10.1016/j.scitotenv.2017.05.012
Kew, S. F., Philip, S. Y., Hauser, M., Hobbins, M., Wanders, N., and Funk, C. (2021). Impact of precipitation and increasing temperatures on drought trends in eastern Africa. doi:10.5194/esd-12-17-2021
Khan, S. M., and Gomes, J. (2022). Global health resilience Building: a Population health Equity approach to the Agro-Pastoralist community in drought affected Ethiopia. Curr. Overv. Dis. Health Res. 1, 34–48.
Kim, J.-S., Park, S.-Y., Lee, J.-H., Chen, J., Chen, S., and Kim, T.-W. (2021). Integrated drought monitoring and evaluation through multi-sensor satellite-based statistical simulation. Remote Sens. 13 (2), 272. doi:10.3390/rs13020272
Kogan, F. N. (1995). Application of vegetation index and brightness temperature for drought detection. Adv. space Res. 15 (11), 91–100. doi:10.1016/0273-1177(95)00079-T
Kogan, F. N. (2001). Operational space technology for global vegetation assessment. Bull. Am. meteorological Soc. 82 (9), 1949–1964.
Kogan, F., Gitelson, A., Zakarin, E., Spivak, L., and Lebed, L. (2003). AVHRR-based spectral vegetation index for quantitative assessment of vegetation state and productivity. Photogrammetric Eng. and Remote Sens. 69 (8), 899–906. doi:10.14358/PERS.69.8.899
Lipper, L., Thornton, P., Campbell, B. M., Baedeker, T., Braimoh, A., Bwalya, M., et al. (2014). Climate-smart agriculture for food security. Nat. Clim. Change 4 (12), 1068–1072. doi:10.1038/nclimate2437
Lobell, D. B., Schlenker, W., and Costa-Roberts, J. (2011). Climate trends and global crop production since 1980. Science 333 (6042), 616–620. doi:10.1126/science.1204531
Lottering, S., Mafongoya, P., and Lottering, R. (2021). Drought and its impacts on small-scale farmers in sub-Saharan Africa: a review. South Afr. Geogr. J. 103 (3), 319–341.
Lyon, B., and DeWitt, D. G. (2012). A recent and abrupt decline in the East African long rains. Geophys. Res. Lett. 39 (2). doi:10.1029/2011GL050337
Masih, I., Maskey, S., Mussá, F., and Trambauer, P. (2014). A review of droughts on the African continent: a geospatial and long-term perspective. Hydrology Earth Syst. Sci. 18 (9), 3635–3649. doi:10.5194/hess-18-3635-2014
McKee, T. B., Doesken, N. J., and Kleist, J. (1993). “The relationship of drought frequency and duration to time scales,” in Paper presented at the Proceedings of the 8th Conference on Applied Climatology.
Mishra, A. K., and Singh, V. P. (2010). A review of drought concepts. J. Hydrology 391 (1-2), 202–216. doi:10.1016/j.jhydrol.2010.07.012
Mitchell, M., and Miller, L. S. (2008). Prediction of functional status in older adults: the ecological validity of four Delis–Kaplan Executive Function System tests. J. Clin. Exp. Neuropsychology 30 (6), 683–690. doi:10.1080/13803390701679893
Nalbantis, I., and Tsakiris, G. (2009). Assessment of hydrological drought revisited. Water Resour. Manag. 23, 881–897. doi:10.1007/s11269-008-9305-1
Narasimhan, B., and Srinivasan, R. (2005). Development and evaluation of soil moisture deficit index (SMDI) and evapotranspiration deficit index (ETDI) for agricultural drought monitoring. Agric. For. meteorology 133 (1-4), 69–88. doi:10.1016/j.agrformet.2005.07.012
Ndiritu, S. W. (2021). Drought responses and adaptation strategies to climate change by pastoralists in the semi-arid area, Laikipia County, Kenya. Mitig. Adapt. strategies Glob. Change 26, 1–18. doi:10.1007/s11027-021-09949-2
Nicholson, S. E. (2014). A detailed look at the recent drought situation in the Greater Horn of Africa. J. Arid Environ. 103, 71–79. doi:10.1016/j.jaridenv.2013.12.003
Nicholson, S. E. (2017). Climate and climatic variability of rainfall over eastern Africa. Rev. Geophys. 55 (3), 590–635. doi:10.1002/2016RG000544
Ogwang, B., Ongoma, V., and Gitau, W. (2016). Contributions of atlantic ocean to June-August rainfall over Uganda and Western Kenya. J. Earth Space Phys. 41 (4), 131–140.
Oki, T., and Kanae, S. (2006). Global hydrological cycles and world water resources. Science 313 (5790), 1068–1072. doi:10.1126/science.1128845
Omondi, P. A. o., Awange, J. L., Forootan, E., Ogallo, L. A., Barakiza, R., Girmaw, G. B., et al. (2014). Changes in temperature and precipitation extremes over the Greater Horn of Africa region from 1961 to 2010. Int. J. Climatol. 34 (4), 1262–1277.
Ongoma, V., and Chen, H. (2017). Temporal and spatial variability of temperature and precipitation over East Africa from 1951 to 2010. Meteorology Atmos. Phys. 129, 131–144. doi:10.1007/s00703-016-0462-0
Palmer, W. C. (1968). Keeping track of crop moisture conditions, nationwide: the new crop moisture index. doi:10.1080/00431672.1968.9932814
Potopova, V., Boroneanţ, C., Boincean, B., and Soukup, J. (2016). Impact of agricultural drought on main crop yields in the Republic of Moldova. Int. J. Climatol. 36 (4), 2063–2082. doi:10.1002/joc.4481
Quiring, S. M., and Ganesh, S. (2010). Evaluating the utility of the Vegetation Condition Index (VCI) for monitoring meteorological drought in Texas. Agric. For. meteorology 150 (3), 330–339. doi:10.1016/j.agrformet.2009.11.015
Rigden, A., Ongoma, V., and Huybers, P. (2020). Kenyan tea is made with heat and water: how will climate change influence its yield? Environ. Res. Lett. 15 (4), 044003. doi:10.1088/1748-9326/ab70be
Rockström, J., Karlberg, L., Wani, S. P., Barron, J., Hatibu, N., Oweis, T., et al. (2010). Managing water in rainfed agriculture—the need for a paradigm shift. Agric. Water Manag. 97 (4), 543–550. doi:10.1016/j.agwat.2009.09.009
Roy, I., and Troccoli, A. (2024). Identifying important drivers of East African October to December rainfall season. Sci. Total Environ. 914, 169615. doi:10.1016/j.scitotenv.2023.169615
Saha, A., Pal, S. C., Chowdhuri, I., Roy, P., Chakrabortty, R., and Shit, M. (2023). Vulnerability assessment of drought in India: insights from meteorological, hydrological, agricultural and socio-economic perspectives. Gondwana Res. 123, 68–88. doi:10.1016/j.gr.2022.11.006
Salack, S., Sanfo, S., Sidibe, M., Daku, E. K., Camara, I., Dieng, M. D. B., et al. (2022). Low-cost adaptation options to support green growth in agriculture, water resources, and coastal zones. Sci. Rep. 12 (1), 17898. doi:10.1038/s41598-022-22331-9
Salami, A., Kamara, A. B., and Brixiova, Z. (2010). Smallholder agriculture in East Africa: trends, constraints and opportunities. Tunis: African Development Bank.
Sepulcre-Canto, G., Horion, S., Singleton, A., Carrao, H., and Vogt, J. (2012). Development of a combined drought indicator to detect agricultural drought in Europe. Nat. Hazards Earth Syst. Sci. 12 (11), 3519–3531. doi:10.5194/nhess-12-3519-2012
Shafer, B., and Dezman, L. (1982). Development of surface water supply index (SWSI) to assess the severity of drought condition in snowpack runoff areas.
Shashikant, V., Mohamed Shariff, A. R., Wayayok, A., Kamal, M. R., Lee, Y. P., and Takeuchi, W. (2021). Utilizing TVDI and NDWI to classify severity of agricultural drought in Chuping, Malaysia. Agronomy 11 (6), 1243. doi:10.3390/agronomy11061243
Shiferaw, B., Tesfaye, K., Kassie, M., Abate, T., Prasanna, B. M., and Menkir, A. (2014). Managing vulnerability to drought and enhancing livelihood resilience in sub-Saharan Africa: technological, institutional and policy options. Weather Clim. Extrem. 3, 67–79. doi:10.1016/j.wace.2014.04.004
Shilenje, Z. W., Ongoma, V., and Njagi, M. (2019). Applicability of combined drought index in drought analysis over North Eastern Kenya. Nat. Hazards 99 (1), 379–389. doi:10.1007/s11069-019-03745-7
Shukla, S., and Wood, A. W. (2008). Use of a standardized runoff index for characterizing hydrologic drought. Geophys. Res. Lett. 35 (2). doi:10.1029/2007GL032487
Shukla, S., McNally, A., Husak, G., and Funk, C. (2014). A seasonal agricultural drought forecast system for food-insecure regions of East Africa. Hydrology Earth Syst. Sci. 18 (10), 3907–3921. doi:10.5194/hess-18-3907-2014
Sivakumar, M. V., Das, H., and Brunini, O. (2005). Impacts of present and future climate variability and change on agriculture and forestry in the arid and semi-arid tropics. Clim. change 70, 31–72. doi:10.1007/s10584-005-5937-9
Sur, C., Park, S.-Y., Kim, J.-S., and Lee, J.-H. (2020). Prognostic and diagnostic assessment of hydrological drought using water and energy budget-based indices. J. Hydrology 591, 125549. doi:10.1016/j.jhydrol.2020.125549
Thornton, P. K., Ericksen, P. J., Herrero, M., and Challinor, A. J. (2014). Climate variability and vulnerability to climate change: a review. Glob. change Biol. 20 (11), 3313–3328. doi:10.1111/gcb.12581
Topcu, E. (2022). Drought analysis using the entropy weight-based TOPSIS method: a case study of Kars, Turkey. Russ. Meteorology Hydrology 47 (3), 224–231. doi:10.3103/S1068373922030086
Trnka, M., Olesen, J. E., Kersebaum, K. C., Skjelvåg, A. O., Eitzinger, J., Seguin, B., et al. (2011). Agroclimatic conditions in Europe under climate change. Glob. change Biol. 17 (7), 2298–2318. doi:10.1111/j.1365-2486.2011.02396.x
Umugwaneza, A., Chen, X., Liu, T., Mind'je, R., Uwineza, A., Kayumba, P. M., et al. (2022). Integrating a GIS-based approach and a SWAT model to identify potential suitable sites for rainwater harvesting in Rwanda. AQUA—Water Infrastructure, Ecosyst. Soc. 71 (3), 415–432. doi:10.2166/aqua.2022.111
UNEP (2006). “Facing the Facts: assessing the vulnerability of Africa's water resources to environmental change,”, 2. UNEP/Earthprint.
Vicente-Serrano, S. M., Beguería, S., and López-Moreno, J. I. (2010). A multiscalar drought index sensitive to global warming: the standardized precipitation evapotranspiration index. J. Clim. 23 (7), 1696–1718. doi:10.1175/2009JCLI2909.1
Vicente-Serrano, S. M., Gouveia, C., Camarero, J. J., Beguería, S., Trigo, R., López-Moreno, J. I., et al. (2013). Response of vegetation to drought time-scales across global land biomes. Proc. Natl. Acad. Sci. 110 (1), 52–57. doi:10.1073/pnas.1207068110
Vyas, S. S., Bhattacharya, B. K., Nigam, R., Guhathakurta, P., Ghosh, K., Chattopadhyay, N., et al. (2015). A combined deficit index for regional agricultural drought assessment over semi-arid tract of India using geostationary meteorological satellite data. Int. J. Appl. Earth Observation Geoinformation 39, 28–39. doi:10.1016/j.jag.2015.02.009
Wang, X., Li, Y., Qiao, Q., Tavares, A., and Liang, Y. (2023). Water quality prediction based on machine learning and comprehensive weighting methods. Entropy 25 (8), 1186. doi:10.3390/e25081186
Waseem, M., Ajmal, M., and Kim, T.-W. (2015). Development of a new composite drought index for multivariate drought assessment. J. Hydrology 527, 30–37. doi:10.1016/j.jhydrol.2015.04.044
West, H., Quinn, N., and Horswell, M. (2019). Remote sensing for drought monitoring and impact assessment: Progress, past challenges and future opportunities. Remote Sens. Environ. 232, 111291. doi:10.1016/j.rse.2019.111291
Williams, A. P., and Funk, C. (2011). A westward extension of the warm pool leads to a westward extension of the Walker circulation, drying eastern Africa. Clim. Dyn. 37, 2417–2435. doi:10.1007/s00382-010-0984-y
Zhang, A., and Jia, G. (2013). Monitoring meteorological drought in semiarid regions using multi-sensor microwave remote sensing data. Remote Sens. Environ. 134, 12–23. doi:10.1016/j.rse.2013.02.023
Keywords: East Africa, drought monitoring, IDI, entropy weighting method, SYRS
Citation: Umugwaneza A, Chen X, Liu T, Gasirabo A, Umuhoza J, Dufatanye Umwali E, Nyesheja EM, Uwamahoro S and Maniraho AP (2025) Integrated drought index for enhanced multi-factor assessment of cropland vulnerability in East Africa. Front. Environ. Sci. 13:1652046. doi: 10.3389/fenvs.2025.1652046
Received: 23 June 2025; Accepted: 31 July 2025;
Published: 22 September 2025.
Edited by:
Erhan Sener, Süleyman Demirel University, TürkiyeReviewed by:
Mehmet Dikici, Alanya Alaaddin Keykubat University, TürkiyeVuwani Makuya, Agricultural Research Council of South Africa (ARC-SA), South Africa
Copyright © 2025 Umugwaneza, Chen, Liu, Gasirabo, Umuhoza, Dufatanye Umwali, Nyesheja, Uwamahoro and Maniraho. This is an open-access article distributed under the terms of the Creative Commons Attribution License (CC BY). The use, distribution or reproduction in other forums is permitted, provided the original author(s) and the copyright owner(s) are credited and that the original publication in this journal is cited, in accordance with accepted academic practice. No use, distribution or reproduction is permitted which does not comply with these terms.
*Correspondence: Xi Chen, Y2hlbnhpQG1zLnhqYi5hYy5jbg==