 Ping Jiang
 Yue Zhang1*
- 1College of Geographical Science and Tourism, Xinjiang Normal University, Urumqi, Xinjiang, China
- 2School of Geographical Sciences, Nanjing Normal University, Nanjing, China
As the world’s largest azonal arid region, Central Asia harbors fragile ecosystems that are highly sensitive to shifts in climate patterns. However, the spatiotemporal dynamics of vegetation sensitivity and their underlying drivers in this region remain poorly understood. Here, we assessed vegetation responses to climate variability from 1982 to 2022 using the longest available time series of vegetation indices and the Vegetation Sensitivity Index (VSI) metric. Results revealed high VSI (>50) in humid-region forests and shrubs as well as in semi-arid rainfed croplands, while arid zones generally exhibited low VSI values (<30). Relationship between VSI and aridity was observed across most vegetation types, excluding rainfed agriculture and sparse vegetation. Temporally, the VSI in Central Asia showed a clear declining trend, with the rate of decrease accelerating after 1995 from −0.274 to −0.476. Spatially, approximately 82% of vegetated areas showed declining VSI trends over the past four decades, with 49% exhibiting statistically significant decreases. Temperature and atmospheric CO2 concentration were identified as primary drivers of VSI trends, with warming promoting and CO2 largely suppressing vegetation sensitivity. Water availability—including precipitation and soil moisture—also exerted notable regulatory influence on VSI dynamics. These findings address critical knowledge gaps in the understanding of vegetation–climate interactions in Central Asia and offer valuable insights for projecting ecosystem responses under future climate scenarios.
1 Introduction
Central Asia is the world’s largest azonal arid region, home to fragile ecosystems that are especially vulnerable to contemporary climate variability and projected climate change (Su et al., 2023; Gummadi et al., 2025). Vegetation dynamics in this region critically affect agricultural systems, food security, water resources, natural environments, and socioeconomic stability—including livelihoods, human health, and crop/livestock production (Li et al., 2024). Consequently, understanding vegetation responses remains a priority in ecological research in Central Asia.
Over the past few decades, Central Asia has experienced accelerated climate transformations, with warming rates surpassing 0.3 °C per decade since the 1990s—almost double the global average (Davi et al., 2015; Fallah et al., 2023), This warming exhibits pronounced seasonality, with winter temperatures rising 50% faster than summer temperatures (Peng et al., 2020), which intensifies evaporative demand. Concurrently, precipitation regimes have shifted toward increased spatial heterogeneity and temporal volatility. Arid lowlands experience declining rainfall reliability, while mountain regions face more extreme precipitation events (Jiang et al., 2020; Su et al., 2023). This pattern is projected to intensify under Coupled Model Intercomparison Project Phase 6 (CMIP6) scenarios, with precipitation variability expected to increase by 15%–30% (Gummadi et al., 2025). These changes have triggered cascading ecosystem impairments, including intensified soil moisture deficits that frequently breach critical plant water-stress thresholds (Fu et al., 2024), particularly in rainfed croplands, where drought-induced productivity losses exceed 40% (Yuan et al., 2022); rising vapor pressure deficit (VPD) diminishes CO2 fertilization benefits (Li et al., 2023); and compound drought-heatwave events have increased in frequency by 40% since 2000, inducing nonlinear vegetation mortality (Zhou et al., 2019; Yin et al., 2023). Furthermore, altered precipitation seasonality disrupts phenological synchrony, manifested in delayed spring green-up and premature autumn senescence in grasslands, thereby reducing effective growing periods by 5–12 days per decade (Wang et al., 2020; Su et al., 2023). Collectively, these disturbances threaten the structural integrity and carbon sequestration capacity of terrestrial ecosystems (Zeng et al., 2023). Within this context, quantifying vegetation sensitivity to climate variations is imperative for predicting ecosystem resilience amid accelerating climate change across Central Asia.
Vegetation climatic sensitivity is widely recognized as a crucial indicator of ecosystem responses to climate perturbations (Seddon et al., 2016; Wu et al., 2024). Effective sensitivity metrics must account for both long-term climate state influences and short-term variability impacts, as ecosystems exhibit heightened responsiveness to discrete extremes than to chronic environmental changes (Chen et al., 2024). The Vegetation Sensitivity Index (VSI) pioneered by Seddon et al. (2016) addresses this requirement through its foundation in first- and second-order statistical moments. This framework overcomes the limitations of single-metric approaches by simultaneously evaluating temperature, hydrological, and radiative drivers, enabling a more comprehensive consideration of ecosystem-climate interactions (Chen et al., 2024). Its robustness is evidenced through global assessments of ecosystem vulnerability (Seddon et al., 2016), regional drought impact analyses (Zhu et al., 2019; Yuan et al., 2021), and quantification of CO2 fertilization effects (Ueyama et al., 2020). Recent methodological refinements, particularly sliding-window implementations, have enabled improved resolution of temporal dynamics across diverse biomes (Jiang et al., 2022; Chen et al., 2024; Wu et al., 2024). However, significant knowledge gaps remain regarding VSI patterns in Central Asia. While Yuan et al. (2021) employed VSI to assess vegetation vulnerability to drought stress in Central Asia, yielding preliminary insights into spatial sensitivity patterns, temporal changes in regional sensitivity remain unexamined. Furthermore, the dominant natural drivers of spatiotemporal VSI variations—particularly interactions between thermal acclimation (Wang et al., 2024), CO2 fertilization effects (Li et al., 2023), and moisture constraints (Wang et al., 2023; Zhao et al., 2025) — remain poorly understood. Consequently, the evolution of vegetation sensitivity and its potential influencing factors across Central Asia remains unclear, impeding predictions of ecosystem tipping points under projected warming (Tang et al., 2025).
Based on the above considerations, we employed the Vegetation Sensitivity Index (VSI) within a 15-year moving window to quantify spatiotemporal variations in ecosystem sensitivity to climate variability (temperature, solar radiation, and precipitation), and quantitatively explore the dominant natural factors across Central Asia from 1982 to 2022. This study further quantifies the dominant natural drivers of sensitivity variations along aridity gradients and among vegetation types. By providing a dynamic assessment of vegetation-climate interactions, our work elucidates ecosystem responses to ongoing climate change and identifies vulnerable regions, thereby informing targeted management strategies.
2 Materials and methods
2.1 Study area
Central Asia, occupying the Eurasian continental interior (35°–55°N, 45°–90°E), constitutes the largest arid and semi-arid region in the Northern Hemisphere. Politically, it encompasses five nations—Kazakhstan, Uzbekistan, Turkmenistan, Kyrgyzstan, and Tajikistan—along with China’s Xinjiang Province (Li et al., 2024). Spanning approximately 4.5 million km2, the region is bounded by the Caspian Sea to the west, the Siberian Plain to the north, the Tibetan Plateau to the southeast, and the Iranian Afghan highlands to the south. Its topography exhibits striking heterogeneity, dominated by the Pamir-Tien Shan orogenic belt in the southeast and characterized by the Turan Depression and expansive deserts (e.g., Karakum, Kyzylkum) in the northwestern lowlands (Gummadi et al., 2025). Shaped by pronounced continentality and topographical complexity, Central Asia experiences a temperate continental climate marked by aridity, intense evaporation, and significant temperature variability (Li et al., 2015). As depicted in Figure 1, vegetation cover is diverse and extensive, primarily comprising grasslands (28.8%), alongside shrublands (14.5%), sparse vegetation (14.6%), cultivated fields (18.3%), and forests (1.4%). Collectively, these geographical, climatic, topographical, and vegetative characteristics constitute the unique natural environment of Central Asia, rendering it a significant and focal subject for geographical and climatological research.
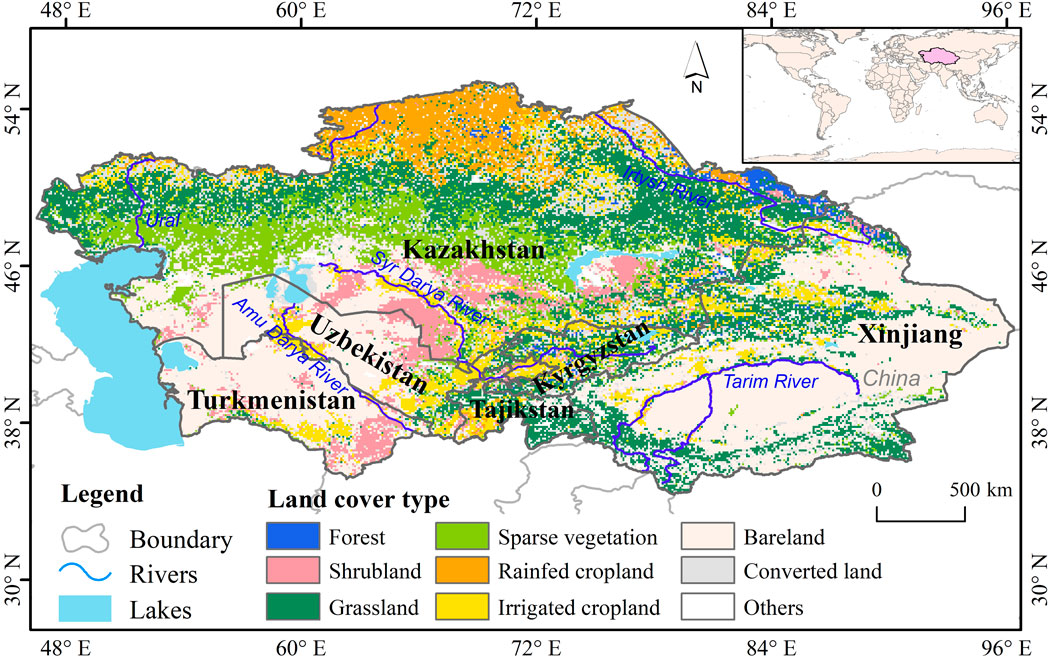
Figure 1. The location and land cover over Central Asia.
2.2 Datasets
2.2.1 NDVI data
The Global Inventory Modeling and Mapping Studies-3rd Generation V1.2 (GIMMS-3G+) dataset for the Normalized Difference Vegetation Index (NDVI) was utilized in this study. This dataset, spanning from 1982 to 2022, has a spatial resolution of 1/12° (approximately 8 km) and a temporal resolution of 15 days (Pinzon et al., 2023). It was assembled from multiple AVHRR sensors and has been adjusted to account for various adverse effects, such as calibration loss, orbital drift, and volcanic eruptions. As one of the longest continuous records of global vegetation productivity, the GIMMS-3G + NDVI dataset is widely used in the remote sensing community and has been extensively applied in numerous studies. The biweekly NDVI data were aggregated into monthly values using the maximum value composite method. Areas dominated by barren land (with a mean NDVI <0.1 across all months) were excluded. Additionally, NDVI values corresponding to air temperatures below zero were filtered out to eliminate potential influences from snow cover.
2.2.2 Climate data
Gridded climate data for monthly mean air temperature (TEM), total precipitation (PRE), solar radiation downwards (SRD) and 2 m dewpoint temperature (DWT) from 1982 to 2022 with a spatial resolution of 0.1°, were obtained from the ERA-5 reanalysis dataset. TEM, PRE, and SRD were used to calculate VSI to investigate the response of vegetation activities to climate variability. Monthly vapor pressure deficit (VPD) for 1982–2022 were calculated using TEM and DWT (Yuan et al., 2019) to explore the relationship between changes in VSI and atmospheric dryness.
2.2.3 Soil moisture data
Monthly surface soil moisture (SM), defined as the ratio of the water volume to the unit soil volume, was also obtained from the ERA5-Land reanalysis to characterize soil moisture conditions from 1982 to 2022. This dataset provides volumetric soil water content at four different depths (0–7 cm, 7–28 cm, 28–100 cm, and 100–289 cm). For this study, we used layer 1 (0–7 cm) as near-surface soil moisture (SM1) and layers 2 (7–28 cm) as sub-surface soil moisture (SM2) (Li et al., 2022) to analyze the water constraints on variations of VSI.
2.2.4 CO2 dataset
The global-scale monthly carbon dioxide concentration dataset (GlobalSimulatedCO2_1992–2020), with a spatial resolution of 2° × 2.5°and spanning from 1992 to 2020, was acquired from the National Earth System Science Data Center. This dataset facilitates the systematic investigation of CO2 spatiotemporal patterns and their interactions with land surface processes at ecosystem-relevant scales.
2.2.5 Land cover data
The land cover product used in this study was sourced from the European Space Agency for the Climate Change Initiative (ESA-CCI) The ESA-CCI-LC dataset features a spatial resolution of 300 × 300 m and covers the period from 1992 to 2020, employing the Land Cover Classification System (LCCS) framework established by the United Nations Food and Agriculture Organization (FAO). Fixed-type pixels corresponding to six vegetation categories—grasslands (GL), shrublands (SL), forests (FR), sparse vegetation (SV), rainfed croplands (RC), and irrigated croplands (CL) (Figure 1) — were extracted to systematically investigate the effects of vegetation type on VSI and its changes.
2.2.6 Aridity index data
The Aridity Index (AI, defined as precipitation/potential evapotranspiration, p/EP), which indicates the environmental water availability, was derived the Global_AI_PET (v.3) database with high-resolution (30 arc-seconds) for the 1970–2000 period. Based on AI, the Central Asia was classified into four climate zones: Arid (AI < 0.2), Semi-arid (0.2 ≤ AI ≤ 0.5), Sub-humid (0.5 ≤ AI ≤ 0.65), and Humid (AI ≥ 0.65) (Supplementary Figure S1).
To ensure compatibility with the spatial resolution of NDVI, all the above datasets were resampled to a 1/12° spatial resolution using a bi-linear interpolation method.
2.3 Method
2.3.1 Vegetation sensitivity index (VSI) estimation and trend analysis
The Vegetation Sensitivity Index (VSI) is an empirical metric designed to quantify the relative sensitivity of vegetation to short-term climate variability (Seddon et al., 2016). This methodology innovatively integrates monthly climate-vegetation relationships within a multivariate framework that incorporates a 1-month lagged Normalized Difference Vegetation Index (NDVI) value to account for ecological memory effects. The VSI computation comprises two elements: the climatic weight, which reflects the relative importance of different climatic factors, and vegetation sensitivity, which measures ecosystem response to climate variability. The expression is as follows:
where VSI is vegetation sensitivity index,
To track temporal changes in vegetation sensitivity, we computed VSI using a 15-year moving window advanced annually throughout the 1982–2022 period. This window size was selected to balance the need for capturing decadal-scale climate variability while maintaining sufficient sample size for robust parameter estimation. The time series was partitioned into 27 overlapping segments (e.g., 1982–1996, 1983–1997), with each computed VSI value assigned to the central year of the window (e.g., 1989 for the 1982–1996 period), generating a continuous annual VSI time series (
2.3.2 Attribution analysis of trends in vegetation sensitivity
Partial correlation analysis, which can effectively eliminate the confounding effects of collinearity among influencing factor variables (Zhang et al., 2024), was used at the pixel level to quantify individual contributions of changes in climate factors (TEM, PRE, SRD and VPD), soil moisture (SM1, SM2), and CO2 concentration to VSI variation. The partial correlation formula was:
where
Due to temporal inconsistencies between the CO2 concentration dataset and other datasets, we restricted the analysis of this portion to 1992–2020 and implemented an 11-year moving window. Specifically, we averaged all factors within each 11-year window to align with the
3 Results
3.1 Spatial pattern of the vegetation sensitivity
The VSI shows a high spatial heterogeneity and generally increases with the aridity index (Figure 2; Supplementary Figure S3). High VSI values (>50) were predominantly observed across the northern plains and southeastern high-altitude regions, primarily within humid, sub-humid and partially semi-arid zones (Figures 2a,b; Supplementary Figure S1). In contrast, lower VSI values (<30) were concentrated in arid zones, forming an east-west band through the central study area and extending into most southwestern regions. Latitudinal statistics (Figure 2b) revealed that VSI was typically high in the high-latitude regions (50°-55°N), while it oscillated around 40 in the 35°–50° regions. Furthermore, vegetation sensitivity varied by biome type (Figure 1, 2a). Forests and shrublands in humid/semi-humid zones, as well as rainfed croplands in semi-arid regions, exhibited heightened sensitivity (higher VSI), while sparse vegetation, grasslands, and shrubs in arid zones demonstrated reduced sensitivity (typically VSI <40). Additionally, the sensitivity of forests, shrublands, grasslands, and irrigated agriculture followed a parabolic response to aridity, whereas rainfed croplands and sparse vegetation displayed an inverted V-shaped response: VSI peaked in semi-arid zones and then declined with increasing moisture (Supplementary Figure S3).
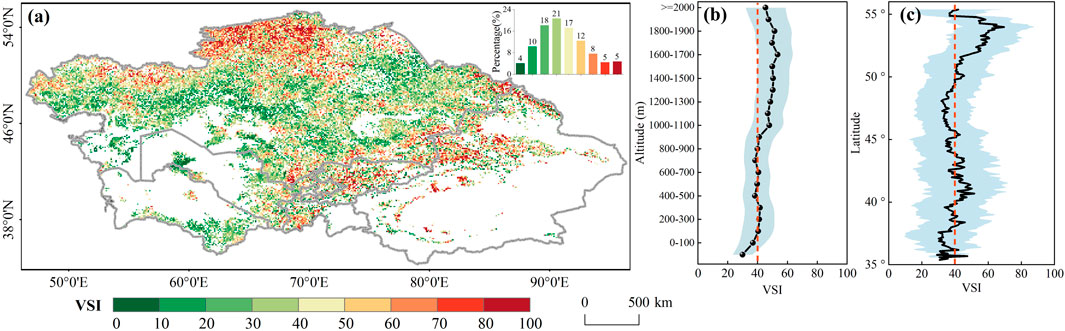
Figure 2. (a) Spatial pattern of VSI values in Central Asia from 1982 to 2022. Corresponding histogram was illustrated in subplot. (b,c) represent altitude and longitudinal averages of the VSI values. The VSI value at 40 was highlighted as the red line and its standard deviation was marked as the shaded areas.
3.2 Spatio-temporal variation of VSI
Temporal analysis using 15-year moving windows revealed a pronounced declining trend in vegetation sensitivity (VSI) across Central Asia throughout the study period, with a more rapid rate of decline observed post-1995 (Figure 3, the rate of change shifting from −0.274 to −0.476). This downward trend persisted across both 11-year and 19-year moving windows, despite variations in the magnitude of relative values, thus confirming the robustness of the trend (Supplementary Figure S2). Notably, this persistent decline was also evident in the radiation-excluded VSI series, which was derived solely from temperature and precipitation variables (solar radiation components removed to isolate the effects of Earth dimming; Supplementary Figure S4). Spatially, 82.0% of vegetated areas exhibited a reduction in interannual VSI variability (with 49% showing significant change at p < 0.05), indicating increasing vegetation adaptation to climate variability over time. Conversely, VSI increases were observed in approximately 18.0% of vegetated areas, displaying sporadic distribution without significant spatial clustering (Figure 3).
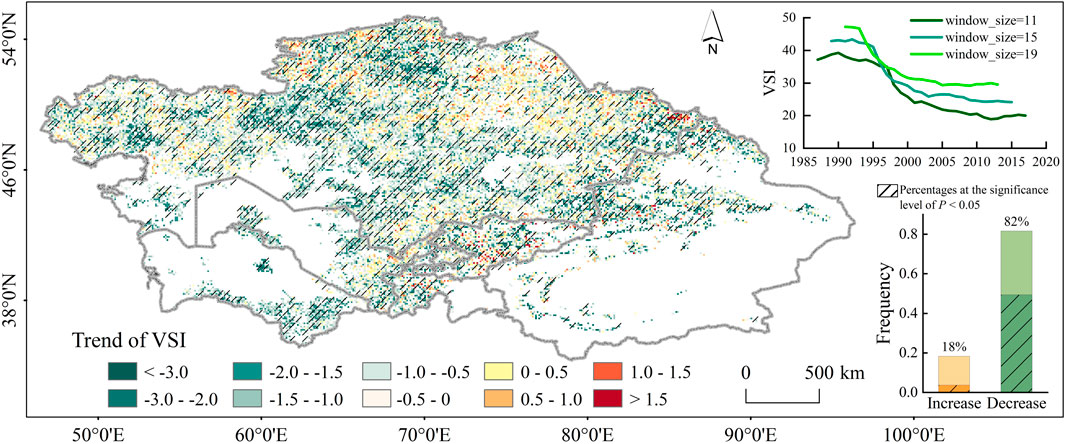
Figure 3. Spatial pattern of VSI trend. Pixels labeled with black slash suggest significant trends (p < 0.05). The line plot depicts the use of 11-year, 15-year, and 19-year moving windows to evaluate the robustness of VSI trends to window size selection. The bar charts represent the areal proportion of regions with increasing/decreasing VSI trends, where the slash denotes statistically significant changes.
Across all climatic zones and vegetation types, VSI exhibited declining trends with notable spatial heterogeneity (Figure 4). Distinct temporal patterns emerged among climatic regions: humid zones showed VSI increases until 1995, in contrast to other zones, followed by accelerated declines from 1995 to 2003. After 2003, a divergence occurred, with humid and semi-humid zones transitioning to increasing trends, while arid zones continued to experience declines (Figure 4a). Specifically, the arid zone had the highest proportion of decreasing VSI trends (83.6% of the area), followed by the humid zone (83.3%), with semi-arid and sub-humid zones showing decreases in 76.6% and 73.3% of the area, respectively (Figure 4b). Among vegetation types, shrubs and sparse vegetation exhibited the most pronounced decreasing trends, with over 87% coverage for both. In contrast, forests, rainfed croplands, and grasslands each exhibited increasing VSI trends in more than 20% of pixels (Figure 4c).
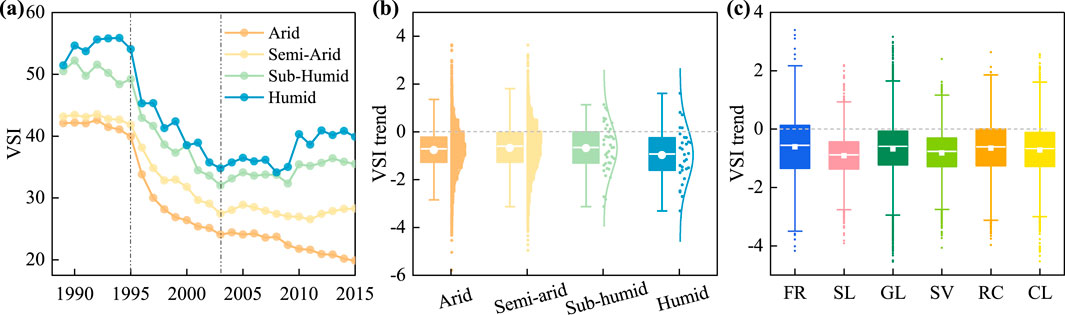
Figure 4. VSI trends for (a,b) different climate zones and (c) vegetation types.
3.3 Drivers of trend shifts in VSI
Partial correlation analysis revealed distinct spatial heterogeneity in dominant natural factors influencing VSI variations (Figure 5). Statistically, atmospheric CO2 concentration and temperature emerged as primary determinants, each with divergent ecological effects. Elevated CO2 was associated with reduced VSI, likely through enhanced photosynthetic efficiency and water-use optimization under fertilization effects. In contrast, temperature exhibited positive correlations with VSI, suggesting that warming exacerbates vegetation vulnerability to climatic perturbations. This pattern held consistently across climate zones and vegetation types, with exceptions in sub-humid regions and irrigated croplands (Table 1). Specifically, temperature-driven VSI variation accounted for 19.6% of vegetated areas, showing a homogeneous spatial distribution concentrated in north-central Kazakhstan. CO2-dominated areas (17.2% of the domain) were primarily found in grasslands and sparse vegetation in Kazakhstan’s arid and semi-arid regions (Figure 5; Table 1). Hydrological factors also played a strong regional role: surface soil moisture (SM1) and deep soil moisture (SM2) explained VSI variations in 23.1% of cases, particularly along the fluvial corridors of the Irtysh, Syr Darya, and Ural Rivers, which serve as transition zones between vegetation types. Precipitation influenced 14.6% of vegetated areas, mainly affecting grasslands. Notably, spatial coupling was observed between vapor pressure deficit (VPD) and temperature dominance zones, reflecting thermodynamic interactions where warming increases saturated vapor pressure and amplifies atmospheric water demand.
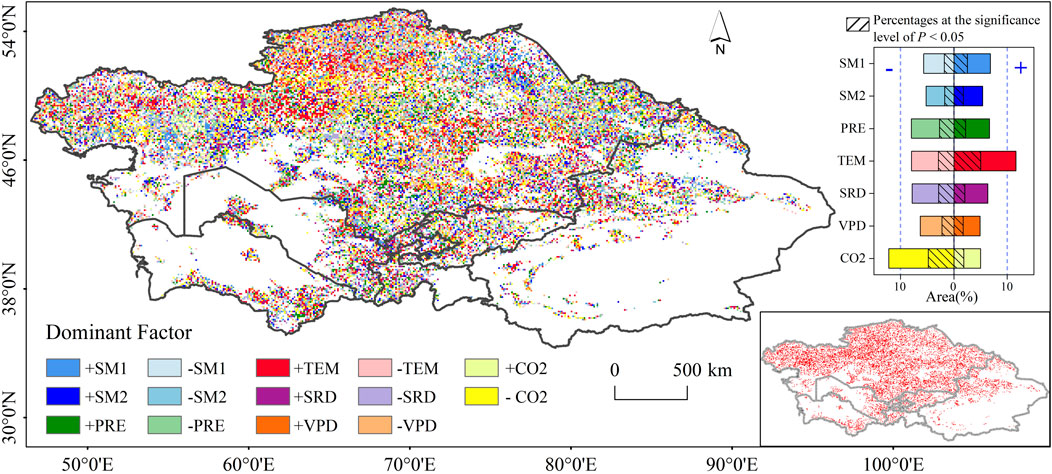
Figure 5. Spatial pattern of dominant drivers of VSI change in the period of 1992–2020. Histogram on the right indicates the percentage of area occupied by each dominant factor. The insets map in lower right represents the significance at the level of 0.05.
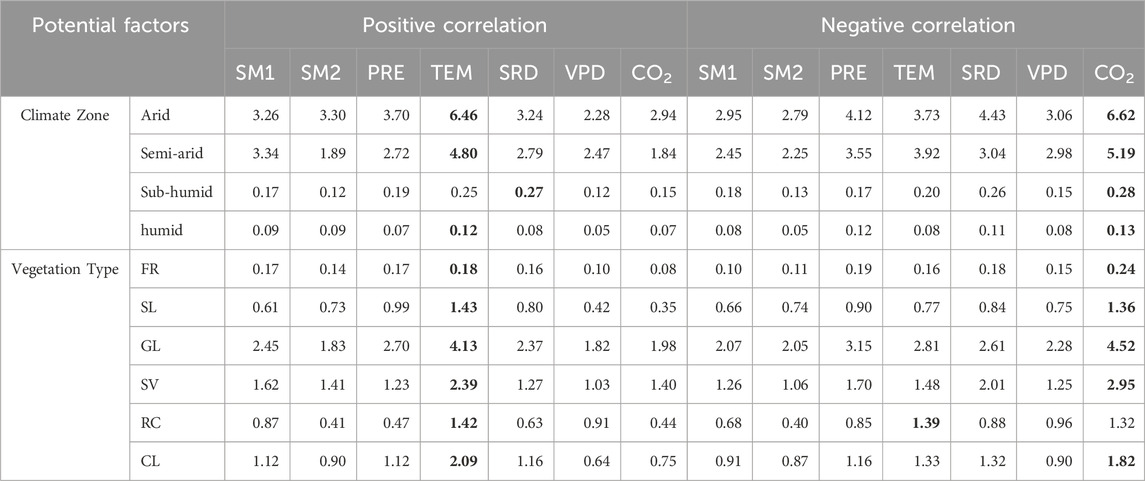
Table 1. The area proportion of the driving factors that dominate VSI changes in different climate zones and vegetation types (%). Bold numbers indicate the maximum area proportion.
4 Discussion
Using VSI as a metric, we observed pronounced spatial heterogeneity in vegetation sensitivity to short-term climate variability across Central Asia, with VSI positively correlated with the aridity index (Figure 2; Supplementary Figure S3). This finding aligns with regional studies (Yuan et al., 2021) and global patterns where Central Asia exhibits characteristic sensitivity profiles (Seddon et al., 2016; Chen et al., 2024). Forests and shrubs in humid environments showed the highest VSI values, followed by rainfed croplands in semi-arid regions, while the lowest sensitivity was observed in arid areas dominated by grasslands and sparse vegetation. This gradient reflects greater climate sensitivity in woody communities compared to herbaceous ones—a pattern that has been consistently documented (Zhu et al., 2019; Chen et al., 2024; Wu et al., 2024). Such patterns are likely the result of evolutionary adaptations in herbaceous plants to arid and semi-arid conditions, including low canopy structures and deep root systems that enable these species to withstand environmental extremes (Lindh et al., 2014; Chen et al., 2024). Forests, however, exhibit heightened vulnerability to both climate change and anthropogenic pressures, as has been widely reported (Chen et al., 2024; Wu et al., 2024).
Our analysis revealed a widespread decline in vegetation sensitivity (VSI) across Central Asia from 1982 to 2022, with 82% of vegetated areas exhibiting significant desensitization (Figure 3; Supplementary Figure S2). This pattern remained robust under multiple methodological validations, including modified moving-window sizes (11- and 19-year) and exclusion of radiation variables (Supplementary Figures S2, S4), reinforcing the reliability of the observed trend. Although this declining trend may appear counterintuitive given the documented intensification of climatic extremes, it aligns with emerging global-scale studies reporting a decoupling between vegetation growth and aridity in drylands (Zeng et al., 2022; Zhang et al., 2023), suggesting that declining sensitivity may reflect complex ecosystem adjustments rather than solely degradation or resilience. The observed widespread desensitization may be largely attributed to the CO2 fertilization effect, which enhances plant water-use efficiency and alleviates moisture limitation, thereby reducing climatic constraints on vegetation growth (Ueyama et al., 2020; Zhang et al., 2023; Zhou et al., 2024). In addition, long-term evolutionary adaptations in dryland flora—such as adjustments in root architecture, phenological shifts, and physiological acclimation—may have further strengthened their capacity to cope with concurrent heat and water stress (Peguero-Pina et al., 2020). Human interventions, including cropland expansion and water management practices, could also contribute to this desensitization by altering local water availability and vegetation composition (Tripathi et al., 2024; Rodriguez-Lozano et al., 2025). It is important to note that these mechanisms are not mutually exclusive and may operate concurrently across different regions. It is noteworthy that our findings contrast with those of Chen et al. (2024), who reported increasing sensitivity in some arid regions. This discrepancy may arise from differences in study periods, spatial resolutions, or methodological frameworks, highlighting the context-dependent nature of vegetation-climate feedbacks and the need for region-specific analyses. Additionally, increased climate sensitivity was detected in some forests in high-altitude mountainous areas, suggesting that rapid hydrothermal changes could threaten forest sustainability under continued warming (Wu et al., 2024). Rainfed croplands also exhibited greater VSI increases compared to irrigated systems, pointing to heightened climate vulnerability in key agricultural zones. This disparity emphasizes how management interventions, such as hybridization, irrigation, and fertilization, can attenuate climatic impacts on croplands, thereby reducing threats to food security (Wang et al., 2020; Yu et al., 2022). Nonetheless, the VSI is fundamentally a statistical measure of climate-vegetation coupling strength. Therefore, this observed decline in sensitivity does not universally signify enhanced ecosystem resilience; it could also indicate diminished responsiveness due to a loss of reactive biomass, and this duality warrants careful consideration.
Relative importance analysis indicated that the primary drivers of the observed VSI declines were elevated atmospheric CO2 concentrations and improvements in water availability (e.g., precipitation and soil moisture), although ongoing warming continued to constrain vegetation responses (Figure 5). Rising CO2 levels enhance photosynthesis activity and improve drought resistance through fertilization effects, contributing significantly to the widespread greening observed after 2000 (Guo et al., 2023; Li et al., 2023; Yin et al., 2023; Zeng et al., 2023). Conversely, warming increases evapotranspiration and exacerbates water stress, reducing climate resilience (Zhou et al., 2019; Wang et al., 2024). Furthermore, higher temperatures intensify vegetation sensitivity to soil moisture, compounding water and energy stress and destabilizing ecosystems (Wang et al., 2023). Despite this, declines in VSI in temperature-sensitive regions suggest that CO2 fertilization and plant acclimatization may mitigate some of the thermal stress (Chen et al., 2024). Water availability emerged as the dominant driver of VSI trends across 37.8% of Central Asia’s vegetated area, where variations in water inputs strongly influenced drought stress and vegetation-climate coupling (Zeng et al., 2022; Wang et al., 2023). Vapor pressure deficit (VPD) showed limited influence, likely due to counteracting interactions among its indirect effects, CO2-induced stomatal closure, and warming-related stress. Collectively, these drivers influence vegetation sensitivity through multiple pathways: CO2-mediated photosynthetic regulation, plant water demand management, and heat stress amplification under warming (Chen et al., 2024).
These findings enhance our understanding of vegetation–climate interactions and provide valuable insights for conservation prioritization in Central Asia. However, several limitations should be considered. First, the temporal scope of this study (1982–2022) may not fully capture the temporal evolution of vegetation–climate sensitivity across different historical periods (Tang et al., 2025). Second, while partial correlation analysis helps isolate individual drivers, high collinearity among climatic variables remains a challenge for unequivocal attribution. Third, the analysis focused primarily on climatic and CO2 influences, and did not explicitly account for other potential modulating factors such as soil properties, plant functional traits, and detailed land-use history, all of which may interact to shape vegetation responses to climate variability (Gessner et al., 2013; Yuan et al., 2022). Future studies incorporating dynamic vegetation models and higher-resolution anthropogenic data could help disentangle these complex interactions.
5 Conclusion
This study investigated the spatio-temporal dynamics of vegetation sensitivity to climate variability—quantified using the Vegetation Sensitivity Index (VSI) — across Central Asia and identified the underlying driving mechanisms. Overall, our results demonstrated a widespread decline in vegetation sensitivity (VSI) throughout the region between 1982 and 2022, with the most pronounced decreases observed in moisture-limited (arid) and energy-limited (humid) systems. The dominant drivers exhibited considerable spatial heterogeneity: elevated CO2 exerted a dampening effect on sensitivity in 17.2% of vegetated areas, whereas warming enhanced VSI in 19.6% of the region. Soil moisture was critical in watersheds and ecotones, while precipitation primarily governed the sensitivity of grasslands. Notably, forests and shrubs in high-altitude humid zones, along with rainfed croplands in semi-arid regions, showed heightened sensitivity, highlighting the vulnerability of these ecosystems. The overall decline in VSI suggests that vegetation–climate coupling has not intensified under global warming, likely attributable to compensatory mechanisms such as CO2 fertilization, climate adaptation strategies, and region-specific land management. These findings highlight the importance of integrating natural and anthropogenic factors into ecosystem resilience strategies in this climate-sensitive region. Future work should focus on quantifying the contribution of human interventions and projecting how these compensatory mechanisms might evolve under more severe climate scenarios.
Data availability statement
The original contributions presented in the study are included in the article/Supplementary Material, further inquiries can be directed to the corresponding author.
Author contributions
PJ: Formal Analysis, Funding acquisition, Methodology, Validation, Writing – original draft. YZ: Supervision, Validation, Writing – review and editing. TW: Data curation, Resources, Software, Writing – original draft. KG: Data curation, Resources, Writing – original draft.
Funding
The author(s) declare that financial support was received for the research and/or publication of this article. This research was supported by the National Natural Science Foundation of China (No. 42461014), the Natural Science Foundation of Xinjiang Uygur Autonomous Region (No. 2024D01A87) and the Open Fund Program for Xinjiang Key Laboratory of Water Cycle and Utilization in Arid Zone (No. XJYS0907-2023-1). The National Natural Science Foundation of China’s role: provided the primary funding for materials and personnel. The Natural Science Foundation of Xinjiang Uygur Autonomous Region and the Open Fund Program for Xinjiang Key Laboratory of Water Cycle and Utilization in Arid Zone’s role: supported the data analysis phase of the project.
Conflict of interest
The authors declare that the research was conducted in the absence of any commercial or financial relationships that could be construed as a potential conflict of interest.
Generative AI statement
The author(s) declare that no Generative AI was used in the creation of this manuscript.
Any alternative text (alt text) provided alongside figures in this article has been generated by Frontiers with the support of artificial intelligence and reasonable efforts have been made to ensure accuracy, including review by the authors wherever possible. If you identify any issues, please contact us.
Publisher’s note
All claims expressed in this article are solely those of the authors and do not necessarily represent those of their affiliated organizations, or those of the publisher, the editors and the reviewers. Any product that may be evaluated in this article, or claim that may be made by its manufacturer, is not guaranteed or endorsed by the publisher.
Supplementary material
The Supplementary Material for this article can be found online at: https://www.frontiersin.org/articles/10.3389/fenvs.2025.1652080/full#supplementary-material
References
Chen, J., Yang, H., Jin, T., and Wu, K. (2024). Assessment of terrestrial ecosystem sensitivity to climate change in arid, semi-arid, sub-humid, and humid regions using EVI, LAI, and SIF products. Ecol. Indic. 158, 111511. doi:10.1016/j.ecolind.2023.111511
Davi, N. K., D'Arrigo, R., Jacoby, G. C., Cook, E. R., Anchukaitis, K. J., Nachin, B., et al. (2015). A long-term context (931–2005 C.E.) for rapid warming over central Asia. Quat. Sci. Rev. 121, 89–97. doi:10.1016/j.quascirev.2015.05.020
Fallah, B., Russo, E., Menz, C., Hoffmann, P., Didovets, I., and Hattermann, F. F. (2023). Anthropogenic influence on extreme temperature and precipitation in Central Asia. Sci. Rep. 13, 6854. doi:10.1038/s41598-023-33921-6
Fu, Z., Ciais, P., Wigneron, J. P., Gentine, P., Feldman, A. F., Makowski, D., et al. (2024). Global critical soil moisture thresholds of plant water stress. Nat. Commun. 15, 4826. doi:10.1038/s41467-024-49244-7
Gessner, U., Naeimi, V., Klein, I., Kuenzer, C., Klein, D., and Dech, S. (2013). The relationship between precipitation anomalies and satellite-derived vegetation activity in Central Asia. Glob. Planet. Change 110, 74–87. doi:10.1016/j.gloplacha.2012.09.007
Gummadi, S., Samineni, S., and Lopez-Lavalle, L. A. B. (2025). Assessing high-resolution precipitation extremes in Central Asia: evaluation and future projections. Clim. Change 178, 29. doi:10.1007/s10584-025-03872-0
Guo, W., Huang, S., Huang, Q., Leng, G., Mu, Z., Han, Z., et al. (2023). Drought trigger thresholds for different levels of vegetation loss in China and their dynamics. Agric. For. Meteorology 331, 109349. doi:10.1016/j.agrformet.2023.109349
Jiang, J., Zhou, T., Chen, X., and Zhang, L. (2020). Future changes in precipitation over Central Asia based on CMIP6 projections. Environ. Res. Lett. 15, 054009. doi:10.1088/1748-9326/ab7d03
Jiang, P., Ding, W., Yuan, Y., Ye, W., and Mu, Y. (2022). Interannual variability of vegetation sensitivity to climate in China. J. Environ. Manag. 301, 113768. doi:10.1016/j.jenvman.2021.113768
Li, Z., Chen, Y., Li, W., Deng, H., and Fang, G. (2015). Potential impacts of climate change on vegetation dynamics in Central Asia. J. Geophys. Res. Atmos. 120, 12345–12356. doi:10.1002/2015jd023618
Li, W., Migliavacca, M., Forkel, M., Denissen, J. M. C., Reichstein, M., Yang, H., et al. (2022). Widespread increasing vegetation sensitivity to soil moisture. Nat. Commun. 13, 3959. doi:10.1038/s41467-022-31667-9
Li, S., Wang, G., Zhu, C., Lu, J., Ullah, W., Fiifi Tawia Hagan, D., et al. (2023). Vegetation growth due to CO2 fertilization is threatened by increasing vapor pressure deficit. J. Hydrology 619, 129292. doi:10.1016/j.jhydrol.2023.129292
Li, J., Han, W., Zheng, J., Yu, X., Tian, R., Liu, L., et al. (2024). Grassland productivity in arid Central Asia depends on the greening rate rather than the growing season length. Sci. Total Environ. 933, 173155. doi:10.1016/j.scitotenv.2024.173155
Lindh, M., Zhang, L., Falster, D., Franklin, O., and Brännström, Å. (2014). Plant diversity and drought: the role of deep roots. Ecol. Model. 290, 85–93. doi:10.1016/j.ecolmodel.2014.05.008
Mann, H. B. (1945). Nonparametric tests against trend. Econ. J. Econ. Soc. 13, 245–259. doi:10.2307/1907187
Peguero-Pina, J. J., Vilagrosa, A., Alonso-Forn, D., Ferrio, J. P., Sancho-Knapik, D., and Gil-Pelegrín, E. (2020). Living in drylands: functional adaptations of trees and shrubs to cope with high temperatures and water scarcity. Forests 11, 1028. doi:10.3390/f11101028
Peng, D., Zhou, T., Zhang, L., Zhang, W., and Chen, X. (2020). Observationally constrained projection of the reduced intensification of extreme climate events in Central Asia from 0.5 °C less global warming. Clim. Dyn. 54, 543–560. doi:10.1007/s00382-019-05014-6
Pinzon, J. E., Pak, E. W., Tucker, C. J., Bhatt, U. S., Frost, G. V., and Macander, M. J. (2023). Global vegetation greenness (NDVI) from AVHRR GIMMS-3G+, 1981-2022. Oak Ridge, Tennessee: ORNL Distributed Active Archive Center.
Rodriguez-Lozano, B., Rodriguez-Caballero, E., and Canton, Y. (2025). Resource redistribution mediated by hydrological connectivity modulates vegetation response to aridification in drylands. Ecography 2025, e07650. doi:10.1111/ecog.07650
Seddon, A. W. R., Macias-Fauria, M., Long, P. R., Benz, D., and Willis, K. J. (2016). Sensitivity of global terrestrial ecosystems to climate variability. Nature 531, 229–232. doi:10.1038/nature16986
Sen, P. K. (1968). Estimates of the regression coefficient based on kendall's tau. J. Am. Stat. Assoc. 63 (324), 1379–1389. doi:10.2307/2285891
Su, Y., Chen, S., Li, X., Ma, S., Xie, T., Wang, J., et al. (2023). Changes in vegetation greenness and its response to precipitation seasonality in Central Asia from 1982 to 2022. Environ. Res. Lett. 18, 104002. doi:10.1088/1748-9326/acf58e
Tang, J., Niu, B., Fu, G., Peng, J., Hu, Z., and Zhang, X. (2025). Shifted trend in drought sensitivity of vegetation productivity from 1982 to 2020. Agric. For. Meteorology 362, 110388. doi:10.1016/j.agrformet.2025.110388
Tripathi, I. M., Mahto, S. S., Kushwaha, A. P., Kumar, R., Tiwari, A. D., Sahu, B. K., et al. (2024). Dominance of soil moisture over aridity in explaining vegetation greenness across global drylands. Sci. Total Environ. 917, 170482. doi:10.1016/j.scitotenv.2024.170482
Ueyama, M., Ichii, K., Kobayashi, H., Kumagai, T. o., Beringer, J., Merbold, L., et al. (2020). Inferring CO2 fertilization effect based on global monitoring land-atmosphere exchange with a theoretical model. Environ. Res. Lett. 15, 084009. doi:10.1088/1748-9326/ab79e5
Wang, L., Tian, F., Huang, K., Wang, Y., Wu, Z., Fensholt, R., et al. (2020). Asymmetric patterns and temporal changes in phenology-based seasonal gross carbon uptake of global terrestrial ecosystems. Glob. Ecol. Biogeogr. 13084.
Wang, X., Zhao, F., and Wu, Y. (2023). Increased response of vegetation to soil moisture in the northern hemisphere drylands. Front. Earth Sci. 11, 1144410. doi:10.3389/feart.2023.1144410
Wang, Y., Peng, L., Yue, Y., and Chen, T. (2024). Global vegetation-temperature sensitivity and its driving forces in the 21st century. Earth's Future 12, 2022EF003395. doi:10.1029/2022ef003395
Wu, K., Hu, Z., Wang, X., Chen, J., Yang, H., and Yuan, W. (2024). Widespread increase in sensitivity of vegetation growth to climate variability on the Tibetan Plateau. Agric. For. Meteorology 358, 110260. doi:10.1016/j.agrformet.2024.110260
Yin, J., Gentine, P., Slater, L., Gu, L., Pokhrel, Y., Hanasaki, N., et al. (2023). Future socio-ecosystem productivity threatened by compound drought–heatwave events. Nat. Sustain. 6, 259–272. doi:10.1038/s41893-022-01024-1
Yu, T., Jiapaer, G., Bao, A., Zheng, G., Zhang, J., Li, X., et al. (2022). Disentangling the relative effects of soil moisture and vapor pressure deficit on photosynthesis in dryland Central Asia. Ecol. Indic. 137, 108698. doi:10.1016/j.ecolind.2022.108698
Yuan, W., Zheng, Y., Piao, S., Ciais, P., Lombardozzi, D., Wang, Y., et al. (2019). Increased atmospheric vapor pressure deficit reduces global vegetation growth. Sci. Adv. 5, eaax1396. doi:10.1126/sciadv.aax1396
Yuan, Y., Bao, A., Liu, T., Zheng, G., Jiang, L., Guo, H., et al. (2021). Assessing vegetation stability to climate variability in Central Asia. J. Environ. Manag. 298, 113330. doi:10.1016/j.jenvman.2021.113330
Yuan, Y., Bao, A., Jiang, P., Hamdi, R., Termonia, P., De Maeyer, P., et al. (2022). Probabilistic assessment of vegetation vulnerability to drought stress in Central Asia. J. Environ. Manag. 310, 114504. doi:10.1016/j.jenvman.2022.114504
Zeng, X., Hu, Z., Chen, A., Yuan, W., Hou, G., Han, D., et al. (2022). The global decline in the sensitivity of vegetation productivity to precipitation from 2001 to 2018. Glob. Change Biol. 28, 6823–6833. doi:10.1111/gcb.16403
Zeng, Z., Wu, W., Li, Y., Huang, C., Zhang, X., Peñuelas, J., et al. (2023). Increasing meteorological drought under climate change reduces terrestrial ecosystem productivity and carbon storage. One Earth 6, 1326–1339. doi:10.1016/j.oneear.2023.09.007
Zhang, G., He, Y., Huang, J., Fu, L., Han, D., Guan, X., et al. (2023). Divergent sensitivity of vegetation to aridity between drylands and humid regions. Sci. Total Environ. 884, 163910. doi:10.1016/j.scitotenv.2023.163910
Zhang, Z., Ma, X., Maeda, E. E., Lu, L., Wang, Y., Xie, Z., et al. (2024). Satellite observed dryland greening in Asian endorheic basins: drivers and implications to sustainable development. Sci. Total Environ. 922, 171216. doi:10.1016/j.scitotenv.2024.171216
Zhao, Y., Jiang, Q., and Wang, Z. (2025). Nonlinear spatiotemporal variability of gross primary production in China's terrestrial ecosystems under water energy constraints. Environ. Res. 269, 120919. doi:10.1016/j.envres.2025.120919
Zhou, S., Zhang, Y., Williams, A. P., and Gentine, P. (2019). Projected increases in intensity, frequency, andterrestrial carbon costs of compound drought andaridity events. Sci. Adv. 5 (1), eaau5740. doi:10.1126/sciadv.aau5740
Zhou, W., Li, C., Fu, B., Wang, S., Ren, Z., and Stringer, L. C. (2024). Changes and drivers of vegetation productivity in China’s drylands under climate change. Environ. Res. Lett. 19, 114001. doi:10.1088/1748-9326/ad7a0e
Keywords: climate variability, vegetation sensitivity, spatiotemporal variations, potential mechanisms, Central Asia
Citation: Jiang P, Zhang Y, Wang T and Guzainuer K (2025) Widespread declining in vegetation climate sensitivity across Central Asia. Front. Environ. Sci. 13:1652080. doi: 10.3389/fenvs.2025.1652080
Received: 23 June 2025; Accepted: 15 October 2025;
Published: 24 October 2025.
Edited by:
Cheikh Mbow, Centre de Suivi Ecologique, SenegalReviewed by:
Xiaolu Tang, Chengdu University of Technology, ChinaJunqiang Yao, China Meteorological Administration, China
Copyright © 2025 Jiang, Zhang, Wang and Guzainuer. This is an open-access article distributed under the terms of the Creative Commons Attribution License (CC BY). The use, distribution or reproduction in other forums is permitted, provided the original author(s) and the copyright owner(s) are credited and that the original publication in this journal is cited, in accordance with accepted academic practice. No use, distribution or reproduction is permitted which does not comply with these terms.
*Correspondence: Yue Zhang, emhhbmd5dWV4aW5qaWFuZ0AxNjMuY29t