 Bin Liu
- Shanxi Academy of Social Sciences, Taiyuan, China
Nitrogen (N) and phosphorus (P) are essential limiting nutrients in dryland ecosystems, yet their storage and spatial patterns at regional scales remain poorly understood. This study aims to quantify the stocks and spatial distribution of soil and vegetation N and P across China’s drylands and to identify the dominant environmental drivers. Based on N and P density data from 4,200 soil and vegetation samples, along with environmental variables, we applied and evaluated four machine learning models. The random forest (RF) model demonstrated the best predictive performance and was selected for spatial prediction, achieving the highest R2 values (0.89, 0.92, 0.95, and 0.94) and the lowest MAE (3.21, 0.56, 5.37, and 2.23) and RMSE (5.09, 0.79, 7.05, and 2.98) for STN, STP, VTN, and VTP, respectively. The estimated stocks in the 0–30 cm soil layer across the entire dryland were 1111.4 Tg for soil total N (STN), 504.9 Tg for soil total P (STP), 17.6 Tg for vegetation total N (VTN), and 1.7 Tg for vegetation total P (VTP), all showing strong spatial heterogeneity. Spatial, climatic, soil, and vegetation variables together explained 42.2%, 37.6%, 33.9%, and 28.2% of the variance in STN, STP, VTN, and VTP, respectively. Soil properties—especially soil water content and sand content—were the primary factors regulating STN and STP variation, while climate, particularly mean annual precipitation, dominated the variation in VTN and VTP. This study provides critical baseline data for nutrient management and ecological restoration in dryland ecosystems.
1 Introduction
Nitrogen (N) and phosphorus (P) in soil and vegetation are the essential nutrients that sustain ecosystem productivity. N is a key component in the synthesis of plant proteins, chlorophyll, and nucleic acids, directly influencing photosynthesis and growth rates (Yuan and Chen, 2015; Zhang et al., 2019); P is an essential element for adenosine triphosphate (ATP), deoxyribonucleic acid (DNA), and cell membrane phospholipids, participating in energy transfer and genetic information expression (Elser et al., 2007; Vincent et al., 2012; Zhang et al., 2021). The availability of N and P in soil is often considered a limiting factor for plant growth. For example, low-N soils inhibit leaf expansion, while P deficiency leads to poor root development (Cleveland et al., 2011). In natural ecosystems, N enters the soil cycle through biological N fixation and organic matter mineralization, while P relies on rock weathering for release. Its slow recycling rate means that 43% of global terrestrial vegetation is P-limited (Du et al., 2020). Human activities (such as fertilizer application) can temporarily increase soil N and P levels, but excessive inputs disrupt nutrient balance and trigger environmental issues like water eutrophication (Zhang et al., 2012). Therefore, optimizing soil N and P management is crucial for maintaining vegetation productivity and ecosystem sustainability.
Drylands (including hyperarid, arid, semiarid, and dry subhumid areas) are water-scarce and drought-prone areas where the aridity index (defined as the ratio of mean annual precipitation to potential evapotranspiration) is less than 0.65 (Smith et al., 2019). Drylands are typical areas of water-heat imbalance on the Earth’s surface. Over the past decade or so, the global area of drylands has been expanding rapidly. According to research results from 2005, drylands accounted for approximately 41% of the Earth’s land surface (Cherlet et al., 2018). Recently, Prăvălie et al. (2019) conducted a diachronic analysis using databases and found that the current global dryland area is nearly 4% larger than expected, covering 45.4% of Earth’s land surface. This net increase in global dryland area is attributed to the expansion of arid (+3.4%) and semiarid (+0.9%) regions (Prăvălie et al., 2019). Recent studies indicate that China has 6.6 million km2 of drylands, supporting approximately 580 million people, with these drylands at constant risk of desertification (Li et al., 2021; Zhang et al., 2025). Due to ongoing global warming and changes in rainfall patterns, the area of China’s drylands may further expand (Zhang et al., 2023). The importance of drylands in China is reflected in multiple dimensions: ecologically, China’s drylands host unique desert-oasis composite ecosystems, such as the Taklamakan Desert and the Hexi Corridor oasis, which are both biodiversity hotspots (such as endangered species like wild camels and saxual forests) and important carbon sinks and dust source-sink regulation zones; economically, the northwestern arid regions contribute over 60% of China’s wind and solar energy resources and critical mineral stock (such as oil, gas, and lithium deposits in Xinjiang), while also supporting specialty agriculture (such as Ningxia goji berries and Xinjiang cotton); culturally and socially, the drylands serve as the core carriers of Silk Road cultural heritage, home to ethnic groups like the Uyghur and Mongolian peoples, whose traditional ecological wisdom (such as karez irrigation systems) offers insights for drought adaptation (Li et al., 2016). Therefore, strengthening research on drylands holds significant scientific value and practical significance for promoting regional agricultural sustainable development and coordinated socio-economic development.
In drylands, N and P are the crucial limiting elements for plant growth and soil function maintenance, but their distribution and cycling processes are significantly regulated by environmental factors, exhibiting strong spatial heterogeneity. Under drought stress, N, as a key component in plant protein and chlorophyll synthesis, directly influences photosynthetic efficiency and stress tolerance (Vitousek and Howarth, 1991); P, through regulating energy metabolism (such as ATP synthesis) and root development, alleviates osmotic stress caused by drought (Elser et al., 2007). However, the availability of N and P in soils is highly dependent on local environmental conditions: for example, the potential nitrogen mineralization and nitrification rates in soil increase significantly with increasing precipitation (Feyissa et al., 2021); P distribution is closely associated with the degree of parent material weathering. In calcareous soils, P is easily fixed, resulting in effective P content in the oasis margins of the Tarim Basin being only one-third of that in the Loess Plateau region (Li et al., 2018). Additionally, wind erosion, salinization, and human activities (such as irrigation agriculture) further exacerbate the spatial differentiation of N and P, forming a “oasis enrichment-desert impoverishment” dichotomous pattern. Although local studies on soil N and P have been relatively extensive (Zhang et al., 2021; He et al., 2021; Zhang et al., 2025), the coupling mechanisms of N and P in arid ecosystems at the cross-regional scale remain unclear—existing data are mostly concentrated on single vegetation types or soils, lacking relevant studies on the entire terrestrial ecosystem. This knowledge gap limits the precise restoration of degraded arid ecosystems. For example, in afforestation projects for windbreak and sand fixation, neglecting the spatial configuration of N and P may lead to large-scale die-off of artificial vegetation due to nutrient imbalance. Therefore, integrating multi-scale observations and model simulations to reveal the driving mechanisms and ecological effects of N and P patterns in arid regions is a key scientific question for enhancing the efficiency of resource management in arid areas.
The objectives of the study were to: (1) to estimate the N and P stock in dryland ecosystems and map the distribution patterns of N and P in dryland ecosystems; (2) to identify the driving factors of N and P changes in dryland ecosystems. The results of this study will establish the first comprehensive N and P stock database for drylands. This will support precise policy implementation and sustainable land management for ecological restoration in arid regions under the “Dual carbon target” (China’s national commitment to achieving peak carbon emissions by 2030 and carbon neutrality by 2060).
2 Materials and methods
2.1 Study region
China’s drylands are primarily located in the northwestern inland areas and the northern part of the Qinghai-Tibet Plateau, covering provinces and regions such as Xinjiang, Inner Mongolia, Ningxia, Gansu, and Qinghai (Figure 1). Figure 1 depicts the spatial extent of China’s drylands, highlighting the distribution of major basins (e.g., Tarim, Junggar, Qaidam), deserts, and the division into temperate and high-altitude arid zones. The total area spans approximately 6.6 million km2, accounting for 69% of the country’s total land area. This makes it the largest and most complex arid region in the mid-latitude zone globally (Li et al., 2021). According to the United Nations Environment Programme (UNEP) Aridity Index (AI < 0.65), China’s drylands can be divided into temperate arid zones (such as the Tarim Basin and Junggar Basin) and high-altitude arid zones (such as the Qaidam Basin and northern Tibet Plateau). Annual precipitation ranges from 400 mm in the eastern semiarid zones to less than 50 mm in the western hyperarid zones, while evaporation rates reach as high as 2,000–3,000 mm. The predominant ecosystem types are deserts, desert grasslands, and mountain-oasis composite systems, with desert areas accounting for 45.3% of the total drylands, including mobile sand dunes, deserts, and saline-alkali lands. This region is a special adaptation zone for biodiversity, featuring arid plant communities such as Populus euphratica and Haloxylon ammodendron, as well as endemic species like the wild camel (Camelus ferus) and the Gazella subgutturosa.
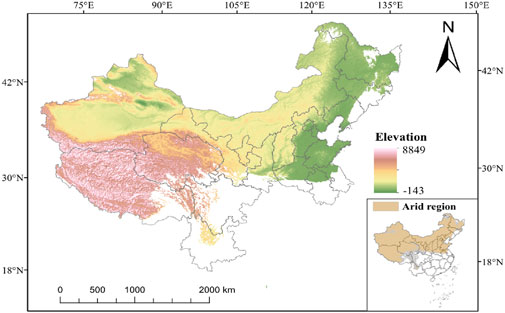
Figure 1. Generalized map of the study region.
2.2 Data sources
2.2.1 N and P density in vegetation and soil according to the collection
Data on N and P density in vegetation and soil (0–30 cm depth) were obtained from “Patterns of N and P pools in terrestrial ecosystems in China” (Zhang et al., 2021). Each raster of this dataset contains 6,004,371 grids (1 × 1 km), except for the deep soil nutrient concentration and stem nutrient files. Values are the average density (t ha−1) or concentration (g kg−1) predicted from 100 replications using random forests. These layers can be manipulated using common GIS software. Based on the extensive dryland area of approximately 6.6 million km2 in China, we adopted a stratified random sampling strategy within a systematic grid framework to ensure representativeness and statistical robustness. Rather than implementing an unrealistic full-coverage census at an ultra-high resolution, we overlaid the study region with a 10-km × 10-km grid as the primary sampling framework. Within each grid cell, potential sample locations were stratified according to major ecosystem types—defined by climate zones, vegetation classes, and soil types—to capture environmental heterogeneity. A total of 5,800 initial sample points were allocated across these strata, with sampling effort proportional to the areal extent and ecological variability of each stratum. To ensure data quality and minimize the influence of extreme values in subsequent analyses, we applied a statistical outlier detection procedure using boxplots. Samples lying beyond 1.5 times the interquartile range for key variables—soil total nitrogen (STN), soil total phosphorus (STP), vegetation total nitrogen (VTN), and vegetation total phosphorus (VTP)—were identified and excluded. This process resulted in a refined and robust dataset comprising 4,200 valid sample points, which were used for all further spatial prediction and driver analysis. Methods for measuring N and P in vegetation and soil samples are provided in the Supplementary Information.
2.2.2 Environmental data
The mean annual temperature (MAP) data is sourced from “1-km monthly mean temperature dataset for china (1901–2023)” (Peng et al., 2019). The mean annual precipitation (MAP) data is sourced from “1-km monthly precipitation dataset for China (1901–2023)” (Peng et al., 2019). The pH data is sourced from “Mapping high resolution National Soil Information Grids of China” (Liu et al., 2022). The soil texture data is sourced from (Clay, and Sand) “High-resolution and three-dimensional mapping of soil texture of China” (Liu et al., 2020). The spatial factors, namely, elevation (Ele) and slope, were derived from a 1.0 km × 1.0 km grid digital elevation model (DEM). The DEM was derived from the NASA Shuttle Radar Topography Mission (SRTM) 1 Arc–Second Global (2000) (https://www.usgs.gov/). The soil water content (SWC) data is from “A 1 km daily soil moisture dataset over China based on in-situ measurement (2000–2022)” (Li et al., 2022). Normalized difference vegetation index (NDVI) data is sourced from “China regional 250 m normalized difference vegetation index data set” (https://doi.org/10.11888/Terre.tpdc.300328). Net Primary Productivity (NPP) data is sourced from “NASA-EARTHDATA (https://lpdaac.usgs.gov/products/mod17a3hgfv061/)”. Soil organic carbon (SOC) data is sourced from “Dataset of soil properties for land surface modeling over China” (Dai and Shangguan, 2019). In this study, SOC had high covariance (Figure S1, VIF >10) with STN, and STP, and the SOC were eliminated. Finally, 10 covariates were selected and used in the machine learning model. Although the SOC content, which is a very important control variable for P and, even more so, N reserves in the soil, was not used for modeling, very good results were achieved.
2.3 Estimation of N and P stock in dryland terrestrial ecosystems
We used the following formula to calculate vegetation or soil TN and TP stock (Liu et al., 2013):
i is the ith grid square; Densi is TN or TP density (g m−2) for the ith grid square calculated, and Area is the area (m2) of each grid square, set by the defined resolution. These calculations were performed using the GIS software package Arcmap Desktop (version 10.2) with the spatial analyst module.
To obtain spatially explicit N and P stock in drylands ecosystems, this study used machine learning models to convert vegetation and soil N and P density from plot scale to regional scale (Figure 2). Machine learning models are powerful tools for predicting regional-scale soil and ecological properties (Beer et al., 2010); compared to scale conversion methods based on classification units, machine learning techniques can reduce the uncertainty in soil carbon and nitrogen stock estimates (Zhang et al., 2025). First, using grid value interpolation sampling. To clarify, the sampling was structured as a grid, and the values were not simply extracted but spatially interpolated. The methodology is now stated as: “The values for the 4,200 sampling sites, which were positioned at grid cell centroids to ensure uniform spatial coverage, were generated by applying Ordinary Kriging interpolation to the original dataset. This approach optimally estimates values at these points by leveraging the spatial autocorrelation inherent in the source data. Outliers were removed to obtain data on vegetation and soil (0–30 cm) N and P density and environmental covariates from 4,200 sites. The method has been clarified in the manuscript as follows: “Outliers were identified and removed based on the interquartile range (IQR) method, which is the statistical criterion underlying the boxplot approach. Specifically, data points falling below Q1 - 1.5 × IQR or above Q3 + 1.5 × IQR were considered outliers and excluded from subsequent analysis. Four machine learning models—support vector machine (SVM), random forest (RF), Gaussian process regression (GPR), and gradient boosted regression tree (GBRT). The predictive variables for the machine learning models included longitude, latitude, Ele, slope, MAT, MAP, NDVI, NPP, Sand, Clay, pH, and SWC. The selection of these 12 variables as predictive variables for the models was primarily based on the following two considerations: (1) the selected variables comprehensively reflect the influence of geographical location, climate, vegetation, and soil physicochemical property on N and P stock in vegetation and soil; (2) previous studies have shown that the selected variables can regulate the magnitude of soil N and P stock by altering N and P input and output processes (Kou et al., 2019; Zhang et al., 2021). Using “leave-one-out” cross-validation (Zhang et al., 2025), this study evaluated the predictive performance of four machine learning models and presented the validation results using 1:1 line scatter plots (Zhang et al., 2025), selecting the model with the best predictive performance for further analysis. Based on the spatially distributed data of vegetation and soil N and P density predicted by the optimal model, the average values of vegetation and soil N density was calculated for each pixel. Then, using the average values of vegetation and soil N and P density and the pixel area, the N and P stock of terrestrial ecosystems in drylands were estimated.

Figure 2. Flowchart of N and P stock estimation in dryland terrestrial ecosystems.
2.4 Statistical analysis
The normality of the data was tested using the Kolmogorov–Smirnov test. Non-normal variables were log-transformed prior to the following analyses (Tian et al., 2022). Subsequently, standard statistical functions were employed to compute the mean, minimum (Min), maximum (Max), standard deviation (SD), and coefficient of variation (CV) for each respective metric (Table 1).
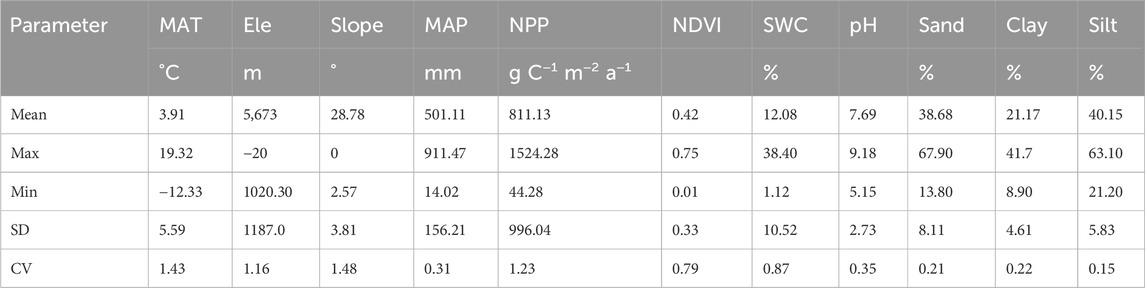
Table 1. Descriptive statistics for soil, vegetation and climate parameters in drylands of China.
To assess the relative importance of spatial, climatic, soil physicochemical properties, and vegetation on N and P, we used the “Vegan” package to perform variance decomposition analysis. We used the “forward.sel” function of the “Packfor” package to avoid redundancy and multicollinearity in variation partitioning analysis. The piecewise structural equation modelling (piecewiseSEM) was constructed to analyze the direct and indirect pathways through which environmental factors influence N and P. The model accounted for sampling sites (as random effects, reflecting the nested structure of samples within research centers) and reported marginal R2 (the variance explained by predictors when random effects are ignored) and conditional R2 (the total variance explained when random effects are included). Fisher’s C test was used to assess the overall model fit, and necessary model adjustments were made based on its significance (P < 0.05) and goodness-of-fit criteria (0 ≤ Fisher’s C/df ≤ 2 and 0.05 < P ≤ 1.00). To determine the optimal predictors for N or P, piecewiseSEMs were constructed across different data scales, incorporating similar core predictors. Finally, the total standardized effects of each predictor were calculated. All statistical analyses were conducted in R v4.1.0, with piecewiseSEMs implemented using the “nlme” and “lme4” packages.
3 Results
3.1 Predictive performance of machine learning models
The 1:1 linear scatter plots (Figures 3, 4) shows that, compared to the other four machine learning models, RF has the highest accuracy in predicting STN, STP, VTN, and VTP (0.89, 0.92, 0.95, and 0.94); however, it has the lowest MAE (3.21, 0.56, 5.37, and 2.23) and RMSE (5.09, 0.79, 7.05, and 2.98). This indicates that the RF model demonstrates the best performance in predicting N and P in arid land ecosystems.
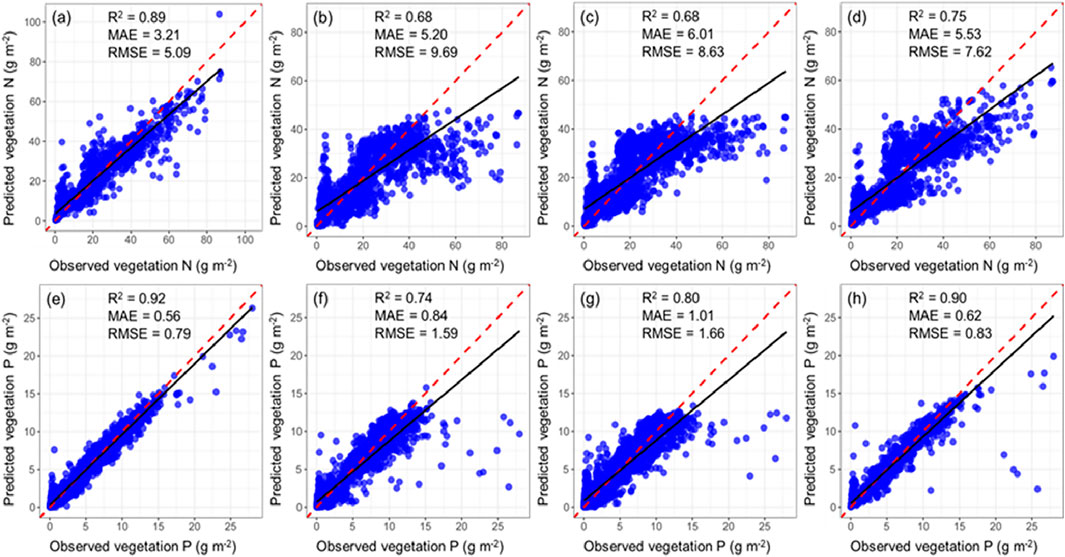
Figure 3. Prediction performance of four machine learning models for vegetation N and P (represented as a 1:1 linear scatter plots). (a) RF-VTN; (b) SVM-VTN; (c) GBRT-VTN; (d) GPR-VTN; (e) RF-VTP; (f) SVM-VTP; (g) GBRT-VTP; (h) GPR-VTP. The red dashed line represents the 1:1 line, and the black solid line represents the regression line. The same below.

Figure 4. Prediction performance of four machine learning models for soil N and P (represented as a 1:1 linear scatter plots). (a) RF-STN; (b) SVM-STN; (c) GBRT-STN; (d) GPR-STN; (e) RF-STP; (f) SVM-STP; (g) GBRT-STP; (h) GPR-STP.
3.2 Estimation and spatial mapping of N and P stock in vegetation and soil in drylands
This study comprehensively estimated the N and P density, stock, and coefficient of variation (CV) in drylands (Table 2). The mean density of STN, STP, VTN, and VTP were 168.4, 76.5, 2.7, and 0.4 gm−2, respectively; the stock was 1111.7, 504.9, 17.6, and 1.7 Tg, respectively; and the CV was 1.25, 0.87, 2.33, and 2.05, respectively.

Table 2. N and P density, stock, and coefficient of variation in soils and vegetation in drylands.
Overall, both N and P stock in soil and vegetation exhibit great spatial heterogeneity in their distribution, and their distribution patterns share both similarities and differences (Figure 5). Similarities are evident in the following: N and P stock in soil and vegetation exhibit high values in the northeastern part of the drylands (the Greater Khingan Range and the Northeast Plain), while they are low in the central part of the drylands (the Inner Mongolia Plateau). Differences are manifested as follows: N stock is relatively high in the northwestern part of the Qinghai-Tibet Plateau, while P stock in the soil of the Tarim Basin are relatively prominent.

Figure 5. Predicted spatial patterns of N and P density with a resolution of 1.0 km in vegetation, and soil of dryland terrestrial ecosystems of China. (a) Soil N, (b) Soil P, (c) Vegetable N, and (d) Vegetable P.
3.3 Drivers of spatial variation in vegetation N and P in dryland terrestrial ecosystems of China
We used the piecewiseSEMs to separately investigate the direct and indirect effects of spatial, climatic, vegetation, and soil environments on STN, STP, VTN, and VTP (Figure 6). Overall, in the model, all environmental factors explained 35%, 27%, 18%, and 15% of the variance in STN, STP, VTN, and VTP, respectively. When considering the ‘random effects’ of sampling locations, an additional 20% of the variance in N and P across the drylands could be explained. In the models, the primary drivers of STN and STP were soil environment factors SWC and clay, respectively; while the primary drivers of VTN and VTP variations were MAP.

Figure 6. PiecewiseSEMs interpreting the direct and indirect effects of climatic factors, human impacts, N deposition, soil physicochemical properties, and normalized difference vegetation index (NDVI) on STN (a), STP (b), VTN (c), and VTP (d). df, degree of freedom; AIC: Akaike Information Criterion; BIC: Bayesian Information Criterion. *, p < 0.05; **, p < 0.01; ***, p < 0.001. R2Marginal and R2Conditional denote the proportion of variance explained by the included predictors without and with accounting for ‘random effects’ of the “sampling site,” respectively.
Through variance partitioning analysis (Figure 7), we found that space, climate, soil, and plants each explained 42.2%, 37.6%, 33.9%, and 28.2% of the total variations in STN, STP, VTN, and VTP, respectively. Among these, soil had the greatest independent effect on STN and STP variation, explaining 24.4% and 18.4% of the variation, respectively; climate had the greatest independent effect on VTN and VTP variation, explaining 14.9% and 9.8% of the variation, respectively.

Figure 7. Variance partitioning analysis for four different categories: Space, Climate, Soil physicochemical property and Plants in explaining the STN (a), STP (b), VTN (c), and VTP (d). Space: Elevation, Slope; Climate: MAT, MAP; Soil: pH, SWC, Clay, Sand; Plants: NDVI, NPP.
4 Discussion
4.1 Superiority of RF model prediction performance
This study demonstrates that the random forest (RF) model achieves the best predictive performance in estimating the density of nitrogen (N) and phosphorus (P) in dryland terrestrial ecosystems, as clearly shown in Figures 3, 4. RF, an ensemble learning algorithm based on multiple decision trees proposed by Breiman (2001), offers high accuracy and strong interpretability. The superior predictive performance of RF is reflected in the following aspects:
(1) Effective prevention of overfitting while maintaining high accuracy: Each decision tree is trained using bootstrapped sample subsets and random feature selection. This dual randomness reduces variance among individual trees and the overall model, effectively avoiding overfitting—a common issue in single decision trees—while preserving high predictive accuracy (Zhang et al., 2025). (2) Excellent scalability and capacity to handle complex data: RF is particularly suitable for processing large-scale and high-dimensional datasets. Its parallel computing capability enables efficient and scalable model training even with massive ecological data (Wadoux et al., 2020). (3) Robust prediction results: By aggregating outputs from multiple trees through voting or averaging, RF substantially reduces prediction variance and enhances stability. This “collective intelligence” framework yields more reliable predictions.
The superior performance of RF in predicting N and P in drylands stems from its capability to capture complex nonlinear relationships and interactions among environmental variables, its robustness against outliers and noise in field observations, and its utility in providing ecologically meaningful insights through feature importance analysis. Therefore, the RF algorithm should be more widely applied and further developed in future soil attribute mapping studies.
4.2 Heterogeneity in the spatial distribution of N and P in dryland terrestrial ecosystems
The spatial distribution of N and P stocks in China’s dryland terrestrial ecosystems exhibits pronounced heterogeneity, with significantly higher vegetation and soil N and P stocks in the northeastern regions compared to the northwest (Figure 5; Table 1). This pattern can be attributed to several factors: Climate differences: MAP is substantially higher in northeastern drylands, promoting vegetation productivity (e.g., aboveground biomass) and microbial mineralization rates, thereby enhancing inputs of organic N and P.
Soil type differences: Northeastern soils, such as black calcareous and chestnut calcareous soils, are rich in organic matter, and their humus-clay complexes help stabilize P via chelation. In contrast, widespread saline-alkali soils (pH > 8.5) in the northwest facilitate P fixation by calcium and magnesium minerals, and frequent wind erosion exacerbates gaseous N loss (Zhang et al., 2025). Agricultural management differences: Intensive farming systems in the northeast involve higher fertilizer inputs than those in the northwest. These exogenous nutrients are returned to the soil via crop residues and stabilized by soil organic matter, leading to continuous accumulation of N and P stocks in terrestrial ecosystems (Bi et al., 2023).
4.3 Main drivers of N and P changes in dryland terrestrial ecosystems
In dryland ecosystems, soil properties—specifically soil water content (SWC) and clay content—are the dominant factors controlling soil total nitrogen (STN) and soil total phosphorus (STP), respectively (Figures 6, 7).
SWC is widely recognized as a limiting factor in dryland ecosystem processes, strongly regulating plant growth and soil microbial activity, and thereby influencing the accumulation and cycling of N and P (Moyano et al., 2013). It also shapes microbial community structure and regulates key nitrogen transformation processes such as nitrification and denitrification (Chen et al., 2013), further affecting nutrient dynamics, gas exchange, and microbial growth (Mcdaniel et al., 2013). For instance, elevated soil moisture significantly enhances microbial activity—increasing N mineralization rates by 30–50%—and directly enlarges the soil N pool by stimulating organic matter decomposition and biological N fixation (Schimel and Bennett, 2004). Concurrently, improved moisture conditions alleviate plant water stress, increase aboveground productivity by 20%–40%, and enhance litter inputs, indirectly promoting the accumulation of organic N (Austin et al., 2004). In summary, SWC indirectly regulates the stocks of soil N and P by modulating vegetation growth and litter decomposition processes (Zhang et al., 2018; Wang et al., 2020).
Clay content exerts a significant positive effect on STP in drylands. As the proportion of soil aggregates larger than 1 mm increases, P stocks also rise considerably in dryland red soils (Xu et al., 2020), a finding consistent with the present study. Clay particles possess a high specific surface area and strong adsorption capacity, enabling them to immobilize P in soil solution via specific adsorption, thereby converting soluble P into adsorbed forms and reducing plant-available P (Bicharanloo et al., 2022). In clay-rich soils, applied P fertilizers are prone to fixation, lowering P availability. This is mainly due to the high surface area and cation exchange capacity of clay minerals (e.g., montmorillonite and illite), which effectively retain phosphate ions and mitigate leaching (Zhao et al., 2023). Under drought conditions, clay further sequesters soluble P by forming 2:1 layered silicate structures, thereby stabilizing P within soil aggregates (Chi et al., 2024).
Climate, particularly mean annual precipitation (MAP), serves as the principal driver of vegetation total nitrogen (VTN) and vegetation total phosphorus (VTP) in drylands (Figures 6, 7). Precipitation is a major source of soil moisture in these regions, and sufficient rainfall improves soil conditions, supporting the survival and reproduction of plants and microbes. Increased precipitation directly alleviates plant water stress, enhances photosynthetic rates and biomass accumulation, and facilitates root uptake of soil N. For example, in some grassland ecosystems, a 30% increase in precipitation significantly promotes plant root N acquisition (Li et al., 2022). Moreover, precipitation stimulates soil microbial activity, accelerates the mineralization of N and P, and promotes the release of available N and P from organic matter, thereby increasing plant N and P content (Li J. W. et al., 2023). Precipitation also influences the forms and availability of soil P (Yang et al., 2025). Under low rainfall conditions, P tends to form insoluble phosphates, reducing its availability to plants. Increased precipitation can enhance P solubility and release, improving its bioavailability and uptake (Li et al., 2022). In summary, elevated precipitation boosts microbial activity, increases the pool of plant-available N and P, facilitates the movement of soluble nutrients to the root zone, and reduces topsoil nutrient loss via evaporation, collectively leading to higher VTN and VTP.
4.4 Uncertainties and limitations
This study mapped the spatial distribution patterns of N and P in dryland ecosystems, quantitatively estimated the N and P stock in vegetation and soil, and analyzed the main factors driving their changes; however, the results still exhibit a certain degree of uncertainty. First, a large proportion (>30%) of the spatial variation in N and P stock in drylands cannot be fully explained by existing models. Secondly, microbial activity, which is a key factor regulating N and P cycles (Nelson et al., 2016; Li J. S. et al., 2023), could not be included in the analysis of driving mechanisms due to the lack of basic data. Additionally, human activities (such as the expansion of irrigated agriculture) and land-use changes have significantly disrupted soil N and P stock (e.g., land reclamation causes a 20%–30% loss of organic P), which have not been quantified. These missing elements may increase the uncertainty of the results.
5 Conclusion
We compared four machine learning models based on 1:1 line scatter plots and selected the random forest model with the best predictive performance for predicting N and P in dryland. We mapped the spatial distribution patterns of N and P in dryland terrestrial ecosystem, which exhibited strong spatial heterogeneity, with high-value areas concentrated in the northeast black soil belt and low-value areas located in the northwest desert. We also estimated the STN, STP, VTN, and VTP in drylands were estimated to be 1,111.4, 504.9, 17.6, and 1.7 Tg, respectively. The soil environment was the most important factor in regulating the STN and STP, specifically SWC and clay; climate (MAP) was the main driver of changes in VTN and VTP in drylands. Our findings will provide targeted evidence for precise nutrient management in arid regions and serve as a reference for estimating N and P stock in China.
Data availability statement
The original contributions presented in the study are included in the article/Supplementary Material, further inquiries can be directed to the corresponding author.
Author contributions
BL: Writing – original draft, Formal Analysis, Software, Methodology, Resources, Data curation, Visualization, Project administration, Writing – review and editing, Conceptualization, Investigation, Validation, Supervision, Funding acquisition.
Funding
The author(s) declare that financial support was received for the research and/or publication of this article. This study was funded by the Shanxi Provincial Government.
Acknowledgements
Thanks to Yusen Chen and Shihang Zhang for their help with data collection, mapping, and Revised language.
Conflict of interest
The author declares that the research was conducted in the absence of any commercial or financial relationships that could be construed as a potential conflict of interest.
Generative AI statement
The author(s) declare that no Generative AI was used in the creation of this manuscript.
Any alternative text (alt text) provided alongside figures in this article has been generated by Frontiers with the support of artificial intelligence and reasonable efforts have been made to ensure accuracy, including review by the authors wherever possible. If you identify any issues, please contact us.
Publisher’s note
All claims expressed in this article are solely those of the authors and do not necessarily represent those of their affiliated organizations, or those of the publisher, the editors and the reviewers. Any product that may be evaluated in this article, or claim that may be made by its manufacturer, is not guaranteed or endorsed by the publisher.
Supplementary material
The Supplementary Material for this article can be found online at: https://www.frontiersin.org/articles/10.3389/fenvs.2025.1654154/full#supplementary-material
References
Austin, A. T., Yahdjian, L., Stark, J. M., Belnap, J., Porporato, A., Norton, U., et al. (2004). Water pulses and biogeochemical cycles in arid and semiarid ecosystems. Oecologia 141 (2), 221–235. doi:10.1007/s00442-004-1519-1
Bi, S. T., Luo, X. Y., Zhang, C., Li, P. F., Yu, C. L., Liu, Z. L., et al. (2023). Fate of fertilizer nitrogen and residual nitrogen in paddy soil in Northeast China. J. Integr. Agric. 22 (11), 3535–3548. doi:10.1016/j.jia.2023.06.010
Bicharanloo, B., Shirvan, M. B., and Dijkstra, F. A. (2022). Decoupled cycling of carbon, nitrogen, and phosphorus in a grassland soil along a hillslope mediated by clay and soil moisture. Catena 219, 106648. doi:10.1016/j.catena.2022.106648
Chen, Y. L., Xu, Z. W., Hu, H. W., Hu, Y., Hao, Z., Jiang, Y., et al. (2013). Responses of ammonia–oxidizing bacteria and archaea to nitrogen fertilization and precipitation increment in a typical temperate steppe in Inner Mongolia. Appl. Soil Ecol. 68, 36–45. doi:10.1016/j.apsoil.2013.03.006
Cherlet, M., Hutchinson, C., and Reynolds, J. (2018). World Atlas of desertification: rethinking land degradation and sustainable land management. Luxembourg: Publication Office of the European Union.
Chi, J. L., Jiao, C. H., and Zhang, W. J. (2024). Nanoscale observations of the mediation of phosphorus adsorption capability by sugar–clay microaggregates. Acta Pedol. Sin. 61 (1), 110–117. doi:10.11766/trxb202206090217
Cleveland, C. C., Townsend, A. R., and Taylor, P. (2011). Relationships among net primary productivity, nutrients and climate in tropical rain forest: a pan–tropical analysis. Ecology 92 (4), 877–887. 10.1111/j.1461-0248.2011.01711.x
Dai, Y., and Shangguan, W. (2019). Dataset of soil properties for land surface modeling over China. A Big Earth Data Platf. Three Poles. doi:10.11888/Soil.tpdc.270281
Du, E. Z., Terrer, C., Pellegrini, A. F. A., Ahlström, A., van Lissa, C. J., Zhao, X., et al. (2020). Global patterns of terrestrial nitrogen and phosphorus limitation. Nat. Geosci. 13 (3), 221–226. doi:10.1038/s41561-019-0530-4
Elser, J. J., Bracken, M. E. S., Cleland, E. E., Gruner, D. S., Harpole, W. S., Hillebrand, H., et al. (2007). Global analysis of nitrogen and phosphorus limitation of primary producers in freshwater, marine and terrestrial ecosystems. Ecol. Lett. 10 (12), 1135–1142. doi:10.1111/j.1461-0248.2007.01113.x
Feyissa, A., Yang, F., Wu, J. J., Chen, Q., Zhang, D., and Cheng, X. (2021). Soil nitrogen dynamics at a regional scale along a precipitation gradient in secondary grassland of China. Sci. Total Environ. 781, 146736. doi:10.1016/j.scitotenv.2021.146736
He, X. J., Augusto, L., Goll, D. S., Ringeval, B., Wang, Y., Helfenstein, J., et al. (2021). Global patterns and drivers of soil total phosphorus concentration. Earth Syst. Sci. Data 13 (12), 5831–5846. doi:10.5194/essd-13-5831-2021
Jiao, Y. M., Li, X. Z., and Liang, L. H. (2021). Indigenous ecological knowledge and natural resource management in the cultural landscape of China’s Hani terraces. Ecol. Res. 31 (3), 395–406. 10.1007/s11284-011-0895-3
Kou, D., Ding, J. Z., Li, F., Wei, N., Fang, K., Yang, G., et al. (2019). Spatially–explicit estimate of soil nitrogen stock and its implication for land model across Tibetan alpine permafrost region. Sci. Total Environ. 650 (2), 1795–1804. doi:10.1016/j.scitotenv.2018.09.252
Li, C. J., Fu, B. J., Wang, S., Stringer, L. C., Wang, Y., Li, Z., et al. (2021). Drivers and impacts of changes in China’s drylands. Nat. Rev. Earth and Environ. 2 (12), 858–873. doi:10.1038/s43017-021-00226-z
Li, C. H., Yu, H. L., Xu, Y. X., Zhu, W., Wang, P., and Huang, J. (2022). Close linkages between leaf functional traits and soil and leaf C:N:P stoichiometry under altered precipitation in a desert steppe in northwestern China. Plant Ecol. 223 (4), 407–421. doi:10.1007/s11258-021-01218-1
Li, Q., Shi, G., Shangguan, W., Nourani, V., Li, J., Li, L., et al. (2022). A 1 km daily soil moisture dataset over China using in situ measurement and machine learning. Earth Syst. Sci. Data 14, 5267–5286. doi:10.5194/essd-14-5267-2022
Li, J. W., Deng, L., Peñuelas, J., Wu, J., Shangguan, Z., Sardans, J., et al. (2023a). C:N:P stoichiometry of plants, soils, and microorganisms: response to altered precipitation. Glob. Change Biol. 29 (24), 7051–7071. doi:10.1111/gcb.16959
Li, J. S., Wu, B. Y., Zhang, D. D., and Cheng, X. (2023b). Elevational variation in soil phosphorus pools and controlling factors in alpine areas of Southwest China. Geoderma 431, 116361. doi:10.1016/j.geoderma.2023.116361
Liu, Z. P., Shao, M. A., and Wang, Y. Q. (2013). Spatial patterns of soil total nitrogen and soil total phosphorus across the entire loess Plateau region of China. Geoderma 197, 67–78. doi:10.1016/j.geoderma.2012.12.011
Liu, F., Zhang, G. L., Song, X. D., Li, D. C., Zhao, Y. G., Yang, J. L., et al. (2020). High-resolution and three-dimensional mapping of soil texture of China. Geoderma 361, 114061. doi:10.1016/j.geoderma.2019.114061
Liu, F., Wu, H., Zhao, Y., Li, D., Yang, J. L., Song, X., et al. (2022). Mapping high resolution national soil information grids of China. Sci. Bull. 67 (3), 328–340. doi:10.1016/j.scib.2021.10.013
Mcdaniel, M. D., Kaye, J. P., and Kaye, M. W. (2013). Increased temperature and precipitation had limited effects on soil extracellular enzyme activities in a post–harvest forest. Soil Biol. Biochem. 56, 90–98. doi:10.1016/j.soilbio.2012.02.026
Moyano, F. E., Manzoni, S., and Chenu, C. (2013). Responses of soil heterotrophic respiration to moisture availability: an exploration of processes and models. Soil Biol. Biochem. 59, 72–85. doi:10.1016/j.soilbio.2013.01.002
Nelson, M. B., Martiny, A. C., and Martiny, J. B. H. (2016). Global biogeography of microbial nitrogen–cycling traits in soil. Proc. Natl. Acad. Sci. U. S. A. 113 (29), 8033–8040. doi:10.1073/pnas.1601070113
Peng, S. Z., Ding, Y. X., Liu, W. Z., and Li, Z. (2019). 1 km monthly temperature and precipitation dataset for China from 1901 to 2017. Earth Syst. Sci. Data 11, 1931–1946. doi:10.5194/essd-11-1931-2019
Prăvălie, P., Bandoc, G., Patriche, C., and Sternberg, T. (2019). Recent changes in global drylands: evidences from two major aridity databases. Catena 178, 209–231.
Remus, P., Georgeta, B., Cristian, P., and Sternberg, T. (2019). Recent changes in global drylands: evidences from two major aridity databases. Catena 178, 209–231. doi:10.1016/j.catena.2019.03.016
Schimel, J. P., and Bennett, J. (2004). Nitrogen mineralization: challenges of a changing paradigm. Ecology 85 (3), 591–602. doi:10.1890/03-8002
Smith, W. K., Dannenberg, M. P., Yan, D., Herrmann, S., Barnes, M. L., Barron-Gafford, G. A., et al. (2019). Remote sensing of dryland ecosystem structure and function: progress, challenges, and opportunities. Remote Sens. Environ. 233, 111401. doi:10.1016/j.rse.2019.111401
Tian, P., Zhao, X. C., Liu, S. G., Sun, Z., Jing, Y., and Wang, Q. (2022). Soil microbial respiration in forest ecosystems along a north–south transect of eastern China: evidence from laboratory experiments. Catena 211, 105980. doi:10.1016/j.catena.2021.105980
Vincent, A. G., Schleucher, J., Gröbner, G., Vestergren, J., Persson, P., Jansson, M., et al. (2012). Changes in organic phosphorus composition in boreal forest humus soils: the role of iron and aluminium. Biogeochemistry 108 (1–3), 485–499. doi:10.1007/s10533-011-9612-0
Vitousek, P. M., and Howarth, R. W. (1991). Nitrogen limitation on land and in the sea. Biogeochemistry 13 (2), 87–115. doi:10.1007/BF00002772
Wadoux, A. M. J. C., Minasny, B., and McBratney, A. B. (2020). Machine learning for digital soil mapping: applications, challenges and suggested solutions. Earth–Science Rev. 210, 103359. doi:10.1016/j.earscirev.2020.103359
Wang, Y. N., Li, F. Y., Song, X., Wang, X., Suri, G., and Baoyin, T. (2020). Changes in litter decomposition rate of dominant plants in a semi–arid steppe across different land–use types: soil moisture, not home–field advantage, plays a dominant role. Agric. Ecosyst. Environ. 303, 107119. doi:10.1016/j.agee.2020.107119
Xu, X. H., Wang, Y. L., and Yao, Y. (2020). Effects of long–term fertilization on phosphorus stock capacity of soil aggregates in red soil upland. Acta Pedol. Sin. 57 (3), 730–738. doi:10.11766/trxb201703070088
Yang, X. Q., Li, J. P., and Lian, J. L. (2025). Influence of precipitation change on the ecological stoichiometry of carbon, nitrogen, and phosphorus within desert steppe soil. Chin. J. Grassl. 47 (3), 20–30. doi:10.16742/j.zgcdxb.20240277
Yuan, Z., and Chen, H. Y. (2015). Decoupling of nitrogen and phosphorus in terrestrial plants associated with global changes. Nat. Clim. Change 5 (5), 465–469. doi:10.1038/nclimate2549
Zhang, F. S., Cui, Z. L., and Chen, X. P. (2012). Chapter one – integrated nutrient management for food security and environmental quality in China. Adv. Agron. 116, 1–40. doi:10.1016/B978-0-12-394277-7.00001-4
Zhang, W., Gao, D. X., Chen, Z. X., Li, H., Deng, J., Qiao, W., et al. (2018). Substrate quality and soil environmental conditions predict litter decomposition and drive soil nutrient dynamics following afforestation on the loess Plateau of China. Geoderma 325, 152–161. doi:10.1016/j.geoderma.2018.03.027
Zhang, K., Su, Y., and Yang, R. (2019). Variation of soil organic carbon,nitrogen,and phosphorus stoichiometry and biogeographic factors across the desert ecosystem of Hexi corridor,northwestern China. J. Soils Sediments 19 (1), 49–57. doi:10.1007/s11368-018-2007-2
Zhang, Y. W., Guo, Y. P., Tang, Z. Y., Feng, Y., Zhu, X., Xu, W., et al. (2021). Patterns of nitrogen and phosphorus pools in terrestrial ecosystems in China. Earth Syst. Sci. Data 13 (11), 5337–5351. doi:10.5194/essd-13-5337-2021
Zhang, S. H., Chen, Y. S., Guo, H., Lu, Y., Guo, X., Liu, C., et al. (2023). Changes in dryland areas and net primary productivity in China from 1980 to 2020. J. Earth Syst. Sci. 132 (2), 83. doi:10.1007/s12040-023-02100-6
Zhang, S. H., Chen, Y. S., Zhu, B., Lu, Y., Guo, H., Guo, X., et al. (2025). Drivers and spatial distribution of soil organic carbon and total nitrogen in China’s drylands. Catena 250, 108724. doi:10.1016/j.catena.2025.108724
Keywords: limiting nutrients, spatial distribution, drivers, machine learning, modelling
Citation: Liu B (2025) Modelling the spatial distribution of total nitrogen and phosphorus stock in dryland terrestrial ecosystems of China using machine learning algorithms. Front. Environ. Sci. 13:1654154. doi: 10.3389/fenvs.2025.1654154
Received: 26 June 2025; Accepted: 27 October 2025;
Published: 10 November 2025.
Edited by:
Wakene Negassa, The James Hutton Institute, United KingdomReviewed by:
Sören Thiele-Bruhn, University of Trier, GermanyBo Zhu, Institute of Mountain Hazards and Environment (CAS), China
Copyright © 2025 Liu. This is an open-access article distributed under the terms of the Creative Commons Attribution License (CC BY). The use, distribution or reproduction in other forums is permitted, provided the original author(s) and the copyright owner(s) are credited and that the original publication in this journal is cited, in accordance with accepted academic practice. No use, distribution or reproduction is permitted which does not comply with these terms.
*Correspondence: Bin Liu, bGIyMDI0MDUxNUAxNjMuY29t