 Yonghan Jian1
 Guowei Zhang
- 1Fujian Province Tobacco Company Xiamen Municipal Company, Xiamen, Fujian, China
- 2School of Management, Xiamen University, Xiamen, Fujian, China
Introduction: With the proposal of China’s “Dual Carbon” targets, how to measure carbon footprint in detail is particularly important. However, the current carbon footprint measurement mainly focuses on the production process, ignoring the high carbon emission caused by the transport phase. In this paper, we take the tobacco industry as the research object, and include the transport phase in the carbon footprint measurement.
Methods: Based on the existing statistical data, this paper adopts the Life Cycle Assessment (LCA) to comprehensively measure and analyze the carbon footprint of China’s tobacco industry from 2011 to 2020.
Results: The results show that the average carbon footprint per hectare of the tobacco industry is about 21.57 tons of carbon dioxide equivalent, while showing a slowly increasing trend in recent years. In terms of linkage and raw material composition, the carbon footprints of fertilizer application, agricultural film input, initial curing and air transportation is relatively high, accounting for 8.2%, 66% and 4.7% of the total emissions respectively. Combined with the cost of tobacco planting, it can be found that Yunnan, Guizhou and Jiangxi are facing the problems of high input, low output and high emission.
Discussion: The results are of great significance in promoting low-carbon tobacco growing and green transport.
1 Introduction
In recent years, it has become a global consensus that greenhouse gas (GHG) emissions contribute to climate warming, and reducing GHG emissions and actively promoting the development of low-carbon industries are important strategic goals that countries are committed to achieving (Wang et al., 2021). As one of the world’s largest emitters of greenhouse gases, China’s carbon dioxide (CO2) emissions will reach 12.6 billion tons in 2023, accounting for about one-third of the world’s total CO2 emissions, highlighting its key role in global climate governance (Adu, 2024). While much attention has traditionally focused on industrial production sectors, increasing recognition is being given to emissions from urban systems, such as waste management. In this context, collaborative governance approaches have emerged as effective mechanisms for enhancing the sustainability of these systems. For example, Song et al. (2025) and Zhou et al. (2023) applied evolutionary game theory to examine how multi-stakeholder coordination can improve urban waste management performance, providing valuable insights for supporting China’s dual-carbon goals through integrated policy and institutional solutions.
Notably, the agricultural sector accounts for about 24% of China’s total GHG emissions, a proportion that suggests that the agricultural sector is an important position for reducing the country’s overall GHG emissions (Huang et al., 2022). Therefore, there is an urgent need for the agricultural sector to formulate and implement a series of scientific and efficient emission reduction strategies and measures (Yang, 2022), and the total amount of carbon emissions from agriculture will be one of the main indicators for evaluating the effectiveness of these measures. In this context, the concept of “carbon footprint” has been introduced and widely used to assess the total amount of GHG emissions generated directly or indirectly by a specific human activity during its complete life cycle, providing an important tool for quantifying the effectiveness of emission reduction (Zhang et al., 2025). Obtaining accurate and comprehensive emission data in the agricultural sector is not only a prerequisite for the government to implement precise policies and effectively promote energy conservation and emission reduction in agriculture, but also a key to realizing the low-carbon transformation and sustainable development of the agricultural sector (Matthews et al., 2008). Therefore, a systematic carbon footprint accounting for the agricultural sector is of great significance in guiding the transformation of the agricultural sector to save energy and reduce carbon emissions, optimize resource allocation, and enhance environmental efficiency.
Tobacco, as one of the major cash crops in China, contributes significantly to the government’s fiscal revenue and farmers’ economic returns (Verguet et al., 2017; Alba-Reyes et al., 2024). According to the 2022 China Statistical Yearbook, its cultivation area reached 1,056,500 ha, realizing a total fiscal amount of 1,441.6 billion yuan. However, the full life cycle of the tobacco industry, covering the entire process from cultivation to processing, manufacturing and final transportation and sale, constitutes a non-negligible impact on climate change, as evidenced by the generation of approximately 84 million tons of carbon emissions per year (Zafeiridou et al., 2018; Ti et al., 2024). Among them, the cultivation of tobacco leaves, the production and processing of cigarettes, and the logistics and transportation of finished products have been identified as the main sources of carbon emissions. Although current studies have focused on the carbon footprint of the cigarette production stage, and relevant reports have been disclosed, it is worth noting that the amount of carbon emission contribution of the tobacco cultivation and subsequent transportation stage has not yet been fully assessed and emphasized, which, to a certain extent, has led to the underestimation of the total amount of carbon emissions of the entire tobacco industry chain (Hussain, 2014). Therefore, in order to more comprehensively and accurately assess the environmental impacts of the tobacco industry and formulate effective carbon emission reduction strategies, future research needs to further refine and strengthen the monitoring and analysis of carbon emissions at the tobacco planting and transportation stages.
Currently, the LCA methodology is widely used as a product carbon footprint analysis tool to evaluate the entire life cycle of a product, process or activity from the production and processing of raw materials to the production, transportation, use and final disposal of the product (Baumann and Rydberg, 1994). It was found that the method analyzes the results in a targeted manner and the results are relatively more reliable (Zhang et al., 2020). In existing studies, it has become a mainstream trend to carry out agricultural carbon footprint accounting based on the LCA methodology, and it is crucial to carry out region-specific carbon emission studies in order to strengthen emission reduction and formulate relevant policies. Abrahão et al. (2017) and Abrahão et al. (2021) used LCA to quantify the carbon footprints of agricultural crops under different farming systems in Spain, and determined that nitrogen fertilizer is the main source of carbon emissions from crop production, and that controlling nitrogen fertilizer inputs can effectively reduce the carbon footprints of agriculture. Zheng et al. (2024) analyzed the temporal changes in the carbon footprints of different activities of China’s tobacco production chain from 2004 to 2017 using LCA, and revealed its composition and main influencing factors.
The tobacco industry has extensive influence and economic significance worldwide. Although its direct carbon emissions may be less than those of some heavy industries, the energy consumption, resource utilization and waste generation involved in its production, transportation and sales processes all have an impact on the environment that cannot be ignored. Through in-depth research on the carbon footprint of the tobacco industry, we can provide scientific basis for policymakers, guide the industry towards a greener and more sustainable direction, and also help enhance public awareness of the environmental impact of the tobacco industry, promoting the formation of green consumption and low-carbon living concepts throughout society.
In addition, there are relatively few systematic studies on the carbon footprint of the tobacco industry at present. Our research aims to fill the gap in this field and provide theoretical support and practical guidance for the sustainable development of the tobacco industry. Through the application of the full life cycle approach, we can more accurately assess the environmental performance of the tobacco industry, provide references for enterprises within the industry to set emission reduction targets and implement emission reduction measures, and promote the entire industry to play an active role in responding to climate change.
Based on this, this paper adopts the LCA methodology to quantitatively assess the GHG emissions from various agricultural inputs and their use in the process of tobacco planting, cigarette production and transportation of finished products of roasted tobacco in different tobacco regions of China from 2011 to 2020 under the background of the development of green agriculture. The study not only aims to gain a deeper understanding of the mechanism of GHG emissions from tobacco fields, but also provides an important scientific basis for mitigating such emissions and promoting the sustainable development of green agriculture. It should be noted that the full life cycle discussed in this article mainly focuses on the complete stage of tobacco from the planting stage, through the transportation process, until it reaches the retailer. The marginal contributions of this paper are reflected in the following two aspects: Firstly, given that most of the current research on the carbon footprint of the tobacco industry focuses on the planting stage, especially the GHG emissions caused by the inputs of agricultural products, this study innovatively extends the scope of the research to the entire industrial chain, and analyzes in depth the dynamic changes and characteristics of the carbon footprints of the various links from tobacco planting, to the processing and manufacturing of cigarettes, to the transportation of the finished products, which fills the gaps in the comprehensive analysis of the industrial chain in the existing research. Secondly, this paper adopts a refined measurement method by province and structure, which not only reveals the geographical differences in the carbon footprint of the tobacco industry, but also discusses the trend of carbon emissions per unit area, key influencing factors and potential paths for emission reduction. This research design not only enriches the theory of carbon management in the tobacco industry, but also provides powerful data support and decision-making reference for the development of targeted and operational GHG reduction strategies.
2 Materials and methods
2.1 Data source
The data sources used in this paper are as follows: The tobacco planting area and tobacco production data in 2011–2020 is from China Agricultural Yearbook; The tobacco planting period of different factor inputs and cost data in 2011–2020 is from National Agricultural Products Cost and Benefit Information Compilation. In terms of data coverage, this paper covers 20 provinces in China where tobacco cultivation exists in order to comprehensively reflect the overall situation of China’s tobacco cultivation industry. However, due to the limitation of data acquisition, there are missing data for Liaoning Province in 2020, so this paper does not take it into consideration when analyzing 2020, and the specific regional distribution of tobacco cultivation is shown in Figure 1. Meanwhile, in order to maintain the consistency of the data unit, this paper uniformly sets the unit of tobacco planting area as hectares. Furthermore, considering that the tobacco leaves grown are mainly processed locally, this paper assumes that all the usable tobacco leaves produced are processed in local factories, and there is no loss during transportation. In terms of data acquisition for carbon emission factors, this paper synthesizes several authoritative sources, including the China Life Cycle Database (CLCD), China Product Full Life Cycle Greenhouse Gas Emission Coefficient Database (CPCD), Ecoinvent database, and existing relevant literature. The input amounts of raw materials in different links are shown in Table 1.
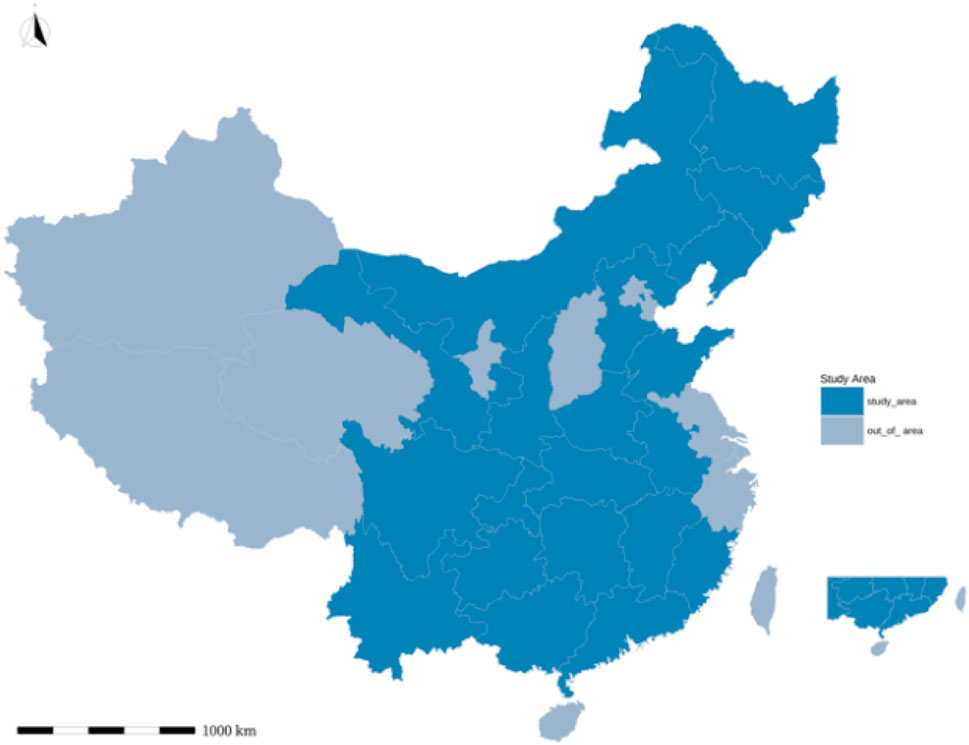
Figure 1. Tobacco growing areas in China.
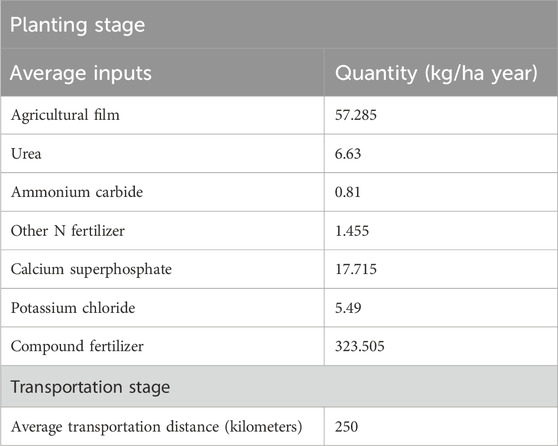
Table 1. The input volume of raw materials at different stages.
2.2 Carbon footprint calculation method
This article divides the entire tobacco processing procedure into three parts: planting, manufacturing and transportation. Among them, the carbon emissions during the planting stage mainly involve fertilization, pesticide use, diesel, artificial labor and agricultural film use. The manufacturing stage mainly includes carbon emissions from the initial and re-drying of tobacco leaves, cigarette paper, cigarette cartons, and fiber bundles. The transportation stage mainly includes carbon emissions generated during railway transportation, road transportation and air transportation.
In this study, the life cycle assessment method is used to quantitatively assess the implied carbon emissions during the cultivation of tobacco fields, cigarette processing and manufacturing, and the transportation of finished products in China. At the same time, refer to the definition of the production process of tobacco cultivation in (Ti et al., 2024), and the whole life cycle process is shown in Figure 2. The data processing calculation of carbon footprint mainly adopts the emission factor method, and the carbon footprint of individual activities is calculated by the formula:
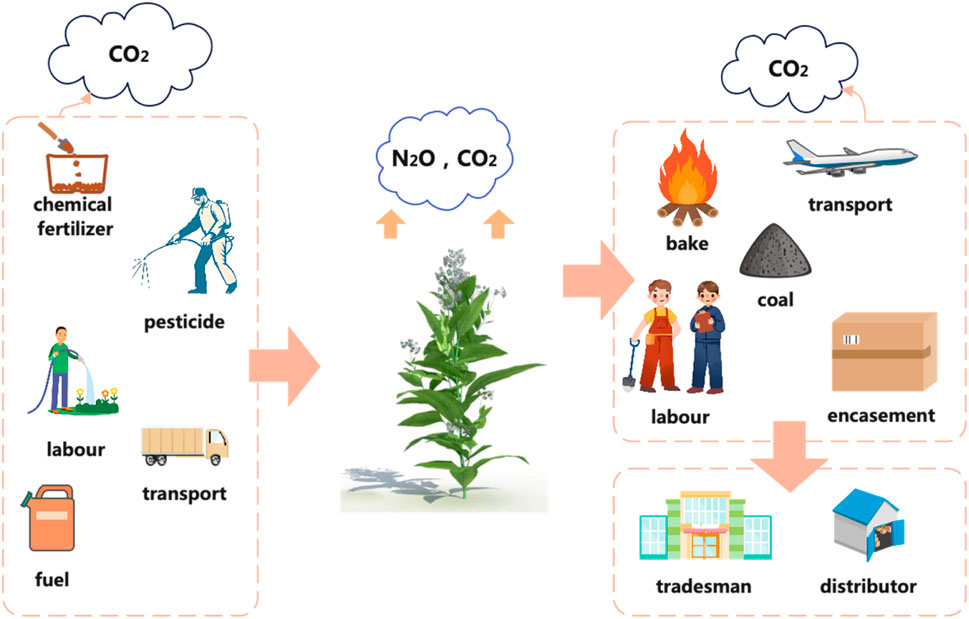
Figure 2. Tobacco processing full flow chart.
Where
The formula for calculating the carbon footprint per unit area of tobacco production is as follows:
In the above equation,
2.2.1 Tobacco planting
The ISO1406741 product carbon footprint accounting standard was used as a reference to quantitatively assess the GHG emissions generated during the cultivation stage of tobacco fields in China, including direct and indirect carbon emissions, and the carbon footprint was calculated using the Equation 3:
Among them,
2.2.2 Cigarette processing and manufacturing
In the cigarette processing and manufacturing chain, the main components of the carbon footprint include the tobacco first-curing and re-curing processes, as well as the processing activities of production materials such as cigarette paper, cigarette cartons, and fiber tows. Tobacco planting is a process of sequestering carbon and releasing oxygen, so the carbon emission analysis of the tobacco raw material processing stage only takes into account the two stages of primary curing and re-curing. Meanwhile, considering the implicit carbon emission of cigarette paper and cigarette cartons in the process of cigarette manufacturing, the carbon footprint calculation formula in the process of cigarette processing and manufacturing is as Equation 9:
Where
2.2.3 Transportation
Carbon emissions from transportation mainly include the transportation of mature tobacco to cigarette factories and the transportation of finished cigarettes to distribution or retailers. Raw materials and finished cigarettes are usually transported by large trucks, and according to the existing literature, the transportation of tobacco leaves is mainly carried out by railroads and highways, and small quantities are transported by air or water, and the carbon footprint of the transportation stage is calculated by the Equation 10.
Among them,
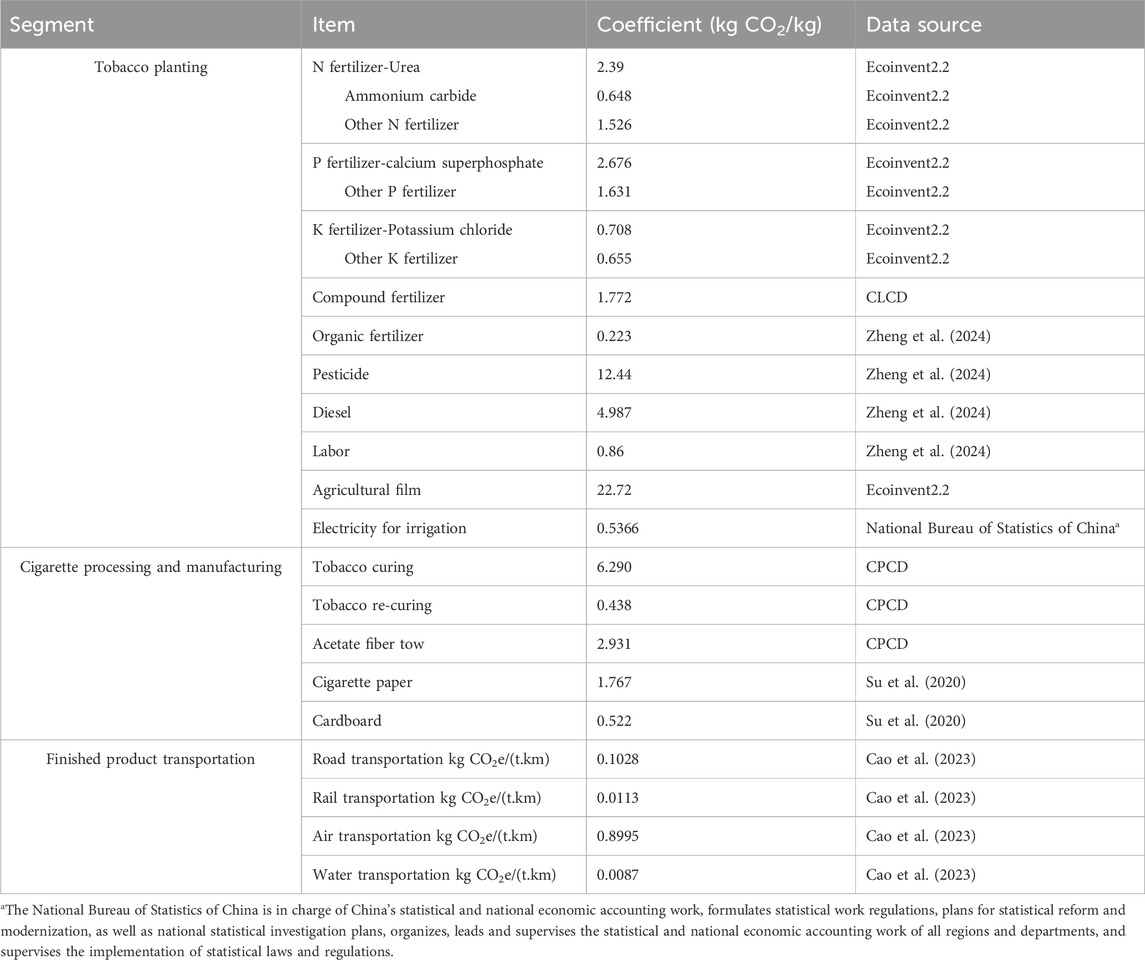
Table 2. Carbon emission factors in tobacco production.
3 Result and analysis
3.1 Composition of tobacco carbon footprint
This article divides the entire tobacco processing procedure into three parts: planting, manufacturing and transportation. Among them, the carbon emissions during the planting stage mainly involve fertilization, pesticide use, diesel, artificial labor and agricultural film use. The manufacturing stage mainly includes carbon emissions from the initial and re-drying of tobacco leaves, cigarette paper, cigarette cartons, and fiber bundles. The transportation stage mainly includes carbon emissions generated during railway transportation, road transportation and air transportation.
First, focusing on the tobacco planting stage, the core sources of carbon footprint include the whole life cycle carbon emissions from fertilizer application, labor inputs, agricultural film use and diesel fuel consumption, and the specific measurement results are shown in Figure 3. It can be clearly found that while the overall carbon footprint rises, the carbon emissions caused by the use of agricultural films increase significantly, while the carbon emissions caused by the use of fertilizers show a gradual downward trend. In view of the differences in carbon footprints of different types of fertilizers, this study further subdivided them into nitrogen fertilizer, phosphate fertilizer and potash fertilizer for consideration, and the results of the analysis showed that phosphate fertilizer had the highest carbon footprint contribution. In addition, in view of the possible N2O emission from leaching and decomposition of nitrogen fertilizers in the soil, this study also included it in the estimation of carbon footprint at the planting stage, but as shown in Figure 3, this kind of indirect emission accounted for a relatively low percentage.
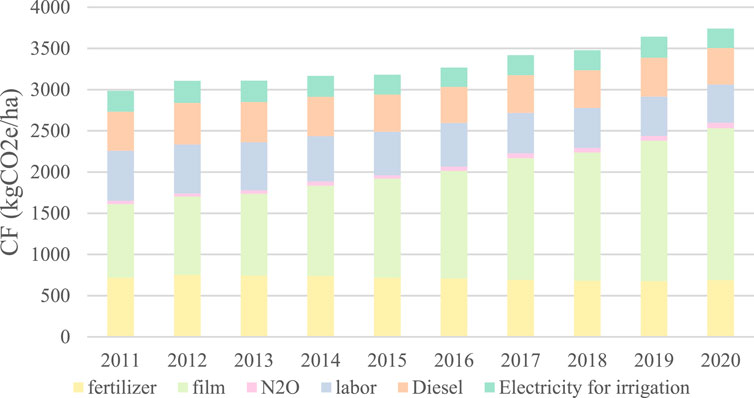
Figure 3. Carbon footprint structure per unit area of tobacco planting stage in 2011–2020.
Second, the carbon footprint of the first-curing and relaunching stages is particularly significant given their high energy demand characteristics (Zappe, 2020). Figure 4 shows the average carbon emissions per unit area of various provinces in China from 2011 to 2020. It can be found that the carbon emissions per unit area during the initial and re-drying stages of tobacco leaves account for nearly three quarters of the total carbon emissions in the cigarette manufacturing stage, highlighting the urgency of energy conservation and emission reduction in this link.

Figure 4. The average carbon footprint of each province during the processing and transportation phases from 2011 to 2020.
Finally, it can be seen from Figure 4 that the overall carbon footprint is relatively small, but air transportation exhibits a high carbon footprint due to its high energy consumption characteristics, compared with a low carbon footprint for waterway transportation. However, given that the current transportation of tobacco products is dominated by railroad and road transportation, with air and waterway transportation accounting for a lower proportion, the optimization strategy should focus on reducing the frequency of road transportation and increasing the proportion of railroad transportation as an effective way to reduce carbon emissions in the transportation stage.
After analyzing the carbon footprints of the three stages, it can be clearly pointed out that in the cigarette processing and manufacturing stage, tobacco leaf curing and cigarette manufacturing are the key links to reduce the overall carbon footprint. Among them, the tobacco leaf curing process is a priority in the emission reduction strategy due to its high energy consumption. Therefore, in order to effectively reduce the carbon footprint, the focus should be on optimizing the tobacco leaf curing technology, improving energy efficiency and exploring alternative energy sources in order to achieve the carbon reduction goal.
3.2 Trends in the overall carbon footprint of tobacco
According to the calculation results, it can be found that during the period of 2011–2020, the average value of carbon footprint per hectare of planting area in the tobacco planting segment is about 3.06tCO2e/ha, while the overall trend is slowly rising, and the carbon footprint per unit area of tobacco planting area grows from 2.73tCO2e/ha in 2011 to 3.50tCO2e/ha in 2020. The average value of carbon footprint per unit area of primary curing and re-curing is about 13.19tCO2e/ha and 0.92tCO2e/ha, respectively, and the carbon footprint per unit area of the processing link decreases from 14.29tCO2e/ha in 2011 to 14.07tCO2e/ha in 2020. It can be found that the value of the carbon footprint of the tobacco curing and processing period is gradually decreasing, which may be originated from the fact that the improvement of technology level makes the efficiency of tobacco curing per unit area rise, this effectively reduces carbon emissions. Meanwhile, in the cigarette manufacturing box stage, the average carbon footprint per unit area is about 0.43tCO2e/ha, and shows a decreasing trend year by year. In the transportation stage, this paper refers to the study of Li et al. (2017), and sets the average transportation distance from cigarette material transportation to cigarette factory and from finished cigarette product transportation to distribution center to be 250km, then the average carbon footprint per unit area produced by road transportation, railroad transportation, air transportation and waterway transportation in the transportation stage is about 80.82 kgCO2e/ha, 8.88 kgCO2e/ha, 707.18 kgCO2e/ha and 6.84 kgCO2e/ha, respectively. it is obvious that air transportation has the highest carbon footprint per unit area in tobacco transportation, followed by road transportation, while railroad and waterway transportation have the lowest carbon footprint.
Figure 5 visualizes the trend of the overall carbon footprint at the three stages. In a comprehensive analysis, the cigarette processing and manufacturing process has the largest carbon footprint, occupying about four-fifths of the total carbon footprint of the tobacco industry, followed by the tobacco growing process, while the transportation stage has a relatively small carbon footprint. In addition, the observation shows that the overall carbon footprint of the industry shows a small increase. Based on this, it can be inferred that the continuous optimization and upgrading of cigarette manufacturing technology is a key path to effectively reduce the carbon footprint value of the tobacco industry.
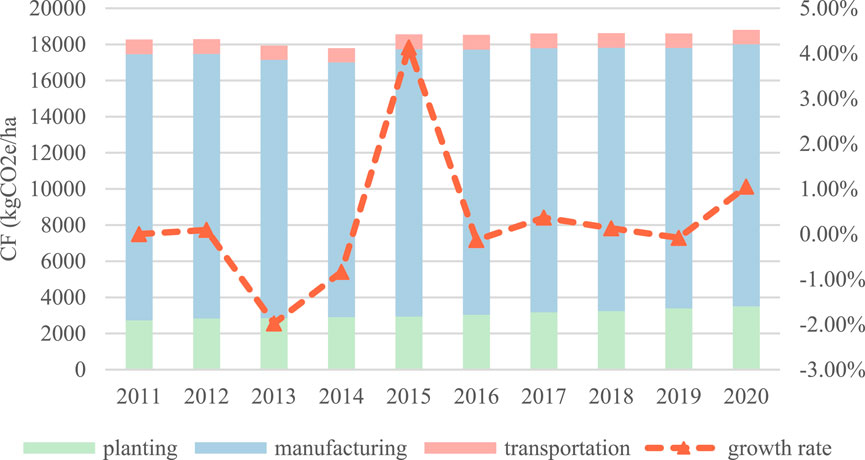
Figure 5. Carbon footprint per unit area of tobacco industry and its changing trend in 2011–2020.
3.3 Spatial and temporal distribution of tobacco carbon footprint
3.3.1 Analysis of carbon footprint characteristics by province
The average values of carbon footprint per unit area of different provinces in recent years at the stages of tobacco cultivation, cigarette processing and manufacturing, and transportation of finished products are shown in Figure 6 in (a)-(c), respectively. Firstly, in the planting stage, it can be found that the Southwest region has a larger investment in agriculture, while the Northeast region has a lower investment in agriculture and a lower carbon footprint. The above phenomenon is related to the tobacco planting area, which mainly grows in tropical and subtropical regions, and the climate in Yunnan and Guizhou is more suitable, the tobacco planting technology is more mature, and the sowing area is larger, resulting in a larger carbon footprint in the planting stage due to fertilizer, labor, and the use of agricultural film, etc. Secondly, in the cigarette processing and manufacturing stage, regions with higher tobacco production value per unit area, such as Inner Mongolia, although their tobacco planting area is not large, due to the high yield of roasted cigarettes per unit area, the carbon footprint value per unit area is significantly higher than those regions with large planting areas and relatively low yields. This indicates that the carbon footprint of cigarette processing and manufacturing process is not only related to the planting area, but also affected by the production efficiency per unit area. Finally, the spatial distribution of the carbon footprint of the finished product transportation stage is less different from that of the cigarette manufacturing stage, but overall, the carbon footprint value of the transportation stage is relatively low, less than one-tenth of that of the cigarette processing and manufacturing stage. Figure 6d represents the average value of carbon footprint per hectare of tobacco field in different provinces, where the average value of carbon footprint per unit area in northern China, such as Inner Mongolia and Gansu, exceeds 40,000 kgCO2e/ha, which is a large amount of GHG emissions. In contrast, the indicator is generally lower in the southern region, with most provinces below 25,000 kgCO2e/ha, reflecting significant regional differences in tobacco production and environmental impacts.

Figure 6. The average carbon footprint per unit planting area in different provinces (a–d). (a) Planting Stage (b) Manufacturing Stage. (c) Transportation Stage (d) Total carbon footprint.
3.3.2 Temporal trend analysis of regional carbon footprint
In Figure 6, it can be clearly observed that tobacco cultivation and its carbon footprint characteristics in Inner Mongolia, Yunnan Province, Guangdong Province and Heilongjiang Province show significant regional representation in terms of geographic distribution in China. Specifically, Yunnan Province has a more prominent carbon footprint in tobacco cultivation, while Heilongjiang and Guangdong provinces show higher carbon footprint levels in processing and manufacturing, and Inner Mongolia has the highest carbon footprint per unit of planted area in the whole industry chain. In order to understand these differences in depth, this paper then analyzes the carbon footprints of these four provinces in the key stages of planting, curing, crating and transportation. Meanwhile, in order to reveal the evolution trend of the carbon footprints in different segments between 2011 and 2020, this paper further analyzes the data of 2011, 2013, 2015, 2017 and 2020, and the results are shown in Figure 7. On the one hand, these six typical provinces all show higher GHG emissions in the curing stage, but with the economic growth and the continuous upgrading of curing technology, the carbon footprint in the curing stage shows a clear downward trend. On the other hand, it can be clearly found that Yunnan Province’s carbon footprint in the planting stage rises from 3% to 9% and accounts for the most among the four provinces, while Inner Mongolia’s planting stage has the smallest carbon footprint per unit area, which is related to the climatic characteristics of tobacco planting, it has higher requirements for light, water and soil conditions. Summarizing the results of the data analysis in Figure 7, it can be summarized that among the major tobacco growing regions in China, the primary curing and re-curing process of tobacco is the main contributor to GHG emissions, with its emissions accounting for about 75% of the total carbon footprint, and this process consumes a large amount of fossil energy. This is closely followed by the crating and planting process, while the transportation process has a relatively low carbon footprint. In terms of regional differences, in addition to the roasting stage, the Southwest region has the highest share of GHG emissions in the tobacco planting stage, with more than 16%; the Southeast region is the second highest, with 11% of GHG emissions in the planting stage; and the region north of the Yellow River, represented by Heilongjiang and Inner Mongolia, has the highest intensity of GHG emissions in the roasting stage due to the higher yield per unit of planted area, compared to the planting stage which has a GHG emissions accounted for a relatively small proportion. Furthermore, we have also found that in Henan, near the Yellow River, the characteristics of carbon emissions are similar to those in the areas north of the Yellow River.
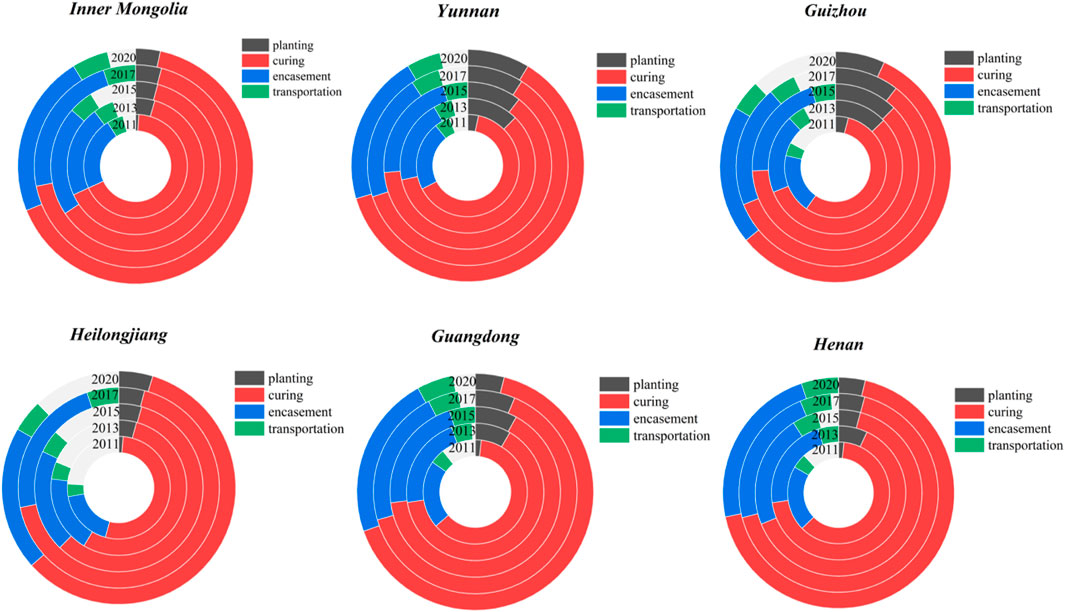
Figure 7. Carbon footprint per unit area of each region representing the province in 2011–2020.
3.3.3 Analysis of carbon emission potential in regional transportation stages
The previous text described the analysis of carbon emissions in the tobacco industry from planting to processing, manufacturing and transportation stages. However, considering that the carbon emissions during the transportation stage are not only affected by the quantity of tobacco transported, but also related to the traffic conditions in different provinces. Table 3 summarizes the average transportation density of 20 provinces from 2011 to 2020, which can to some extent reflect the transportation capacity of each province. It can be found from Table 2 that the transportation density in Shandong, Henan, Chongqing and other places is relatively high, indicating that the transportation capacity per unit area in these regions is relatively strong. However, the average transportation density in Inner Mongolia, Yunnan, Gansu and other places is relatively low. According to the carbon emissions during the transportation stage in Figure 6c, it can be found that the carbon emissions in Inner Mongolia, Gansu and other places are relatively large. This may be related to the fact that transportation is not convenient, but transportation must be carried out. Therefore, it can be found that transportation density is negatively correlated with carbon emissions, and the improvement of transportation conditions can also effectively reduce the carbon emissions generated by the tobacco industry in this province.
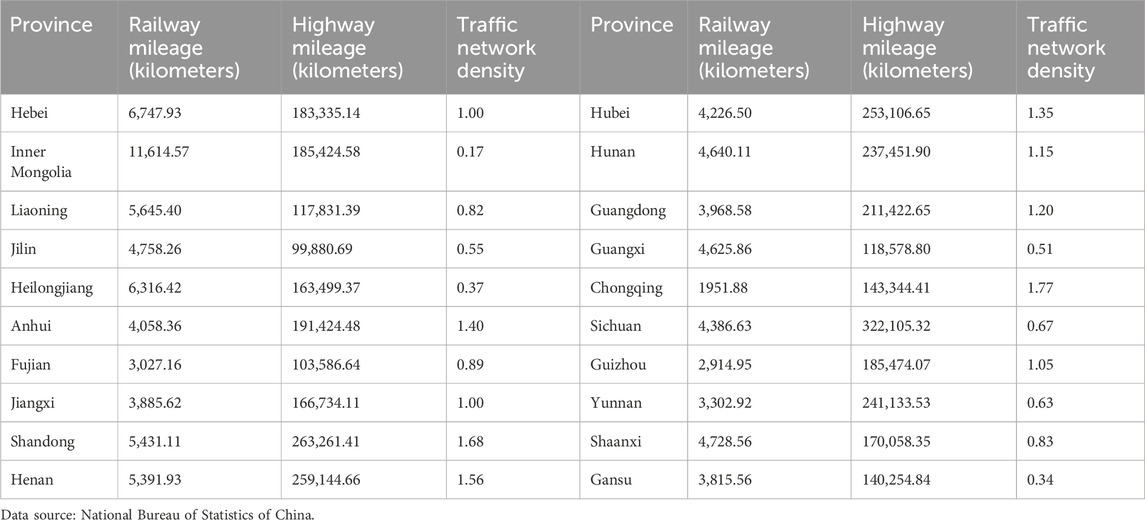
Table 3. Transportation conditions in various provinces.
3.4 Comparative analysis of input-output per unit area and carbon footprint of tobacco industry
Given that the input cost per unit area in the cigarette processing, manufacturing and transportation stages is often proportional to the regional output, and the potential for adjusting the carbon footprint is relatively limited, while the cost of inputs in the planting stage is deeply affected by a variety of factors, such as regional climatic characteristics, farmers’ planting habits, and policies and regulations, this part of the study focuses on the inputs and outputs per unit area in the planting stage and conducts an in-depth analysis of the carbon footprints. First, based on the average annual carbon footprint per unit area and average annual output, this study divides the 20 tobacco-growing provinces in China into four categories: high-emission and high-yield zones, high-emission and low-yield zones, low-emission and high-yield zones, and low-emission and low-yield zones. As shown in Figure 8, Shandong, Anhui and Inner Mongolia are high-emission and high-yield zones, while Yunnan and Guizhou provinces are located in high-emission and low-yield zones. Among them, although Inner Mongolia is in the high-emission and high-producing area, its planting carbon emissions are significantly lower than those of Anhui and Gansu, and its output significantly exceeds that of the two places, indicating that Inner Mongolia has the double advantage of high returns and low emissions in this area.
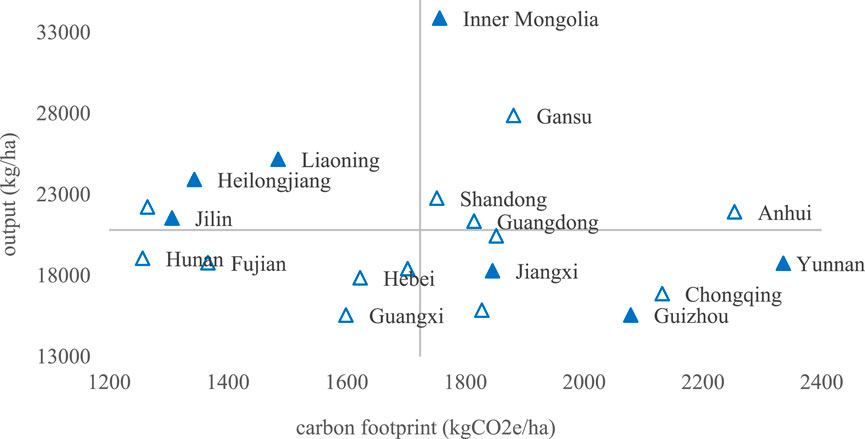
Figure 8. Planting carbon footprint and yield per unit area distribution in different provinces.
Second, in order to further compare and analyze the relationship between input costs and output per unit area in the tobacco industry, Figure 9 divides China’s 20 tobacco-growing provinces into four categories based on the average values of inputs and outputs: high inputs and high outputs, high inputs and low outputs, low inputs and high outputs, and low inputs and low outputs. Among them, it can be seen that four provinces, Inner Mongolia, Heilongjiang, Liaoning and Jilin, have higher outputs with lower inputs per unit planting area, while Guizhou, Yunnan and Jiangxi have high inputs and low outputs. Based on this, in the tobacco planting stage, Yunnan, Guizhou and Jiangxi provinces should actively explore the path of technological upgrading, learning from the advanced experience and technical solutions of Inner Mongolia and other high-efficiency planting areas, with a view to reducing the cost of inputs per unit of area and realizing the positive proportionality between inputs and outputs, thus enhancing the overall economic efficiency and environmental sustainability.

Figure 9. Distribution of yield and input cost per unit area of planting links in different provinces.
3.5 Robustness test
To further verify the accuracy of the previous calculations, this paper further uses the data from the 2021 “China Agricultural Statistical Yearbook” and the “China Statistical Yearbook” for verification. Given that the “China Statistical Yearbook” is released by the National Bureau of Statistics of China and is authoritative, it has the conditions for conducting robustness tests. Meanwhile, considering the data of Hebei and Liaoning in 2021 was missing, this paper adopted the remaining 18 provinces for verification, and the results are shown in Table 4. It can be found from Table 4 that the total carbon emissions from fertilization and agricultural films in each province in 2021 have a relatively small difference from the results of 2011–2020, indicating that the aforementioned research results are stable.
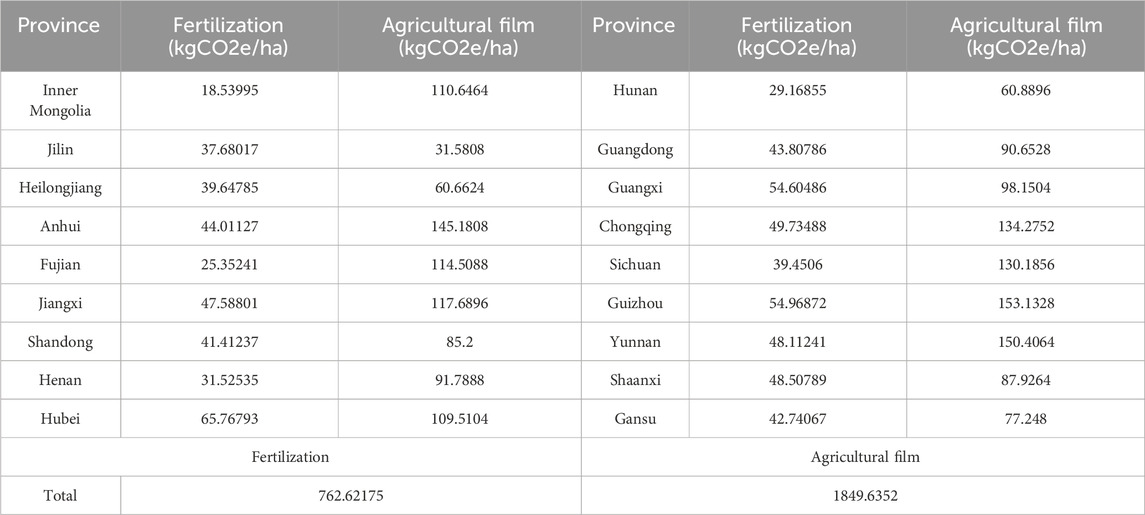
Table 4. Carbon emissions from fertilization and agricultural films in 2021.
4 Discussion
4.1 Changes in the carbon footprint of China’s tobacco industry
This paper found that the total carbon footprint of the industry increased from 21,485.12kgCO2e/ha to 21,966.28kgCO2e/ha in the calculated segment, with an overall upward trend. This is mainly due to the increase in China’s tobacco production in recent years. The demand for transportation has increased, and at the same time, the current supply chain efficiency is relatively low and cannot well meet the development needs of the entire tobacco industry. Figure 10 further reveals the fluctuation of carbon footprint per unit area from 2011 to 2020 in different tobacco-growing provinces, and it is found that Inner Mongolia has the highest carbon footprint per unit area, while Hebei has the most obvious fluctuation of carbon footprint per unit area as a whole, with the largest difference of 10tCO2e/ha. This phenomenon may be affected by the combined effects of multiple factors, such as accelerated urbanization and improvement of the vocational and technical level of tobacco farmers.
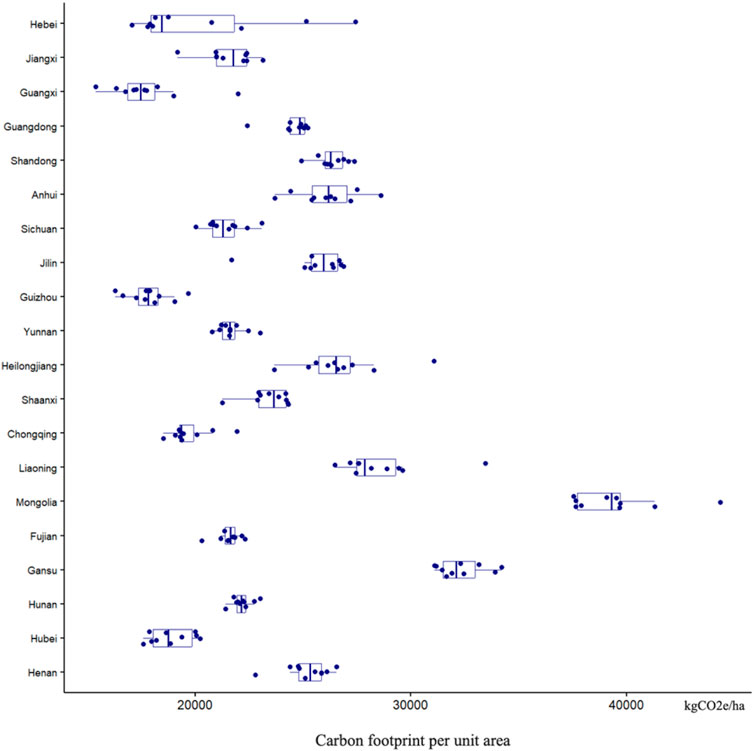
Figure 10. Fluctuations of carbon footprint per unit area in different provinces in 2011–2020.
As one of the largest tobacco producing and consuming countries in the world, China has a huge tobacco industry chain. As the scale of the industry continues to expand, especially the continuous growth of cigarette production, the carbon emissions generated by the tobacco industry during the production process have increased accordingly. However, according to the National Bureau of Statistics of China, although the tobacco industry has maintained production growth, the introduction of scientific fertilization methods and improvements in curing technology have slowed the carbon footprint growth rate. On the one hand, this may be due to China’s accelerated green transformation of the tobacco industry, which promotes the scale of tobacco cultivation, professionalization of tobacco farmers, service specialization, and the increasing level of operating machinery; on the other hand, initially cigarette consumption rose year after year, driven by the domestic macroeconomic improvement, population growth, and the rise in per capita income, but with the increase in people’s health awareness, the demand for cigarettes declined year after year, which led to a tobacco production growth rate declined slightly (Zafeiridou et al., 2018).
4.2 Composition and province distribution of the tobacco industry’s carbon footprint
The composition of the tobacco carbon footprint is complex and varied, mainly including three stages: agricultural cultivation and production, cigarette processing and manufacturing, and transportation of finished products. Tobacco planting is the initial stage of the carbon footprint. This stage involves the processes of land cultivation, fertilization, irrigation, pest control and harvesting, all of which generate a certain amount of carbon emissions. In particular, the use of chemical fertilizers and pesticides not only increases the carbon stock in the soil, but also may enter water bodies through runoff and percolation, causing secondary pollution (Liu et al., 2014). Currently, several studies have shown that agricultural GHG emissions mainly originate from fertilizer use (Wang et al., 2017; Guo et al., 2022), in which carbon emissions caused by N fertilizer use accounted for more than half of all fertilizers, and at the same time, fertilizer use accounts for the highest percentage of the carbon footprint per unit area of tobacco during the planting stage. It is worth noting that compound fertilization is a feasible solution to address the decline in soil fertility under intensive farming conditions and may reduce greenhouse gas emissions. Compared with using mineral fertilizers alone, this solution not only increases crop yields but also reduces environmental risks (Abrahão et al., 2021). In China, tobacco farmers generally lack knowledge related to scientific fertilization, which leads to an increase in the carbon footprint of fertilizer use in tobacco production. In addition, when calculating the composition of the carbon footprint at the tobacco planting stage, this paper found that the GHG emissions from the use of agricultural films exceeded the impact of fertilizer application, and that China’s reliance on agricultural films is growing at an average rate of 2.31% per year. Now, the use of agricultural films is a necessary stage of tobacco planting cultivation in China. Although it improves the economic benefits of tobacco cultivation (Shan et al., 2022), the white pollution it brings poses a new challenge to environmental management during tobacco cultivation. Therefore, reducing the use of agricultural films is the key to reducing emissions from tobacco production.
Tobacco leaves are roasted, shredded and rolled to make final products such as cigarettes. This stage requires a large supply of energy, such as the combustion of fossil fuels like coal and oil, which directly contributes to the emission of greenhouse gases such as carbon dioxide (Siddiqui and Rajabu, 1996). At the same time, the disposal of waste generated during processing also results in additional carbon emissions. In this study, the carbon footprints of the initial roasting, re-roasting, and cigarette box manufacturing processes were measured, and it was found that the initial roasting process has the highest GHG emission value, which is mainly due to the need for further improvement in the technology of the roasting ovens, which have more serious heat loss and high coal consumption, and therefore the carbon footprint value of this segment is higher. Transportation, mainly refers to the transportation of tobacco products from the raw material source to the processing plant, and then from the processing plant to the sales terminal, the transportation of tobacco products will consume a large amount of fuel, generating carbon emissions. With the continuous expansion of the logistics network and the improvement of transportation efficiency, although the carbon footprint of transportation per unit of product has decreased, the overall scale is still on the rise. However, compared with the tobacco planting and cigarette processing and manufacturing phases, the transportation phase has lower GHG emissions, and rail transportation, which has a smaller carbon footprint, should be promoted as the main mode of transportation.
In addition, when consumers use tobacco products, such as the smoke generated by the smoking process contains a large amount of carbon dioxide and some harmful gases, although this part of the emission is not directly counted in the carbon footprint of the tobacco industry, it is still an important part of the life cycle carbon emissions of tobacco products.
The carbon footprint of tobacco production per unit area shows significant regional differences among Chinese provinces. As shown in Figure 6a, the carbon footprint of tobacco cultivation in the region around the Yangtze River is particularly prominent, and this significant difference is mainly attributed to the unique geographic cultivation characteristics of the region. As a major grain production base, excessive fertilization is common in this area (Cai et al., 2012). Therefore, improving the efficiency of fertilizer use is a key strategy to reduce the amount of fertilizer used and thus effectively reduce the carbon footprint at the planting stage. Further analysis reveals that the overall carbon footprint of tobacco production in China varies greatly among regions, which is mainly affected by the unique climatic conditions, topography and soil type of different tobacco regions. Figure 11 shows the total carbon emissions of the three stages of planting, manufacturing and transportation in different provinces. Combining the data on planting area and tobacco production per unit area, Figure 11 clearly shows that Yunnan and Guizhou regions have the highest average annual carbon footprints in the tobacco industry, with annual GHG emissions estimated to be more than 5 million tons. In contrast, Inner Mongolia and other regions have a relatively low carbon footprint in the tobacco industry, yet their tobacco production per unit area shows a high level. This is due to the fact that Inner Mongolia is located in the mid-latitude zone and has excellent climatic conditions with rain and heat, which is extremely favorable to the growth of tobacco. In addition, the cities in the region where tobacco is grown are generally economically weak and therefore receive focused policy support, with tobacco enjoying policy advantages as the main cash crop in the region (Ying et al., 2012). Together, these factors have resulted in relatively low agricultural input costs in Inner Mongolia and lower labor costs than in coastal provinces compared to other resource-poor regions, resulting in higher yields per planted area. However, the relatively small overall acreage has resulted in the total carbon footprint of tobacco production in the region remaining at a low level.
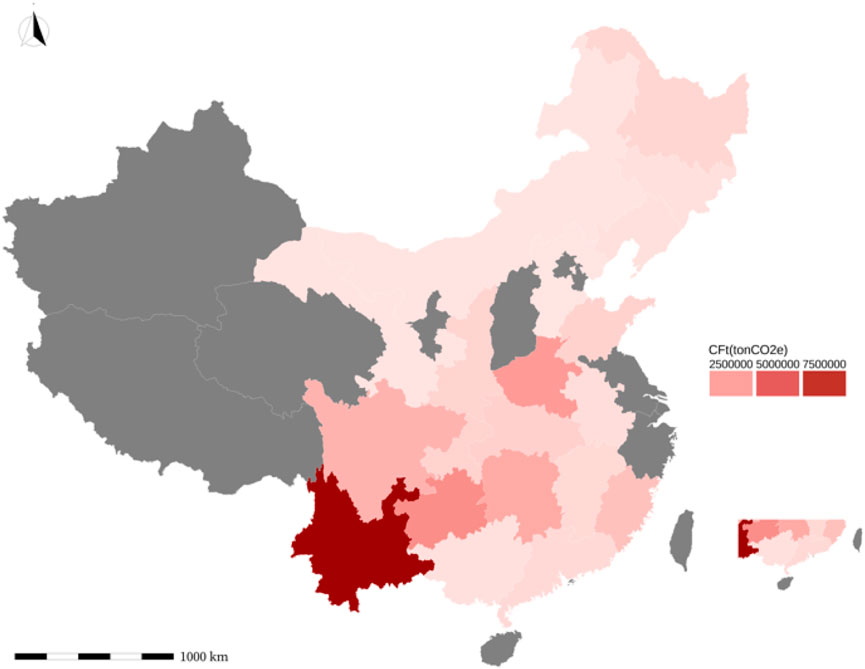
Figure 11. Total carbon footprint by province.
4.3 Analysis of input cost and carbon footprint of tobacco industry
The tobacco industry has high annual input costs, mainly consisting of raw material input costs and labor costs. The above analysis of provincial data explains the emission intensity and degree of economic return per unit planting area within China’s tobacco growing regions, and finds that the southwest tobacco region has higher economic inputs, but low output per unit area and higher GHG emissions, while Inner Mongolia and Heilongjiang have the advantage of low inputs and high output, while being able to effectively control GHG emissions. At present, China’s tobacco industry is facing the double pressure of high input and high emission. In response, the government has introduced a number of policy measures aimed at regulating the industry’s energy consumption and carbon emissions. Meanwhile, at the end of 2016, the State Tobacco Monopoly Administration (STMA) also clarified the target of reducing carbon dioxide emissions per unit of industrial added value by 18% by 2020. It is worth noting that the tobacco industry, as one of China’s important tax pillars, has made a significant contribution to the country’s fiscal revenue. However, with the intensification of tobacco control and the increasingly competitive market environment, the growth rate of the tobacco market tends to slow down, and the economic efficiency of tobacco enterprises is facing a severe test.
In view of this, how to balance the input and output with the intensity of greenhouse gas emissions is an urgent issue that needs to be solved nowadays. In this study, China’s tobacco-growing provinces are divided into four categories according to the degree of output and pollution emissions and inputs and outputs, respectively, and the input and output characteristics of different provinces in the planting process and their differences in GHG emission intensity are depicted in detail. The results show that the phenomenon of low outputs and high emissions as well as high inputs and low outputs in Yunnan, Guizhou, and Jiangxi, respectively. Yunnan- Guizhou region is a major tobacco-growing province. The income from tobacco cultivation accounts for a relatively large proportion of the province’s total income. By 2025, the operating income of the tobacco industry in Yunnan will account for approximately 13.8% of the province’s GDP. However, the current situation of high input and low output in tobacco cultivation within the province still needs further improvement. It can also be found from Figures 7, 8 that the yield per unit area in Yunnan region is relatively low, but the total carbon footprint per unit area is relatively high, indicating that there is considerable waste throughout the entire life cycle of tobacco. At the same time, tobacco revenue accounts for a relatively large proportion in this region. However, high carbon emissions have led to an increase in the local government’s carbon reduction costs. Therefore, both the production technology and the baking technology in this region need to be further improved. The phenomenon was found to be due to the accelerated pace of urbanization and the shift of tobacco growing areas to more remote mountainous regions, resulting in low penetration of tobacco growing machinery and higher labor costs (Zheng et al., 2024). Therefore, the tobacco planting strategy should be adjusted to this region to ensure the sustainable development and profitability of the tobacco industry from an economic point of view.
4.4 Carbon footprint analysis during the transportation stage
Compared with the existing literature that mainly focuses the research perspective on the tobacco cultivation stage from “cradle” to “agricultural gate”, this paper takes into account that both the tobacco roasting and transportation processes will generate a considerable amount of carbon emissions. Based on this, this paper uses the life cycle assessment method and refers to existing literature to calculate the carbon emissions during the tobacco transportation stage. Among them, air transportation, as a relatively convenient and fast mode of transportation, has the largest carbon emissions, while railway transportation and waterway transportation have relatively smaller carbon emissions. This is mainly due to the fact that air transportation requires a large amount of aviation fuel, and the energy consumption per unit of transportation volume is much higher than that of railway and waterway transportation. Meanwhile, the carbon emission factor of aviation fuel is relatively high, further exacerbating the carbon emissions of aircraft transportation. In contrast, railway and waterway transportation mainly rely on energy sources such as electricity or diesel, and their energy consumption per unit of transportation volume is much lower than that of air transportation. Meanwhile, compared with aviation fuel, railway and waterway transportation have a smaller carbon emission factor, which helps to reduce carbon emissions. In addition, railway and waterway transportation have the characteristics of large capacity, long distance and low cost, with relatively high transportation efficiency, which also helps to reduce carbon emissions per unit of transportation volume.
In fact, road transportation is the main body but accounts for a high proportion of carbon emissions. During the transportation stage of the tobacco industry, although road transportation is flexible and convenient, its problems of high energy consumption and high emissions are becoming increasingly prominent. The carbon emissions from road transportation account for the vast majority of the total carbon emissions in the transportation sector and are the main source of the carbon footprint in the transportation stage of the tobacco industry. For tobacco products that need to be transported over long distances, although air transportation is fast, its carbon emissions are also significantly higher than those of other modes of transportation. Therefore, in the transportation stage of the tobacco industry, the use of air transportation should be minimized as much as possible to reduce the carbon footprint. In addition, railway and waterway transportation, as low-carbon and environmentally friendly transportation methods, have great application potential in the transportation stage of the tobacco industry. By optimizing the transportation structure and increasing the proportion of railway and waterway transportation, the carbon footprint of the tobacco industry during the transportation stage can be effectively reduced.
4.5 Influencing factors of tobacco industry carbon footprint
Summarizing the above studies, it can be found that the carbon footprint is larger in the production of raw materials and the processing and manufacturing of cigarettes. First, modern agriculture relies heavily on chemical fertilizers and pesticides to increase yields, but the production of these products requires the consumption of large amounts of fossil fuels and emits greenhouse gases during production. Excessive use of fertilizers and pesticides may also disrupt soil structure and reduce the soil’s ability to sequester carbon. In cigarette processing and manufacturing, high temperatures are required for curing and drying, and these processes usually use energy sources such as coal, natural gas, or electricity, which are major sources of GHG emissions (Yu and Li, 2021). Meanwhile, older, inefficient production equipment tends to consume more energy and emit more carbon. Adopting modern, efficient equipment and technologies can effectively reduce energy consumption and GHG emissions. In the transportation segment, there are significant differences in energy consumption and carbon emissions among different modes of transportation (Galiza et al., 2025). For example, road transportation has a high carbon emission intensity, while rail and water transportation are relatively low. The choice of transportation mode for tobacco products directly affects the size of their carbon footprint.
In addition, as consumers’ health awareness improves and the concept of environmental protection becomes more popular, the market demand for low-tar and low-hazard cigarette products continues to increase. In order to meet market demand, tobacco companies have increased their R&D efforts and launched a series of new tobacco products, such as e-cigarettes and heated non-combustible tobacco products. These new products are usually characterized by smokelessness, low tar, fewer harmful substances, etc., and can be used indoors, thus reducing carbon emissions during tobacco consumption to a certain extent. However, due to the relatively small market share of new products and the fact that their carbon emissions during production and use still need to be further researched and evaluated, it is difficult to have a significant impact on the overall carbon footprint of the tobacco industry in the short term.
4.6 Limitations of this study
The research limitations of this article mainly focus on the availability of data. When calculating the carbon footprint of each province, this paper did not take into account the carbon emissions caused by labor and pesticides, nor did it consider the differences in calcination techniques among the provinces. Although these omissions limit the full applicability of the results of the study, the results are still valid and can provide valuable lessons for promoting sustainable production in the tobacco industry and realizing carbon emission reduction in the agricultural sector.
5 Conclusion and policy recommendations
This paper adopts the life cycle assessment method to carefully analyze the carbon footprint of the whole industrial chain of China’s tobacco industry from the tobacco planting to the transportation of finished products from 2011 to 2020, revealing its composition, influencing factors and dynamic changes. The results found that the average carbon footprint per unit area of the whole industrial chain of China’s tobacco industry was 21,570.54 kgCO2e/ha, and showed a yearly increasing trend. Among them, the use of agricultural films in the tobacco production chain has the highest carbon footprint, followed by the use of chemical fertilizers. The national average carbon footprints of the two from 2011 to 2020 were 22.63 thousand kgCO2e/ha and 11.84 thousand kgCO2e/ha respectively. Among the cigarette processing and manufacturing chains, the carbon footprint of tobacco leaf curing is the largest, reaching 297.27 thousand kgCO2e/ha. In the transportation chain, the carbon footprints of air transportation and road transportation are relatively high, at 21.26 thousand kgCO2e/ha and 2.42 thousand kgCO2e/ha respectively. In addition, the study also found that there are significant geographic differences in the carbon footprint of tobacco among different provinces. Further, this paper explores the intrinsic links between planting costs, output and carbon footprint of the tobacco industry, and points out that some provinces in the Southwest and Southeast regions have high inputs, low outputs and high carbon emissions.
In response to the above problems, this paper proposes a series of emission reduction strategies:
At first, the tobacco industry should actively introduce and adopt advanced production technologies and equipment to improve energy utilization efficiency and reduce greenhouse gas emissions. In the tobacco planting process, fertilizers such as nitrogen, phosphorus and potassium are scientifically applied based on the soil nutrient status and the fertilizer requirement pattern of tobacco. While ensuring the yield, attention is paid to the quality of tobacco cultivation, thereby reducing carbon emissions. In cigarette processing and manufacturing, the use of clean energy and renewable energy is promoted to reduce the consumption of fossil fuels and greenhouse gas emissions. In the transportation segment, choosing low-carbon and efficient transportation modes (such as railroad transportation, water transportation) can significantly reduce carbon emissions. Combine the advantages of different modes of transportation as much as possible to achieve multimodal transportation in order to improve transportation efficiency and reduce energy consumption and carbon emissions.
Data availability statement
Publicly available datasets were analyzed in this study. This data can be found here: https://www.stats.gov.cn/sj/ndsj/.
Author contributions
YJ: Writing – original draft, Data curation, Writing – review and editing. DL: Writing – original draft, Conceptualization, Writing – review and editing. ZS: Writing – original draft, Formal Analysis, Resources. JX: Writing – review and editing, Writing – original draft, Methodology. GZ: Writing – review and editing, Supervision.
Funding
The author(s) declare that financial support was received for the research and/or publication of this article. This paper is supported by the Fujian Province Tobacco Company Xiamen Municipal Company (research on Construction of Green Logistics System Based on “Three-Cycle Linkage”).
Conflict of interest
Authors YJ, DL, ZS, and JX were employed by Fujian Province Tobacco Company Xiamen Municipal Company.
The remaining author declares that the research was conducted in the absence of any commercial or financial relationships that could be construed as a potential conflict of interest.
Generative AI statement
The author(s) declare that no Generative AI was used in the creation of this manuscript.
Any alternative text (alt text) provided alongside figures in this article has been generated by Frontiers with the support of artificial intelligence and reasonable efforts have been made to ensure accuracy, including review by the authors wherever possible. If you identify any issues, please contact us.
Publisher’s note
All claims expressed in this article are solely those of the authors and do not necessarily represent those of their affiliated organizations, or those of the publisher, the editors and the reviewers. Any product that may be evaluated in this article, or claim that may be made by its manufacturer, is not guaranteed or endorsed by the publisher.
Footnotes
1ISO 14067, based on the Life Cycle Assessment (LCA) method, quantifies the greenhouse gas emissions of products throughout the entire process from raw material acquisition to disposal, and clearly defines the accounting scope of “from cradle to grave” or “from cradle to gate.”
References
Abrahão, R., Carvalho, M., and Causapé, J. (2017). Carbon and water footprints of irrigated corn and non-irrigated wheat in Northeast Spain. Environ. Sci. Pollut. Res. 24, 5647–5653. doi:10.1007/s11356-016-8322-5
Abrahão, R., Carvalho, M., and Causapé, J. (2021). Greenhouse gas emissions associated with four types of fertilization for corn crops in a Mediterranean basin. Env Prog Sustain Energy 40, e13681. doi:10.1002/ep.13681
Adu, D., Jianguo, D., Asomani, S. N., and Abbey, A. (2024). Energy generation and carbon dioxide emission—The role of renewable energy for green development. Energy Rep. 12, 1420–1430. doi:10.1016/j.egyr.2024.07.013
Alba-Reyes, Y., Sánchez-Valle, Y., Ramos-Aquino, R. G., Barrera, E. L., and Jiménez, J. (2024). Life cycle assessment of Nicotiana tabacum L.: sustainability of seedling alternatives. Energ. Ecol. Environ. 10, 79–93. doi:10.1007/s40974-024-00334-8
Baumann, H., and Rydberg, T. (1994). Life cycle assessment: a comparison of three methods for impact analysis and evaluation. J. Clean. Prod. 2, 13–20. doi:10.1016/0959-6526(94)90020-5
Cai, L., Wu, X., Goyal, A., Han, Y., Cui, W., Xiao, X., et al. (2012). Patterns and socioeconomic influences of tobacco exposure in tobacco cultivating rural areas of Yunnan Province, China. BMC Public Health 12, 842–848. doi:10.1186/1471-2458-12-842
Cao, G., Guo, X., Feng, C., Li, T., Cui, F., Xu, Y., et al. (2023). Carbon footprint accounting for cigar production processes: a life cycle assessment perspective. Chin. J. Popul. Resour. Environ. 21, 231–238. doi:10.1016/j.cjpre.2023.11.004
Galiza, J. M. F. G., Guillén-Lambea, S., and Carvalho, M. (2025). Comparative operational carbon footprints of a vehicle in Brazil: electric, ethanol, and gasoline. Clean. Energy Syst. 12, 100194. doi:10.1016/j.cles.2025.100194
Guo, L., Zhao, S., Song, Y., Tang, M., and Li, H. (2022). Green finance, chemical fertilizer use and carbon emissions from agricultural production. Agriculture 12, 313. doi:10.3390/agriculture12030313
Huang, W., Wu, F., Han, W., Li, Q., Han, Y., Wang, G., et al. (2022). Carbon footprint of cotton production in China: composition, spatiotemporal changes and driving factors. Sci. Total Environ. 821, 153407. doi:10.1016/j.scitotenv.2022.153407
Hussain, M., Zaidi, S. M. H., Malik, R. N., and Sharma, B. D. (2014). Greenhouse gas emissions from production chain of a cigarette manufacturing industry in Pakistan. Environ. Res. 134, 81–90. doi:10.1016/j.envres.2014.06.015
Li, B., Wei, K., Yi, J., and He, B. (2017). Analysis of carbon footprint of cigarette based on life cycle assessment. Tob. Sci. Technol. 50, 68–72.
Liu, R., Kang, Y., Zhang, C., Pei, L., Wan, S., Jiang, S., et al. (2014). Chemical fertilizer pollution control using drip fertigation for conservation of water quality in Danjiangkou Reservoir. Nutr. Cycl. Agroecosyst 98, 295–307. doi:10.1007/s10705-014-9612-2
Matthews, H. S., Hendrickson, C. T., and Weber, C. L. (2008). The importance of carbon footprint estimation boundaries.
Shan, T., Xia, Y., Hu, C., Zhang, S., Zhang, J., Xiao, Y., et al. (2022). Analysis of regional agricultural carbon emission efficiency and influencing factors: case study of Hubei Province in China. PLoS ONE 17, e0266172. doi:10.1371/journal.pone.0266172
Siddiqui, K. M., and Rajabu, H. (1996). Energy efficiency in current tobacco-curing practice in Tanzania and its consequences. Energy 21, 141–145. doi:10.1016/0360-5442(95)00090-9
Song, W., Elahi, E., Hou, G., and Wang, P. (2025). Collaborative governance for urban waste management: a case study using evolutionary game theory. Sustain. Cities Soc. 126, 106380. doi:10.1016/j.scs.2025.106380
Su, Y., Duan, H., Wang, Z., Song, G., Kang, P., and Chen, D. (2020). Characterizing the environmental impact of packaging materials for express delivery via life cycle assessment. J. Clean. Prod. 274, 122961. doi:10.1016/j.jclepro.2020.122961
Ti, J., Zheng, Y., Duan, W., Zhao, H., Qin, Y., Yin, G., et al. (2024). Carbon footprint of tobacco production in China through life-cycle-assessment: regional compositions, spatiotemporal changes and driving factors. Ecol. Indic. 165, 112216. doi:10.1016/j.ecolind.2024.112216
Verguet, S., Tarr, G., Gauvreau, C. L., Mishra, S., Jha, P., Liu, L., et al. (2017). Distributional benefits of tobacco tax and smoke–free workplaces in China: a modeling study. J. Glob. health 7, 020701. doi:10.7189/jogh.07.020701
Wang, Z., Chen, J., Mao, S., Han, Y., Chen, F., Zhang, L., et al. (2017). Comparison of greenhouse gas emissions of chemical fertilizer types in China’s crop production. J. Clean. Prod. 141, 1267–1274. doi:10.1016/j.jclepro.2016.09.120
Wang, Y., Guo, C., Chen, X., Jia, L., Guo, X., Chen, R., et al. (2021). Carbon peak and carbon neutrality in China: goals, implementation path and prospects. China Geol. 4, 720–746.
Xue, J.-F., Pu, C., Liu, S.-L., Zhao, X., Zhang, R., Chen, F., et al. (2016). Carbon and nitrogen footprint of double rice production in Southern China. Ecol. Indic. 64, 249–257. doi:10.1016/j.ecolind.2016.01.001
Yang, H., Wang, X., and Bin, P. (2022). Agriculture carbon-emission reduction and changing factors behind agricultural eco-efficiency growth in China. J. Clean. Prod. 334, 130193. doi:10.1016/j.jclepro.2021.130193
Ying, Z., Xingjiang, C., Kefeng, W., Hongbo, L., and Xiangyu, B. (2012). Soil nutrient classification and fertilization strategy for tobacco growth in Chifeng of Inner Mongolia. Chin. Tob. Sci. 33, 23–26.
Yu, D.-J., and Li, J. (2021). Evaluating the employment effect of China’s carbon emission trading policy: based on the perspective of spatial spillover. J. Clean. Prod. 292, 126052. doi:10.1016/j.jclepro.2021.126052
Zafeiridou, M., Hopkinson, N. S., and Voulvoulis, N. (2018). Cigarette smoking: an assessment of tobacco’s global environmental footprint across its entire supply chain. Environ. Sci. Technol. 52, 8087–8094. doi:10.1021/acs.est.8b01533
Zappe, A. L., Fernandes de Oliveira, P., Boettcher, R., Rodriguez, A. L., Machado, Ê. L., Mantey dos Santos, P. A., et al. (2020). Human health risk and potential environmental damage of organic and conventional Nicotiana tobaccum production. Environ. Pollut. 266, 114820. doi:10.1016/j.envpol.2020.114820
Zhang, X., Zhang, M., Zhang, H., Jiang, Z., Liu, C., and Cai, W. (2020). A review on energy, environment and economic assessment in remanufacturing based on life cycle assessment method. J. Clean. Prod. 255, 120160. doi:10.1016/j.jclepro.2020.120160
Zhang, J., Lu, H., Peng, W., and Zhang, L. (2025). Analyzing carbon emissions and influencing factors in Chengdu-Chongqing urban agglomeration counties. J. Environ. Sci. 151, 640–651. doi:10.1016/j.jes.2024.04.019
Zheng, Y., Qin, Y., Duan, W., Dong, W., Zhang, X., Yin, G., et al. (2024). Spatiotemporal variation of the carbon footprint of tobacco production from 2004 to 2017 in China. Front. Environ. Sci. 12, 1331530. doi:10.3389/fenvs.2024.1331530
Keywords: life cycle assessment, transportation activities, tobacco industries, carbon footprint, carbon emission
Citation: Jian Y, Liu D, Su Z, Xiao J and Zhang G (2025) Carbon footprint analysis considering transportation activities based on life cycle assessment: the case of tobacco industries of China. Front. Environ. Sci. 13:1654540. doi: 10.3389/fenvs.2025.1654540
Received: 27 June 2025; Accepted: 23 September 2025;
Published: 09 October 2025.
Edited by:
Adnan Abbas, Nanjing University of Information Science and Technology, ChinaReviewed by:
Monica Carvalho, Federal University of Paraíba, BrazilEhsan Elahi, Shandong University of Technology, China
Copyright © 2025 Jian, Liu, Su, Xiao and Zhang. This is an open-access article distributed under the terms of the Creative Commons Attribution License (CC BY). The use, distribution or reproduction in other forums is permitted, provided the original author(s) and the copyright owner(s) are credited and that the original publication in this journal is cited, in accordance with accepted academic practice. No use, distribution or reproduction is permitted which does not comply with these terms.
*Correspondence: Guowei Zhang, ejEwNzk3NDA3OTNAMTYzLmNvbQ==