 Zhengni Chen
 Wenzhen Zong1
 Quanlin Ma
- 1Gansu Academy of Forestry, Lanzhou, China
- 2Gansu Xinglong Mountain Forest Ecosystem Positioning Research Station, Lanzhou, China
- 3Beijing Weiruitai Technology Co., Ltd., Beijing, China
- 4Shaanxi Huayirui Technology Co., Ltd., Xian, China
The transition zone between the Qinghai–Tibet and Loess Plateaus is an important ecological functional area and carbon (C) reservoir in China. However, long-term monitoring data in this area are lacking, and the mechanisms underlying the carbon sink remain unclear. Using 6 years (2018–2023) of eddy covariance data from Xinglong Mountain, this study analyzed the response mechanisms of forest carbon fluxes to meteorological factors using structural equation modeling (SEM). The results showed that meteorological factors, including monthly average daily maximum radiation (Rg), monthly precipitation (PP), monthly average daily maximum vapor pressure deficit (VPD), monthly effective accumulated temperature (Tac), monthly average atmospheric temperature (Tair), and monthly average soil temperature (Tsoil), exhibited significant seasonal variations, peaking from June to August. Net ecosystem productivity (NEP), gross primary productivity (GPP), and ecosystem respiration (Reco) also exhibited significant seasonal variations, peaking from May to August. The forest ecosystem exhibited stable carbon sequestration (NEP: 299.64–448.62 g C m−2 a−1) from 2018 to 2023. SEM revealed that Rg and Tair were significant direct drivers of NEP; Reco was influenced directly by Tsoil and indirectly by Rg; and GPP was mainly affected directly and indirectly by Rg, and was also directly affected by PP and VPD. Overall, the forest ecosystem carbon fluxes at Xinglong Mountain were primarily subjected to direct and significant positive influences from Rg, PP, Tair, Tsoil, and VPD. This study provides mechanistic insights into the response of forest carbon cycling to climate change in semi-arid regions, which is highly significant for evaluating the ecological barrier function of the transition zone between the Qinghai–Tibet and Loess Plateaus.
1 Introduction
The annual average growth rate of global atmospheric CO2 concentration has reached 2.40 ppm in recent years (Le Quéré et al., 2020), making the climate change dynamics dominated by global warming increasingly urgent (Zhu et al., 2023). Some studies have shown that further intensification of extreme weather and disasters can only be effectively avoided when global warming is controlled within 1.5 °C (King et al., 2018; Masson-Delmotte et al., 2022), so adopting multiple methods of carbon sequestration under the premise of reducing carbon emissions is an important approach to achieving the goal of carbon neutrality.
Carbon fluxes represent instantaneous CO2 exchange rates (measured in μmol CO2 m-2 s-1), whereas carbon sink describes the accumulated net carbon storage (generally expressed in g C m-2 a−1). Carbon fluxes in forest ecosystems are key indicators for assessing the carbon sink function of forests. It not only characterizes the carbon exchange process between forests and the atmosphere but also exhibits significant spatio-temporal heterogeneity, which is primarily influenced by the combined effects of climate zones and geographical location. Forest carbon fluxes in different climate zones exhibit distinct response mechanisms. Tropical forest carbon fluxes are primarily regulated by precipitation and vapor pressure deficit (VPD) (Saleska et al., 2003), while temperate forests are more sensitive to changes in radiation and temperature (Baldocchi et al., 2001). Under the backdrop of climate change, the frequent occurrence of extreme weather events (such as droughts and heatwaves) may further alter the response patterns of forest carbon sinks (Reichstein et al., 2013). Therefore, conducting an in-depth analysis of the driving mechanisms of carbon fluxes in specific regions, particularly clarifying the intensity of key meteorological factors and their temporal scale dependencies, holds significant scientific importance for accurately assessing and predicting forest carbon sink potential.
In general, the key indicators of ecosystem carbon fluxes are the net ecosystem exchange (NEE), the gross primary productivity (GPP), and the ecosystem respiration (Reco), with NEE being the result of the joint action of GPP and Reco (Zhao et al., 2011; Sun S. et al., 2019). Meteorological factors (e.g., radiation, temperature, precipitation, and VPD) regulate GPP and Reco by affecting plant growth (Weltzin et al., 2003; Heimann and Reichstein, 2008; Barnes et al., 2016; Sun Z. et al., 2019), which, in turn, influences regional environmental carbon flux changes, and these effects exhibit uncertainties across different regions (Zhou et al., 2022). There is a strong and consistent relationship between forest carbon fluxes and meteorological factors in Asia (Hirata et al., 2008; Kato and Tang, 2008), and interannual NEE variations are generally caused by differences in precipitation and temperature (Granier et al., 2000). Studies in the semi-arid broad forest region of China have shown that radiation and rainfall are the main factors affecting the seasonal variation in carbon fluxes in this region (Tong et al., 2012). In addition, soil temperature is a major factor affecting Reco. Some studies found that, in forest ecosystems, soil temperature at a depth of 5 cm has a significant effect on nighttime Reco, which can explain 42%–55% of the nighttime Reco variation (Xu et al., 2018; Zhu et al., 2023). In summary, NEE exhibits a significant response to meteorological factors such as atmospheric temperature, VPD, radiation, soil temperature, and precipitation (Baldocchi and Vogel, 1996; Fang et al., 2020; Mamkin et al., 2022) and displays different response characteristics across different time scales (Granier et al., 2000).
The eddy covariance technique (Wang et al., 2024) is a high-precision method for measuring carbon flux exchange processes in ecosystems, which is capable of observing a variety of complex subsurface types over long periods of time through direct measurements of energy and material exchange fluxes between vegetation canopies and the atmosphere, and it has been widely used in the study of forest ecosystems’ climate change and carbon fluxes (Zhou et al., 2005; Chen et al., 2020; Qi and Wang, 2023)
The transition zone between the Qinghai–Tibet and Loess Plateaus is a sensitive area to global climate change and a fragile ecosystem. It is an important ecological functional area and carbon reservoir in China (Gao et al., 2022). Because of its geographic environment, characterized by high elevation and low temperature, and the fact that the critical ecological thresholds of various ecological environments are often in a critical state, this region is a key area for ecosystem response and feedback in the context of global change; it is also one of the most sensitive and vulnerable regions in the world (Xu et al., 2020; Gao et al., 2022), where changes in carbon fluxes have significant impacts on climate change, water source regulation, and carbon balance in China and Asia (Cao et al., 2017). Accurately assessing the carbon sink capacity of forest ecosystems in the ecological transition zone along the eastern margin of the Qinghai–Tibet Plateau (Hu et al., 2020) is of great practical significance for formulating scientifically sound forest management strategies and coping with climate change. Currently, the dynamics of forest ecosystem carbon fluxes and their driving mechanisms in the ecological transition zone between the Qinghai–Tibet and Loess Plateaus remain unclear. Therefore, in this study, we used the eddy correlation method to conduct site-specific observations of ecosystem carbon fluxes and meteorological factors in typical natural forest ecosystems at Xinglong Mountain, within the transition zone, over a period of 6 years (2018–2023). We then analyzed the characteristics of ecosystem carbon fluxes and meteorological factor changes to elucidate carbon flux dynamics and their driving factors in the Qinghai–Tibet Plateau. By analyzing the characteristics of ecosystem carbon fluxes and meteorological factors, this study aims to elucidate the intrinsic carbon cycle mechanisms in the forest ecosystems of Xinglong Mountain, an ecological transition zone between the Qinghai–Tibet and Loess Plateaus, and provide data supporting the response of forest ecosystems in this region to future climate change.
2 Materials and methods
2.1 Site description
The study area is located at the Gansu Xinglong Mountain Forest Ecosystem Positioning Research Station (Yuzhong County, Lanzhou City, China), with coordinates ranging from 35°38′ to 35°58′N and 103°50′ to 104°10′E (Figure 1). It lies within the ecological transition zone between the Qinghai–Tibet and Loess Plateaus. The mountain range extends approximately 37 km from east to west and 17 km from north to south, with an elevation range of 1,800–3,670 m (Gao et al., 2023). The region experiences a typical warm temperate continental monsoon climate, with an average annual temperature of 6.5 °C, an annual precipitation of 69.72 mm, and 149.79 mm of precipitation occurring from July to September. The annual total sunshine hours amount to 2,008.6 h, corresponding to a sunshine rate of approximately 54%. The predominant soil type is cinnamon soil, with limestone as the parent material, and the average soil depth is approximately 1.2 m. The forest is mainly composed of tree and shrub forests, with clear differences in vegetation distribution across slopes. The vegetation type changes with altitude on shady slopes. The dominant vegetation types are Populus davidiana–Betula platyphylla mixed forests, B. platyphylla–Picea wilsonii mixed forests, and P. wilsonii pure forests, and P. wilsonii is the sub-top community in this region. On sunny slopes, the dominant vegetation consists of Mongolian oak and shrubs. The total study area is 955 ha.

Figure 1. Map of the locality of the study area.
2.2 Carbon flux measurement and data processing
Carbon flux observations were conducted using data collected from the open-path eddy covariance (OPEC) system installed on the 30-m observation tower (35°51′38″N and 103°59′55″E, with an elevation of 2,503 m) at the Gansu Xinglong Mountain Forest Ecosystem Positioning Research Station between 2018 and 2023. The observation tower is situated on a north-facing slope, with the underlying surface consisting of forested land. The dominant vegetation is P. wilsonii, with a stand age of approximately 80 years, a tree density of 1,300 trees per hectare, a canopy closure greater than 90%, and a mean tree height of 15.0 m. The eddy covariance system comprises an open-path CO2/H2O infrared gas analyzer (LI-7500A, Li-COR, United States) and a three-dimensional ultrasonic anemometer (CSAT3, Campbell Scientific, United States), which measure the fluctuations in CO2/H2O concentrations, three-dimensional wind velocity, and virtual temperature. The data were sampled at a frequency of 10 Hz, with a flux averaging interval of 30 min.
Four layers of forest gradient meteorological sensors were installed at heights of 6 m, 14 m, 23 m, and 28 m above ground level on the observation tower to simultaneously monitor environmental meteorological factors in the natural P. wilsonii forest. Air temperature and relative humidity sensors (HMP155, Vaisala, Finland) and anemometers (Model WindSonic, Gill Instruments, United Kingdom) were installed at heights of 6 m, 14 m, 20 m, and 25 m. A net radiometer (CNR-1, Kipp & Zonen, Netherlands) was installed at a height of 20 m. Soil temperature and moisture sensors were placed at depths of 5 cm, 10 cm, 20 cm, 40 cm, 60 cm, 80 cm, and 160 cm, and soil heat flux was measured at a depth of 5 cm on both the east and west sides of the tower. All instruments were controlled using a data logger (CR6, Campbell Scientific, United States), with data recorded every 30 min.
The net ecosystem productivity (NEP) equals negative NEE. The NEE was calculated at a 0.5-h time interval using EddyPro (v.7.0.8, LICOR Inc., Lincoln, NE, United States) from the 10-Hz high-frequency flux raw data. Statistical screening included 2D coordinate rotation, block-averaging detrending, time-lag detection/compensation, instrument heat flux components, spectral corrections, Webb–Pearman–Leuning (WPL) correction, and micrometeorological flux quality control. Due to limitations under outdoor power supply conditions, the flux tower used in this study employed a purely solar-powered system. During periods of continuous rainy weather, an insufficient power supply led to data loss, resulting in a data loss rate of 32.66% for CO2 flux data recorded the 30-min intervals. The REddyProc package in R was used for Ustar filtering with the moving point test and seasonal thresholds, gap-filling missing NEE via marginal distribution sampling (MDS) that leverages co-variation with meteorological drivers and temporal autocorrelation, and partitioning NEE into Reco and GPP using nighttime flux partitioning.
The energy balance closure (EBC) was assessed. Using 30-min raw flux data from 2018 to 2023 and synchronized meteorological data, the linear closure of the sum of latent heat flux (LE) and sensible heat flux (H) relative to available energy (the net radiation minus the ground heat flux) was calculated. A total of 50,885 data points were analyzed for the 2018–2023 period. The linear regression slope was 0.72, with an intercept of 4.22 W/m−2 and an R2 value of 0.98 (Supplementary Figure S1). This slope falls within the range of 0.55–0.99 observed at FLUXNET global sites (Wilson et al., 2002), indicating good energy balance closure and reliable eddy covariance carbon flux data quality.
Meteorological data were synchronized and aggregated into 30-min intervals. The calculation of VPD was based on the literature (Zhou et al., 2022). Six key meteorological factors were selected: monthly average daily maximum radiation (Rg), monthly effective accumulated temperature (Tac), monthly average daily maximum vapor pressure deficit (VPD), monthly average atmospheric temperature (Tair), monthly average soil temperature (Tsoil), and monthly precipitation (PP).
2.3 Data analysis
The monthly relative anomaly (%) of meteorological factors or carbon fluxes over the 6-year period, defined as the difference between the specific value for a given month and the corresponding multi-year average for that month, was calculated using the following formula:
where i is the index for the year from 2018 to 2023 and j is the index for the month from January to December. ΔVarij is the monthly relative anomaly (%) of meteorological factors or carbon fluxes, Varij is the monthly meteorological factor or carbon flux, and
Principal component analysis (PCA) was performed on the six meteorological factors. The aim is to group the months of observation according to meteorological factors. One-way analysis of variance (ANOVA) and multiple comparisons were used to test the significance of differences between groups.
Structural equation modeling (SEM) was used to analyze the effects of meteorological factors on total and component carbon fluxes at the monthly scale. Five indicators were used to assess the model fit, namely, chi-square statistic/ degree of freedom (chi-square/df), goodness-of-fit index (GFI), comparative fit index (CFI), standardized root-mean-square residual (SRMR), and root-mean-square error of approximation (RMSEA), and the SEM constructed in the present study fitted well within these metrics.
Data analysis was performed using the R software package (version 4.2.1). PCA and clustering analysis (CA) were conducted using R scripts supported by Numerical Ecology with R (second edition). SEM and path analysis were conducted using the R packages lavaan and semPlot, respectively. To quantify the relative importance and influence pathways of meteorological factors (Rg, PP, Tac, VPD, Tair, and Tsoil) on forest ecosystem carbon flux indicators (NEP, GPP, and Reco) in this study, we used the three groups of data classified by meteorological factors and carbon fluxes for all months between 2018 and 2023 (6 years) to build SEM.
3 Results and discussions
3.1 Characteristics of meteorological factors
As shown in Figure 2, Tac, Rg, VPD, Tair, Tsoil, and PP exhibited significant seasonal fluctuations. Rg reached the maximum between May and August, while Tac and Tair began to increase significantly in June and reached the maximum in July; Tsoil increased 1–2 months later than Tair, peaking in August (Figure 2). VPD began to increase in April–May, reaching its peak in June–July. However, due to the rainfall time in Xinglong Mountain from July to September, PP remains relatively low at this time (June–July) (Figure 2), leading to insufficient water supply for plant growth and making this period the most water-stressed time of the year. From July to September, PP increased significantly, Tair gradually decreased, and both Rg and VPD began to weaken, alleviating water stress and marking the end of the seasonal drought period. △Varj values effectively quantify the degree of deviation of various meteorological factors from their averages, revealing the variability in different factors at different temporal and spatial scales. During the 6-year observation period, △Rg and △Tair showed the most significant fluctuations, while △Tsoil and △Tac were more affected by seasonal factors (Figure 2).
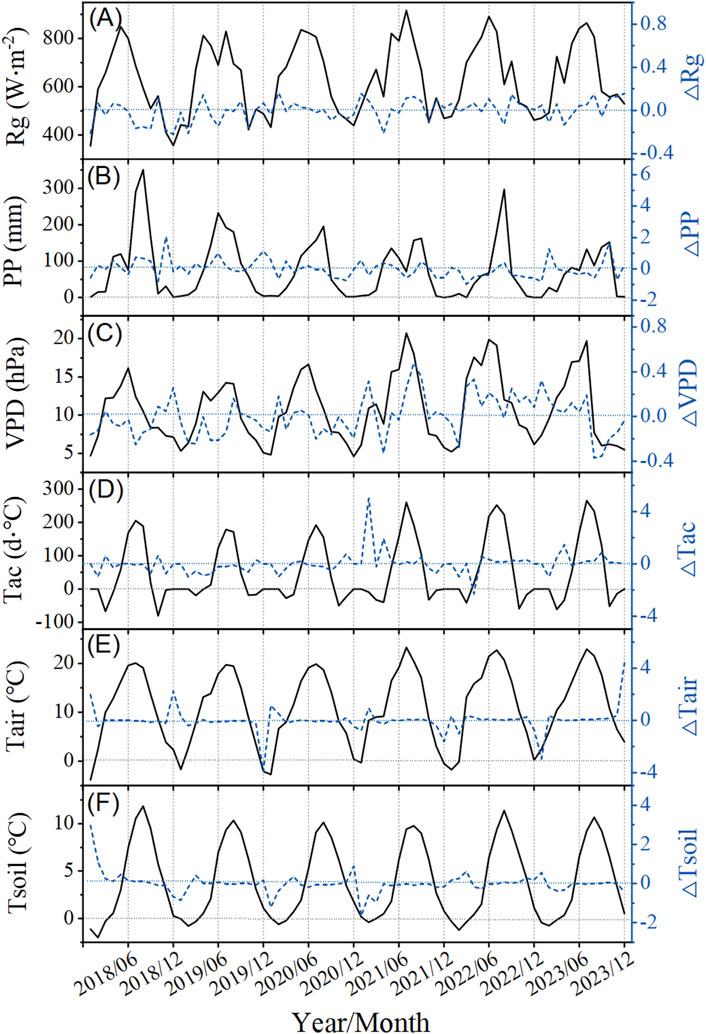
Figure 2. Monthly variations in meteorological factors from 2018 to 2023 on Xinglong Mountain. The left axis shows monthly averaged or accumulated values (the black straight line), and the right axis shows the relative anomalies (%) for each month within 6 years (the blue dotted line) (A–F). Rg is the monthly average daily maximum radiation (A), PP is the monthly precipitation (B), VPD is the monthly average daily maximum vapor pressure deficit (C), Tac is the monthly effective accumulated temperature (D), Tair is the monthly average atmospheric temperature (E), and Tsoil is the monthly average soil temperature (F).
3.2 Variations in carbon fluxes
The carbon source and carbon sink functions of forest ecosystems are significantly influenced by climate zones and geographical location. In low-latitude tropical and subtropical regions, forests typically exhibit a sustained and stable carbon sink function. In mid-to-high-latitude temperate and cold regions, due to climatic conditions resulting in higher precipitation and a higher proportion of deciduous tree species, forests exhibit pronounced seasonal variations in carbon fluxes, with a significant carbon sink during summer and a weak carbon source in winter (Malhi et al., 1999; Chen et al., 2015; Ma et al., 2019). The results of this study indicated that, in most of the observed years, the monthly NEP of the forest on Xinglong Mountain had positive values (Figure 3A), indicating that the forest ecosystem in this region acted as a stable carbon sink. The NEP exhibited significant seasonal variations. The NEP rapidly increased from March to April, reached a peak from May to June rapidly decreased from September to November, and remained at a low level from December to February (Figure 3A). However, in some observed years, NEP turned negative from November to January of the following year (Figure 3A), indicating a temporary carbon source, consistent with the carbon cycle patterns of temperate forests in the Northern Hemisphere, while also exhibiting significant regional specificity (Yu et al., 2014; Valentini et al., 2000).
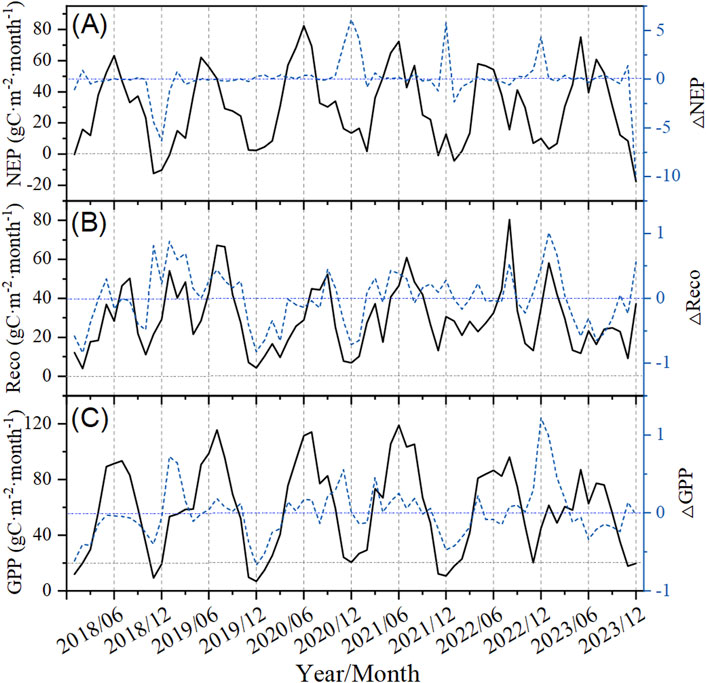
Figure 3. Monthly variations in carbon fluxes of the forest ecosystem from 2018 to 2023 on Xinglong Mountain. The left axis shows monthly carbon fluxes (the black straight line), and the right axis shows monthly relative anomalies within 6 years (the blue dotted line). NEP is the net ecosystem productivity (A), Reco is the ecosystem respiration (B), and GPP is the gross primary productivity (C).
The GPP of the forest ecosystem on Xinglong Mountain exhibited distinct seasonal dynamics between 2018 and 2023, with an initial increase followed by a decrease, with a maximum in July (Figure 3C). The GPP rapidly increased to higher levels driven by enhanced spring solar radiation. It is associated with the unique water–heat synchrony in the East Asian monsoon region where Xinglong Mountain is located, effectively enhancing light energy utilization efficiency (Zhang et al., 2018). The GPP during the growing season (May–September) contributed approximately 60% of the annual GPP (Figure 3C; Figure 4A). However, the increase in GPP during the growing season may have been significantly constrained by water stress (Zhou et al., 2021), reflecting the sensitivity of semi-arid forests to atmospheric drought (Stocker et al., 2018). During the winter (November–December), lower temperatures and insufficient radiation jointly inhibited vegetation photosynthesis, causing GPP to decrease to its lowest annual level, a pattern similar to observations in European temperate forests (Reichstein et al., 2007).
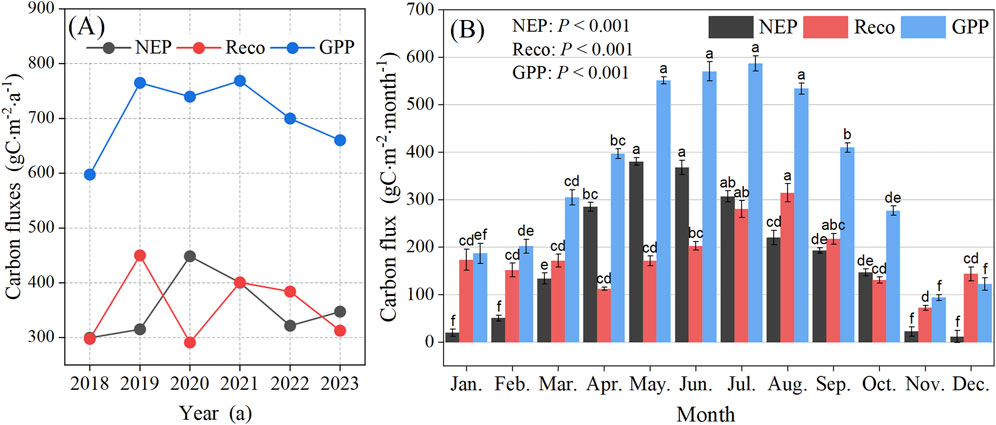
Figure 4. Monthly (A) and interannual (B) changes in carbon fluxes of the forest ecosystem on Xinglong Mountain. The data were analyzed using one-way ANOVA with the LSD post hoc test at a significance level of P = 0.05. Data are represented as the means ± SE (standard error) of six replicates. Different lowercase letters (a, b, c, d, e, and f) over the bars indicate significant differences (P < 0.05) in carbon fluxes among different months. NEP, net ecosystem productivity; Reco, ecosystem respiration; GPP, gross primary productivity.
The seasonal dynamics of Reco were generally synchronous with NEP and GPP. However, Reco exhibited more complex characteristics (Figure 3B), showing a steady increase from March to May, a sharp increase from June to August, with peaks typically occurring in July–August, and a significant decrease from September to November (Figure 3B). The sustained high levels of Reco in autumn (September–October) may be related to the delayed response of deep soil carbon pools (Schlesinger, 1997). This phenomenon has not been reported in forests in the East Asian monsoon region and warrants further investigation.
Between 2018 and 2023, the monthly relative anomalies (△NEP, △Reco, and △GPP) of NEP, Reco, and GPP of the forest ecosystem on Xinglong Mountain varied to different degrees (Figure 3). △NEP exhibited the largest fluctuation range, with extreme deviations observed in summer and winter, indicating the high sensitivity of net carbon exchange to seasonal and interannual climate variability and susceptibility of the net carbon sink function to disruption by extreme climate events (Yu et al., 2014; Zhou et al., 2021). △Reco exhibited the second-highest range of fluctuations. Combined with Tair variation characteristics (Figure 2E), the results of this study indicated that △Reco responded rapidly to short-term temperature changes (e.g., freeze–thaw and high temperatures) (Figure 3B), and locally abnormal high values may threaten carbon balance, reflecting the high dependence of respiratory processes on temperature (Reichstein et al., 2005). △GPP was relatively stable (Figure 3C), indicating a strong physiological regulatory capacity of vegetation. However, △GPP significantly increased during the growing season, suggesting that water and thermal conditions are the primary factors driving its changes during this period (Stocker et al., 2018; Zhang et al., 2018).
3.3 Carbon sink function of the forest ecosystem
On a global scale, NEP of temperate forest ecosystems typically ranges from 150 to 500 g C·m−2·a−1 (Luyssaert et al., 2007). Temperate forests in East Asia, due to their high synchrony of water and heat conditions during the growing season, may have significantly higher carbon sequestration potential than temperate forests at the same latitude in Europe and North America (Yu et al., 2014). The average NEP of China’s forest ecosystems is 380 ± 90 g C·m−2·a−1 (Yu et al., 2014), with the annual average NEP of evergreen broad-leaved forests reaching 388 g C·m−2·a−1 (Zhao et al., 2019), while temperate deciduous forests have an annual average NEP of 310 g C·m−2·a−1 and exhibit significant interannual fluctuations (150–450 g C·m−2·a−1) due to climate variability (Tong et al., 2012; Wang et al., 2019). However, the NEP of mixed evergreen coniferous and deciduous broad-leaf forests is only 44 g C·m-2·a−1 (Zhao et al., 2019).
Our results showed that the forest ecosystem on Xinglong Mountain exhibited outstanding carbon sink functions, with NEP ranging from 299.64 to 448.62 g C·m-2·a−1 (Figure 4A), placing it within the high-value range of global temperate forest NEP (150–500 g C·m-2·a−1). The pronounced interannual variability of NEP can be attributed to the following reasons: consecutive heavy precipitation events in 2018–2019 led to a significant increase in NEP in 2020 (448.62 g C·m−2) (Figure 4A). However, the prolonged high temperature and drought during 2021–2022 caused NEP to decrease annually until it began to recover in 2023, following a decrease in VPD. This pattern of change indicated that climate extremes exert a significant regulatory influence on carbon cycling processes in the Xinglong Mountain forest ecosystem by altering key environmental factors such as Tair, PP, Rg, and VPD (Reichstein et al., 2013). At the same time, the carbon sink function of the forest ecosystem on Xinglong Mountain exhibited distinct seasonal characteristics, with monthly NEP ranging from 11.34 to 379.96 g C·m−2·month−1 (Figure 4B). It significantly increased from May to July and significantly decreased from November to February of the following year. The seasonal dynamics of GPP and Reco exhibited asymmetric responses to environmental changes (Figure 4B) (Piao et al., 2020). In particular, the imbalance between the sudden enhancement of respiration and the gradual regulation of photosynthesis had contributed to the vulnerability of the forest carbon cycle on Xinglong Mountain forest, highlighting the special sensitivity of semi-arid ecosystems to global change (Legg, 2021).
3.4 Classification of groups based on monthly averaged meteorological factors
PCA was used to assess the importance of six meteorological factors in ranking monthly data (Figure 5; Table 1). PC1 and PC2 explained 69.4% and 18.0% of the total variance in meteorological data, respectively, with a cumulative contribution rate of 87.4% (Figure 5), indicating that these two principal components can effectively characterize the main variability features of the data. PC1 integrates variables closely related to energy balance and thermodynamic processes, reflecting the overall synergistic changes in meteorological indicators. All indicators had high positive loadings on PC1 (Table 1), indicating strong positive correlations among these indicators. Tair and Tac had the highest positive loadings on PC1, making them the core variables driving PC1 variability. PC2 revealed local or antagonistic differences in meteorological variables, corresponding to secondary patterns of dry/wet conditions or energy distribution. The high positive loadings of Tsoil and PP indicated that soil temperature and precipitation exhibited synergistic changes in PC2, reflecting the temperature buffering effect caused by increased soil moisture following precipitation events. Rg and VPD were positively correlated with PC1 but negatively correlated with PC2, indicating that under clear-sky conditions, radiation and vapor pressure deficit jointly drive overall warming while suppressing local precipitation. Tair and Tsoil exhibited consistent directions on PC1. However, on PC2, Tsoil was significantly positive, while Tair was nearly neutral, indicating that air temperature is primarily controlled by large-scale thermal processes, whereas soil temperature is more sensitive to local moisture conditions.
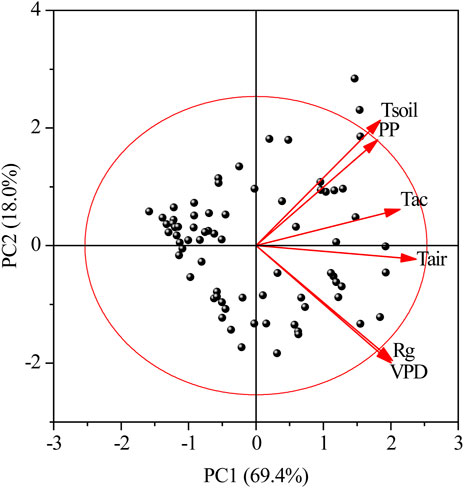
Figure 5. Meteorological factor PCA biplot. Rg is the monthly average daily maximum radiation; PP is the monthly precipitation; VPD is the monthly average daily maximum vapor pressure deficit; Tac is the monthly effective accumulated temperature; Tair is the monthly average atmospheric temperature; and Tsoil is the monthly average soil temperature. The red circle represents the equilibrium contribution circle, and the variables with vectors longer than the radius of this circle make a higher contribution than average.
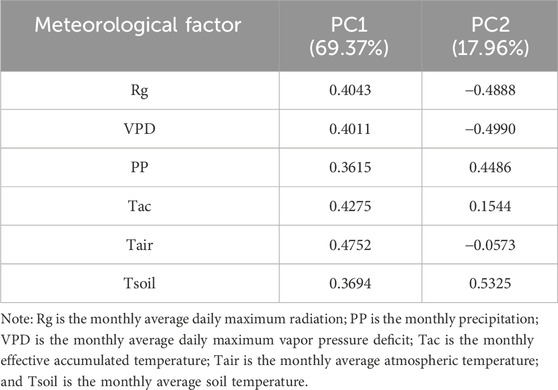
Table 1. Principal component load coefficients.
This study used a cellular automaton (CA) based on Euclidean distance combined with the Ward clustering method to group and analyze the observed months (Figure 6A). To determine the optimal number of groups and assess the reliability of PCA and CA grouping, we used Rg, PP, Tac, Tair, Tsoil, and VPD from 2018 to 2023 as reference indicators. By progressively setting the termination year (from 2023 to 2018) to calculate the difference rate, we found that the difference rate was highest for CA6 (most significant variation), while CA3 had the smallest difference rate (best stability) (Figure 6A). Therefore, the CA3 grouping scheme was selected, dividing the growth change stages of forest vegetation on Xinglong Mountain into three periods. This result indicated that a smaller number of classification groups (CA3) provides more stable monthly classification results, making it suitable for long-term ecological process analysis.
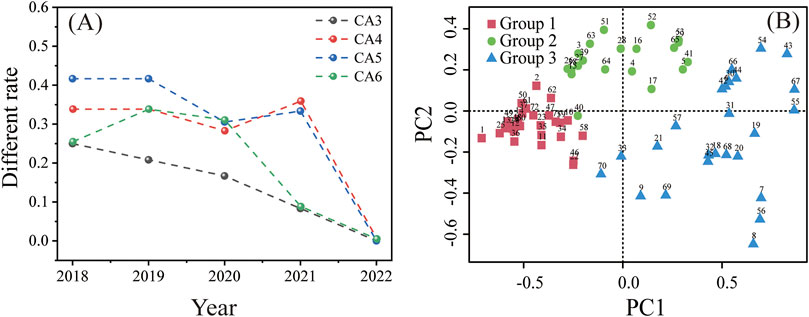
Figure 6. Rate of difference between the classification results based on meteorological factors from 2018 to the year shown on the abscissa and the classification results based on meteorological factors from 2018 to 2022 (A). The rate of difference is the proportion of months with differing classification results relative to the total number of months included in the classification. CA3–CA6 were based on the monthly average daily maximum radiation (Rg), monthly precipitation (PP), monthly average daily maximum vapor pressure deficit (VPD), monthly effective accumulated temperature (Tac), monthly average atmospheric temperature (Tair), and monthly average soil temperature (Tsoil) and were divided into three to six groups. PCA biplot with overlaid clustering results of meteorological factors (B). Group 1 represents the non-growing season, Group 2 represents the transition period, and Group 3 represents the growing season.
The meteorological factors of Xinglong Mountain form three distinct regions in the feature space across different months (Figure 6B), exhibiting significant differences in their distribution patterns and similarities. After PCA-corrected cluster analysis, the seasonal climate of Xinglong Mountain was divided into three groups, and the differences in meteorological factors and carbon fluxes among the groups were significant (Figure 7). Group 1 (October to February of the following year) samples were concentrated in the lower-left quadrant of the PCA space, corresponding to the non-growing season characterized by low temperature, low radiation, and low carbon fluxes, with good internal repeatability and consistency, indicating stable climatic conditions and weak plant physiological activity during this phase. Group 2 (March–May) samples shifted toward the positive direction of PC1, reflecting increasing temperature and radiation, while PC2 values increased, suggesting increased precipitation, exhibiting typical characteristics of the transition period from the non-growing season to the growing season. During this period, climatic conditions began to favor biomass accumulation but had not yet reached the most suitable growth state, and biomass accumulation rates remained relatively low. Group 3 (June–September) was significantly concentrated in the high-value region of PC1, indicating that high temperatures and high radiation drive carbon flux peaks, marking the main growing season on Xinglong Mountain, a period of the year with higher temperatures and relatively ideal growth conditions, where plant growth is active and biomass production reaches its peak. However, the degree of aggregation of Group 3 in the feature space was low, and intra-group repeatability and consistency were poor, revealing ecological process heterogeneity caused by meteorological fluctuations during the growing season.
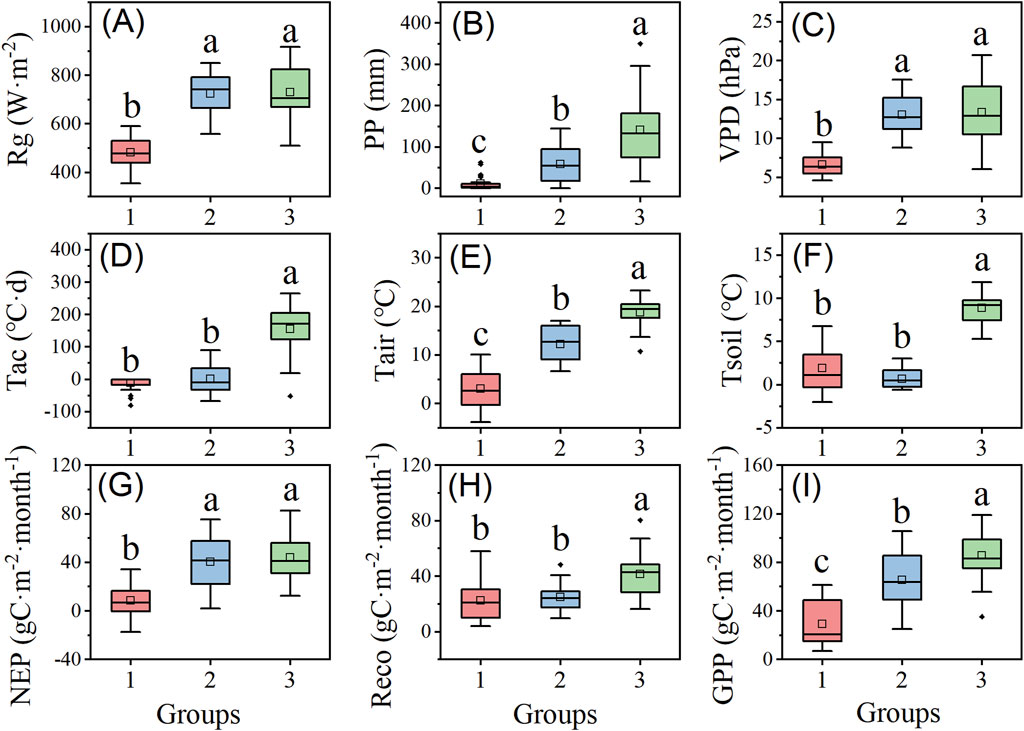
Figure 7. Meteorological factors and carbon fluxes in the three groups. Group 1 represents the non-growing season, Group 2 represents the transition period, and Group 3 represents the growing season. Rg is the monthly average daily maximum radiation (A); PP is the monthly precipitation (B); VPD is the monthly average daily maximum vapor pressure deficit (C); Tac is the monthly effective accumulated temperature (D); Tair is the monthly average atmospheric temperature (E); and Tsoil is the monthly average soil temperature (F). NEP is the monthly net ecosystem productivity (G), Reco is the monthly ecosystem respiration (H), and GPP is the monthly gross primary productivity (I). The data were analyzed using one-way ANOVA with the LSD post hoc test at a significance level of P = 0.05. Data are represented as the means ± SE (standard error). Different lowercase letters (a, b, and c) over the bars indicate significant differences (P < 0.05) in meteorological factors or carbon fluxes between the three groups.
3.5 Effects of meteorological factors on carbon fluxes
This study utilized three groups of data classified based on six meteorological factors (Rg, PP, VPD, Tac, Tair, and Tsoil) and ecosystem carbon fluxes (NEP, Reco, and GPP) for all months from 2018 to 2023 to construct SEM and quantify the relative importance and direct or indirect effects of meteorological factors on forest ecosystem carbon fluxes. As shown in Figure 8, in Group 1, Tac had a direct and significant negative effect on NEP; VPD had a direct positive effect on GPP; Tair indirectly increased GPP by increasing VPD; and VPD had a significant positive effect on GPP. Tsoil and Rg both had direct and significant negative effects on Reco, while PP and Tac indirectly regulated Reco by influencing VPD. In Group 2, both VPD and Tsoil directly and significantly influenced NEP; Tsoil had a significant positive effect on GPP; VPD had a negative effect on Reco; and Tac and PP indirectly regulated carbon fluxes by significantly influencing Tsoil. In Group 3, Rg had a significant direct positive effect on NEP and indirectly increased GPP through its significant positive effect on Tair; Tair had a significant positive effect on GPP; and VPD indirectly increased Reco by significantly affecting Tsoil.
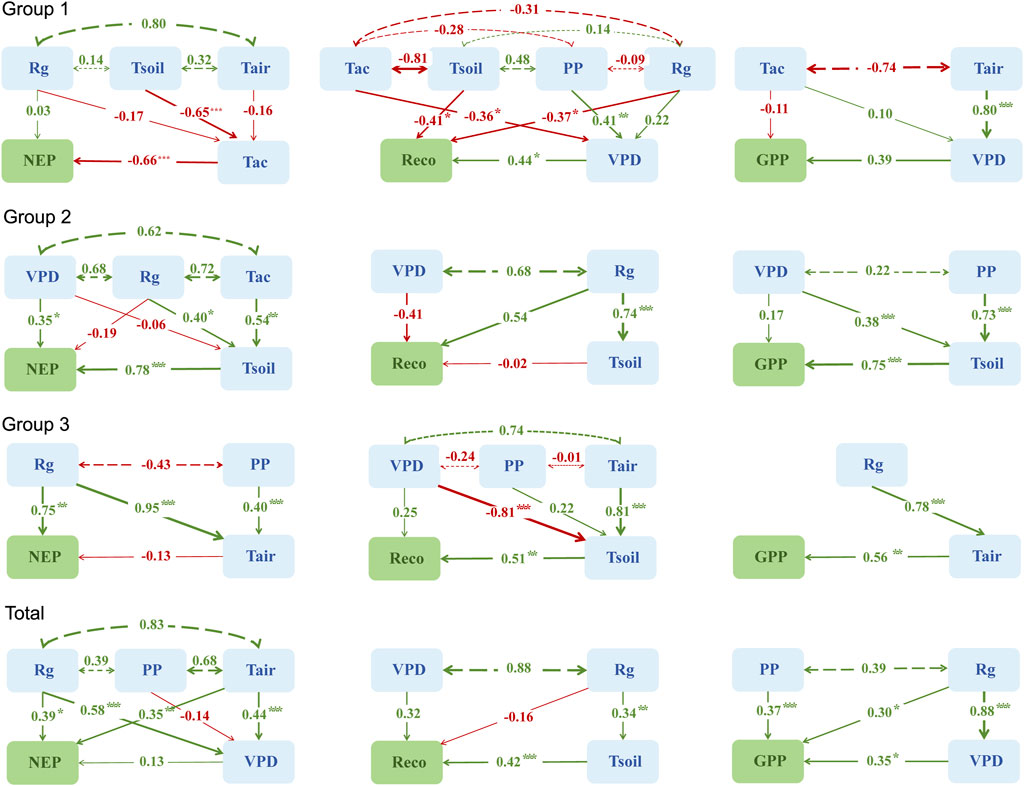
Figure 8. Structural equation modeling reflects the overall impact of six meteorological factors on forest ecosystem carbon fluxes on Xinglong Mountain. Double-headed dashed lines indicate non-significant covariances. The values on the solid arrows represent standardized coefficients (SCs), indicating the standardized total effect between variables. The thickness of the arrows indicates statistical significance, with thicker arrows indicating more significant differences. The asterisk (*) indicates a significant difference. *, P < 0.05; **, P < 0.01; ***, P < 0.001. The color of arrows indicates the direction of effects, with green arrows indicating positive effects and red arrows indicating negative effects. Group 1 represents the non-growing season, Group 2 represents the transition period, and Group 3 represents the growing season. Total represents all groups. NEP, Reco, and GPP represent net ecosystem productivity, ecosystem respiration, and gross primary productivity, respectively. Rg, monthly average daily maximum radiation; PP, monthly precipitation; VPD, monthly average daily maximum vapor pressure deficit; Tac, monthly effective accumulated temperature; Tair, monthly average atmospheric temperature; Tsoil, monthly average soil temperature.
Overall, Rg had a significant positive effect on NEP and GPP (Figure 8), suggesting that an increase in Rg promotes forest ecosystem carbon absorption on Xinglong Mountain. This result suggested that Rg is a key environmental driver regulating the carbon sink function in temperate forest ecosystems, consistent with the theoretical expectations of the Farquhar photosynthesis model (Farquhar et al., 1980). The results of this study were consistent with those from studies in temperate mixed forests in the United States, where Rg dominated NEE variations (Baldocchi and Vogel, 1996); they also align with findings from the conclusions of the global carbon flux observation network, demonstrating that the spatial pattern of NEE variations in forest ecosystems across latitudes is associated with Rg (Reichstein et al., 2007; Devi Kanniah et al., 2010; Ashton et al., 2012). The effect of Tair on NEP is mainly achieved by regulating the enzyme activity of photosynthesis and respiration. Within a certain range, NEP increases with Tair. However, higher Tair could reduce plant enzyme activity and cause stomata to close, thus leading to the phenomenon of a midday depression of photosynthesis (Baldocchi and Vogel, 1996). VPD had a direct and significant positive effect on GPP (Figure 8), indicating that an increase in VPD can simultaneously promote plant photosynthesis and transpiration, thereby accelerating ecosystem carbon absorption, consistent with the stomatal optimization theory (Medlyn et al., 2011). However, when VPD is high and drought stress is present, plants close their stomata to reduce transpiration efficiency while also closing stomata to enhance respiration (Tong et al., 2012; Shu et al., 2021), becoming one of the factors enhancing Reco, consistent with the “cumulus reflected radiation” theory (Segal and Davis, 1992). PP had a direct and significant positive effect on GPP (Figure 8), indicating that increased precipitation facilitates plant growth and carbon uptake. Observations in China’s semi-arid regions showed that, for every 1 mm increase in precipitation during the growing season, GPP increases by 0.3 g C m−2·d−1 (Liu et al., 2021). Additionally, in this study, Tair exhibited a positive synergistic effect with PP, in sharp contrast to the negative correlation observed in Europe’s summer arid regions (Reichstein et al., 2007), highlighting the core role of water–heat synchronization under a monsoon climate. Tsoil was a direct driver of Reco, while Rg exerted an indirect promotional effect on Reco by significantly enhancing Tsoil. Under the trend of decreasing forest carbon sink capacity due to global warming (Fang et al., 2020), the increase in Tsoil could become one of the key factors accelerating soil carbon release (Yu et al., 2014), with this effect being particularly pronounced during the late growing season and non-growing season. The results of the SEM indicated that the variations in the forest ecosystem carbon fluxes on Xinglong Mountain in the transition zone between the Qinghai–Tibet and Loess Plateaus were primarily significantly positively influenced by Rg, Tair, VPD, PP, and Tsoil.
The transition zone between the Qinghai–Tibet and Loess Plateaus is an ecologically fragile area where the Loess Plateau rises toward the Qinghai–Tibet Plateau. It is also one of the regions with the richest forest resources in China. Xinglong Mountain, located on the northeastern edge of the transition zone between the Qinghai–Tibet and Loess Plateaus, is extremely ecologically sensitive. This study focuses on this key ecological niche, and its findings provide important insights into the carbon cycle patterns of the entire eastern forest under climate change. However, this study also has certain limitations: current single-tower observations can only capture the carbon flux characteristics of specific altitude zones or forest types and cannot cover the spatial heterogeneity caused by extreme water–heat gradients, slope orientation, soil, and management activities. It is also difficult to analyze the nonlinear effects of drought or extreme precipitation on the carbon cycle in the transition zone between the Qinghai–Tibet and Loess Plateaus. If directly applied to a larger scale, this will significantly amplify the uncertainty of carbon sink assessments. Future research should expand the scope of forest ecosystem carbon flux monitoring in this transition zone. On the one hand, fixed EC towers should be distributed along elevation, vegetation, and climate gradients. On the other hand, satellite remote sensing technology should be used to infer regional vegetation productivity, and flux tower observation data should be used as a benchmark to calibrate regional carbon flux models, thereby reducing the uncertainty in carbon sink assessments in the transition zone between the Qinghai–Tibet and the Loess Plateaus.
4 Conclusion
This study conducted long-term observations of carbon fluxes in the forest ecosystem and their influencing factors on Xinglong Mountain, located in an ecological transition zone between the Qinghai–Tibet and Loess Plateaus. This study revealed the spatiotemporal characteristics of forest ecosystem carbon fluxes in this region and their relationship with meteorological factors. The results showed that the forest ecosystem on Xinglong Mountain functioned as a carbon sink throughout the year and exhibited significant seasonal and interannual variations. Meteorological factors (such as Rg, Tair, Tsoil, VPD, and PP) had different influences on forest ecosystem carbon fluxes at different temporal scales. Overall, the forest ecosystem carbon fluxes were primarily subjected to significant positive direct influences from Rg, PP, Tair, Tsoil, and VPD. As global climate change intensifies, the frequency and intensity of extreme weather events (such as droughts and high temperatures) may increase, which could adversely affect the carbon sink capacity of the forest ecosystem on Xinglong Mountain. In particular, during drought years, the combination of high temperatures and low precipitation could significantly reduce the forest ecosystem’s carbon uptake capacity on Xinglong Mountain, leading to a decrease in its carbon sink capacity. Therefore, future efforts should focus on strengthening the monitoring and management of the forest ecosystem on Xinglong Mountain in the transition zone between the Qinghai–Tibet and Loess Plateaus to address the challenges posed by climate change.
Data availability statement
The raw data supporting the conclusions of this article will be made available by the authors, without undue reservation.
Author contributions
ZC: Writing – original draft, Writing – review and editing, Investigation, Funding acquisition, Data curation, Formal analysis, Methodology, Conceptualization. WZ: Methodology, Writing – review and editing, Investigation, Funding acquisition, Formal analysis, Data curation. TL: Methodology, Writing – review and editing. YjZ: Methodology, Writing – review and editing. YmZ: Methodology, Investigation, Writing – review and editing. QM: Writing – review and editing, Funding acquisition, Conceptualization, Methodology.
Funding
The author(s) declare that financial support was received for the research and/or publication of this article. This study was funded by the Key Research and Development Special Funds for Ecological Civilization Construction of Gansu Provence, China (No. 25YFFA075); the Youth Science and Technology Foundation of Gansu Provence, China (No. 25JRRA759); the National Key Research and Development Program of China (No. 2024YFD2201100); the Key Research and Development Special Funds of Gansu Provence, China (No. 24YFFA040); and the Carbon Special Program for Forestry, Grassland, Wetland, and Desert of the Gansu Forestry and Grassland Bureau.
Acknowledgments
This study was conducted at the Gansu Xinglong Mountain Forest Ecosystem Positioning Research Station. The authors thank the National Forestry and Grassland Administration of China for its support of the Xinglong Mountain Ecological Station.
Conflict of interest
Author TL was employed by Beijing Weiruitai Technology Co., Ltd.
Author YZ was employed by Shaanxi Huayirui Technology Co., Ltd.
The remaining authors declare that the research was conducted in the absence of any commercial or financial relationships that could be construed as a potential conflict of interest.
Generative AI statement
The author(s) declare that no Generative AI was used in the creation of this manuscript.
Any alternative text (alt text) provided alongside figures in this article has been generated by Frontiers with the support of artificial intelligence and reasonable efforts have been made to ensure accuracy, including review by the authors wherever possible. If you identify any issues, please contact us.
Publisher’s note
All claims expressed in this article are solely those of the authors and do not necessarily represent those of their affiliated organizations, or those of the publisher, the editors and the reviewers. Any product that may be evaluated in this article, or claim that may be made by its manufacturer, is not guaranteed or endorsed by the publisher.
Supplementary material
The Supplementary Material for this article can be found online at: https://www.frontiersin.org/articles/10.3389/fenvs.2025.1657389/full#supplementary-material
References
Ashton, M. S., Tyrrell, M. L., Spalding, D., and Gentry, B. (2012). Managing forest carbon in a changing climate. Springer Sci. and Bus. Media. doi:10.1007/978-94-007-2232-3
Baldocchi, D. D., and Vogel, C. A. (1996). Energy and CO2 flux densities above and below a temperate broad-leaved forest and a boreal pine forest. Tree Physiol. 16 (1-2), 5–16. doi:10.1093/treephys/16.1-2.5
Baldocchi, D., Falge, E., Gu, L., Olson, R., Hollinger, D., Running, S., et al. (2001). FLUXNET: a new tool to study the temporal and spatial variability of ecosystem-scale carbon dioxide, water vapor, and energy flux densities. Bull. Am. Meteorological Soc. 82 (11), 2415–2434. doi:10.1175/1520-0477(2001)082<2415:fantts>2.3.co;2
Barnes, M. L., Moran, M. S., Scott, R. L., Kolb, T. E., Ponce-Campos, G. E., Moore, D. J., et al. (2016). Vegetation productivity responds to sub-annual climate conditions across semiarid biomes. Ecosphere 7 (5), e01339. doi:10.1002/ecs2.1339
Cao, J. J., Yang, S. R., Zhou, J. J., Zhan, L. L., Hu, Z. Y., and Zhang, Q. (2017). The existence value of Qinghai-Tibetan Plateau: a case study on Maqu grassland. Acta Ecol. Sin. 37 (19), 6415–6421. doi:10.5846/stxb201607071389
Chen, C., Li, D., Gao, Z., Tang, J., Guo, X., Wang, L., et al. (2015). Seasonal and interannual variations of carbon exchange over a rice-wheat rotation system on the North China Plain. Adv. Atmos. Sci. 32, 1365–1380. doi:10.1007/s00376-015-4253-1
Chen, S. P., You, C. H., Hu, Z. M., Chen, Z., Zhang, L. M., and Wang, Q. F. (2020). Eddy covariance technique and its applications in flux observations of terrestrial ecosystems. Chin. J. Plant Ecol. 44 (4), 291–304. doi:10.17521/cjpe.2019.0351
Devi Kanniah, K., Beringer, J., and Hutley, L. B. (2010). The comparative role of key environmental factors in determining savanna productivity and carbon fluxes: a review, with special reference to northern Australia. Prog. Phys. Geogr. 34 (4), 459–490. doi:10.1177/0309133310364933
Fang, J., Lutz, J. A., Wang, L., Shugart, H. H., and Yan, X. (2020). Using climate-driven leaf phenology and growth to improve predictions of gross primary productivity in North American forests. Glob. Change Biol. 26 (12), 6974–6988. doi:10.1111/gcb.15349
Farquhar, G. D., Von Caemmerer, S. V., and Berry, J. A. (1980). A biochemical model of photosynthetic CO2 assimilation in leaves of C3 species. planta 149 (1), 78–90. doi:10.1007/BF00386231
Gao, F., Lv, K., Qiao, Z., Ma, F., and Jiang, Q. (2022). Assessment and prediction of carbon neutrality in the eastern margin ecotone of Qinghai-Tibet Plateau. Acta Ecol. Sin. 42 (23), 9442–9455. doi:10.5846/stxb202112093500
Gao, H., Shen, L., Liu, R., Wang, G., Zhang, A., Chen, L., et al. (2023). Summer habitat suitability of wild alpine musk deer based on MaxEnt model. Acta Ecol. Sin. 43 (1), 441–448. doi:10.5846/stxb202112043432
Granier, C., Turc, O., and Tardieu, F. (2000). Co-ordination of cell division and tissue expansion in sunflower, tobacco, and pea leaves: dependence or independence of both processes? J. Plant Growth Regul. 19, 45–54. doi:10.1007/s003440000006
Heimann, M., and Reichstein, M. (2008). Terrestrial ecosystem carbon dynamics and climate feedbacks. Nature 451 (7176), 289–292. doi:10.1038/nature06591
Hirata, R., Saigusa, N., Yamamoto, S., Ohtani, Y., Ide, R., Asanuma, J., et al. (2008). Spatial distribution of carbon balance in forest ecosystems across East Asia. Agric. For. Meteorology 148 (5), 761–775. doi:10.1016/j.agrformet.2007.11.016
Hu, J., Zhou, Q., Lü, Y., Hu, J., Chen, Y., and Gou, X. (2020). Comparison study to the effectiveness of typical ecological restoration measures in semi-humid sandy land in eastern Qinghai-Tibetan Plateau, China. Acta Ecol. Sin. 40 (20), 7410–7418. doi:10.5846/stxb201910102111
Kato, T., and Tang, Y. (2008). Spatial variability and major controlling factors of CO2 sink strength in Asian terrestrial ecosystems: evidence from eddy covariance data. Glob. Change Biol. 14 (10), 2333–2348. doi:10.1111/j.1365-2486.2008.01646.x
King, A. D., Donat, M. G., Lewis, S. C., Henley, B. J., Mitchell, D. M., Stott, P. A., et al. (2018). Reduced heat exposure by limiting global warming to 1.5 C. Nat. Clim. Change 8 (7), 549–551. doi:10.1038/s41558-018-0191-0
Le Quéré, C., Jackson, R. B., Jones, M. W., Smith, A. J., Abernethy, S., Andrew, R. M., et al. (2020). Temporary reduction in daily global CO2 emissions during the COVID-19 forced confinement. Nat. Clim. Change 10 (7), 647–653. doi:10.1038/s41558-020-0797-x
Legg, S. (2021). IPCC, 2021: climate change 2021-the physical science basis. Interaction 49 (4), 44–45. Available online at: https://www.ipcc.ch/report/wg1/.
Liu, F., Wang, X., Wang, C., and Zhang, Q. (2021). Environmental and biotic controls on the interannual variations in CO2 fluxes of a continental monsoon temperate forest. Agric. For. Meteorology 296, 108232. doi:10.1016/j.agrformet.2020.108232
Luyssaert, S., Inglima, I., Jung, M., Richardson, A. D., Reichstein, M., Papale, D., et al. (2007). CO2 balance of boreal, temperate, and tropical forests derived from a global database. Glob. Change Biol. 13 (12), 2509–2537. doi:10.1111/j.1365-2486.2007.01439.x
Ma, J., Jia, X., Zha, T., Bourque, C. P. A., Tian, Y., Bai, Y., et al. (2019). Ecosystem water use efficiency in a young plantation in Northern China and its relationship to drought. Agric. For. Meteorology 275, 1–10. doi:10.1016/j.agrformet.2019.05.004
Malhi, Y., Baldocchi, D., and Jarvis, P. (1999). The carbon balance of tropical, temperate and boreal forests. Plant, Cell and Environ. 22 (6), 715–740. doi:10.1046/j.1365-3040.1999.00453.x
Mamkin, V., Varlagin, A., Yaseneva, I., and Kurbatova, J. (2022). Response of spruce forest ecosystem CO2 fluxes to inter-annual climate anomalies in the Southern Taiga. Forests 13 (7), 1019. doi:10.3390/f13071019
Masson-Delmotte, V., Zhai, P., Pörtner, H. O., Roberts, D., Skea, J., and Shukla, P. R. (2022). “Global Warming of 1.5 C: IPCC special report on impacts of global warming of 1.5 C above pre-industrial levels in context of strengthening response to climate change,” in Sustainable development, and efforts to eradicate poverty. Cambridge University Press.
Medlyn, B. E., Duursma, R. A., Eamus, D., Ellsworth, D. S., Prentice, I. C., Barton, C. V., et al. (2011). Reconciling the optimal and empirical approaches to modelling stomatal conductance. Glob. Change Biol. 17 (6), 2134–2144. doi:10.1111/j.1365-2486.2010.02375.x
Piao, S., Wang, X., Wang, K., Li, X., Bastos, A., Canadell, J. G., et al. (2020). Interannual variation of terrestrial carbon cycle: issues and perspectives. Glob. Change Biol. 26 (1), 300–318. doi:10.1111/gcb.14884
Qi, Y., and Wang, X. (2023). Challenges and opportunities for measuring carbon fluxes in terrestrial ecosystems by eddy covariance. Acta Ecol. Sin. 43 (8), 2979. doi:10.5846/stxb202111273349
Reichstein, M., Falge, E., Baldocchi, D., Papale, D., Aubinet, M., Berbigier, P., et al. (2005). On the separation of net ecosystem exchange into assimilation and ecosystem respiration: review and improved algorithm. Glob. Change Biol. 11 (9), 1424–1439. doi:10.1111/j.1365-2486.2005.001002.x
Reichstein, M., Ciais, P., Papale, D., Valentini, R., Running, S., Viovy, N., et al. (2007). Reduction of ecosystem productivity and respiration during the European summer 2003 climate anomaly: a joint flux tower, remote sensing and modelling analysis. Glob. Change Biol. 13 (3), 634–651. doi:10.1111/j.1365-2486.2006.01224.x
Reichstein, M., Bahn, M., Ciais, P., Frank, D., Mahecha, M. D., Seneviratne, S. I., et al. (2013). Climate extremes and the carbon cycle. Nature 500 (7462), 287–295. doi:10.1038/nature12350
Saleska, S. R., Miller, S. D., Matross, D. M., Goulden, M. L., Wofsy, S. C., Da Rocha, H. R., et al. (2003). Carbon in Amazon forests: unexpected seasonal fluxes and disturbance-induced losses. Science 302 (5650), 1554–1557. doi:10.1126/science.1091165
Schlesinger, W. H. (1997). Biogeochemistry: an analysis of global change. doi:10.1016/C2012-0-01654-7
Segal, M., and Davis, J. (1992). The impact of deep cumulus reflection on the ground-level global irradiance. J. Appl. Meteorology Climatol. 31 (2), 217–222. doi:10.1175/1520-0450(1992)031<0217:TIODCR>2.0.CO;2
Shu, Z. Q., Liu, X. X., Yao, N., Wu, L., and Li, S. Y. (2021). The carbon balance of typical temperate mixed forest on the response characteristics of the temperature. Mid-low Latit. Mt. Meteorol. 45 (5), 63–69. doi:10.3969/j.issn.1003-6598.2021.05.010
Stocker, B. D., Zscheischler, J., Keenan, T. F., Prentice, I. C., Peñuelas, J., and Seneviratne, S. I. (2018). Quantifying soil moisture impacts on light use efficiency across biomes. New Phytol. 218 (4), 1430–1449. doi:10.1111/nph.15123
Sun, S., Che, T., Li, H., Wang, T., Ma, C., Liu, B., et al. (2019a). Water and carbon dioxide exchange of an alpine meadow ecosystem in the northeastern Tibetan Plateau is energy-limited. Agric. For. Meteorology 275, 283–295. doi:10.1016/j.agrformet.2019.06.003
Sun, Z., Ouyang, Z., Zhang, X., and Ren, W. (2019b). A new global dataset of phase synchronization of temperature and precipitation: its climatology and contribution to global vegetation productivity. Geoscience Data J. 6 (2), 126–136. doi:10.1002/gdj3.76
Tong, X., Meng, P., Zhang, J., Li, J., Zheng, N., and Huang, H. (2012). Ecosystem carbon exchange over a warm-temperate mixed plantation in the lithoid hilly area of the North China. Atmos. Environ. 49, 257–267. doi:10.1016/j.atmosenv.2011.11.049
Valentini, R., Matteucci, G., Dolman, A. J., Schulze, E. D., Rebmann, C., Moors, E. J., et al. (2000). Respiration as the main determinant of carbon balance in European forests. Nature 404 (6780), 861–865. doi:10.1038/35009084
Wang, R., Chen, J. M., Luo, X., Black, A., and Arain, A. (2019). Seasonality of leaf area index and photosynthetic capacity for better estimation of carbon and water fluxes in evergreen conifer forests. Agric. For. Meteorology 279, 107708. doi:10.1016/j.agrformet.2019.107708
Wang, J., Li, G., Zhang, M., Li, P., Sun, X., Zhao, Q., et al. (2024). Carbon flux characteristics and responses to environmental factors in the evergreen-deciduous broadleaf mixed forest of the north-south transitional zone. Acta Ecol. Sin. 44 (14), 6243–6253. doi:10.20103/j.stxb.202310252322
Weltzin, J. F., Loik, M. E., Schwinning, S., Williams, D. G., Fay, P. A., Haddad, B. M., et al. (2003). Assessing the response of terrestrial ecosystems to potential changes in precipitation. Bioscience 53 (10), 941–952. doi:10.1641/0006-3568(2003)053[0941:ATROTE]2.0.CO;2
Wilson, K., Goldstein, A., Falge, E., Aubinet, M., Baldocchi, D., Berbigier, P., et al. (2002). Energy balance closure at FLUXNET sites. Agric. For. Meteorol. 113 (1-4), 223–243. doi:10.1016/S0168-1923(02)00109-0
Xu, Y., Ji, H., Han, J., Xue, T., Zhu, Y., and Li, P. (2018). Variation of net ecosystem carbon flux in growing season and its driving factors in a poplar plantation from Hung-tse Lake wetland. Chin. J. Ecol. 37 (2), 322. doi:10.13292/j.1000-4890.201802.016
Xu, T., Zhao, X., Zhang, X., Wang, X., Geng, Y., Hu, L., et al. (2020). Sustainable development of ecological grass-based livestock husbandry in Qinghai-Tibet Plateau alpine area: principle, technology and practice. Acta Ecol. Sin. 40 (18), 6324–6337. doi:10.5846/stxb201912142705
Yu, G., Chen, Z., Piao, S., Peng, C., Ciais, P., Wang, Q., et al. (2014). High carbon dioxide uptake by subtropical forest ecosystems in the East Asian monsoon region. Proc. Natl. Acad. Sci. 111 (13), 4910–4915. doi:10.1073/pnas.1317065111
Zhang, Y., Joiner, J., Alemohammad, S., Zhou, S., and Gentine, P. (2018). A global spatially contiguous solar-induced fluorescence (CSIF) dataset using neural networks. Biogeosciences 15 (19), 5779–5800. doi:10.5194/bg-15-5779-2018
Zhao, Z., Zhang, L., Kang, W., Tian, D., Xiang, W., Yan, W., et al. (2011). Characteristics of CO2 flux in a Chinese fir plantation ecosystem in huitong County, Hunan Province. Sci. Silvae Sin. 47 (11), 6–12. Available online at: https://html.rhhz.net/linyekexue/html/20111102.htm.
Zhao, J., Ma, J., and Zhu, Y. (2019). Evaluating impacts of climate change on net ecosystem productivity (NEP) of global different forest types based on an individual tree-based model FORCCHN and remote sensing. Glob. Planet. Change 182, 103010. doi:10.1016/j.gloplacha.2019.103010
Zhou, C., Zhou, G., Zhang, D., Wang, Y., and Liu, S. (2005). CO2 efflux from different forest soils and impact factors in Dinghu Mountain, China. Science in China Ser. D. earth Sci. 48, 198–206. doi:10.1360/05zd0020
Zhou, S., Williams, A. P., Lintner, B. R., Berg, A. M., Zhang, Y., Keenan, T. F., et al. (2021). Soil moisture–atmosphere feedbacks mitigate declining water availability in drylands. Nat. Clim. Change 11 (1), 38–44. doi:10.1038/s41558-020-00945-z
Zhou, Y., Zhang, J., Yin, C., Huang, H., Sun, S., and Meng, P. (2022). Empirical analysis of the influences of meteorological factors on the interannual variations in carbon fluxes of a Quercus variabilis plantation. Agric. For. Meteorology 326, 109190. doi:10.1016/j.agrformet.2022.109190
Keywords: carbon flux, meteorological factor, eddy covariance, semi-arid region, structural equation modeling
Citation: Chen Z, Zong W, Liu T, Zhao Y, Zhong Y and Ma Q (2025) Meteorological drivers of carbon flux variations on Xinglong Mountain in the transition zone between the Qinghai–Tibet and Loess Plateaus. Front. Environ. Sci. 13:1657389. doi: 10.3389/fenvs.2025.1657389
Received: 02 July 2025; Accepted: 18 August 2025;
Published: 02 September 2025.
Edited by:
Zhiheng Yang, Shandong University of Finance and Economics, ChinaReviewed by:
Qinghong Cui, Hongkong University of Science and Technology (Guangzhou), ChinaYuhang Lian, Northwest University, China
Copyright © 2025 Chen, Zong, Liu, Zhao, Zhong and Ma. This is an open-access article distributed under the terms of the Creative Commons Attribution License (CC BY). The use, distribution or reproduction in other forums is permitted, provided the original author(s) and the copyright owner(s) are credited and that the original publication in this journal is cited, in accordance with accepted academic practice. No use, distribution or reproduction is permitted which does not comply with these terms.
*Correspondence: Quanlin Ma, bXFsOTI1QDEyNi5jb20=