 Avnish Chauhan1
 Gaurav Pandey2
 Man Vir Singh3*
 Muneesh Sethi4Prateek Gururani5
 Amit Awasthi6*
 Shshank Chaube7
 Abhishek Lodh8,9*†
- 1Department of Environmental Science, Graphic Era Hill University, Dehradun, Uttarakhand, India
- 2Forest Research Institute (FRI), Dehradun, Uttarakhand, India
- 3School of Applied and Life Sciences, UIT, Uttaranchal University, Dehradun, Uttarakhand, India
- 4Research & Development, COER University, Roorkee/Haridwar, Uttarakhand, India
- 5Department of Biotechnology, Graphic Era Deemed to be University, Dehradun, Uttarakhand, India
- 6Applied Science Cluster, School of Advance Engineering, UPES, Dehradun, Uttarakhand, India
- 7Symbiosis Institute of Technology, Hyderabad Campus, Symbiosis International (Deemed University), Pune, India
- 8Swedish Meteorological and Hydrological Institute, Norrkoping, Sweden
- 9Department of Physical Geography and Ecosystem Science, Lund University, Lund, Sweden
Road traffic pollution is one of the most important factors among other environmental factors that influence the roadside vegetation. The present research examines the impact of motorway flyovers and at-grade roads on air pollution (PM10, SOx, NOx, and air quality index (AQI)) and roadside vegetation in Dehradun by considering the important biochemical parameters such as chlorophyll, ascorbic acid, leaf pH, and the air pollution tolerance index (APTI). Five varieties of plants were selected along the busiest highway in Dehradun, including Mangifera indica (mango) and four varieties of bougainvillea in red, pink, gold, and white colors. The monthly monitoring of PM10, SOx, and NOx concentrations during the study period showed significant seasonal variations at all three sites. Maximum PM10 (58 μg/m3) and NOx (33 μg/m3) were observed at Site 2 (on-flyover) during December 2024, while the highest air quality index (AQI) value at this site was 270. Regression analysis showed that the AQI trends from winter to spring declined, and Site 2 experienced the greatest monthly reduction (−13.25 units month-1; R2 = 0.88). PM10 and NOx were the most influential factors about AQI (r = 1.00 and r = 0.90), indicating that these pollutants are a major component of urban pollution. Biochemical parameters were used as markers to assess the responses to pollution in mango and bougainvillea (red, white, pink, and gold varieties). Mango showed a higher tolerance (APTI 8.09) than bougainvillea varieties, where the maximum stress was caused (APTI up to 4.65) and also exhibited a marked reduction in the levels of chlorophyll and ascorbic acid. Results show meteorological emission effects on urban air quality, supporting plant-based biomonitoring programs.
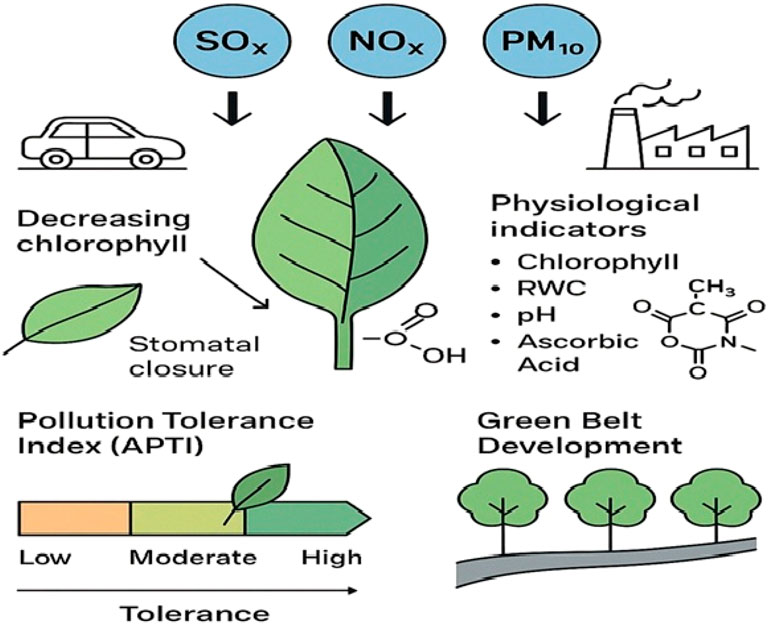
GRAPHICAL ABSTRACT |
Highlights
• Comparative analysis of road types: The study contrasts the impact of an elevated motorway flyover and an at-grade road on roadside air pollution levels in an urban setting in Dehradun, Uttarakhand.
• Effect on urban vegetation: It is the first systematic investigation of how elevated traffic emissions affect the resistance and resilience of trees and ornamental plants, including mango and four bougainvillea varieties.
• Air and plant monitoring: Monthly measurements from October 2024 to March 2025 included PM₁₀, SOx, NOx, AQI, and plant biochemical markers (chlorophyll, ascorbic acid, leaf pH, etc.) across three traffic zones—pre-flyover, on-flyover, and post-flyover.
• Key findings: Site 2 (on-flyover) recorded the highest pollutant concentrations and AQI values, especially in December 2024. AQI showed a monthly declining trend, with PM₁₀ and NOx being the most influential pollutants.
• Plant tolerance assessment: Mango (APTI 8.09) was more pollution-tolerant than bougainvillea varieties (APTI up to 4.65). Significant stress symptoms were observed in bougainvillea, including reduced chlorophyll and ascorbic acid levels, highlighting the utility of plant-based biomonitoring for urban air quality assessment.
1 Introduction
The rapidly growing population has led to the expansion of urban areas globally, consequently increasing pollution associated with higher population density. Air pollution is one of the most severe issues in the modern world. Urban air pollution has become a critical and important issue in both developed and developing countries, posing significant threats to human health, living organisms, and the environment (Ehrnsperger and Klemm, 2022; Edo et al., 2024; Antenozio et al., 2024; Lopez-Aparicio et al., 2025; Saxena, 2025; Singh et al., 2025). Globally, transportation is a major contributor to air pollution, especially in urban areas. Many vehicles, poor maintenance of roads, traffic congestion, aging or old vehicles, poor fuel quality, inadequate inspection programs, etc., contribute to the degradation of air quality along roadways (Wang D. et al., 2024; Anigilaje et al., 2024; Esmaeilpour Moghadam et al., 2025).
Vegetation acts as a natural sink, absorbing a significant amount of harmful air pollutants. Vehicular emissions constitute a primary source of air pollution in urban areas, exerting a profound impact on ambient air quality degradation. Vehicular exhaust releases a complex mixture of harmful pollutants, including nitrogen oxides (NOx), carbon monoxide (CO), particulate matter (PM), sulfur oxides (SOx), volatile organic compounds (VOCs), and ground-level ozone (O3). These pollutants pose severe risks to human health, ecological integrity, and the sustainability of urban environments. Accelerated urbanization and the proliferation of motorized transport have exacerbated these challenges, with chronic exposure and interacting environmental factors compounding their adverse effects. Accurate source attribution of traffic-related air pollution (TRAP) is critical for effective mitigation strategies aimed at protecting both human populations and peri-urban vegetation within metropolitan areas. Air pollution-related health effects can be a result of traffic exposure (Jakubiak-Lasocka et al., 2014; Boogaard et al., 2022; Tiwari et al., 2025). Urbanization, commercialization, and the rapid growth of cities and increasing pressure on in-city vehicle networks were the predominant sources accountable for elevated air pollutants in densely populated areas globally (Chauhan and Joshi, 2008a; Chauhan and Pawar, 2010; Lolage, 2025; Lopez-Aparicio et al., 2025; Mathew et al., 2025; Malik et al., 2025; Yan et al., 2025).
Epidemiological studies show a correlation between the environment and health parameters in different air pollution scenarios. Specifically, studies have found associations between exposure to air pollution in these locations and respiratory issues like asthma, reduced lung capacity, and other lung diseases (Kim et al., 2004; Hyrkäs-Palmu et al., 2025; Al-Sabbagh and Shreaz, 2025). Increasing urban air pollution also appears to be a new threat to trees and crops (Dutta et al., 2025). Several Indian cities are suffering from high air pollution due to a lack of appropriate infrastructure, high levels of industrialization, ill-maintained roads, poorly maintained vehicles, inappropriate use of less eco-friendly fuels, and a lack of awareness among the general public (Joshi and Chauhan, 2008).
Roadside plants and trees are exposed to various stress factors, with traffic-related air pollution being one of the most significant (Gaur and Singh, 2024; Mehmood et al., 2024). These pollutants are SOx, CO, NOx, VOCs, and PM10, all of which produce detrimental effects on plant physiology, morphology, and biochemistry (Meo et al., 2024; Olloquequi et al., 2024; Kumar et al., 2025). Trees that are scattered within high and/or city traffic are among the most significant natural bioindicators and phyto-stabilizing agents (Guidi Nissim et al., 2023; Solomun et al., 2024). However, long-term exposure to traffic-emission pollution depresses photosynthetic rates, modifies stomatal conductance, and develops leaf necrosis, chlorosis, and premature senescence. With increasing attention being paid to climate change and environmental sustainability, it is necessary to study the negative consequences of traffic pollution on urban vegetation and species responses to avoid possible problems when designing urban green infrastructure in the future (Liu et al., 2022; Umer et al., 2023).
Air pollution effects are highly variable and depend on species-specific and leaf anatomical characteristics, distance from emission sources, and fluctuating weather and seasonal patterns (Gupta and Yadav, 2025). It also helps to understand the physiological and morphological responses of roadside trees that play an important role in selecting species for afforestation in polluted sites (Singh, 2023; Malik et al., 2024; Popek et al., 2024). In recent years, the number of people has been steadily rising throughout the world. Vegetation processes pollution by capturing and retaining suspended particles on leaf surfaces (Corada et al., 2021; Muthu et al., 2021; Vashist et al., 2024; Nyayapathi et al., 2025) and by gaseous pollutants entering through stomatal uptake (Smith, 1990). Furthermore, the complexity of the foliage and branches of the canopy modifies the flow field patterns, which in a significant way influence the transport, dispersion, and deposition of air pollutants.
Urbanization, industrialization, and increased vehicular traffic exacerbated the problem of air pollution in cities, which is not only harmful to human health but may also be harmful to plants (Chauhan, 2010; Awasthi et al., 2017; Das et al., 2023; Dhankar et al., 2024; Roy et al., 2024). As a result of open atmospheres polluted by emissions of PM10, SOx, NOx, etc. from vehicles, roadside plants could be good bioindicators for the assessment of air quality. These plants are important to urban ecology, which provides ecological services such as carbon capture, the release of oxygen, and hosting various life forms. This study aims to contribute to the understanding of the impact of increased traffic-related pollutants on roadside trees and plants; scant information has been published on the effect of elevated roads on roadside plants. This is an attempt to provide insights into plant response/stress adaptation pathways that are important for urban environmental control. The intent is to evaluate the extent of the influence of road infrastructure design in combination with other influencing factors on the variation in pollutant concentrations in the vicinity of a motorway.
2 Materials and methods
2.1 Site selection and description
The rising levels of air pollution and traffic in Dehradun make it necessary to look at how they affect people’s health and how roadside plants respond to them, as well as to develop specific plans to reduce and control pollution (Malik et al., 2024; Mahmud et al., 2025; Singh, 2025). Rapid expansion of urbanization has disrupted the natural ecosystem, leading to multifaceted challenges like environmental pollution and climate change. As a result, policymakers and urban planners must look for ways to deal with these problems (Pakhira et al., 2024; Wang A. et al., 2024). Smart growth strategies should be seamlessly integrated with land use planning and urban development, ensuring thoughtful incorporation of green infrastructure such as parks, gardens, and roadside vegetation across the city to counteract the adverse effects of pollution. To evaluate the ecological impacts of air pollutants and formulate a management strategy to mitigate these pollutants, it is essential to investigate their effects on roadside vegetation. Green infrastructure helps lower the levels of particulate pollution and nitrogen dioxide by reducing traffic emissions. One of the key goals is to investigate the influence of a motorway flyover and a ground-level motorway on the distribution of ambient mixing ratios in the vicinity. Three sampling locations were selected along Haridwar Road (Dehradun, Uttarakhand, India) near the Mohkampur Flyover, a high-traffic zone in Dehradun City, an identified corridor under acute traffic conditions at all times of the day. These locations were selected to study the impact of increasing air pollution due to vehicular emissions on plant species (Figure 1). The locations of the three sampling sites on flyover, pre-flyover, and post-flyover (at-grade) road segments in Dehradun are shown in Figure 1. Dehradun’s Mohkampur Flyover (30.277833°N, 78.073986°E; approximately 613 m elevation) is ideally located on Haridwar Road, linking important urban transit hubs. The three locations with respect to Dehradun and Uttarakhand are shown in Figure 1.
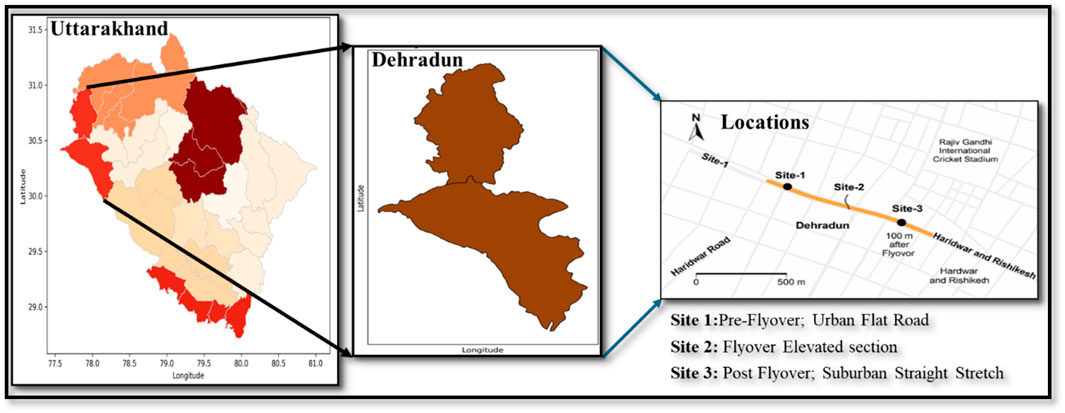
Figure 1. Three sampling locations in Dehradun, Uttarakhand, India.
Site 1 (pre-flyover, urban flat road): The first sampling site was located approximately 500 m before the entry point of the Mohkampur Flyover, along the even-numbered stretch of Haridwar Road leading toward Dehradun City. This area is proximate to the densely urbanized business district where some heavy traffic exists, most of it during rush hours. The site was designed to target the near-road impact at ground level, which is directly exposed to traffic pollution.
Site 2 (elevated railway) (flyover elevated section): The second site was on the Mohkampur Flyover, a 10-m-high and nearly 1-km-long elevated road. This overbridge has a high volume of heavy-duty trucks, buses, and cars, inducing high levels of vehicular emissions. This may also be a result of the vertical distribution of air pollutants and their influence on plant species at high elevations, as a high site.
Site 3 (post-flyover suburban straight stretch): The third site was 500 m away from Mohkampur Flyover, located on a flat stretch of road before the Indian Institute of Petroleum (IIP) on Haridwar Road, Dehradun. Although it is a building/industrial/residential area, similar traffic levels are experienced at this site. The place is distant from the overpass, although it is representative of the high pollution concentrations experienced in other places. It established a relative reference point for assessing the spatial variability of airborne pollution and its potential impact on vegetation in a mostly quasi-suburban transition zone. Next to the two other sites, it provides a unique opportunity to study similarities and differences in spatial distributions of vehicle-based pollution exposure and the physiological and morphological responses of the roadside plant species to the road gradient and traffic density.
2.2 Variables of plant selection and biomonitoring
Biomonitoring was performed in all selected sites, using four varieties of a plant grown in pots and one tree species, to determine the potential influence of the increase in road vehicular emissions on the vegetation along the sides of the road. The selected species were based on their availability and abundance in the study area and their use as bioindicators of air pollution stress. Different physiological and biochemical parameters of air pollutants stress, viz., pH of leaf, ascorbic acid, relative water content (RWC), chlorophyll a and b, carotenoids, and APTI, have been determined and analyzed. Mango tree (Mangifera indica), as an indigenous and well-distributed tree species in that area, is included in the research. The ornamental species grown in pots was bougainvillea (Bougainvillea spectabilis). Four bougainvillea plants (red, pink, gold, and white) were selected for investigation as these were universally obtainable across all sites. These plants were cultivated in the same size pots (3 × 3 feet) with an equal volume of soil to standardize the growth conditions. The use of potted plants decreased confounding by external variation, and comparison among the various pollution exposure zones was better controlled. The road corridor considered is one of the major transportation corridors, connecting Dehradun to Haridwar and Rishikesh, with thousands of vehicles per day (a combination of commercial, private, and heavy vehicles). Leaves were sampled from both sides of the road at all the sites and from mango trees growing near the flyover or on the flyover. This sampling scheme enabled the directional exposure and the vertical dispersion of pollutants to be compared. The study area provides a suitable setting for examining the effects of air pollution from traffic on the condition and resilience/tolerance of plants and trees.
2.3 Air pollution monitoring
Respirable dusts (PM10) and gaseous parameters such as SO2 and NOx were monitored using a respirable dust sampler (APM 460) and a gaseous assembly (APM 410), respectively, in the determination of the air quality. All selected sites were monitored for 6 months. The sampler was operated in parallel for the same 24 h at all three sites, once a month as per the National Ambient Air Quality Standards (NAAQS).
2.4 PM10 measurement
The gravimetric dust sampler (APM 460) is frequently used to determine the levels of PM10 in ambient air. This technique involves measuring particles in the air on a filter before and after sampling by weight. The APM 460 is designed for size-selective sampling. A cyclone separator draws in ambient air to collect >10 µm particles, and the remaining particles (PM10) are collected on a pre-weighed glass fiber filter. The airflow rate is usually set as 1 m3/min to meet the particle separation and deposition precision. The APM 460 is a size-selective sampling device. In a cyclone separator, particles larger than PM10 are removed (>10 μm); the remaining PM10 is collected on pre-weighed glass fiber filters. An air flow (usually 1 m3/min) keeps particle removal and deposition in balance.
Gravimetric analysis:
• Pre-weighing: The filter is conditioned in an environmentally controlled room (T = 20°–25 °C, RH = 40–50%), and its weight is determined with a high-precision balance.
• Sampling: The sampler operates for a predetermined duration (24 h), collecting PM10 on the filter.
• Post-weight: The filter is reconditioned and weighed after sampling.
• Calculations: The PM10 concentration is calculated as follows:
where Wf is the final weight, Wi is the initial weight, and the air volume is calculated using the flow rate of the sampler and the sampling time. This approach allows a valid and reliable estimation of the ambient air PM10 pollution.
2.5 Gaseous pollutant monitoring
The most commonly employed manual method is the modified West–Gaeke method (IS 5182 Part 2), whereby a stable dichlorosulfito mercurate complex is formed by absorbing SO2 in potassium tetra chloromercurate (TCM). Under acidic conditions, the complex, pararosaniline, and formaldehyde react to produce a purple product. The SO2 in the ambient air is measured spectrophotometrically and is a measure of the depth of the color that the dye assumes at 560 nm. This provides a reliable indication of the concentration. This method may be used for 24-h sampling and has good sensitivity over the 25–1,050 μg/m3 range. The measurements of SO2 invasive automatic monitors, such as UV-fluorescence analyzers, can provide a continuous SO2 real-time measurement. These may measure the fluorescence in the absorption of UV light by SO2 molecules, with the intensity of fluorescence being directly proportional to the SO2 concentration.
These analyzers are used in continuous ambient air quality monitoring stations (CAAQMS) because their precision and efficiency for NO2 in manual mode are specified by modified Jacob & Hochheiser (IS 5182 part 6). Such measures are, for instance, diazotization with sulfanilamide after the NO2 has been absorbed into a solution of sodium hydroxide and sodium arsenite. This reagent is N-(1-naphthyl)-ethylene diamine di-hydrochloride (NEDA), which gives a pink azo dye. Absorbance at 540 nm is read on a spectrophotometer and is valid for 24-h sampling in the range of mass concentrations 30–500 μg/m3. Chemiluminescence analyzers are typically used for automatic monitoring. These are based on the reaction of NO with ozone (O3) to create excited NO2 that emits light (chemiluminescence). Because NO2 must be converted to NO in the atmosphere for this reaction to take place, the analyzer usually includes some type of converter to allow measurement of NOx (NO + NO2). The chemiluminescence gas monitors with their high sensitivity have been broadly applied based on standards of the United States Environmental Protection Agency (US EPA) and the Central Pollution Control Board (CPCB), India.
2.6 Assessment of air quality index (AQI)
The AQI provided by the US EPA is a valuable tool; many programs around the world use it to monitor air quality. The AQI is a single scale that shows how polluted the air is and how it can affect human health. The AQI turns complicated levels of air pollution into a simple number, category, and color, which makes it easy for people to understand and take steps to protect themselves. A higher AQI rating means that the air quality is worse and that health is more of a concern. The AQI for each study site was calculated as the average of SPM, NOx, and SO2 levels (Chelani et al., 2002). AQI has been calculated using the equation below.
In this case, SOx is for sulfur dioxide (SO2), SSOx is sulfur dioxide, NOx is nitrogen dioxide (NO2), and SNOx is the corresponding Central Pollution Control Board (CPCB) standard value for nitrogen dioxide. PM10 and PM2.5 are terms used to describe particulate matter that has aerodynamic diameters smaller than 2.5 μm and 10 μm, respectively. Here, “standard value” refers to the CPCB-recommended allowable concentration for each pollutant.
2.7 Traffic-related data collection
Traffic counts and surveys were carried out at all three locations along the Mohkampur Flyover corridor in order to assess vehicle emissions and their impact on roadside foliage. Visual traffic in flow was recorded via a mobile recording system (high-resolution smartphone camera on a tripod) during selected observation hours. This approach minimized disturbance of real road surfaces and enabled true post-field analysis.
Traffic count schedule: Traffic data were collected for three specific periods, defined to reflect different time phases for daily human and vehicle activity:
Morning office hours: 8:00 am–10:00 am
Afternoon (off-peak): 12:00 pm–2:00 pm
Evening office hours: 5:00 pm–7:00 pm
These time slots were strategically selected to capture both peak (rush hour) and off-peak traffic periods, reflecting expected variations in vehicle emissions driven by daily commuting patterns.
Data processing and analysis: Video recordings from each site were manually reviewed to count the number of vehicles passing per minute. These one-minute counts were aggregated to calculate hourly traffic volumes. Vehicles were then categorized into three classes:
• Light motor vehicles (e.g., two- and three-wheelers and cars)
• Medium motor vehicles (e.g., auto-rickshaws, vans, mini-buses, and small goods carriers)
• Heavy-duty vehicles (e.g., buses, trucks, and construction vehicles)
This classification helped in assessing the traffic composition and its potential contribution to air pollution across different time intervals. Each vehicle category was analyzed separately to assess the impact of different vehicle fleets on the overall emission level. The average vehicle number per minute calculated for each time interval, and the 3 days following up were also averaged. Both working days and weekends were involved to alleviate the deviation caused by the traffic discrepancy. A mobile camera was used to record traffic flow. The frequency of cars per hour was calculated using the video recording from the pen study. The volume of traffic per hour was measured as the number of vehicles per minute (Kadiyali, 1999).
2.8 Meteorological data
The influence of meteorological conditions contributes much to the diffusion of air pollutants in the surrounding area and also to the presence of air pollutants in the air. The meteorological data on temperature, pressure, wind speed, and humidity were obtained through Time and Date (2025) and World Weather Online (2025).
2.9 Photosynthetic pigments
2.9.1 Pigment concentrations
The Hiscox and Israelstam (1979) method is a common and effective way to determine the amount of photosynthetic pigments, like chlorophylls, in plant leaf tissue. This method is a non-maceration assay, which means that the leaves do not need to be ground or homogenized. This helps maintain the integrity of the pigments and saves time. The procedure consists of immersing a measured sample of fresh leaf tissue into a solvent, commonly dimethyl sulfoxide (DMSO). The vials with the leaf tissue and DMSO are then heated in an oven at approximately 65 °C for approximately 30 min. This step helps to extract the pigments by breaking down cell membranes without damaging them. After the extraction is done and the vials have cooled, a spectrophotometer is used to look at the liquid extract. To determine the amount of chlorophyll in the solution, the optical density (OD) is measured at certain wavelengths (e.g., 663 nm, 645 nm, and 480 nm) using known equations. The total chlorophyll (Chlorophyll a, b) was calculated using the formula:
Where
V = final volume of extract (mL)
W = fresh weight of leaf sample (g)
A663 = absorbance at 663 nm
A645 = absorbance at 645 nm
These values are then adjusted based on the volume of extract, fresh weight of tissue, and final volume to get results in mg/g fresh weight.
2.9.2 Carotenoids
Leaf samples were collected from the study sites and homogenized in a chilled pestle–mortar. The extract was centrifuged at 13,000 rpm for 20 min at 4 °C, and the clear supernatant was used for absorbance measurements at 450 nm and 510 nm. The carotenoid concentration was calculated using the equation of Duxbury and Yentsch (1956):
2.9.3 Ascorbic acid
The estimation of vitamin C was carried out following the method outlined by Sadasivam and Manickam (1996). For ascorbic acid determination, 1 g of fresh leaves was homogenized in 25 mL of 4% oxalic acid. The extract was then oxidized by adding 3 to 5 drops of bromine water, converting ascorbic acid to dehydroascorbic acid (DHA). The resulting DHA was reacted with dinitrophenylhydrazine (DNPH) to form an osazone complex. This complex was dissolved in 7 mL of 80% sulfuric acid, and the absorbance was measured at 540 nm using a spectrophotometer to quantify ascorbic acid content.
2.9.4 Leaf pH
Leaf pH was measured after homogenization of a mass of approximately 4 g of fresh leaf tissue with 40 mL of deionized water, followed by centrifuging for 3 min at 2,500 rpm. The extract pH was determined by a pH meter.
2.9.5 Relative water content (RWC)
The weight of the leaves was measured with a balance to obtain fresh weight. The overnight watered leaf samples were also blotted dry and weighed for turgid weight. Leaves were subsequently oven-dried overnight at 70 °C, and the dry weight was determined. RWC was determined using the equation of a twelve-digit calculator to the standard by Weatherley (1965).
where FW is fresh weight, DW is dry weight, and TW is turgid weight.
2.9.6 APTI determination
The air pollution tolerance index (APTI) was computed following the formula adopted by Singh and Rao (1991).
where AA = ascorbic acid content (mg/g), TCh = total chlorophyll (mg/g), pH = pH of leaf extract, and RWC = relative water content of leaf (%). Relative water content (RWC) is crucial for assessing a plant’s pollution tolerance (et al., 2025). It shows how well leaves retain water, helping maintain health and function under stress, thus supporting higher APTI and overall resilience (Joshi et al., 2009).
3 Results
Figure 2 depicts the monthly variations of temperature, pressure, humidity, and wind speed from November 2024 to March 2025 at the study site. Air pressure was stable this month, fluctuating in a narrow range of atmospheric pressures between 1,015.2 and 1,012.8 hPA, peaking in December 2024, and slightly falling toward March 2025. Average relative humidity fluctuated little, with 84.2% (November 2024) and 87.5% (January 2025) at the lower and upper ends of the spectrum. A continuous reduction in average monthly temperature was observed from 16.8 °C in November 2024, dropping to a low value of 12.3 °C in January 2025 and then, to a small extent, rising to 14.1 °C by March 2025. Wind speed remained persistently low throughout the months from 1.2 km/h in January 2025 to 1.9 km/h in March 2025. December, February, and January were the three coldest months.
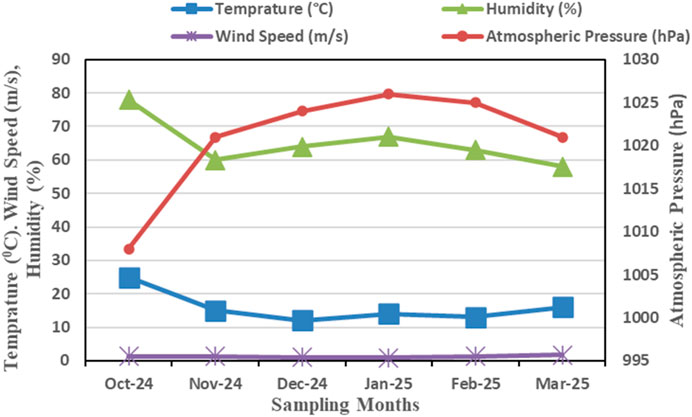
Figure 2. Average monthly variation of different metrological parameters from October 2024 to March 2025.
Figure 3 shows air pollution levels recorded at three locations in Dehradun City of Uttarakhand during the period October 2024 to March 2025. The monthly average concentrations of PM10, SOx, and NOx and the corresponding AQI values were computed and categorized according to CPCB air quality criteria. The monthly profiles of PM10, SOx, NOx, and AQI were derived from measurements recorded during October 2024 to March 2025 from three monitoring sites. PM10, NOx, and AQI all had a clear increase in November from October through November 2024. It remained at a relatively high level through December 2024, which was the peak winter month, with a subsequent decline such that they were at their lowest levels during February and March 2025. PM10 ranged between 42 and 58 μg/m3, and the maximum PM10 (58 μg/m3) was observed in Site-2 in December 2024. NOx ranged from 22 to 33 μg/m3 (Site 2 reported peak values of 33 μg/m3 in December 2024). SOx concentrations were, on average, low (16–25 μg/m3) and showed little variation among months and sites. The month of December 2024 was characterized by the highest AQI levels, approximately in the range of 210 (Site 3) to 270 (Site 2), which is poor. The highest concentrations of pollutants in the frequent concentration patterns were observed at Site 2, which might be attributed to the higher traffic flow there in terms of vehicles discharging high pollutants and waste gas accumulation at this site. The seasonal differences in the pollutants, presumably due to the winter atmospheric inversion, low wind speed, and high vehicular-generated pollutants, resulted in the build-up of pollutants during the colder season. The time trend of AQI closely reflected those of PM10 and NOx and indicated their dominant contribution to the deterioration of air quality. The geographical and seasonal gradients highlight the effect of increased wintertime traffic emissions and suggest local differences in the pollution load, possibly associated with traffic density, topography, and meteorology.
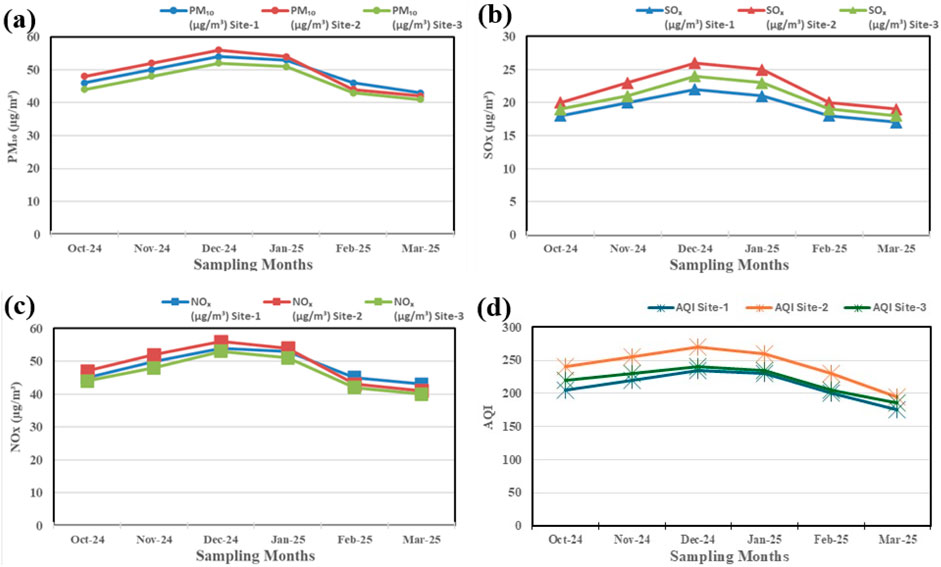
Figure 3. Concentration of different air pollutants (a) PM10, (b) Sox, (c) Nox, (d) AQI at three sampling sites.
The low temperature, high humidity, and low wind speed in winter (December–January) may have been favorable for the accumulation of pollutants. The small temperature and wind speed increases in March 2025 were accompanied by better atmospheric dispersion conditions (Awasthi et al., 2023). These are important for understanding the seasonality of pollutant levels and AQI variation at the monitoring sites and strongly suggest the influence of atmospheric stability on urban air quality.
The trend of AQI at three monitoring locations in Dehradun from October 2024 to March 2025 is shown based on linear regression analysis in Figure 4. The AQI temporal trend was calculated through linear regression models fitted in the three monitoring sites, considering the month number as an independent variable and AQI as a dependent variable. Based on the value of the slope, the AQI values of the four sites decreased over the 6 months, and the air quality gradually improved from winter to early spring. The greatest deterioration at Site 2 (based on the value of the slope) suggests a tendency toward a better temporal pattern that may correlate with a decrease in the number of cars, in favorable dispersion conditions after winter. Though Site 2 had the highest pollution load throughout, AQI declined by 15%–20% at all three sites from peak winter values (December 2024) to those of March 2025. These data suggest the seasonal effect on pollution dilution and the importance of long-term measurements for monitoring dynamic air quality variation in traffic-affected urban areas.
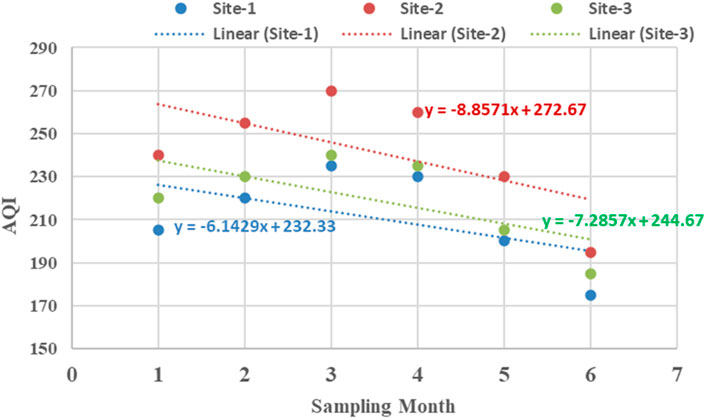
Figure 4. Trend of AQI at three sites during the study period.
Figure 5 shows the correlation matrix computed based on month-by-station data on the values of PM10, SOx, NOx, and AQI. The PM10 and AQI showed excellent positive correlation (r = 1.00), indicating that the PM10 is one of the important factors behind the deterioration of air in the study region. A high correlation of NOx with PM10 and AQI (r = 0.90) was observed, which indicates the large impact on fluctuations of AQI. Moderate correlation was found between PM10 and SOx (r = 0.64) and SOx and NOx (r = 0.62), indicating that these markers had partial co-occurrence, but a slightly weaker relationship existed. It is also observed that SOx has less correlation with AQI (r = 0.64), which suggests that it has less impact on the variability of AQI than PM10 and NOx. These correlation coefficients were significant (p < 0.05). The significant relationship between PM10, NOx, and AQI shows that automobile and particulate sources should be considered and taken into specific management to reduce particulate and vehicular sources and allow for effective control of the air pollution in traffic-influenced urban areas.
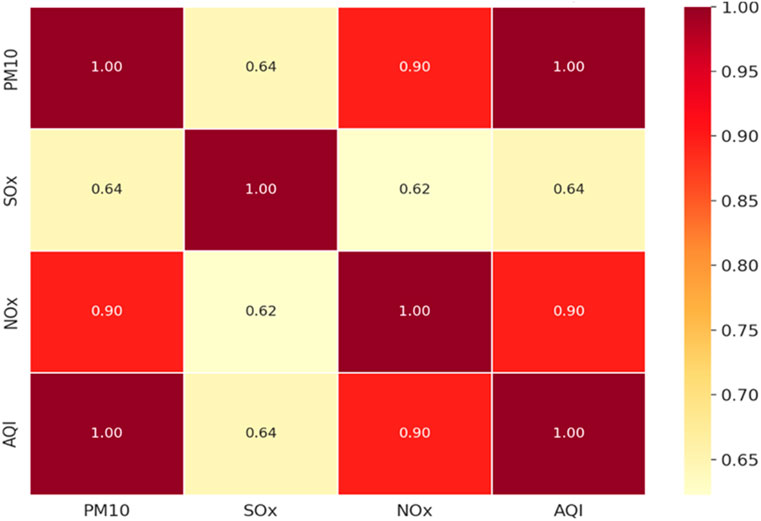
Figure 5. Correlation between different air quality parameters (PM10, SOx, NOx, and AQI).
A correlation matrix of the air pollutants (PM10, SOx, and NOx) and meteorological factors (temperature, wind speed, humidity, and pressure) is presented in Figure 6. The correlation heatmap highlights the interdependencies among meteorological variables, air pollutants, and AQI. A very strong positive correlation (p < 0.01) was observed between PM10, SOx, NOx, and AQI, suggesting that these pollutants are the dominant contributors to air quality deterioration in the study region, which is indicative of their common vehicular and industrial sources of emission. The wind speed showed a high and significant negative relationship with all the pollutants (PM10: r = −0.84, SOx: r = −0.81, NOx: r = −0.82; p < 0.05), which means that high wind speed supports pollutant dispersion (Chakraborty et al., 2019). However, the correlation between these values and temperature suggested that the pollutant trend is opposite to that of temperature. The significant correlations (p < 0.01) observed emphasize the complexity of the synchronized relationship between meteorological parameters and the effect on pollutant transport, accumulation, and removal at urban roadsides.
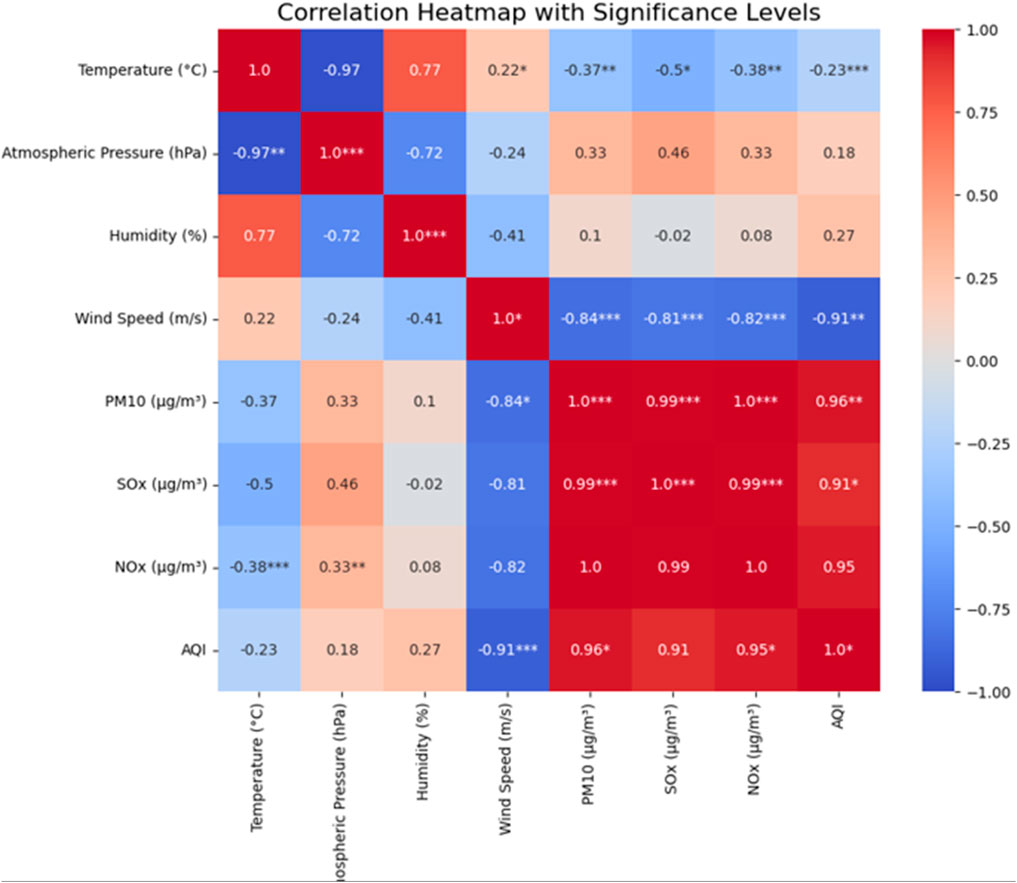
Figure 6. Correlation matrix between air quality and meteorological parameters. (* <0.05; ** <0.01; *** <0.001).
Temperature showed a negative association with pollutants but a significant inverse relation with atmospheric pressure (r = −0.93, p < 0.05), reflecting the dynamics of local weather systems. Significant inverse relationships between wind speed and air pollutants (e.g., PM10 and wind speed, −0.85) suggest that higher wind speeds are linked to lower pollutant concentrations, most likely as a result of dispersion. Humidity displayed a weak positive correlation with AQI, implying limited influence compared to other meteorological parameters. Overall, the analysis confirms that stagnant atmospheric conditions with low wind speed exacerbate pollutant concentrations, thereby increasing AQI, whereas increased dispersion through higher wind speeds significantly improves air quality. These results are essential for comprehending the intricate relationship between air quality and meteorological variables. These results highlight the complicated relationships between air pollutant concentrations and atmospheric conditions, as well as how meteorology affects patterns of air quality.
The traffic pollution data for three locations during different time durations are shown in Table 1. The site-wise data have been classified based on traffic density (light, medium, heavy) in three sessions, for PRE (8:00 to 10:00 am), ON (12:00 pm to 2:00 pm), and POST (5:00 to 7:00 pm) times at the pre-flyover, on-flyover, and post-flyover sites. Morning office hours: During the morning, the traffic pollutants are moderately high in all the sites, with Site 1 (pre-flyover) having the highest pollutants in the light and medium categories. Site 3 (post-flyover) has a lower level of light and medium traffic pollution but a higher level of heavy traffic pollution than Site 2 (on-flyover). Midday (off-peak) pollution levels are reduced at all sites, especially for the light traffic. Light traffic is the least at Site 3, while medium and heavy traffic pollution is fairly constant across all sites. During evening office hours, traffic pollution levels increase again in the evening office hours (as in the morning office hours), with Site 1 (pre-flyover) reporting the highest level of light traffic and Site 3 reporting high levels of medium and heavy pollution.
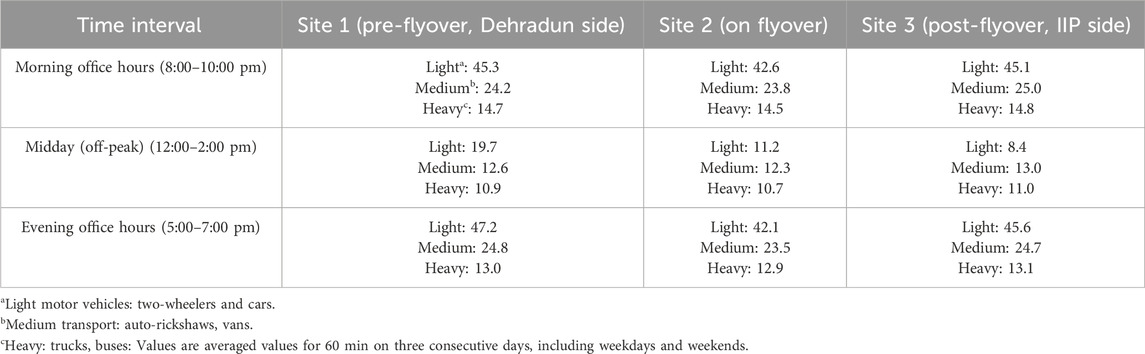
Table 1. Average traffic count during study period (November 2024 to March 2025) (vehicles/min) at each sampling site during peak and off-peak hours.
The seasonal variation in the biochemical and physiological characteristics of the plants (mango and red, white, pink, and gold bougainvillea) at Site 1 (pre-flyover) is given in Tables 2, 3 from November 2024 to March 2025. The amount of total chlorophyll in mango decreased from 3.97 ± 0.77 mg/L (November) to a minimum value of 3.17 ± 0.84 mg/L (February) and increased again to 3.44 ± 0.92 mg/L (March). A decreasing trend was registered in bougainvillea plants as white (1.79 ± 0.32 mg/L) dropped to a low of 1.36 ± 0.32 mg/L (all mL/L). The ascorbic acid content decreased in all the species and mango (2.63 ± 0.43 mg/L to 2.42 ± 0.54 mg/L) of Nov between Feb and Mar, with values (2.56 ± 0.57 mg/L) being significantly lower. In mango, RWC decreased from 53.13% ± 4.33% in Nov to 49.97% ± 5.11% in Feb, indicating mild water stress at peak winter. The carotenoids also exhibited a similar trend. Mango saw a decrease from 3.08 ± 0.65 mg/L to 2.82 ± 0.68 mg/L (February), but an increase in March raised the value to 2.98 ± 0.57 mg/L. Similarly, pH showed a downward trend, especially in mango (6.61 ± 0.32 to 6.18 ± 0.27) as a sign of pollutant-borne stress. In mango, the APTI decreased from 8.09 ± 0.35 (November) to 7.26 ± 0.34 in Feb, indicating heavy susceptibility in winter, with a slight improvement (7.67 ± 0.32) in Mar. These patterns are consistent with higher pollution loading and less favorable meteorological conditions (low temperature and wind speed) during winter.
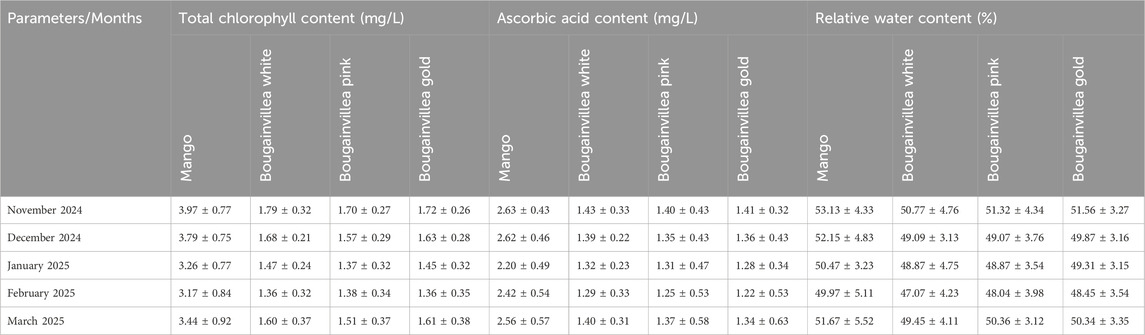
Table 2. Site-1 (pre-flyover, Dehradun side).
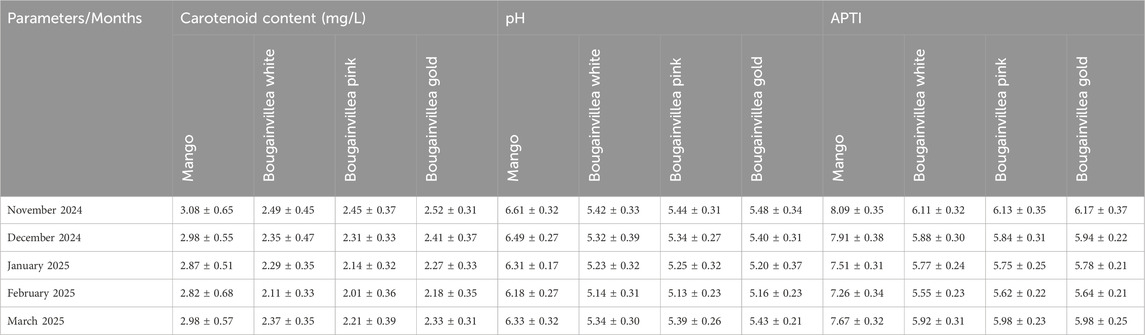
Table 3. Site-1 (pre-flyover, Dehradun side).
Tables 4, 5 illustrate trends of the chemical constituents of the physiologic marker in the mango (Mangifera indica) and bougainvillea (pink, white, and gold var.) at Site 2 (On the Flyover), over 5 months between November 2024 and March 2025. The total chlorophyll content in mango decreases from 3.17 ± 0.47 mg/L in February to 2.57 ± 0.45 mg/L in March. In the case of bougainvillea, the variation in chlorophyll concentration in flowers was not significantly affected by days of stress, even though all varieties showed a decrease in chlorophyll concentration, where the pink variety had lower values (1.06 ± 0.23 mg/L in February). The greatest reduction of ascorbic acid was detected in the bougainvillea locally known as pink (1.05 ± 0.26 mg/L in February), implying that the antioxidant level decreased under pollution. The RWC showed a small difference between genotypes; the highest values (42.87% ± 3.22%) were recorded in mango (in November), and the lowest (38.92% ± 3.54%) in the gold bougainvillea (in February). Carotenoid levels in all species decreased or remained steady; mango presented the highest values in the extreme stress (2.49 ± 0.42 mg/L in November). Carotenoid levels are the main adaptation indicator. The pH remained relatively constant within a small range. The APTI value of the gold bougainvillea was much higher (7.31 ± 0.39) during December, which indicates that the bougainvillea is adapted to the traffic-generated air pollutants in the vicinity of the flyover. Collectively, these data indicate that traffic pollution per se exerts stress on plant physiology, with bougainvillea being more sensitive than mango.
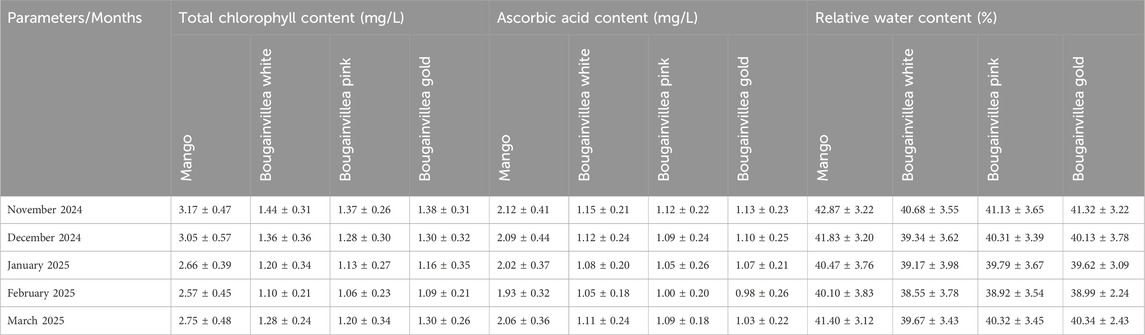
Table 4. S-2, Site 2 (on flyover).
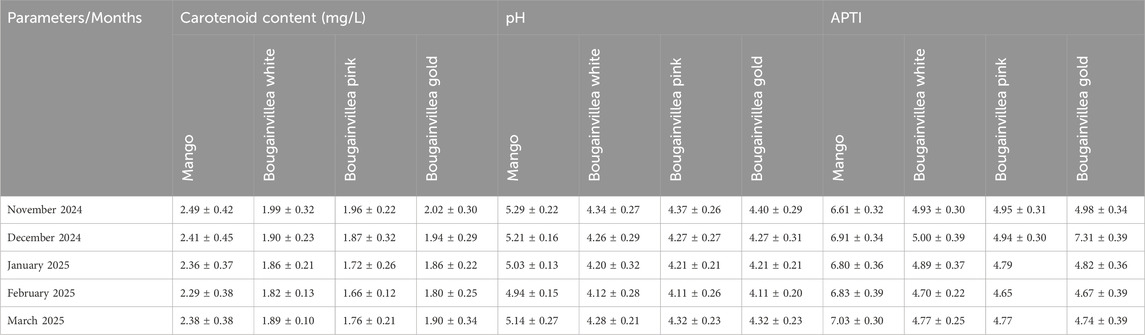
Table 5. S-2, Site 2 (on flyover).
The data presented in Tables 6, 7 for Site 3 (post-flyover, IIP Side) depict the effects of the traffic pollution on mango and bougainvillea (white, pink, and gold) over 5 months (November 2024 to March 2025). The total chlorophyll in mango showed a declining trend with a storage period, from 4.12 ± 0.46 mg/L in November to 3.34 ± 0.47 mg/L in February, with a slight increase in March (3.57 ± 0.51 mg/L). In the case of bougainvillea, the chlorophyll content also decreased for all varieties, with pink showing the largest decrease (1.38 ± 0.14 mg/L in February). The ascorbic acid decrease was significant in all species (higher magnitude in pink bougainvillea (1.30, ESD±0.15 mg/L), which might reflect the drop in the efficiency of the plant against pollution stress. The decrease in RWC was observed in all plants, with mango having the highest values (55.67% ± 3.17% in November) and gold bougainvillea having the lowest RWC (50.07% ± 3.45% in February). Carotenoid content was also reduced in all plants except mango, which showed the highest values (36.23 ± 0.17 mg/L in Nov), probably as a stress response. The pH was nearly constant with slight variation, and the APTI was found to be high (in the month of December for the gold bougainvillea, 9.49 ± 0.30) in the flyover, indicating a strong pollution adaptive capability of the plant species. These results indicate the overall physiological stress of plants exposed to traffic, and that bougainvillea and mango are more sensitive than the others. Despite such stress, however, some species, such as gold bougainvillea, show some level of adaptation mechanisms and responses as evident in the plant APTI.
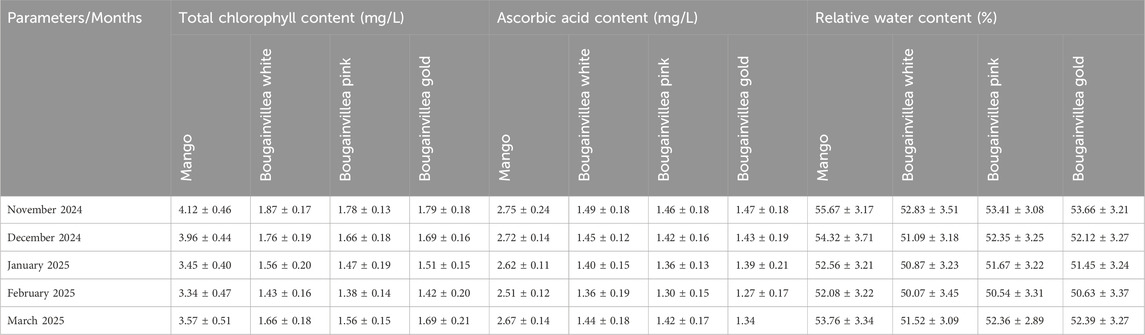
Table 6. Site 3 (post-flyover, IIP side).
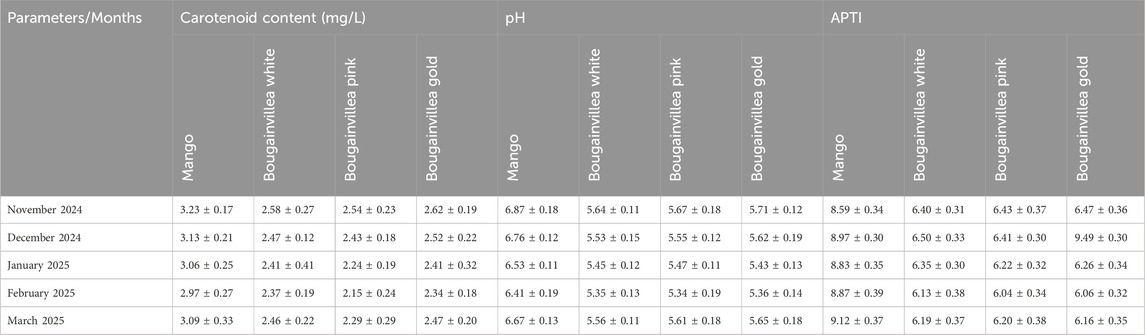
Table 7. Site 3 (post-flyover, IIP side).
4 Discussion
The present work adds further evidence of the effect of road altitude on the modification of the physiological and biochemical responses of urban vegetation to traffic-related air pollution. We have shown that varying concentrations of pollutants characteristic of particular road types can affect the morphological and biochemical traits of plants and trees. The results of this study show fuel consumption is much higher on hilly than on flat terrain, reaching a peak of 4.3 L/100 t-km at moderate gradients. More throttle pressure on uphill roads means more gas to overcome gravity. Road grade is required in energy models and eco-routing to properly predict fuel consumption (Wang et al., 2025). The results of the tests verify that fuel consumption is much greater during acceleration on level or uphill grades than during downhill driving (Wang et al., 2015). On a flat stretch, 8.55 mL/km of fuel was required, and it decreased to 5.90 mL at the downhill (−8.51% gradient run) with a difference of −31.4%. That reduction comes courtesy of gravity’s hand when descending; thus, less engine load is needed to gain speed. In addition, emissions of exhaust gases (CO, CO2, HC, NOx) decreased considerably over the descent. Therefore, the fuel consumption is greater on uphill lanes and flat roads than on downhill lanes (Hanzl et al., 2022). This finding is clear evidence of significantly larger average fuel consumption for the uphill roads than for the flat roads. On a 4% gradient, fuel usage is 1.87–1.96 times that of the flat road for different speeds. ¢ On gradients up to +6% %, fuel consumption is 2.23–2.41 times higher than on level ground. The loss in energy use is not fully offset on the downhill segments of the grades driven; fuel consumed on the uphill segments of the roads is larger than fuel saved on the downhill segments of the road. Consequently, fuel consumption rises exponentially with altitude compared with the flat area, especially for higher slopes and speeds (Jiang et al., 2025).
The level of urbanization in the peri-urban area of Dehradun experienced a marked increase from 1.4% in 2003 to 8.9% in 2023 (8%), with expansion in the southern and the south-eastern part of the city. The urban expansion of Dehradun has contributed to LSTs (land surface temperature (LST) increases and surface heat islands (SHIs) (Dhankar et al., 2024). Enhanced vertical distribution of fine and coarse particles has been reported over mega-urban regions of India. Traffic pollution damages trees through the direct accumulation of particulates on leaves, one of the principal pathways, in addition to gaseous pollutants. The physical blocking leads to a deprivation of absorbed light for photosynthesis, which consequently causes low chlorophyll content and gives rise to lower rates of photosynthesis (Ahmed et al., 2025). The primary contributor of ambient PM is vehicle exhaust directly entering the ambient environment (Jin et al., 2024). Various types of vehicles, ranging from heavy-duty trucks and buses to passenger cars and motorcycles, emit different amounts and compositions of pollutants (Gupta, 2020). Light-duty motor vehicles, like friendly patrol cars and motorcycles, emit less PM than rigid-weight diesel autos and buses (Ajayi et al., 2024; O’Neill et al., 2024; Joerger and Pryor, 2018). Heavy vehicles add to the resuspension of road dust, leading to the deterioration of air quality as well (Alshetty & SM, 2022; Gulia et al., 2019).
The traffic flow results in the vehicle-induced turbulence (VIT), and, in turn, the air velocity and the pollutant dispersion in street canyons are significantly affected by VIT (Thaker and Gokhale, 2016; Zhao et al., 2021; Zheng and Yang, 2021; Zuo et al., 2022). Notably, the exclusion of VIT might lead to substantial overestimates of ambient air pollution levels (Zhao et al., 2021). The pattern of vehicles on lanes, vehicle types, and speed of vehicles generates different VIT, which has a huge influence on controlling the spread of vehicular emission (Cai et al., 2020; Gallagher, 2016; Shi et al., 2020). By comparing pollutant levels at the MF (mid-flyover) and G-Level MV (ground-level motor vehicle), the current study can address the influence on local air quality of a road’s elevation.
The findings of this study demonstrate the significant influence of urban air pollution on the composition of photosynthetic pigments in trees, which directly influences the physiological characteristics and productivity of trees. The reduction in the total chlorophyll and total carotenoid content in the trees of the less polluted areas supported the hypothesis that air pollution, mainly coming from vehicular sources, attacks the photosynthetic apparatus by disturbing the direct and indirect pathways. Earlier studies have demonstrated that the major urban atmospheric pollutants SO2, O3, and NOx inhibit chlorophyll biosynthesis and increase pigment degradation (Chauhan and Joshi, 2008b; Agbaire and Esiefarienrhe, 2009). SO2 is absorbed via the stomata, where it is converted to sulfite and bisulfite ions, which inhibit the enzymatic reactions involved in the synthesis of chlorophyll and replace magnesium in chlorophyll, and in this way, the pigment is decomposed. Similarly, there is production of reactive nitrogen species (RNS) that are capable of inducing oxidative damage to chlorophyll and its binding proteins after NOx exposure (Upadhyay et al., 2025). Ozone is a potent oxidant that induces lipid peroxidation of chloroplast contents and disrupts the pigment–protein complexes that adversely affect pigment stability (Fowler et al., 2009). Additionally, PM, namely PM2.5 particles, adheres to leaves where it behaves as a physical filter for light penetration and gas exchange (Ossola and Farmer, 2024; Lee et al., 2024). Sustained PM deposition can also cause stomatal clogging, mechanical damage to the cuticle with a subsequent increase in the stress on the mesophyll tissues, and accumulation/exacerbation of pigment degradation.
The decrease in carotenoids found in this study is significant because carotenoids have two functions in photosynthesis. They are used in light-harvesting and in the protection of chlorophyll from photooxidations by quenching reactive oxygen species (ROS). The diminution of carotenoids in plants might lead to a reduced ability to protect the plant from light and render it more sensitive to oxidative stress responses against pollutants (de Oliveira et al., 2025; Shanaida et al., 2025). The parallel decrease of the chlorophyll a/b ratio in polluted areas could be indicative of destruction of the photosystem II antenna complexes as well as the photosynthetic reaction centers, leading to a reduction of the harvesting and processing of energy.
Our findings agree with previous studies that reported species-specific responses to pigment reduction under air pollution stress. The amount, nature, and type of damage that may occur are dependent on the texture and composition of the leaf, the density and size of the stomata, the thickness of the leaves, and the inherent ability of the leaf to produce antioxidants (Mishra et al., 2025). Plants with macrophyllous leaves (and glassy cuticles) with a large content of cuticle waxes may also be more resistant than mesophyllous and puberulent leaves. Due to the high reduction in pigment contents in all high-traffic sites, photosynthetic pigments were good and sensitive indicators of atmospheric pollution stress. Therefore, estimation of chlorophyll and carotenoids can be used as a non-invasive indicative method for environmental surveillance and pollution-tolerant species selection for urban afforestation.
Overall, this study highlights the degradation of photosynthetic pigments due to the long-term impact of urban air pollutants with implications for tree health, ecosystem services, and urban greening measures. Future research should concentrate on long-term physiological acclimation, recovery potentials, and interspecies differences to inform the selection of tolerant vegetation for urban greening schemes. Visible leaf curling, tip-burning, and discolorations are symptoms of toxic damage seen on foliage of plants and trees at the morphological level when air pollutants are present (Mehmood, 2024). PM also adheres to the plant leaves, and it is a physical barrier for gas exchange and decreases photosynthesis.
4.1 Limitation
The present study, while providing an understanding of the impact of elevated road traffic pollution on roadside vegetation in Dehradun, has some methodological constraints. First, the data collection was confined to a specific time frame, which may not effectively represent the seasonal variability in pollutant concentrations and plant responses. Because vehicular emissions and meteorological conditions fluctuate significantly across seasons, the results might not capture the complete temporal dynamics of air plant interactions. Furthermore, the study was geographically limited to one urban highway, thereby limiting the generalizability of the findings to other locations with different land-use patterns, traffic densities, and vegetation structures. The selection of only five plant varieties, though relevant, does not encompass the diversity of urban flora that could exhibit varying levels of sensitivity or tolerance to traffic-induced air pollution.
Another limitation lies in the scope of environmental and biological parameters measured. While the study focused on key pollutants (PM10, SOx, and NOx) and important biochemical markers (chlorophyll, ascorbic acid, leaf pH, and APTI), other significant traffic-related pollutants such as ozone, carbon monoxide, volatile organic compounds, and black carbon were not considered. Similarly, plant responses were evaluated primarily at the biochemical level, without incorporating other physiological, anatomical, or molecular indicators that could provide a more comprehensive understanding of stress mechanisms. The study also did not account for modifying factors such as roadside dust deposition, soil conditions, or water availability, which may influence plant health and pollutant uptake. Lastly, a detailed characterization of traffic composition, fuel type, and emission load was not undertaken, which could have strengthened the linkage between source emissions and observed plant responses.
5 Conclusion
This study provides the first comparative analysis of the impacts of motorway flyovers and at-grade roads on air quality and roadside vegetation in Dehradun, India. The findings reveal that elevated roads, especially flyovers, intensify air pollution levels, particularly PM10 and NOx, and exert greater physiological stress on nearby vegetation. Site 2 (on-flyover) was identified as the most pollution-stressed area, with all studied plant species exhibiting significant reductions in chlorophyll, ascorbic acid, leaf pH, and APTI values. In contrast, Site 3 (post-flyover zone) showed notable recovery in both air quality and plant health indicators, suggesting a relatively cleaner microenvironment.
Urban vegetation plays a critical role in mitigating vehicular emissions by influencing air turbulence, altering dispersion patterns, and increasing dry deposition of pollutants. Among the species studied, Mangifera indica demonstrated the highest tolerance to air pollution (APTI 8.09), while bougainvillea varieties, particularly gold, exhibited moderate resilience and species-specific sensitivity. These results indicate that Mangifera indica and bougainvillea “Gold” are effective bio-monitors and can serve as suitable green buffers in urban areas facing high pollution loads. Overall, the study underscores the importance of integrating pollution-tolerant plant species in urban planning and highlights the potential of vegetation-based biomonitoring for sustainable air quality management in rapidly urbanizing cities like Dehradun. Future work should not be limited to diagnostic studies but should also explore practical interventions, such as the selection and promotion of high-APTI species for roadside plantations, optimization of green buffer designs, and evaluation of their co-benefits for urban microclimate regulation and carbon sequestration. By bridging scientific assessments with applied solutions, future studies can significantly contribute to urban sustainability planning and strengthen the role of vegetation as a natural shield against rising vehicular pollution.
Data availability statement
The raw data supporting the conclusions of this article will be made available by the authors, without undue reservation.
Author contributions
AC: Investigation, Writing – original draft, Data curation, Formal Analysis, Methodology, Supervision. GP: Validation, Writing – review and editing, Conceptualization, Data curation. MVS: Supervision, Conceptualization, Validation, Writing – review and editing. MS: Conceptualization, Validation, Writing – review and editing. PG: Conceptualization, Validation, Writing – review and editing, Visualization. AA: Methodology, Validation, Supervision, Conceptualization, Writing – review and editing. SC: Writing – review and editing, Validation, Conceptualization. AL: Funding acquisition, Writing – review and editing, Resources, Project administration, Investigation.
Funding
The author(s) declare that financial support was received for the research and/or publication of this article. This article has been supported by the Graphic Era Hill University, Dehradun, Uttarakhand, India.
Conflict of interest
The authors declare that the research was conducted in the absence of any commercial or financial relationships that could be construed as a potential conflict of interest.
Generative AI statement
The author(s) declare that no Generative AI was used in the creation of this manuscript.
Any alternative text (alt text) provided alongside figures in this article has been generated by Frontiers with the support of artificial intelligence and reasonable efforts have been made to ensure accuracy, including review by the authors wherever possible. If you identify any issues, please contact us.
Publisher’s note
All claims expressed in this article are solely those of the authors and do not necessarily represent those of their affiliated organizations, or those of the publisher, the editors and the reviewers. Any product that may be evaluated in this article, or claim that may be made by its manufacturer, is not guaranteed or endorsed by the publisher.
References
Agbaire, P. O., and Esiefarienrhe, E. (2009). Air pollution tolerance indices (APTI) of some plants around otorogun gas plant in Delta state, Nigeria. J. Appl. Sci. Environ. Manag. 13 (1), 11–14. doi:10.4314/jasem.v13i1.55251
Ahmed, S., Bose, A., and Thomas, M. (2025). Physiological responses of roadside trees to particulate matter pollution in metropolitan environments. Environ. Pollut. Res. 33 (2), 155–167. doi:10.1016/j.envpolres.2025.01.005
Ajayi, S. A., Adams, C. A., Dumedah, G., and Adebanji, A. O. (2024). The impact of vehicle engine characteristics on vehicle exhaust emissions for transport modes in Lagos City. Urban, Plan. Transp. Res. 12 (1), 2319328. doi:10.1080/21650020.2024.2319328
Al-Sabbagh, T. A., and Shreaz, S. (2025). Impact of lead pollution from vehicular traffic on highway-side grazing areas: challenges and mitigation policies. Int. J. Environ. Res. Public Health 22 (2), 311. doi:10.3390/ijerph22020311
Alshetty, D., and Sm, S. N. (2022). Urban characteristics and its influence on resuspension of road dust, air quality and exposure. Air Qual. Atmos. and Health 15 (5), 273–287. doi:10.1007/s11869-021-01102-x
Anigilaje, E. A., Nasir, Z. A., and Walton, C. (2024). Exposure to benzene, toluene, ethylbenzene, and xylene (BTEX) at Nigeria's petrol stations: a review of current status, challenges and future directions. Front. Public Health, 12, Article 1295758. doi:10.3389/fpubh.2024.1295758
Antenozio, M. L., Caissutti, C., Caporusso, F. M., Marzi, D., and Brunetti, P. (2024). Urban air pollution and plant tolerance: omics responses to ozone, nitrogen oxides, and particulate matter. Plants 13 (15), 2027. doi:10.3390/plants13152027
Awasthi, A., Hothi, N., Kaur, P., Singh, N., Chakraborty, M., and Bansal, S. (2017). Elucidative analysis and sequencing of two respiratory health monitoring methods to study the impact of varying atmospheric composition on human health. Atmos. Environ. 171, 32–37. doi:10.1016/j.atmosenv.2017.10.008
Awasthi, A., Pattnayak, K. C., Tandon, A., Sarkar, A., and Chakraborty, M. (2023). Implications of climate change on surface temperature in North Indian states: evidence from CMIP6 model ensembles. Front. Environ. Sci. 11, 1264757. doi:10.3389/fenvs.2023.1264757
Boogaard, H., Patton, A. P., Atkinson, R. W., Brook, J. R., Chang, H. H., Crouse, D. L., et al. (2022). Long-term exposure to traffic-related air pollution and selected health outcomes: a systematic review and meta-analysis. Environ. Int. 164, 107262. doi:10.1016/j.envint.2022.107262
Cai, C., Ming, T., Fang, W., and de Richter, R. K. (2020). The effect of turbulence induced by different kinds of moving vehicles in street canyons. Sustain. Cities Soc. 54, 102015. doi:10.1016/j.scs.2020.102015
Chakraborty, M., Bansal, S., Masiwal, R., and Awasthi, A. (2019). “Air-pollution modelling aspects: an overview,” in Air pollution: sources, impacts and controls, 79–95.
Chauhan, A. (2010). Photosynthetic pigment changes in some selected trees induced by automobile exhaust in Dehradun, Uttarakhand. N. Y. Sci. J. 3 (2), 45–51.
Chauhan, A., and Joshi, P. C. (2008a). Effect of ambient air pollution on photosynthetic pigments on some selected trees in urban area. Ecol. Environ. Conservation 14 (4), 23–27.
Chauhan, A., and Joshi, P. C. (2008b). Air quality index and its variations in haridwar. J. Environ. Biosci. 22 (2), 171–176.
Chauhan, A., and Pawar, M. (2010). Assessment of ambient air quality status in urbanization, industrialization and commercial centers of Uttarakhand (India). N. Y. Sci. J. 3 (7), 85–94.
Chelani, A. B., Rao, C. C., Phadke, K. M., and Hasan, M. Z. (2002). Formation of an air quality index in India. Int. J. Environ. Stud. 59 (3), 331–342. doi:10.1080/00207230211300
Corada, K., Woodward, H., Alaraj, H., Collins, C. M., and de Nazelle, A. (2021). A systematic review of the leaf traits considered to contribute to removal of airborne particulate matter pollution in urban areas. Environ. Pollut. 269, 116104. doi:10.1016/j.envpol.2020.116104
Das, S., Roy, A., Masiwal, R., Mandal, M., Popek, R., Chakraborty, M., et al. (2023). Comprehensive analysis of PM1 composition in the Eastern indo-gangetic Basin: a three-year urban study. Sustainability 15 (20), 14894. doi:10.3390/su152014894
de Oliveira, E. A., Borella, D. R., Lopes, V. J. S., Battirola, L. D., Andrade, R. L. T. D., and Silva, A. C. D. (2025). Physiological effects of mercury on handroanthus impetiginosus (Ipê roxo) plants. Agronomy 15 (3), 736. doi:10.3390/agronomy15030736
Dhankar, S., Singh, G., and Kumar, K. (2024). Impacts of urbanization on land use, air quality, and temperature dynamics in dehradun district of Uttarakhand, India: a comprehensive analysis. Front. Environ. Sci. 12, 1324186. doi:10.3389/fenvs.2024.1324186
Dutta, R., Meena, M., and Saini, K. (2025). Seasonal assessment of NOx and ozone-induced damage in roadside trees of Northern India. Urban For. and Urban Green. 81, 127912. doi:10.1016/j.ufug.2025.127912
Duxbury, A. C., and Yentsch, C. S. (1956). Plankton pigment monographs. J. Mar. Res. 15 (1), 92–101.
Edo, G. I., Itoje-Akpokiniovo, L. O., Obasohan, P., Ikpekoro, V. O., Samuel, P. O., Jikah, A. N., et al. (2024). Impact of environmental pollution from human activities on water, air quality and climate change. Ecol. Front. 44 (5), 874–889. doi:10.1016/j.ecofro.2024.02.014
Ehrnsperger, L., and Klemm, O. (2022). Air pollution in an urban street canyon: novel insights from highly resolved traffic information and meteorology. Atmos. Environ. 13, 100151. doi:10.1016/j.aeaoa.2022.100151
Esmaeilpour Moghadam, H., Karami, A., Moghadam Ebrahimabad, A. R., and Radulescu, M. (2025). The impact of circular economy initiatives on urban air quality in the United States. Sci. Rep. 15, 23860. doi:10.1038/s41598-025-08554-6
Fowler, D., Pyle, J. A., Raven, J. A., Sutton, M. A., Cape, J. N., Reis, S., et al. (2009). The global nitrogen cycle in the twenty-first century: introduction. Philosophical Trans. R. Soc. B Biol. Sci. 368 (1621), 20130164. doi:10.1098/rstb.2013.0164
Gallagher, M., Basu, B., Ghosh, B., Alam, M. S., Gill, L., Kamber, B., et al. (2021). Particulate matter from diesel vehicles: emissions and exposure (EPA Research Report No. 367). EPA. Available online at: https://www.epa.ie/publications/research/air/Research_Report_367.pdf.
Gaur, R., and Singh, H. (2024). “Urban tree responses to climate change and environmental pollution,” in Urban forests, climate change and environmental pollution (Springer), 279–305. doi:10.1007/978-3-031-67837-0_14
Guidi Nissim, W., Castiglione, S., Guarino, F., Pastore, M. C., and Labra, M. (2023). Beyond cleansing: ecosystem services related to phytoremediation. Plants 12 (5), 1031. doi:10.3390/plants12051031
Gulia, S., Goyal, P., Goyal, S. K., and Kumar, R. (2019). Re-suspension of road dust: contribution, assessment and control through dust suppressants—A review. Int. J. Environ. Sci. Technol. 16 (3), 1717–1728. doi:10.1007/s13762-018-2064-1
Gupta, V. (2020). “Vehicle-generated heavy metal pollution in an urban environment and its distribution into various environmental components,” in Environmental concerns and sustainable development: volume 1: air, water and energy resources (Springer), 113–127. doi:10.1007/978-981-13-6358-0_8
Gupta, N., and Yadav, A. (2025). Air pollution tolerance index of common urban tree species in Delhi NCR. J. Environ. Biol. 46 (1), 101–109. doi:10.22438/jeb/46/1/MRN-2231
Hanzl, J., Pečman, J., Bartuška, L., Stopka, O., and Šarkan, B. (2022). Research on the effect of road height profile on fuel consumption during vehicle acceleration. Technologies 10 (6), 128. doi:10.3390/technologies10060128
Hiscox, J. D., and Israelstam, G. F. (1979). A method for the extraction of chlorophyll from leaf tissue without maceration. Can. J. Bot. 57 (12), 1332–1334. doi:10.1139/b79-163
Hyrkäs-Palmu, H., Hugg, T. T., Jaakkola, J. J. K., and Ikäheimo, T. M. (2025). The influence of weather and urban environment characteristics on upper respiratory tract infections: a systematic review. Front. Public Health 13, 1487125. doi:10.3389/fpubh.2025.1487125
Jakubiak-Lasocka, J., Lasocki, J., Siekmeier, R., and Chłopek, Z. (2014). “Impact of traffic-related air pollution on health,” in Environment exposure to pollutants (Springer), 21–29. doi:10.1007/978-94-007-6410-1_2
Jiang, B., Yang, D., Yu, H., Wang, J., He, C., Li, J., et al. (2025). Impact of road gradient on fuel consumption of light-duty diesel vehicles. Atmosphere 16 (2), 143. doi:10.3390/atmos16020143
Jin, M.-Y., Zhang, L.-Y., Peng, Z.-R., He, H.-D., Kumar, P., and Gallagher, J. (2024). The impact of dynamic traffic and wind conditions on green infrastructure performance to improve local air quality. Sci. Total Environ. 917, 170211. doi:10.1016/j.scitotenv.2024.170211
Joerger, V. M., and Pryor, S. C. (2018). Ultrafine particle number concentrations and size distributions around an elevated highway viaduct. Atmos. Pollut. Res. 9 (4), 714–722. doi:10.1016/j.apr.2017.11.005
Joshi, P. C., and Chauhan, A. (2008). Performance of locally grown rice plants (Oryza sativa L.) exposed to air pollutants in a rapidly growing industrial area of district Haridwar, Uttarakhand, India. Life Sci. J. 5 (3), 41–45.
Joshi, N., Chauhan, A., and Joshi, P. C. (2009). Impact of industrial air pollutants on some biochemical parameters and yield in wheat and mustard plants. Environ. 29 (4), 398–404. doi:10.1007/s10669-009-9218-4
Kadiyali, L. R. (1999). Traffic engineering and transport planning. 9th ed. New Delhi, India: Khanna Publishers.
Kim, J. J., Smorodinsky, S., Lipsett, M., Singer, B. C., Hodgson, A. T., and Ostro, B. (2004). Traffic-related air pollution near busy roads: the East Bay Children's respiratory health study. Am. J. Respir. Crit. Care Med. 170 (5), 520–526. doi:10.1164/rccm.200403-281OC
Kumar, H., Rathi, M., and Chauhan, A. (2025). Impact of vehicular emissions on urban flora: a case study of roadside plantations. Atmos. Environ. Adv. 21, 100422. doi:10.1016/j.aea.2025.100422
Lee, J., Kwak, M. J., and Woo, S. Y. (2024). Adsorption of particulate matter and uptake of metal and non-metal elements from PM in leaves of Pinus densiflora and Quercus acutissima: a comparative study. Front. For. Glob. Change 6, 1301533. doi:10.3389/ffgc.2023.1301533
Liu, Y., Zhao, X., Liu, R., Zhou, J., and Jiang, Z. (2022). Biomonitoring and phytoremediation potential of the leaves, bark, and branch bark of street trees for heavy metal pollution in urban areas. Environ. Monit. Assess. 194 (5), 344. doi:10.1007/s10661-022-10004-z
Lolage, S. N. (2025). “Urban sustainability and air pollution emission,” in Sustainable urban environment and waste management: theory and practice (Springer), 107–116. doi:10.1007/978-981-96-1140-9_5
Lopez-Aparicio, S., Grythe, H., Drabicki, A., Chwastek, K., Toboła, K., Górska-Niemas, L., et al. (2025). Environmental sustainability of urban expansion: implications for transport emissions, air pollution, and city growth. Environ. Int. 187, 109310. doi:10.1016/j.envint.2025.109310
Mahmud, S., Gautam, S., Rahman, M. S., Hossain, M., Mortuza, G., and Khan, M. B. (2025). Evaluation of tolerance index of commonly growing roadside plants in urban traffic areas of Mymensingh City, Bangladesh using air pollution tolerance index and metal accumulation index. Aerosol Sci. Eng., 1–21. doi:10.1007/s41810-025-00311-6
Malik, A., Singh, H., Kumar, K., Kumari, G., and Sojitra, A. (2024). “Understanding the impact of climate change and environments on urban forests: insights from morphological, physiological, and molecular perspectives,” in Urban forests, climate change and environmental pollution. Editors A. Malik, H. Singh, and A. Sojitra (Cham: Springer), 161–183. doi:10.1007/978-3-031-67837-0_8
Malik, R., Rehman, F., Dhupper, R., Nadeem, B., Jain, H., Bhardwaj, A., et al. (2025). Intelligent predictive systems for modeling PM10, ozone, and temperature dynamics: a forecasting approach for urban air quality in Delhi. Aerosol Sci. Eng., 1–11. doi:10.1007/s41810-025-00301-8
Mathew, A., Aljohani, T. H., Shekar, P. R., Arunab, K. S., Sharma, A. K., and Ahmed, M. F. M. (2025). Spatiotemporal dynamics of urban heat island effect and air pollution in Bengaluru and hyderabad: implications for sustainable urban development. Discov. Sustain. 6 (1), 134. doi:10.1007/s43621-025-00098-7
Mehmood, Z. (2024). Morphological and biochemical responses of plants to air pollutants: a review. Sustainability 16 (8), 3427. doi:10.3390/su16083427
Mehmood, Z., Yang, H. H., Awan, M. U. F., Ahmed, U., Hasnain, A., Luqman, M., et al. (2024). Effects of air pollution on morphological, biochemical, DNA, and tolerance ability of roadside plant species. Sustainability 16 (8), 3427. doi:10.3390/su16083427
Meo, S. A., Salih, M. A., Alkhalifah, J. M., Alsomali, A. H., and Almushawah, A. A. (2024). Environmental pollutants particulate matter (PM2.5, PM10), carbon monoxide (CO), nitrogen dioxide (NO2), sulfur dioxide (SO2), and ozone (O3) impact on lung functions. J. King Saud Univ. - Sci. 36 (7), 103280. doi:10.1016/j.jksus.2024.103280
Mishra, A. K., Gupta, S., Agrawal, S. B., and Tiwari, S. (2025). Role of stomatal and leaf anatomical features in defining plant performance under elevated carbon dioxide and ozone, in the changing climate scenario. Environ. Sci. Pollut. Res. 32, 2536–2550. doi:10.1007/s11356-024-35877-0
Muthu, M., Gopal, J., Kim, D. H., and Sivanesan, I. (2021). Reviewing the impact of vehicular pollution on roadside plants—Future perspectives. Sustainability 13 (9), 5114. doi:10.3390/su13095114
Nyayapathi, P. P., Namuduri, S., and Kolli, S. K. (2025). A comprehensive review of vertical profiling of ambient air quality—particulate matter and its impacts on climatic and environmental health. Air Qual. Atmos. and Health, 1–27. doi:10.1007/s11869-025-01024-3
Olloquequi, J., Díaz-Peña, R., Verdaguer, E., Ettcheto, M., Auladell, C., and Camins, A. (2024). From inhalation to neurodegeneration: air pollution as a modifiable risk factor for Alzheimer’s disease. Int. J. Mol. Sci. 25 (13), 6928. doi:10.3390/ijms25136928
Ossola, R., and Farmer, D. (2024). The chemical landscape of leaf surfaces and its interaction with the atmosphere. Chem. Rev. 124 (9), 5764–5794. doi:10.1021/acs.chemrev.3c00763
O’Neill, J., Seaton, M., Johnson, K., Stocker, J., Patel, R., Van Poppel, M., et al. (2024). Modelling the influence of road elevation on pollutant dispersion. Air Qual. Atmos. and Health 17 (6), 1253–1264. doi:10.1007/s11869-024-00947-0
Pakhira, R., Biswas, S., and Singh, H. (2024). “Urbanization and climate change: impacts, adaption and mitigation strategies,” in Urban forests, climate change and environmental pollution. Editors A. Malik, H. Singh, and A. Sojitra (Cham: Springer), 47–72. doi:10.1007/978-3-031-67837-0_3
Popek, R., Roy, A., Mandal, M., Przybysz, A., Drążkiewicz, K., Romanowska, P., et al. (2024). Enhancing urban sustainability: how spatial and height variability of roadside plants improves pollution capture for greener cities. Sustainability 16 (24), 11131. doi:10.3390/su162411131
Roy, A., Mandal, M., Das, S., Kumar, M., Popek, R., Awasthi, A., et al. (2024). Non-exhaust particulate pollution in Asian countries: a comprehensive review of sources, composition, and health effects. Environ. Eng. Res. 29 (3), 230384–0. doi:10.4491/eer.2023.384
Sadasivam, S., and Manickam, A. (1996). Biochemical methods. 2nd ed. New Delhi, India: New Age International.
Saxena, V. (2025). Water quality, air pollution, and climate change: investigating the environmental impacts of industrialization and urbanization. Water Air Soil Pollut. 236, 73. doi:10.1007/s11270-024-07702-4
Shanaida, M., Mykhailenko, O., Lysiuk, R., Hudz, N., Balwierz, R., Shulhai, A., et al. (2025). Carotenoids for antiaging: nutraceutical, pharmaceutical, and cosmeceutical applications. Pharmaceuticals 18 (3), 403. doi:10.3390/ph18030403
Shi, T., Ming, T., Wu, Y., Peng, C., Fang, Y., and de Richter, R. (2020). The effect of exhaust emissions from a group of moving vehicles on pollutant dispersion in street canyons. Build. Environ. 181, 107120. doi:10.1016/j.buildenv.2020.107120
Singh, H. (2023). An integrated approach considering physiological- and biophysical-based indicators for assessing tolerance of roadside plantations of Alstonia scholaris towards urban roadside air pollution: an assessment of adaptation of plantations for mitigating roadside air pollution. Trees 37 (1), 69–83. doi:10.1007/s00468-021-02179-8
Singh, H. (2025). “The role of plant functional traits in mitigating urban climate and environmental pollution,” in Plant functional traits (Elsevier), 297–308. doi:10.1016/B978-0-443-13367-1.00015-6
Singh, S. K., and Rao, D. N. (1991). “Evaluation of plants for their tolerance to air pollution,” in Proceedings of symposium on air pollution control. Editors P. K. Gupta, and D. N. Rao (New Delhi, India: Indian Association for Air Pollution Control), 218–224.
Singh, V., Srivastava, R. K., and Bhatt, A. K. (2025). Sources of air pollution. In V. Singh, R. K. Srivastava, and A. K. Bhatt (Eds.), Battling air and water pollution: protecting our planet’s vital resources (pp. 17–29). Springer Nature: Singapore. doi:10.1007/978-981-96-4375-2_2
Smith, W. H. (1990). “Forests as sinks for air contaminants: vegetative compartment,” in Air pollution and forests. Springer series on environmental management (New York, NY: Springer). doi:10.1007/978-1-4612-3296-4_6
Solomun, M. K., Ilić, Z. H., Kalantari, Z., Eremija, S., Čigoja, I., Ferreira, C., et al. (2024). Phytoremediation by trees as a nature-based solution for mitigating metal contamination in urban soils. Environ. Sci. Pollut. Res. 31 (17), 24936–24950. doi:10.1007/s11356-024-32773-5
Thaker, P., and Gokhale, S. (2016). The impact of traffic-flow patterns on air quality in urban street canyons. Environ. Pollut. 208(Pt A), 161–169. doi:10.1016/j.envpol.2015.09.004
Time and Date (2025). Historic weather data for Dehradun, India. Available online at: https://www.timeanddate.com/weather/india/dehradun/historic?month=11&year=2024.
Tiwari, A., Gajbhiye, T., Pandey, M., Agrawal, K., Naik, S., Meher, S., et al. (2025). Foliar image-based characterization of airborne particulate matter in an urban area and its implications for remediation. Sci. Rep. 15, 2212. doi:10.1038/s41598-024-84552-4
Umer, S., Abbas, Z., Aziz, I., Hanif, M., Abideen, Z., Mansoor, S., et al. (2023). Potential of ornamental trees to remediate trace metal contaminated soils for environmental safety and urban green space development. Sustainability 15 (11), 8963. doi:10.3390/su15118963
Upadhyay, A., Hossain, M. S., Islam, S. S., Roy, S. K., Islam, A., Mondal, I., et al. (2025). Fly ash pollution causes morpho-anatomical and biochemical changes in Eichhornia crassipes (Mart.) solms and Pistia stratiotes L: demonstrating stress-tolerant activity. Sci. Rep. 15, 14154. Article 14154. doi:10.1038/s41598-025-97583-2
Vashist, M., Kumar, T. V., and Singh, S. K. (2024). A comprehensive review of urban vegetation as a nature-based solution for sustainable management of particulate matter in ambient air. Environ. Sci. Pollut. Res. 31 (18), 26480–26496. doi:10.1007/s11356-024-33089-0
Wang, Y., Du, X., Yu, H., Huang, J., and Li, Y. (2015). “Impacts of road grade on fuel consumption of light vehicles by use of google Earth DEM,” in 2015 international conference on cyber-enabled distributed computing and knowledge discovery (IEEE), 360–363. doi:10.1109/CyberC.2015.73
Wang, A., Wang, J., Zhang, R., and Cao, S. J. (2024). Mitigating urban heat and air pollution considering green and transportation infrastructure. Transp. Res. Part A Policy Pract., 184, doi:10.1016/j.tra.2024.104079
Wang, D., Xu, P. Y., An, B. W., and Guo, Q. P. (2024). Urban green infrastructure: bridging biodiversity conservation and sustainable urban development through adaptive management approach. Front. Ecol. Evol. 12, 1440477. doi:10.3389/fevo.2024.1440477
Wang, L. K., Balasubramanian, R., He, J., and Wang, M. H. S. (2025). “Control and management of air emissions from the transportation industry,” in Control of heavy metals in the environment (Florida, United States: CRC Press), 396–420.
Weatherley, P. E. (1965). “The state and movement of water in the leaf,”. Symposia of the society for experimental biology. Editor W. Ruhland (Cambridge University Press), 19, 157–184.
World Weather Online (2025). Weather history for dehradun, India. Available online at: https://www.worldweatheronline.com/dehradun-weather-history/uttarakhand/in.aspx.
Yan, D., Huang, S., Chen, G., Tong, H., and Qin, P. (2025). Heterogeneous influences of urban compactness on air pollution: evidence from 285 prefecture-level cities in China. Humanit. Soc. Sci. Commun. 12 (1), 1–15. doi:10.1057/s41599-025-02012-3
Zhao, Y., Jiang, C., and Song, X. (2021). Numerical evaluation of turbulence induced by wind and traffic, and its impact on pollutant dispersion in street canyons. Sustain. Cities Soc. 74, 103142. doi:10.1016/j.scs.2021.103142
Zheng, X., and Yang, J. (2021). CFD simulations of wind flow and pollutant dispersion in a street canyon with traffic flow: comparison between RANS and LES. Sustain. Cities Soc. 75, 103142. doi:10.1016/j.scs.2021.103307
Keywords: Urban air pollution, AQI, APTI, plant-based biomonitoring, traffic stress, urban pollution monitoring
Citation: Chauhan A, Pandey G, Singh MV, Sethi M, Gururani P, Awasthi A, Chaube S and Lodh A (2025) Assessment of elevated road traffic pollution on roadside trees and vegetation in urban environments. Front. Environ. Sci. 13:1657859. doi: 10.3389/fenvs.2025.1657859
Received: 01 July 2025; Accepted: 08 September 2025;
Published: 10 October 2025.
Edited by:
Pradeep Kumar, Manipal University Jaipur, IndiaReviewed by:
Santosh Kumar Verma, Yulin University, ChinaDinesh Kumar, Birla Institute of Technology and Science, India
Abhishek Swami, Avviare Educational Hub, Noida, India
Copyright © 2025 Chauhan, Pandey, Singh, Sethi, Gururani, Awasthi, Chaube and Lodh. This is an open-access article distributed under the terms of the Creative Commons Attribution License (CC BY). The use, distribution or reproduction in other forums is permitted, provided the original author(s) and the copyright owner(s) are credited and that the original publication in this journal is cited, in accordance with accepted academic practice. No use, distribution or reproduction is permitted which does not comply with these terms.
*Correspondence: Man Vir Singh, bWFudmlyMjQzNjVAZ21haWwuY29t; Amit Awasthi, YXdhc3RoaXRpZXRAZ21haWwuY29t; Abhishek Lodh, YWJoaXNoZWsubG9kaEBuYXRla28ubHUuc2U=, YWJoaXNoZWsuc21oaS5sb2RoQGdtYWlsLmNvbQ==, YWJoaXNoZWsubG9kaEBnb3YuaW4=
†Present address: Abhishek Lodh, National Centre for Medium Range Weather Forecasting (NCMRWF), Ministry of Earth Sciences, Noida, India