 Shuchang Yang1,2,3
 Zhongju Meng
- 1College of Desert Control Science and Engineering, Inner Mongolia Agricultural University, Hohhot, China
- 2College of Forestry, Inner Mongolia Agricultural University, Hohhot, China
- 3Key Laboratory of Aeolian Physics and Desertification Control Engineering from Inner Mongolia Autonomous Region, Inner Mongolia Agricultural University, Hohhot, China
The Inner Mongolia Western Sandy Area (IMWSA) is a vital component of China’s northern ecological security barrier, with its ecological environment highly sensitive to both climate change and human activities. Investigating the spatiotemporal dynamics of the eco-environmental quality (EEQ) in this region is essential for enhancing ecological governance and promoting sustainable development in sandy areas. Building on the traditional Remote Sensing Ecological Index (RSEI), this study adapted it to the ecological characteristics of the IMWSA by incorporating five indicators—greenness, humidity, land surface temperature, dryness, and salinity—to develop an enhanced eRSEI model suitable for regional EEQ assessment. Using this model, the spatiotemporal evolution of EEQ in the IMWSA from 2000 to 2024 was systematically analyzed. The optimal-parameter Geodetector Model (GDM) and partial correlation analysis were employed to identify the driving factors responsible for its spatial differentiation and temporal variation. We found that EEQ was generally better in the southeast and declined towards the northwest. During the study period, the eRSEI exhibited an overall upward trend, at a rate of 0.0056 per decade, indicating a general improvement in EEQ, with the spatial extent of significant improvement (9.52%) clearly exceeding that of significant deterioration (1.69%). The Hurst exponent of the IMWSA was 0.38, which indicated anti-persistent characteristics and suggested that future EEQ improvement might slightly outweigh deterioration. Land use types and meteorological variables were the main driving factors influencing the spatial distribution and variation of eRSEI. Positive correlations were observed between eRSEI and temperature, precipitation, and solar radiation, with precipitation showing the strongest association. Recent climate change has generally hindered EEQ improvement. In contrast, human-induced land use changes, particularly ecological restoration, have enhanced vegetation cover and regional microclimates, resulting in an average eRSEI increase of 0.07 in areas where land use had changed compared to those that remained unchanged, making them the primary drivers of ecological improvement.
1 Introduction
Climate change and human activities are exerting growing pressure on both global and regional ecosystems (Aizizi et al., 2023). Observational data indicate that 2024 was the hottest year on record, with the global average surface temperature increasing by 1.55 °C ± 0.13 °C above pre-industrial levels (WMO, 2025). This warming trend is expected to persist, with global average temperatures projected to increase by at least 4 °C by 2,100 (Wang C. et al., 2023). Against this backdrop, global drought conditions are projected to worsen, increasing the vulnerability of ecosystems in semi-arid and arid regions (Yuan et al., 2023; Zhang L. Y. et al., 2025). Meanwhile, the ecological impact of human activities continues to intensify. On the one hand, rapid economic development has led to urban expansion, growing urbanization and irrational land use, all of which exacerbate ecological problems such as soil erosion and desertification (Shi and Li, 2021). On the other hand, large-scale ecological restoration projects have significantly contributed to the improvement of regional ecological conditions (Zhang et al., 2024a). In response to the challenges posed by climate warming and human activities, accurate and timely monitoring of regional ecological conditions is essential for developing science-based ecological protection policies and promoting sustainable socio-economic development.
Eco-environmental quality (EEQ) assessment refers to the qualitative or quantitative evaluation of ecological conditions within a defined spatial and temporal context, considering the impacts of human activities and socio-economic development. It serves as a critical indicator for assessing the degree of coordination between anthropogenic production activities and the natural environment (Bai et al., 2023; Wu et al., 2024). A variety of methods have been developed to assess EEQ, including the analytic hierarchy process (AHP) (Kim et al., 2021), fuzzy comprehensive evaluation (Zhang and Shang, 2024), grey clustering analysis, artificial neural networks (ANN) (Nourani et al., 2021), and index construction. AHP and fuzzy evaluation rely heavily on expert judgment for indicator weighting, introducing subjectivity, especially when dealing with large indicator sets. Grey clustering analysis, based on the whitening functions of grey numbers, involves complex implementation, while ANN models require large, representative datasets and involve high computational complexity. In contrast, index construction methods—particularly those supported by satellite-based Earth observation—have gained increasing attention in recent years due to their efficiency and scalability. Remote sensing Earth observation technology, with its high spatial resolution, strong temporal periodicity, broad coverage, and rich spectral information (Yang T. F. et al., 2022; Liu et al., 2021), has become the primary approach for monitoring and assessing EEQ (Qin et al., 2024). The evaluation of EEQ initially relied on single-factor remote sensing indicators, such as the normalized difference vegetation index (NDVI) and enhanced vegetation index (EVI) for assessing vegetation conditions (Gillespie et al., 2018; Cornejo-Denman et al., 2018), as well as land surface temperature (LST) and the impervious surface index for evaluating urban surface heat effects (Bian et al., 2017; Mathew et al., 2018; Qian and Wu, 2019). Although these indicators effectively capture specific ecological aspects, they are inadequate for comprehensively reflecting ecosystem conditions due to their inherent complexity. In 2012, the Chinese government introduced the environmental index (EI) to achieve a comprehensive evaluation of EEQ (Yue and Zhang, 2018). However, its practical application is constrained by limited data accessibility, low update frequency, and poor result visualization. Hazbavi et al. (2020) employed the pressure-state-response (PSR) framework to evaluate ecological conditions by integrating multiple indicators. However, the method involved manual selection of indicators and weight assignments, which weakened the objectivity of the evaluation to some extent. In light of these limitations, a more comprehensive and scientifically grounded system is needed to enable more accurate and timely assessments of EEQ.
Hu and Xu, 2018 proposed the remote sensing ecological index (RSEI) by integrating four key indicators (Hu and Xu, 2018): greenness (NDVI), wetness (WET), dryness (NDBSI), and heat (LST). Principal component analysis (PCA) was used to assign weights and construct a comprehensive evaluation model, enhancing the scientific rigor and objectivity of EEQ. In recent years, scholars have utilized the Google Earth Engine (GEE) platform to calculate RSEI, effectively addressing technical challenges associated with numerous evaluation indicators and complex data processing (Yang X. Y. et al., 2022). This approach enables rapid quantitative assessment of ecosystems using remote sensing imagery and has established RSEI as one of the most widely applied models in ecological evaluation (Kamran and Yamamoto, 2023).
However, given its developmental background and original focus on urban ecosystems, the RSEI faces limitations when applied to complex environments, such as forests, wetlands, deserts, and heavily polluted areas. Variations in ecological structures across these regions can lead to discrepancies between RSEI-based assessments and actual ecological conditions (Wang Z. W. et al., 2023; Zheng et al., 2022). In light of this, researchers have conducted extensive studies on optimizing and improving the RSEI. These efforts focus on replacing and supplementing its component indicators to enhance the model’s adaptability to the geographical characteristics of specific regions. For example, to address pollution in mining areas, the MSEEI model was proposed by incorporating PM2.5 concentration changes (Zhang P. P. et al., 2023). To overcome the NDVI saturation problem in densely forested regions, a three-dimensional greenness-based RSEI model was developed (Liu Y. et al., 2023). The NRSEI model was introduced to reflect human activity intensity in economically developed and densely populated areas (Lu et al., 2025). In addition, the nmRSEI model was designed to more accurately capture surface drought and degradation characteristics in arid regions (Zhang et al., 2024a). These improvements enhance the model’s flexibility and assessment accuracy under diverse environmental conditions by accounting for region-specific geographical features.
EEQ is shaped by both natural and anthropogenic influences, such as climate change, topographic features, and land use. In previous studies, methods such as correlation analysis, regression analysis, and the Geodetector Model (GDM) have been widely used to quantitatively evaluate the driving mechanisms. Among them, the GDM has become an important tool for identifying spatially heterogeneous driving factors due to its independence from strict statistical assumptions, simple parameter settings, and ability to effectively avoid multicollinearity among input variables (Cha et al., 2022). However, the GDM can only assess the explanatory power of influencing factors and cannot determine the direction (positive or negative) of their effects. Therefore, when analyzing the driving mechanisms of EEQ dynamics, it is necessary to combine correlation analysis, partial correlation analysis, and other methods to further clarify the specific relationships between EEQ and its driving factors.
The Inner Mongolia Western Sandy Area (IMWSA), an essential part of China’s northern sand control barrier, comprises four major deserts: Badain Jaran, Tengger, Ulan Buh, and Kubuqi, along with the Mu Us Sandy Land. Desertified land in the region covers approximately 2.75 × 10⁵ km2 (Xie et al., 2023; Wang and Hasi, 2023). The region is characterized by an arid climate, with over 80% of its area having annual precipitation below 150 mm. It is also subject to frequent strong winds due to its position as a key corridor for cold air intrusion from the Mongolian anticyclone (Chen et al., 2022), resulting in poor vegetation stability and an extremely fragile ecological environment (Wang J. J. et al., 2022). As a major corridor for dust storm transmission and a significant source of aeolian sand in northwest China (Gao et al., 2006), this region is a critical and challenging area for desertification control in Inner Mongolia and across China. The EEQ of this region directly affects the ecological security of the Beijing-Tianjin-Hebei region, North China, Northwest China, and the entire country (Li C. Y. et al., 2024). The ecosystem in IMWSA is highly sensitive to environmental changes (Zhang J. et al., 2023). Under ongoing global warming, regional temperature rise in IMWSA significantly exceeds the national average (Piao et al., 2010), intensifying evapotranspiration and regional aridity (Zhao et al., 2024). Since the mid-20th century, unsustainable farming and overgrazing have exacerbated soil salinization, desertification, and soil erosion (Wang et al., 2024). Although ecological engineering projects such as the “Three North” Shelterbelt Forest Program and the Grain-for-Green Program have improved regional EEQ (Zhang Y. Q. et al., 2024), the process of ecosystem restoration still faces considerable challenges. Currently, most EEQ studies on IMWSA rely on single indicators such as NDVI, FVC, and desertification severity (Shi et al., 2023; Zhang H. et al., 2021; Yu et al., 2020). In many of these studies, IMWSA is analyzed as part of the broader Inner Mongolia region. However, Inner Mongolia spans nearly 30° of longitude and exhibits substantial variation in climate, vegetation, soil, and overall ecological conditions. At such a large spatial scale, it is difficult to account for regional details, which limits the ability to perform targeted optimization of models such as RSEI. Other studies have focused on individual deserts or localized areas, but systematic assessments of the entire western sandy region remain scarce (Dong et al., 2024). Due to the combined effects of arid climate, shallow groundwater depth, high groundwater salinity, and intense aeolian activity (Zhao et al., 2017; Zhao et al., 2024), IMWSA has become one of the most severely salinized regions in both Inner Mongolia and China (Feng et al., 2024). This poses serious threats to vegetation growth, agricultural production, ecological stability, and infrastructure development in the region (Yin et al., 2022). Therefore, when evaluating the EEQ of IMWSA, soil salinization must be taken into account to more accurately and comprehensively reflect the spatial distribution and dynamic changes of the local ecological environment.
Based on the above, this study aims to develop an ecological environment evaluation index suitable for IMWSA, comprehensively analyzing the trends and driving factors of local EEQ changes from 2000 to 2024. The specific objectives are as follows: (1) Based on the traditional RSEI, an enhanced remote sensing ecological index (eRSEI) incorporating a salinity index (SI-T) is constructed, to better capture the impact of salinization on the local ecological environment. (2) The spatiotemporal variation of EEQ in the IMWSA is analyzed through Theil-Sen and Mann-Kendall trend tests, the coefficient of variation, and the Hurst exponent. (3) The driving factors influencing the spatial distribution of EEQ changes are identified using the GDM and partial correlation analysis. This study aims to provide a reference for ecological restoration and protection of IMWSA.
2 Materials and methods
2.1 Study area
IMWSA encompasses four leagues/cities: Alashan League, Ordos City, Wuhai City, and Bayannur City (37°21′–42°47′N, 97°10′–111°27′E), covering an area of approximately 4.24 × 10⁵ km2. The elevation ranges from 718 to 3,526 m (Figure 1),and the region features complex terrain, with desertified land accounting for over 60% of the total area. Characterized by a typical temperate continental climate, the region has an average annual temperature ranging from 8.9 °C to 9.8 °C. Annual precipitation ranges from 110.9 mm to 246.8 mm, and decreases gradually from east to west. Annual evaporation ranges from 2,000 mm to 4,000 mm, and increases from east to west. The vegetation is primarily composed of sparse mesophytes and xerophytes (Zhu et al., 2024). Soil types mainly include entisols and aridisols, characterized by loose texture, poor water retention, and high soluble salt content, making them susceptible to wind erosion.
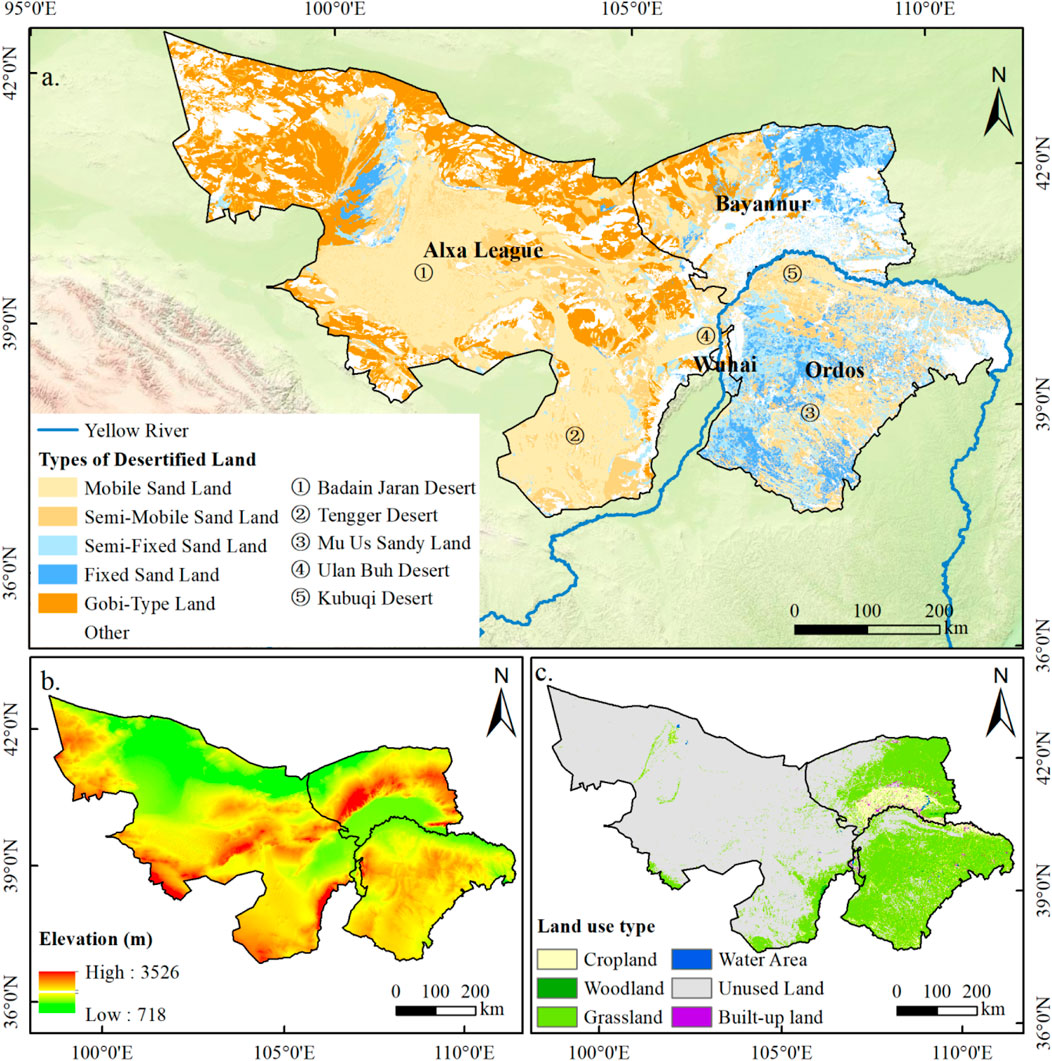
Figure 1. The location of the study area. (a) Distribution of desertified land types, (b) distribution of elevation, (c) distribution of land use/cover in 2010.
2.2 Data sources and processing
MODIS remote sensing imagery (June–August 2000–2024) was obtained from the GEE platform. After cloud removal, regional clipping, and water body masking based on the JRC Global Surface Water History dataset, the (e)RSEI for the study area was generated using mean composite synthesis. Meteorological variables for the same period were obtained from the ERA5-Land reanalysis dataset provided by the European Centre for Medium-Range Weather Forecasts (ECMWF). Soil type and digital elevation model (DEM) data were acquired from the Resource and Environmental Science Data Center, Chinese Academy of Sciences, while the land use data were obtained from the China Land Cover Dataset (CLCD). Spatial distribution data for deserts and sandy lands were collected from the National Tibetan Plateau Data Center. All raster datasets were resampled to a uniform spatial resolution of 500 m and projected to the WGS_1984_UTM_Zone_49N coordinate system. The detailed specifications of the datasets are listed in Table 1.
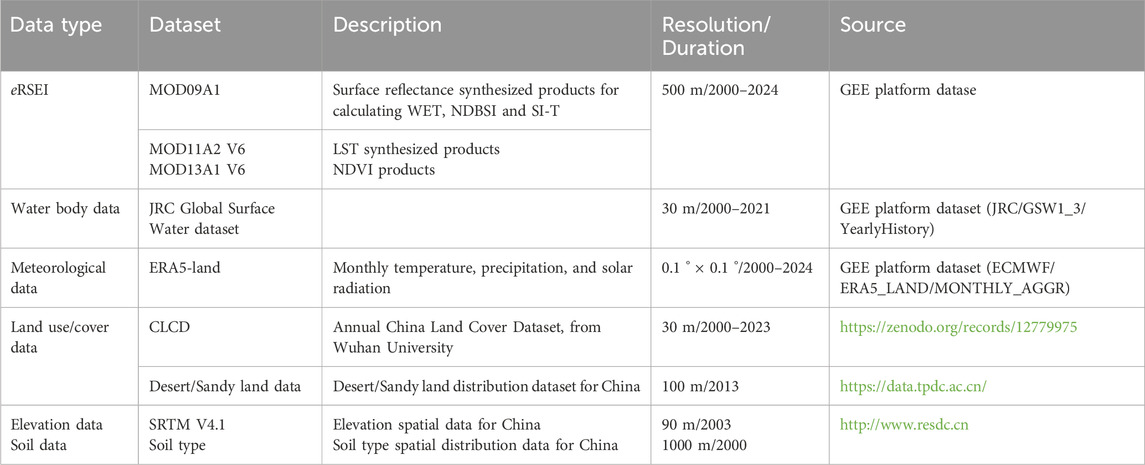
Table 1. Dataset details and sources.
2.3 Methods
This study consisted of the following three main steps: (1) Considering the ecological characteristics of IMWSA, we developed an enhanced eRSEI model based on the classical RSEI by incorporating a salinity index (SI-T), and verified its applicability. (2) By analyzing the spatiotemporal distribution and variation of eRSEI, we investigated the dynamic evolution of EEQ in IMWSA from 2000 to 2024. (3) The driving factors of eRSEI distribution and variation in IMWSA were identified and interpreted using GDM, partial correlation analysis, and the transfer matrix. A detailed overview of the workflow is illustrated in Figure 2.
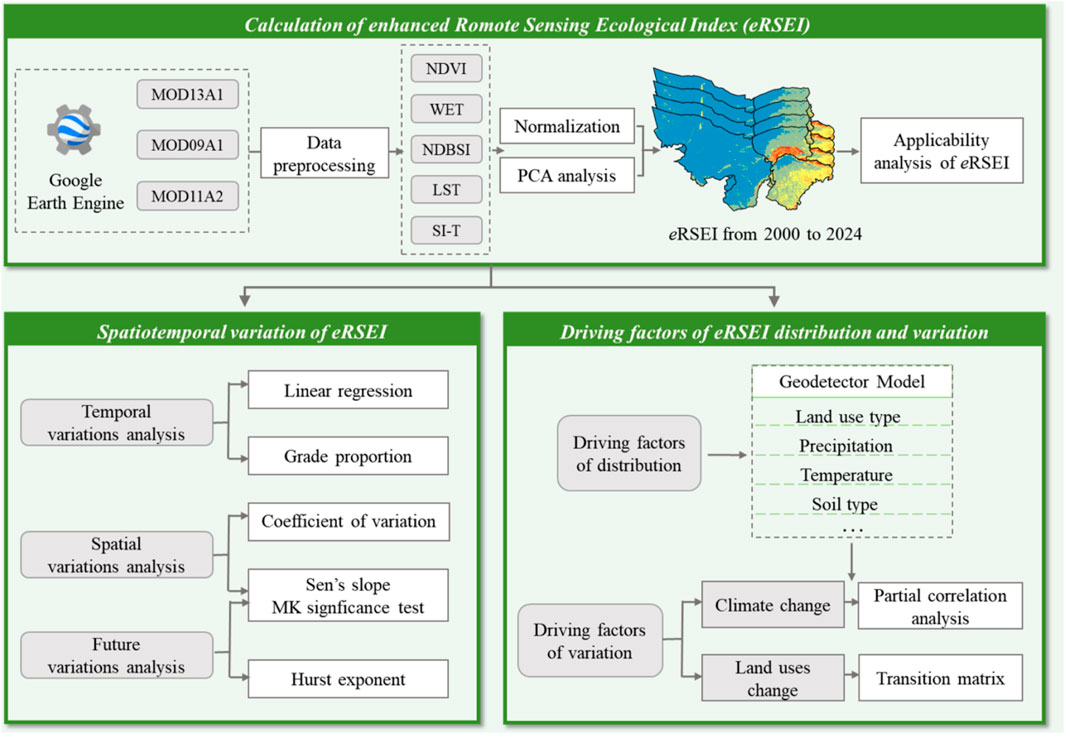
Figure 2. Overview of the framework of this study.
2.3.1 Construction of eRSEI
Soil salinization is a widespread form of land degradation in arid and semi-arid regions (Kumar et al., 2024). This phenomenon not only inhibits vegetation growth and accelerates land degradation, but also undermines desertification control efforts, triggers secondary degradation, and threatens agricultural production and infrastructure. (Yin et al., 2022; Sahbeni et al., 2023). Therefore, the degree of soil salinization should be incorporated as a key indicator in assessing the EEQ of IMWSA. Previous studies have shown that in semi-arid and arid regions, the Salinity Index-Transformed (SI-T) has the highest correlation with soil salt content and is more applicable to sparsely vegetated lands (Allbed et al., 2014; Wang et al., 2019). Therefore, this study incorporates SI-T as a salinity index into the classic RSEI model to more comprehensively characterize the impact of soil salinization on EEQ and enhance the sensitivity of RSEI to ecological changes in the study area. Table 2 outlines the equations for computing the various indicators (Ye et al., 2025; Zhang et al., 2024c).
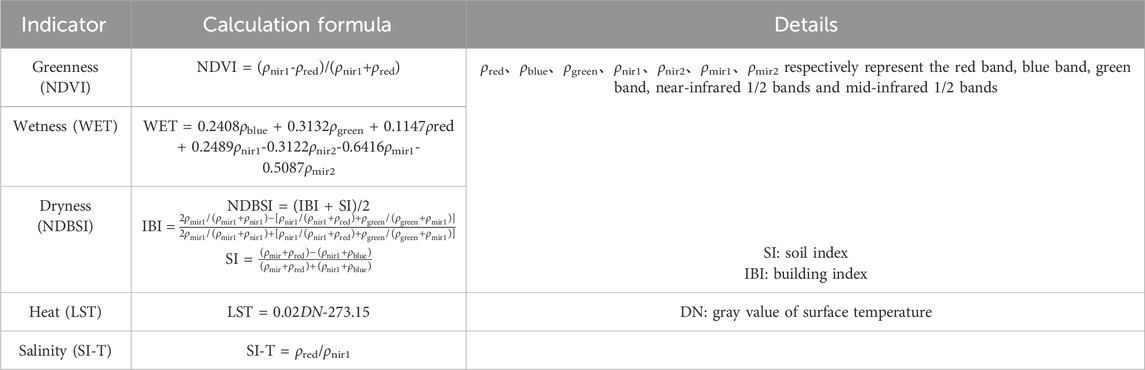
Table 2. Formulas for calculating component indicators.
The functional expression of the constructed eRSEI is given as Equation 1:
Prior to index integration and PCA, normalization was performed to eliminate dimensional differences and to avoid weight imbalance among principal components caused by differing indicator units. The specific formula is given in Equation 2 (Zhang et al., 2022):
where, NIi is the normalized value of the i th indicator, Ii is the original value of pixel i, and Imax and Imin are the maximum and minimum values of the indicator in the study area, respectively.
Based on the PCA, the five indicators mentioned above were integrated, and the calculation method for eRSEI was determined based on the sign of the factor loadings of the first principal component (PC1), as shown in Equation 3.
where, eRSEI0 represents the initial eRSEI value, PC1 denotes the first principal component, and VNDVI and VWET correspond to the eigenvector values of NDVI and WET in PC1, respectively. To facilitate interannual comparisons, eRSEI values were normalized to the [0, 1] range, values near one suggest favorable EEQ, whereas values near 0 point to poorer conditions. Following previous studies (Xu et al., 2018), the normalized eRSEI was classified into five levels: (0.0–0.2], (0.2–0.4], (0.4–0.6], (0.6–0.8], and (0.8–1.0], corresponding to poor, fair, moderate, good, and excellent EEQ, respectively.
2.3.2 Trend analysis methods
A combination of Theil-Sen Median and Mann-Kendall test methods was adopted to quantitatively analyze the spatiotemporal variation trends of eRSEI in IMWSA. The Sen slope estimation method characterizes the intensity of change trends by calculating the median slope of time series data, with its mathematical expression being shown in Equation 4 (Liu et al., 2025):
where f represents the observed values of the eRSEI time series, and median is the median statistical measure. When β > 0, it characterizes an upward trend in eRSEI, while negative values indicate a downward trend.
The Mann-Kendall non-parametric test method was used for significance testing, implemented through the standardized test statistic Z: when |Z| ≤Z1-α/2, the null hypothesis is accepted, when |Z|>Z1-α/2, the null hypothesis is rejected. This study sets the significance level at α = 0.05, corresponding to the two-sided test critical value Z = ±1.96. On this basis, the variation trend of eRSEI can be classified into five categories: significant increase, non-significant increase, no obvious change, non-significant decrease, and significant decrease. (Haas et al., 2025; Xu et al., 2025).
2.3.3 Variation analysis methods
The coefficient of variation (
where
2.3.4 Persistence analysis methods
The Hurst exponent (H) was calculated based on the rescaled range method (R/S method), which is widely applied in predicting long-term trends in meteorology, hydrology, and ecological systems (Li et al., 2025; Bashir et al., 2020; Wang J. Y. et al., 2025). According to the range of H values, the persistence characteristics of the time series evolution trend could be determined: when 0.5 < H < 1, the future change trend of the time series is in the same direction as the historical phase, showing persistent characteristics; when H = 0.5, there is no long-term correlation between sequence values, and the future trend contains uncertainty; when 0 < H < 0.5, the sequence shows anti-persistent characteristics, and the future evolution direction is opposite to the historical trend. On this basis, combined with the Sen trend analysis, the future change trends of eRSEI could be divided into five categories: continued increase (β > 0.0005, H > 0.5), reversed to increase (β < -0.0005, H < 0.5), relatively stable (|β|<0.0005), reversed to decrease (β > 0.0005, H < 0.5), and continued decrease (β < -0.0005, H > 0.5).
2.3.5 GDM with optimal parameters
The GDM, utilizing optimal parameters suggested by Song et al. (2020), was employed to systematically examine the driving mechanism of IMWSA eRSEI through three modules: factor detection, interaction detection, and risk detection. (1) Factor detection: Factor detection is the core component of GDM, used to determine the degree to which driving factors explain the spatial differentiation of the dependent variable, represented by the q statistic, with a numerical range of [0,1]. A higher q value indicates a greater explanatory power of that driving factor for eRSEI. (2) Interaction detection: By calculating the interaction parameter q between two factors, the explanatory power of their combined influence on the spatial distribution of eRSEI can be assessed, revealing both the type and strength of their interaction (Table 4). (3) Risk detection: This module identifies whether significant differences exist in the mean values of eRSEI across different categories defined by driving factors. It helps determine the specific value ranges or classes most associated with high EEQ levels, thereby revealing optimal ecological conditions (Wang R. B. et al., 2025).
2.3.6 Partial correlation analysis method
Partial correlation analysis enables a systematic examination of the direction and strength of the relationships between the target variable and multiple driving factors. Building on the results of GDM, it further reveals the promoting or suppressing effects of meteorological changes on eRSEI. The formula for calculating the g-order partial correlation coefficient is given in Equation 6 (Wan et al., 2023):
where
3 Results
3.1 Applicability analysis of eRSEI
Based on the IMWSA time series data from 2000 to 2024, eRSEI and RSEI models were established respectively, and principal component analysis was conducted. As shown in Table 3, the PC1 contribution rate of eRSEI ranged from 65.96% to 80.78%, with an average value of 76.30% and a range of 14.82%. For RSEI, the PC1 contribution rate ranged from 65.07% to 80.23%, with an average of 75.47% and a range of 15.16%. Throughout the study period, eRSEI consistently exhibited a higher PC1 contribution rate than RSEI, indicating a stronger capacity for information integration in representing regional EEQ. Further analysis of the PC1 eigenvalues showed that those of eRSEI ranged from 0.028 to 0.055, with an average of 0.045, while those of RSEI ranged from 0.026 to 0.052, with an average of 0.041. In all years, the eigenvalues of eRSEI were higher than those of RSEI, indicating that the eRSEI feature vectors contained more information and were more effective in synthesizing the characteristics of multiple indicators.
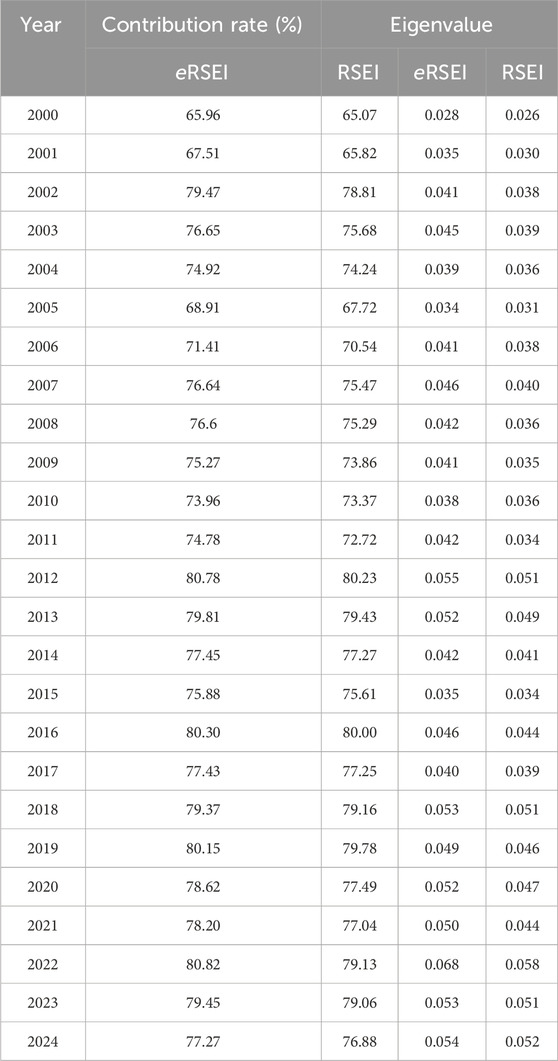
Table 3. Comparison of PCA results between eRSEI and RSEI.
The results of the analysis of PC1 loadings for eRSEI are presented in Table 4. In PC1, the loadings of NDVI and WET remained consistently positive, suggesting their positive effect on EEQ, whereas the loadings of NDBSI, LST, and SI-T remained consistently negative, indicating a suppressive impact on EEQ. This pattern aligns with the observed ecological conditions. Across the study area, the combined absolute loadings of NDBSI, LST, and SI-T—representing ecological degradation pressures—consistently exceeded those of NDVI and WET, which reflect ecological resilience. This indicates that, in IMWSA, the inhibitory effects of surface desiccation, thermal stress, and salinization substantially outweigh the positive regulatory influences of vegetation and available moisture.
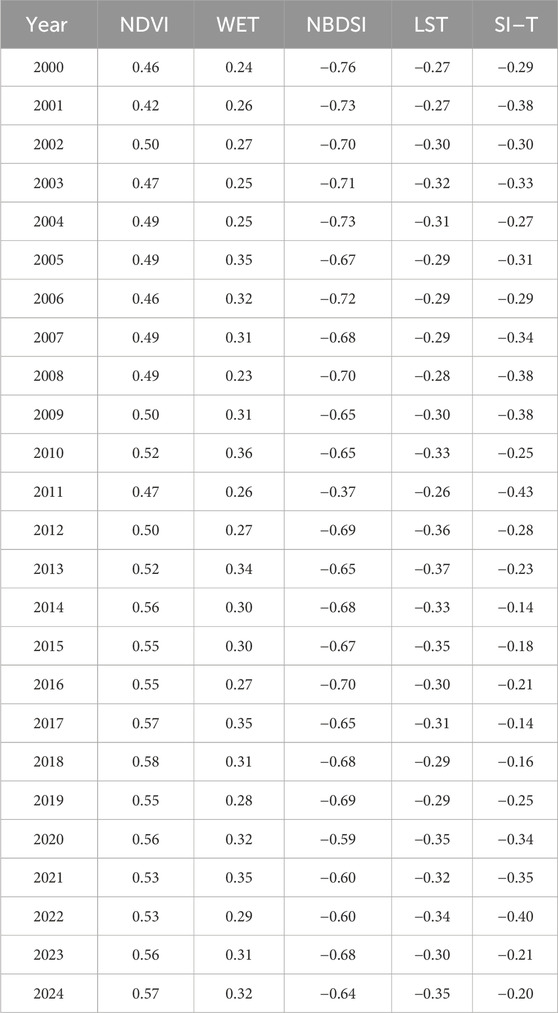
Table 4. Loading values of PC1 of eRSEI Model from 2000 to 2024.
3.2 Spatiotemporal dynamics of eRSEI
3.2.1 Temporal variation of eRSEI and its component indicators
The temporal variation characteristics of each component indicator and the eRSEI in IMWSA are shown in Figure 3 From 2000 to 2024, NDVI exhibited an highly significant upward trend (P < 0.01), with an increase rate of approximately 0.020/10a. WET exhibited a non-significant upward trend at a rate of 0.010/10a (P > 0.05). Both NDBSI and SI-T displayed significant decreasing trends (P < 0.05), with rates of −0.020/10a and −0.070/10a, respectively. No significant trend was observed for LST. Under the combined influence of these indicators, eRSEI showed an overall increasing trend, with a rate of approximately 0.006/10a (P > 0.05). The temporal pattern could be divided into two phases: a decreasing trend from 2000 to 2010 at a rate of −0.005/10a (P > 0.05), followed by an increasing trend after 2010 at a rate of 0.009/10a (P > 0.05). Although the overall trend was not statistically significant, the three highest values in the time series all occurred after 2015, with a maximum of 0.236 recorded in 2018, suggesting an overall improvement in recent years.
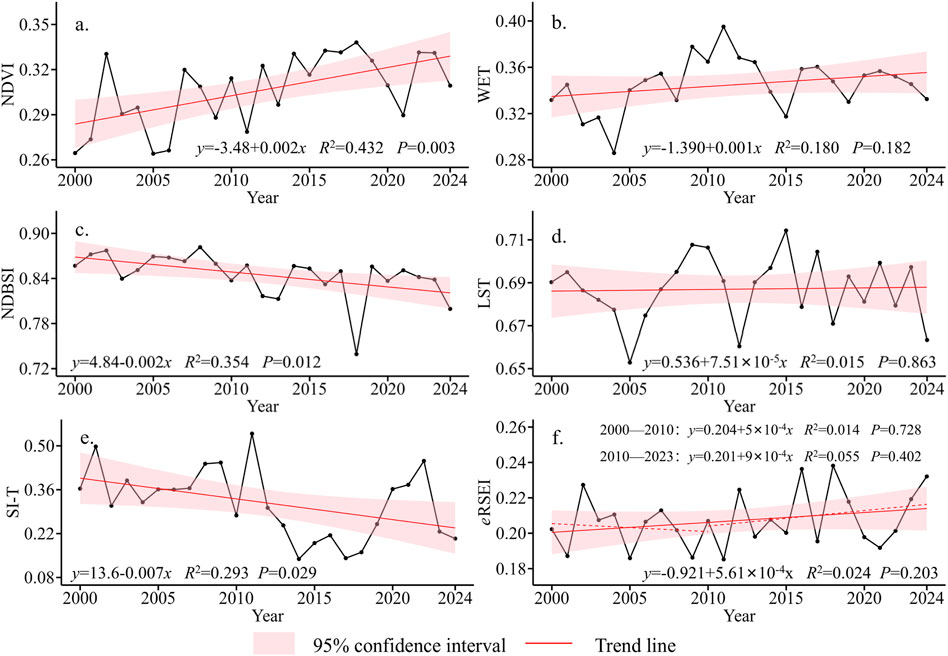
Figure 3. Temporal variation of component indicators and eRSEI in IMWSA from 2000 to 2024 (a) NDVI, (b) WET, (c) NDBSI, (d) LST, (e) SI-T, (f) eRSEI.
3.2.2 Spatial variation of eRSEI
To characterize the spatial distribution of eRSEI in IMWSA across different time periods, eRSEI images from 2000, 2005, 2010, 2015, 2020, and 2024 were selected and classified into five grades: poor, fair, moderate, good, and excellent (Figure 4). A clear spatial pattern emerged during the study period, as eRSEI values were generally higher in the east and declined toward the west. The poor-grade dominated most of the region, whereas good and excellent grades together accounted for less than 4% of the total area. Spatially, poor-grade areas were primarily distributed in Alxa, northern Bayannur, and the Kubuqi Desert in northern Ordos. Fair-grade areas were mainly found in central and eastern Bayannur, Wuhai, and around the Mu Us Desert in southern Ordos. The loess hilly region in eastern Ordos largely fell into the moderate grade. Good and excellent grades were concentrated in the Hetao Plain in southern Bayannur and in farmland and dense forest-grassland areas along the Yellow River in northern Ordos. Temporally, from 2000 to 2010, poor-grade areas expanded significantly, particularly in the Badain Jaran Desert and western Bayannur. Between 2010 and 2015, these areas slightly contracted. After 2020, regional divergence became more apparent: poor-grade areas increased in the Badain Jaran Desert but continued to decline in western Bayannur. Between 2020 and 2024, excellent-grade areas expanded markedly in the Hetao Plain. Meanwhile, the EEQ grade structure of the Mu Us Desert gradually shifted from a dominance of fair grades to a more balanced distribution of fair and moderate grades.
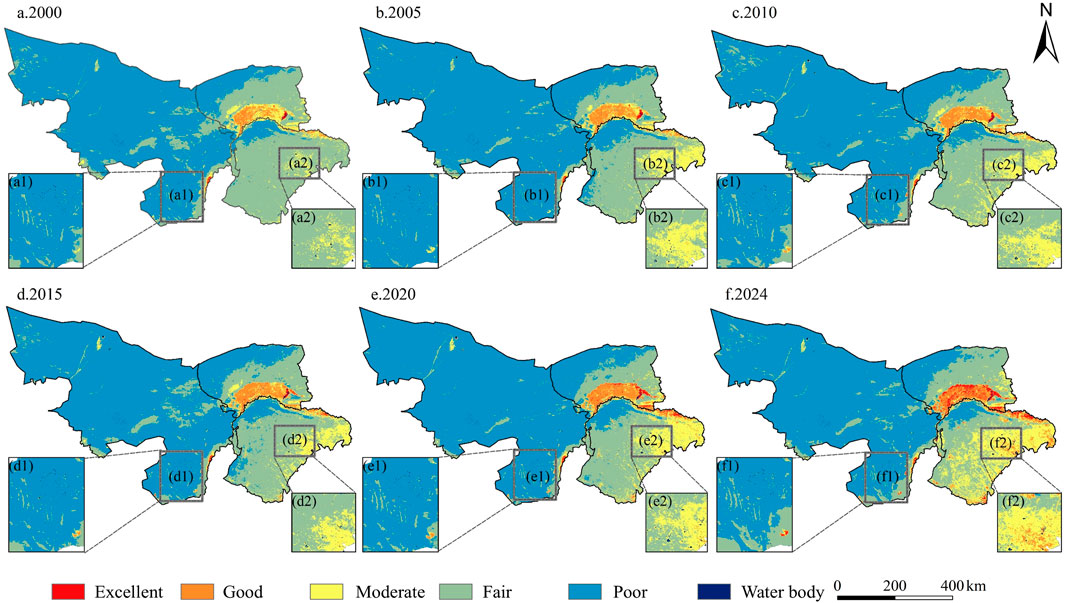
Figure 4. Spatial distribution of eRSEI in IMWSA from 2000 to 2024. (a) 2000, (b) 2005, (c) 2010, (d) 2015, (e) 2020, (f) 2024.
As shown in Figure 5, the statistical analysis of eRSEI grades from 2000 to 2024 indicates that the study area has been predominantly characterized by poor and fair grades, which together accounted for 81%–95% of the total area. Among these, the proportion of poor-grade areas remained relatively stable at approximately 63%. Fair-grade areas showed a marked decline, decreasing from 33% in 2000 to 23% in 2024, with a highly significant downward trend (P < 0.01). The proportion of moderate-grade areas fluctuated between 3% and 14%, displaying more variability than other grades, though they remained around 10% over the past 3 years. Good-grade areas exhibited the most pronounced expansion (P < 0.01), with a 2.5-fold increase in 2024 compared to 2000. Excellent-grade areas consistently represented the smallest proportion among all grades, remaining below 0.1% in more than half of the years. However, after 2018, a noticeable increase was observed, reaching 1.1% by 2024. Overall, the EEQ structure of the region exhibited a transitional pattern, characterized by a reduction in low-grade areas and expansion of moderate to high-grade areas, indicating a general improvement in EEQ of IMWSA.
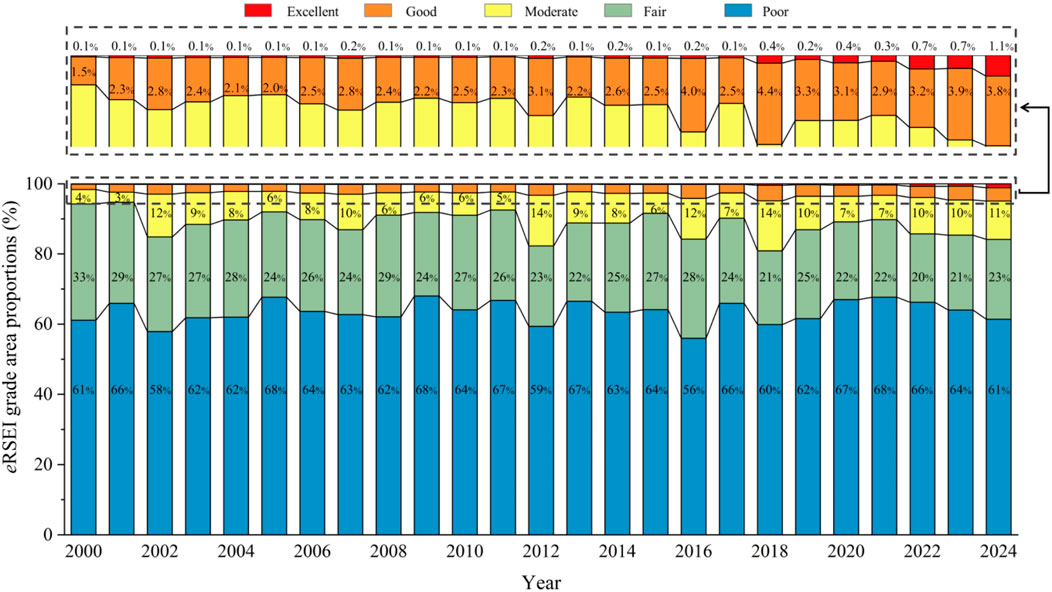
Figure 5. Trends in the spatial distribution of eRSEI grades in IMWSA from 2000 to 2024.
3.2.3 Trend variation of eRSEI
Pixel-level spatial changes of eRSEI in the IMWSA from 2000 to 2024 are shown in Figure 6a1a2. The results indicated that eRSEI values increased in approximately 33.67% of the total area, with 9.52% showing statistically significant increase (P < 0.05). Decreasing eRSEI values were observed in 39.96% of the region, though only 1.69% exhibited a significant decrease (P < 0.05), while the remaining areas displayed no obvious change. Spatially, increases in eRSEI were primarily observed in most areas of Ordos, northern Bayannur, and the Ejina River Basin in central Alxa. Decreases were mainly concentrated in western and southern Alxa, as well as parts of northern Bayannur, with smaller patches also occurring in eastern Ordos. The major desert and sandy systems within the region exhibited differentiated evolutionary patterns. The most pronounced increase in eRSEI values was observed in the Mu Us Sandy Land, while the southern Tengger Desert and eastern Kubuqi Desert also exhibited upward trends. Meanwhile, eRSEI values generally decreased in the continuous sandy areas including the Badain Jaran Desert, Ulan Buh Desert, northern Tengger Desert, and western Kubuqi Desert, suggesting these regions have continued to undergo EEQ deterioration.
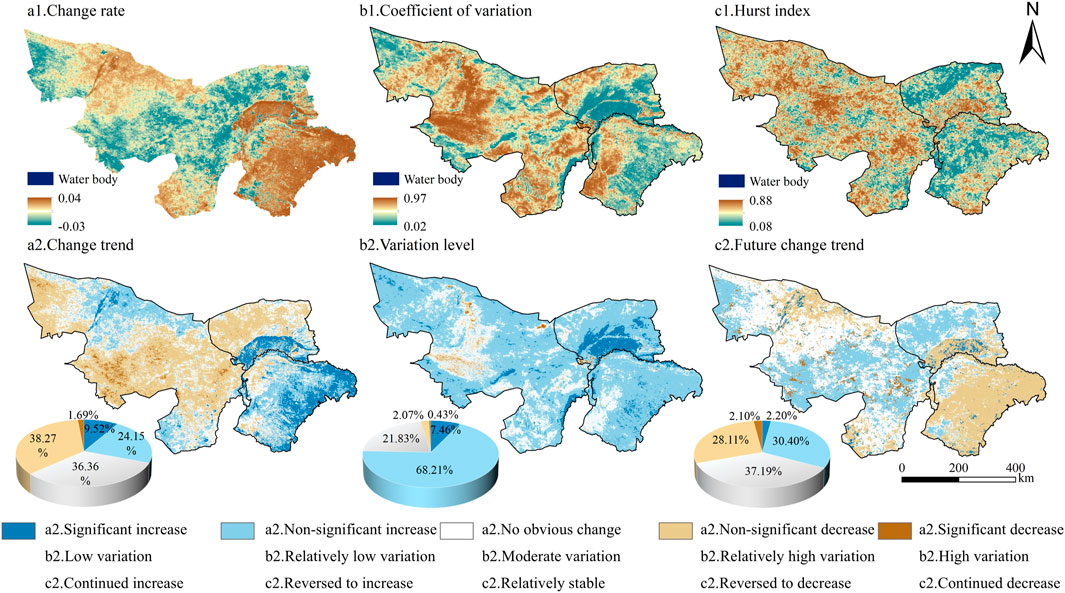
Figure 6. Trend variation of eRSEI in IMWSA from 2000 to 2024. a1. Change rate, a2. Change trend, b1. Coefficient of variation, b2. Variation level, c1. Hurst index, c2. Future change trend.
The coefficient of variation of eRSEI in the study area ranged from 0.02 to 0.97, with a mean value of 0.17 (Figure 6b1b2). Low variation was observed in 7.46% of the area, primarily concentrated in the Hetao Plain. Relatively low variation was identified in 68.21% of the area, exhibiting a continuous spatial distribution across the entire region. Moderate variation was present in 21.83% of the area, mainly distributed across most of Alxa, extending into northern Bayannur and western Ordos. Relatively strong and strong variations were found in only 2.50% of the area, primarily concentrated in the Badain Jaran Desert and its surrounding regions.
The average H value of the study area was 0.38 (Figure 6c1c2), indicating an overall anti-persistence characteristic. In conjunction with Figure 6a1, areas projected to experience an increase in eRSEI accounted for 32.60% of the total area, with 2.20% classified as areas of continued increase, scattered across the Hetao Plain and Ejina River Basin, and 30.40% were identified as reversed to increase areas, mainly concentrated in the central part of the study area, suggesting ecological restoration potential in these regions. Areas projected to experience a future decrease in eRSEI accounted for 30.21%, with 2.1% classified as areas of continued decrease, sporadically distributed across the Tengger Desert, Ulan Buh Desert, and surrounding regions, and 28.11% were identified as reversed to decrease areas, mainly covering most of Ordos, the northern Hetao Plain in Bayannur, and the Ejina Basin in Alxa, which are currently high-value zones requiring targeted prevention and management efforts to mitigate ecological deterioration risks.
3.3 Driving factors of eRSEI distribution and variation
3.3.1 Driving factors of eRSEI distribution
The spatial differentiation of eRSEI in the IMWSA from 2000 to 2024 was analyzed using GDM. As shown in Figure 7, the factor detection results indicated that, at a 1% significance level (P < 0.01), all selected driving factors significantly explained the spatial heterogeneity of EEQ in the study area. The factors’ explanatory power (q-values), listed in descending order, were as follows: land use type (0.734) > precipitation (0.534) > temperature (0.405) > soil type (0.295) > solar radiation (0.051) > elevation (0.041). Among these, land use type exhibited the highest q-value and was identified as the primary driving factor influencing eRSEI in the IMWSA. Precipitation and temperature also showed significant effects. Although solar radiation and elevation had relatively low q-values, their explanatory power was substantially enhanced through interaction with other factors.
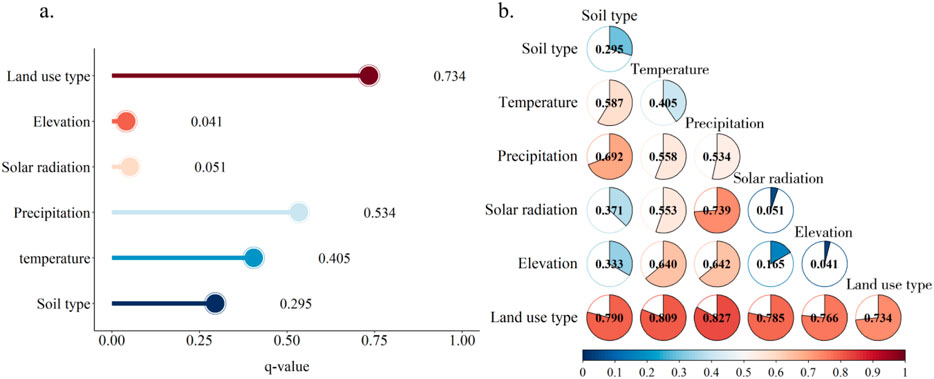
Figure 7. Results of q-values and interaction detection for each driving factor in IMWSA. (a) The q-values of driving factors influencing eRSEI’s spatial pattern, (b) Results of interaction detection among driving factors affecting the spatial distribution of eRSEI.
The interaction detection results indicated that the combined influence of any two factors exceeded that of each individual factor, exhibiting both bivariate enhancement and nonlinear enhancement effects. The highest interaction explanatory power was observed between land use type and precipitation (q = 0.827), suggesting that the synergistic effect of human activities, represented by land use, and climatic factors could significantly improve the explanatory power of eRSEI. In addition, the interaction q-values between land use type and soil type, temperature, solar radiation, and elevation, as well as between solar radiation and precipitation, all exceeded 0.730. This highlighted the important role of multi-factor coupling in shaping the spatial distribution of eRSEI.
Based on the risk detection module, the optimal ranges or categories of each driving factor in relation to eRSEI were analyzed. The results indicated a positive correlation between eRSEI and precipitation within the study area, with eRSEI increasing as precipitation rises. The highest eRSEI values were observed when summer precipitation ranged from 249 to 307 mm. Elevated eRSEI levels were sustained when summer temperatures averaged 16.4 °C–22.5 °C, accompanied by solar radiation ranging from 1,570 to 1640 MJ m-2. The highest eRSEI values occurred at elevations between 1,600 and 3,300 m. Among different soil types, semi-hydromorphic soils corresponded to the highest eRSEI values. Regarding land use types, woodland exhibited significantly higher eRSEI values than unused land and grassland, highlighting the positive impact of vegetation cover on ecological quality.
3.3.2 Response of eRSEI to climate change
Partial correlation analysis (Figure 8) revealed that eRSEI in IMWSA was generally positively correlated with temperature, precipitation, and solar radiation, with mean partial correlation coefficients of 0.02, 0.26, and 0.03, respectively. Among these, precipitation exhibited the strongest correlation with eRSEI. Areas showing a positive correlation between eRSEI and temperature accounted for 53.78% of the region, primarily distributed in the northwestern and southeastern parts of the study area. Areas with significant and highly significant positive correlations accounted for 2.62%, mainly concentrated in the Hetao Plain, with scattered patches in the central Mu Us Sandy Land and the northern edge of Alxa. In contrast, negative correlation with temperature was found in 46.22% of the region, among which 1.37% showed significant or highly significant negative correlation, primarily distributed in the Badain Jaran Desert and Tengger Desert. Partial correlation between eRSEI and precipitation showed a general east-west gradient. Over 88% of the study area showed positive correlation with precipitation, including 14.96% with significant and 9.41% with highly significant positive correlation, mainly distributed in southern Bayannur, the Mu Us Sandy Land, and the Tengger Desert. Regions showing a negative correlation with precipitation were primarily located around the Badain Jaran Desert; however, less than 0.1% exhibited statistical significance. Regarding solar radiation, positive and negative correlation with eRSEI were observed in 55.34% and 44.66% of the study area, respectively. Areas with significant and highly significant positive correlations were scattered in the central part of the study area, accounting for approximately 2.64%. Conversely, areas with significant and highly significant negative correlations were mainly concentrated around the Ejina River Basin, accounting for about 1.24%.
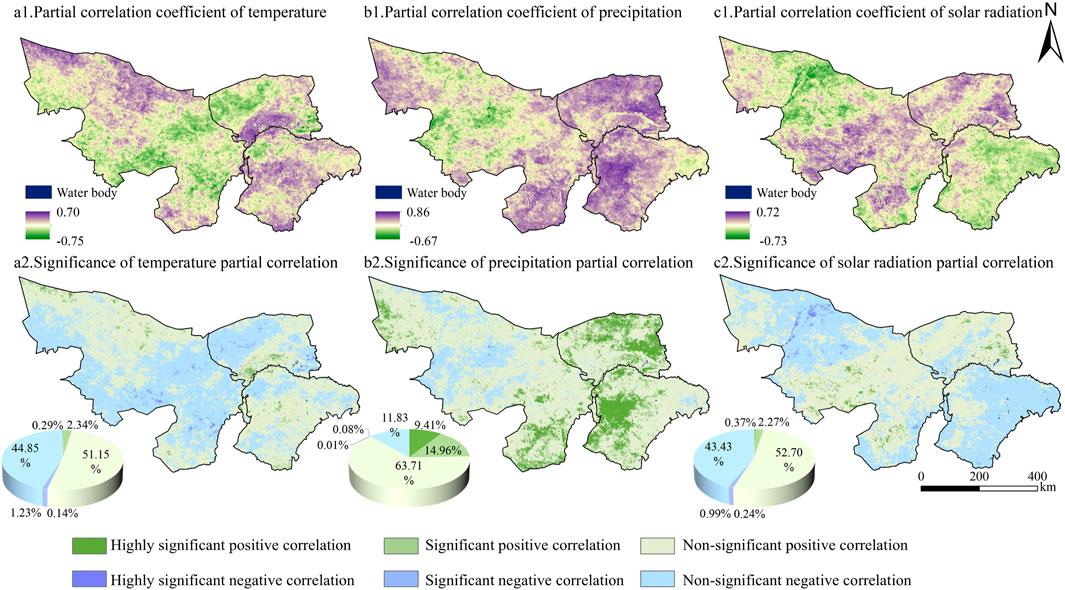
Figure 8. Partial correlations results between eRSEI and meteorological factors in IMWSA, with statistical significance testing. a1. Partial correlation coefficient of temperature, a2. Significance of temperature partial correlation, b1. Partial correlation coefficient of precipitation, b2. Significance of precipitation partial correlation, c1. Partial correlation coefficient of solar radiation, c2. Significance of solar radiation partial correlation.
According to the absolute values of the partial correlation coefficients (Figure 9), precipitation is identified as the most critical factor influencing eRSEI variation in IMWSA, dominating changes in 58.07% of the area. Temperature ranked second, with a dominant influence on 22.42% of the region, while solar radiation contributed the least, primarily affecting 19.51% of the area. From a spatial perspective, precipitation exerted a predominantly positive influence on eRSEI variation across most of the study area. However, in regions with severe desertification and extremely low vegetation cover, short–term heavy rainfall can induce soil erosion, leading to potential negative ecological impacts. Areas dominated by temperature and solar radiation were mainly concentrated in central Alxa, whereas in agricultural zones such as the Hetao Plain, where soil moisture conditions are regulated by human activities, EEQ was more sensitive to changes in temperature.
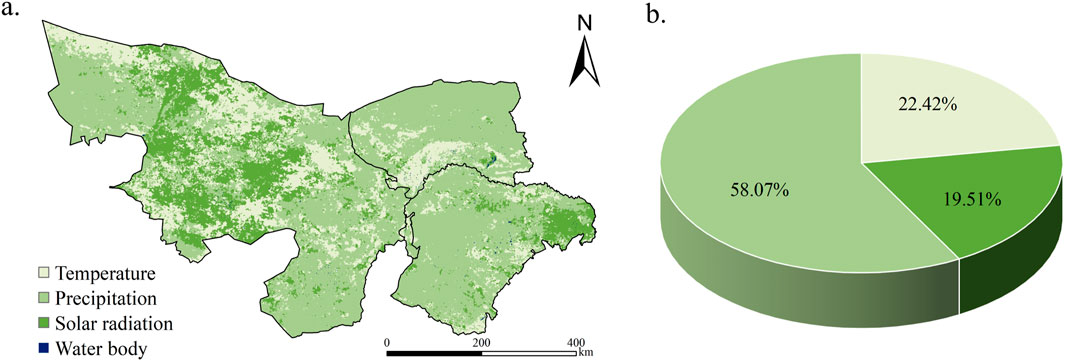
Figure 9. Distribution and proportion of dominant meteorological factors influencing eRSEI variation in IMWSA. (a) Distribution of dominant meteorological factors, (b) Proportion of dominant meteorological factors.
3.3.3 Response of eRSEI to land use changes
Land use change serves as a direct reflection of both the direction and intensity of human activities in modifying the natural environment. As shown in Table 5, land use changes in IMWSA from 2000 to 2023 accounted for 9.54% of the total area. The proportions of grassland converted into other land types and converted from other land types were nearly balanced, both around 4.55%. Cropland experienced a 0.96% area loss but gained 1.93% through conversion, leading to a net increase of about 0.97%. Unused land decreased, as 3.97% was converted to other uses while only 2.63% was gained through conversion. Although the areas of woodland and built-up land showed an overall increasing trend, their spatial proportions remained relatively low within the study area.
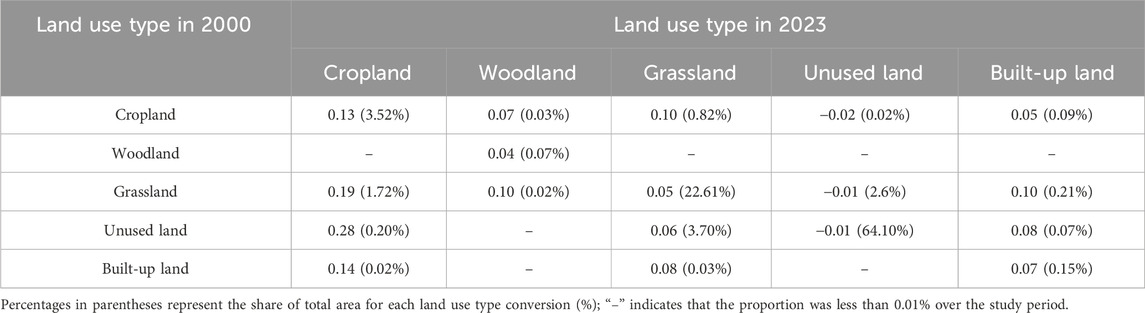
Table 5. Effects of land use change on eRSEI variations in IMWSA.
In terms of the impact of land use type conversion on EEQ, most land transitions had a positive effect on eRSEI, except for the conversion of cropland and grassland into unused land, which led to a decline in eRSEI. Specifically, the conversion from unused land to cropland resulted in the most significant improvement in eRSEI, with an increase of 0.28. The conversions from grassland to cropland (0.19) and from built-up land to cropland (0.14) also notably enhanced eRSEI. During the study period, the average eRSEI in areas undergoing land use change increased by 0.09, while that in stable land use areas rose by only 0.02. This difference confirms that land use transformation played a promotive role in enhancing regional EEQ.
4 Discussion
4.1 Spatial distribution and spatiotemporal variation of eRSEI
This study’s findings indicate that eRSEI in the study area has generally increased from 2000 to 2024, reflecting an overall improvement in EEQ. This outcome is consistent with previous regional studies (Li S. W. et al., 2024; Zhang L. Y. et al., 2025). Between 2000 and 2010, NDVI and WET values showed significant increases, while NDBSI and SI-T declined. These changes positively influenced eRSEI. However, the rapid increase in LST during this period imposed thermal stress that outweighed the positive effects of other indicators, leading to a temporary decline in eRSEI. After 2010, the continued increase in NDVI, together with the further reduction in NDBSI and SI-T, significantly enhanced the positive ecological effects. These combined improvements effectively offset local negative impacts from declining WET, thereby propelling the ecological environment into a stage of accelerated improvement. These findings also demonstrated that the variations in a single indicator may not fully reflect the true condition of the ecological system. Thus, integrated analysis of multiple indicators is essential to capture the complex, coupled dynamics of the ecological environment.
A clear east-west gradient was observed in eRSEI values, with the 200 mm precipitation line acting as a defining ecological boundary. High-value zones were primarily concentrated along the Yellow River, benefiting from relatively sufficient precipitation and artificial irrigation (Li C. Y. et al., 2024), these zones formed major clusters of croplands and woodlands. In contrast, the western part of the region was dominated by desert landscapes, where arid climatic conditions contributed to more fragile ecosystems (Xie et al., 2023; Li M. Y. et al., 2024). Between 2000 and 2024, the spatial pattern of eRSEI change in IMWSA showed a slightly greater extent of decline than improvement; however, the proportion of areas exhibiting significant positive correlation was markedly higher than those with significant negative correlation. A notable EEQ improvement was observed in the Mu Us Sandy Land, with concurrent positive trends in the southern Tengger Desert and eastern Kubuqi Desert. It is worth noting that these regions exhibited H values below 0.5, suggesting anti-persistent characteristics. Given the concentration of human activities in these areas (Ah et al., 2022), including intensive mining and industrial development (Zhang et al., 2022), compounded by afforestation-related land degradation and grassland deterioration (Zhao et al., 2023; Li et al., 2023; Zhang Z. P. et al., 2025), as well as an increasing frequency of extreme weather events (Tong et al., 2019), there remains a substantial risk of EEQ degradation in the future.
4.2 Driving factors of eRSEI
This study employed both the GDM and partial correlation analysis to evaluate the driving factors of eRSEI distribution and variation in IMWSA. The results showed that land use patterns and meteorological factors were the primary determinants of EEQ in the region. Among the meteorological variables, eRSEI was generally positively correlated with temperature, precipitation, and solar radiation, with precipitation playing the dominant role. This finding aligns with the conclusions of Higgins et al. (2023) regarding moisture-limitation mechanisms in arid regions. Approximately half of the study area was characterized by annual precipitation below 100 mm, making water scarcity the principal constraint on vegetation growth and ecosystem stability. Increased precipitation alleviates plant water stress and, in turn, contributes positively to ecological quality. While temperature and solar radiation also had positive effects on eRSEI overall, their spatial influence and statistical significance were much weaker than those of precipitation (Figure 7). Although increases in temperature and solar radiation generally enhance photosynthesis and promote vegetation growth, these effects can become detrimental under severe water scarcity. In such areas, elevated thermal and radiative inputs intensify surface heating and accelerate evapotranspiration, thereby exacerbating soil dryness and negatively affecting all ecological components of eRSEI (Bai et al., 2020; Shao et al., 2024). According to Figure 10, over the past 25 years, the summer climate in IMWSA has been characterized by rising temperature, along with decreasing precipitation and solar radiation, consistent with the findings of Rao et al. (2024) and Fang et al. (2021). Partial correlation analysis further indicated that these climatic changes could exert negative effects on regional eRSEI, particularly when increasing temperatures are coupled with declining precipitation, a pattern that intensifies regional aridification. Notably, since 2015, precipitation variability has increased. In vegetation-scarce arid areas, increased climate extremes undermine ecosystem resilience: drought limits survival, and heavy rains strip topsoil and damage roots, subtly driving desertification forward (Liu J. et al., 2023).
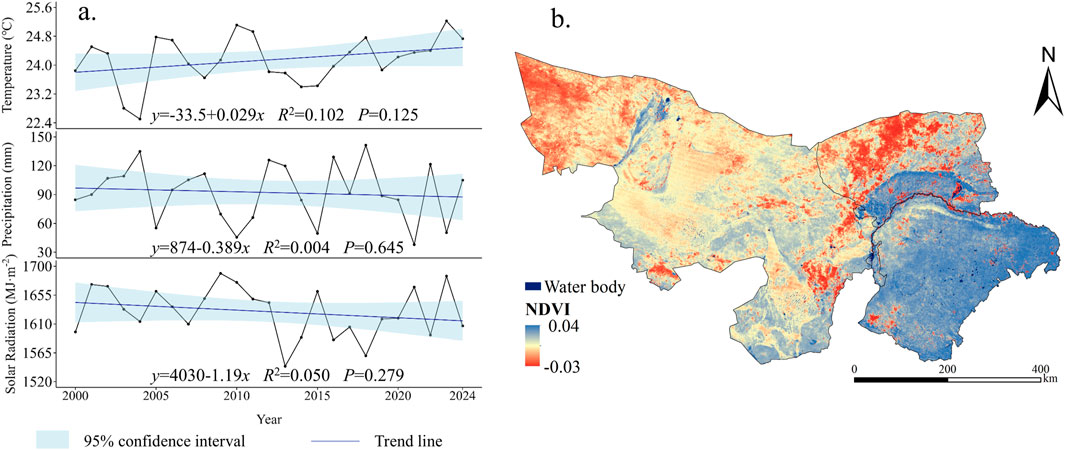
Figure 10. Variation in the driving factors of eRSEI in IMWSA from 2000 to 2024. (a) Variation in meteorological factors, (b) Variation in NDVI values.
Land use change was a major driver of eRSEI evolution. As a critical component of China’s northern ecological security barrier, IMWSA fulfills a dual strategic role, serving both as the core zone of the Northern Sand Prevention Belt and as a key area for ecological protection and high-quality development in the Yellow River Basin. Since the implementation of large-scale ecological restoration programs, including the Three-North Shelterbelt Program (initiated in 1978) and the Grain-for-Green Program (Li et al., 2021; Lin et al., 2024; Qin et al., 2024), forest coverage in the study area has steadily increased, while the extent of unused land has gradually declined. Overall vegetation conditions have improved, with the NDVI increasing at a rate of 0.0188/10a (Figure 3A). However, NDVI trends exhibited marked spatial heterogeneity. As illustrated in Figure 9B, surface vegetation cover in the Kubuqi Desert and Mu Us Sandy Land within Ordos City has significantly improved (Zhang Y. et al., 2025; Chen et al., 2022), with spatial patterns largely corresponding to areas of increasing eRSEI. In the Hetao Plain, NDVI has shown a clear upward trend driven by the synergistic effects of forest expansion, cropland development, and advancements in agricultural technology. In contrast, the central part of the study area, which has been affected by intensive human disturbances such as excessive cultivation, overgrazing, and mineral resource exploitation, has experienced vegetation degradation. Under the pressure of climate change, forest and grassland systems in the region have deteriorated, making it a representative area of concurrent declines in both vegetation cover and eRSEI.
In summary, climate change over the past 25 years has generally exerted a suppressive effect on EEQ in IMWSA. In ecologically fragile arid regions, the warming and drying trend has intensified water stress, leading to localized vegetation degradation and soil desiccation, thereby highlighting the potential threat of climate change to arid-zone ecosystems. In contrast, land use changes driven by human activities have played a pivotal role in improving EEQ. Large-scale ecological restoration projects, by optimizing land cover patterns and improving regional microclimates (Zheng et al., 2020), have become core factors in promoting EEQ enhancement. Notably, semi-arid to arid regions in northwestern China—such as Xinjiang, Gansu, and Qinghai—have experienced substantial EEQ enhancement under similar restoration initiatives (Wang S. N. et al., 2022; Duo et al., 2023; Kang et al., 2025). For instance, in Xinjiang, only 3.55% of the land area showed EEQ degradation between 2000 and 2020, a rate significantly lower than that observed in the IMWSA. Moreover, areas of improvement have expanded considerably into desert—oasis transition zones and even deeper into desert interiors. This regional disparity is closely linked to climate dynamics. Unlike the IMWSA, much of northwestern China has undergone a warming and moistening trend, with increasing precipitation markedly improving soil moisture and supporting vegetation recovery. Concurrently, accelerated glacier melt has generated abundant runoff, providing vital ecological water resources that have further supported environmental restoration efforts (Zhang Q. et al., 2021). Therefore, to some extent, the IMWSA faces more severe challenges compared to other arid regions in northwestern China. To effectively address these issues, adaptive strategies—such as scientifically guided ecological engineering and improved land management—are urgently needed to maintain and enhance EEQ under persistent climatic pressure.
4.3 Limitations and future work
By integrating multiple remote sensing indicators, RSEI effectively overcomes the limitations of single-variable approaches in representing regional ecological conditions. It combines the advantages of objective quantification with strong spatial visualization capabilities and has become a widely used tool for assessing EEQ at the regional scale. However, since the selection of indicators in RSEI was primarily designed for generalized terrestrial ecosystems, its applicability is not always optimal in regions with distinct ecological structures, such as forests, deserts, or areas with dense water networks. Therefore, when evaluating ecological quality in specific regions, it is essential to consider local environmental characteristics. This study focused on IMWSA, where severe soil salinization threatens both agricultural productivity and ecological restoration. A salinity index was introduced based on previous research to better capture the ecological conditions of the region. Nevertheless, several limitations still remain. First, the IMWSA is one of the most dust storm-prone regions in both Inner Mongolia and China. Future research may consider incorporating indicators that reflect atmospheric dust aerosol concentrations, in order to better evaluate the impact of dust storms on EEQ. Second, the NDBSI used in this study could be further refined into indices such as land degradation or desertification indicators, which may allow for a more detailed characterization of local ecological conditions. In addition, although the influence of meteorological factors on eRSEI was examined using a partial correlation approach, the effects of climate variables on vegetation and ecosystems are often subject to time-lag and cumulative effects. Incorporating these temporal dynamics into the eRSEI driver analysis framework remains a key methodological challenge. Due to the constraints of the current research framework and available resources, a comprehensive investigation of these complex research directions is not feasible within the scope of this study. However, these issues possess significant scientific value, and we aim to address them in future research, with the objective of overcoming the existing technical and resource limitations.
5 Conclusion
In this study, the eRSEI was employed to examine the spatiotemporal dynamics of EEQ within the IMWSA from 2000 to 2024. Research revealed that in the past 25 years, EEQ was generally better in the southeast and declined towards the northwest. Over this period, eRSEI exhibited an overall upward trend, indicating a general improvement in EEQ. Although degraded areas (39.9%) slightly outnumbered improved areas (33.7%), significantly improved areas (9.52%) greatly exceeded significantly degraded ones (1.69%). According to the Hurst exponent, IMWSA exhibited anti-persistent characteristics overall, and the spatial extent of EEQ improvement (32.6%) is slightly larger than that of deterioration (30.21%) in the future. Land use type and meteorological variables were identified as the dominant factors influencing the spatial distribution of eRSEI in IMWSA. The driving factors were ranked in the following order of importance: land use type > precipitation > temperature > soil type > solar radiation > elevation. The effects of these drivers on eRSEI were characterized by interaction mechanisms, including bivariate enhancement and nonlinear enhancement. Positive correlations were found between eRSEI and temperature, precipitation, and solar radiation, with precipitation exhibiting the strongest association. Recent climate change has generally hindered EEQ improvement. In contrast, human-induced land use changes, particularly ecological restoration, have enhanced vegetation cover and regional microclimates, making these the primary drivers of ecological improvement.
Data availability statement
The original contributions presented in the study are included in the article/supplementary material, further inquiries can be directed to the corresponding author.
Author contributions
SY: Visualization, Writing – original draft, Data curation, Formal Analysis, Methodology, Investigation, Writing – review and editing, Conceptualization, Project administration. ZM: Writing – review and editing, Resources, Investigation, Methodology. RM: Methodology, Resources, Investigation, Writing – review and editing.
Funding
The author(s) declare that financial support was received for the research and/or publication of this article. This research was supported by the Inner Mongolia Autonomous Region Sand Prevention and Control Science and Technology Innovation Major Demonstration Project (2024JBGS0009), and Inner Mongolia Autonomous Region Higher Education Institutions Scientific Research Project (NJZY23110).
Conflict of interest
The authors declare that the research was conducted in the absence of any commercial or financial relationships that could be construed as a potential conflict of interest.
Generative AI statement
The author(s) declare that no Generative AI was used in the creation of this manuscript.
Any alternative text (alt text) provided alongside figures in this article has been generated by Frontiers with the support of artificial intelligence and reasonable efforts have been made to ensure accuracy, including review by the authors wherever possible. If you identify any issues, please contact us.
Publisher’s note
All claims expressed in this article are solely those of the authors and do not necessarily represent those of their affiliated organizations, or those of the publisher, the editors and the reviewers. Any product that may be evaluated in this article, or claim that may be made by its manufacturer, is not guaranteed or endorsed by the publisher.
References
Ah, R., Yu, T. T., Dong, Z. H., and Tong, B. (2022). Spatiotemporal variations in the intensity of human activity in Inner Mongolia and the identification of influencing forces. Sustainability 14 (10), 6252. doi:10.3390/su14106252
Aizizi, Y., Kasimu, A., Liang, H., Zhang, X., Zhao, Y., and Wei, B. (2023). Evaluation of ecological space and ecological quality changes in urban agglomeration on the northern slope of the tianshan Mountains. Ecol. Indic. 146, 109896. doi:10.1016/j.ecolind.2023.109896
Allbed, A., Kumar, L., and Aldakheel, Y. Y. (2014). Assessing soil salinity using soil salinity and vegetation indices derived from IKONOS high-spatial resolution imagery: applications in a date palm dominated region. Geoderma 230/231, 1–8. doi:10.1016/j.geoderma.2014.03.025
Bai, Y., Chen, Y. Y., Alatalo, J. M., Yang, Z., and Jiang, B. (2020). Scale effects on the relationships between land characteristics and ecosystem services: a case study in taihu Lake basin, China. Sci. Total Environ. 716, 137083. doi:10.1016/j.scitotenv.2020.137083
Bai, T., Cheng, J., Zheng, Z., Zhang, Q., Li, Z., and Xu, D. (2023). Drivers of eco-environmental quality in China from 2000 to 2017. J. Clean. Prod. 396, 136408. doi:10.1016/j.jclepro.2023.136408
Bashir, B., Cao, C. X., Naeem, S., Zamani Joharestani, M., Bo, X., Afzal, H., et al. (2020). Spatio-temporal vegetation dynamic and persistence under climatic and anthropogenic factors. Remote Sens. 12 (16), 2612. doi:10.3390/rs12162612
Bian, T., Ren, G. Y., and Yue, Y. X. (2017). Effect of urbanization on land-surface temperature at an urban climate station in north China. Bound.-Layer Meteorol. 165, 553–567. doi:10.1007/s10546-017-0282-x
Cha, E., Bayaer, T., Bao, Y., Yong, M., and Zhang, X. (2022). Temporal and spatial changes in evapotranspiration and its potential driving factors in Mongolia over the past 20 years. Remote Sens. 14 (8), 1856. doi:10.3390/rs14081856
Chen, P., Wang, S., Song, S., Wang, Y., Wang, Y., Gao, D., et al. (2022). Ecological restoration intensifies evapotranspiration in the kubuqi desert. Ecol. Eng. 175, 106504. doi:10.1016/j.ecoleng.2021.106504
Cornejo-Denman, L., Romo-Leon, J. R., Castellanos, A. E., Diaz-Caravantes, R., Moreno-Vázquez, J., and Mendez-Estrella, R. (2018). Assessing riparian vegetation condition and function in disturbed sites of the arid northwestern Mexico. Land 7 (1), 13. doi:10.3390/land7010013
Dong, F. F., Qin, F. C., Dong, X. Y., Wu, Y., Zhao, K., and Zhao, L. (2024). Spatiotemporal evolution and drivers of ecological quality in the tengger desert (2001–2021). Land 13 (11), 1838. doi:10.3390/land13111838
Duo, L. H., Wang, J. Q., Zhang, F. Q., Xia, Y., Xiao, S., and He, B. J. (2023). Assessing the spatiotemporal evolution and drivers of ecological environment quality using an enhanced remote sensing ecological index in lanzhou city, China. Remote Sens. 15 (19), 4704. doi:10.3390/rs15194704
Fang, H. J., Qin, W. M., Wang, L. C., Zhang, M., and Yang, X. (2021). Solar brightening/dimming over China’s mainland: effects of atmospheric aerosols, anthropogenic emissions, and meteorological conditions. Remote Sens. 13 (1), 88. doi:10.3390/rs13010088
Feng, Q., Yin, X. W., Zhu, M., Zhang, J. T., Liu, W., Xi, H. Y., et al. (2024). Coordinated promotion of comprehensive management and utilization of saline-alkali land in northwest China: current situation, challenges and countermeasures. Bull. Chin. Acad. Sci. 39 (12), 2060–2073. doi:10.16418/j.issn.1000-3045.20240702002
Gao, T., Xu, Y. F., Bo, Y., and Xiao, Y. (2006). Synoptic characteristics of dust storms observed in Inner Mongolia and their influence on the downwind area (the beijing–tianjin region). Meteorol. Appl. 13, 393–403. doi:10.1017/s1350482706002404
Gillespie, T. W., Ostermann-Kelm, S., Dong, C. Y., Willis, K. S., Okin, G. S., and MacDonald, G. M. (2018). Monitoring changes of NDVI in protected areas of southern California. Ecol. Indic. 88, 485–494. doi:10.1016/j.ecolind.2018.01.031
Haas, H., Kalin, L., Tian, D., and Lehrter, J. (2025). Dynamic land-use/cover improves simulations of long-term watershed-scale streamflow and water quality trends. J. Hydrol. 661 (Part C), 133744. doi:10.1016/j.jhydrol.2025.133744
Hazbavi, Z., Sadeghi, S. H. R., Gholamalifard, M., and Davudirad, A. A. (2020). Watershed health assessment using the pressure–state–response (PSR) framework. Land Degrad. Dev. 31 (1), 3–19. doi:10.1002/ldr.3420
Hu, X., and Xu, H. (2018). A new remote sensing index for assessing the spatial heterogeneity in urban ecological quality: a case from fuzhou city, China. Ecol. Indic.89, 11–21. doi:10.1016/j.ecolind.2018.02.006
Higgins, S. I., Conradi, T., and Muhoko, E. (2023). Shifts in vegetation activity of terrestrial ecosystems attributable to climate trends. Nat. Geosci. 16, 147–153. doi:10.1038/s41561-022-01114-x
Kamran, M., and Yamamoto, K. (2023). Evolution and use of remote sensing in ecological vulnerability assessment: a review. Ecol. Indic. 148, 110099. doi:10.1016/j.ecolind.2023.110099
Kang, L. G., Xin, C. L., Yang, Y. F., Xin, S. J., Wang, Y., Chen, N., et al. (2025). Remote sensing assessment of eco-environmental quality and quantitative identification of its driving factors in Gansu province. Environ. Sci. 46 (6), 3730–3746. doi:10.13227/j.hjkx.202406186
Kim, S., Lee, S., Park, S., and Shin, Y. (2021). Socioeconomic risks and their impacts on ecological river health in South Korea: an application of the analytic hierarchy process. Sustainability 13 (11), 6287. doi:10.3390/su13116287
Kumar, P., Tiwari, P., Biswas, A., and Kumar Srivastava, P. (2024). Spatio-temporal assessment of soil salinization utilizing remote sensing derivatives, and prediction modeling: implications for sustainable development. Geosci. Front. 15 (6), 101881. doi:10.1016/j.gsf.2024.101881
Li, C. J., Fu, B. J., Wang, S., Stringer, L. C., Wang, Y., Li, Z., et al. (2021). Drivers and impacts of changes in China’s drylands. Nat. Rev. Earth Environ. 2, 858–873. doi:10.1038/s43017-021-00226-z
Li, T. T., Zhang, Q., Wang, G., Singh, V. P., Zhao, J., Sun, S., et al. (2023). Ecological degradation in the Inner Mongolia reach of the yellow river basin, China: spatiotemporal patterns and driving factors. Ecol. Indic. 154, 110498. doi:10.1016/j.ecolind.2023.110498
Li, C. Y., Yuan, X., Jiao, Y., Ji, P., and Huang, Z. W. (2024a). High-resolution land surface modeling of the irrigation effects on evapotranspiration over the yellow River basin. J. Hydrol. 633, 130986. doi:10.1016/j.jhydrol.2024.130986
Li, M. Y., Li, X. B., Liu, S. Y., Lyu, X., Dang, D., Dou, H., et al. (2024b). Analysis of the spatiotemporal dynamics and driving factors of ecosystem quality in Inner Mongolia from 2005 to 2020. Environ. Technol. Innov. 35, 103686. doi:10.1016/j.eti.2024.103686
Li, S. W., Qu, S. F., Zhang, G. M., Zhou, Y., Sun, X., Li, J., et al. (2024c). Spatiotemporal pattern and drivers of ecological quality in Inner Mongolia. Land 13 (5), 568. doi:10.3390/land13050568
Li, H. C., Chen, J. J., Ling, M., Chen, Z., Lan, Y., Huang, Q., et al. (2025). A framework for dynamic assessment of soil erosion and detection of driving factors in alpine grassland ecosystems using the RUSLE-InVEST (SDR) model and geodetector: a case study of the source region of the yellow river. Ecol. Inf. 85, 102928. doi:10.1016/j.ecoinf.2024.102928
Lin, J., Bo, W. H., Dong, X. P., Zhang, R., Yan, J., and Chen, T. (2024). Evolution of vegetation cover and impacts of climate change and human activities in arid regions of northwest China: a Mu Us Sandy Land case. Environ. Dev. Sustain. 47 (4), 18977–18996. doi:10.1007/s10668-024-04704-4
Liu, H., Jiang, Y., Misa, R., Gao, J., Xia, M., Preusse, A., et al. (2021). Ecological environment changes of mining areas around Nansi Lake with remote sensing monitoring. Environ. Sci. Pollut. Res. 28 (32), 44152–44164. doi:10.1007/s11356-021-13849-y
Liu, J., Wei, L. H., Zheng, Z. P., and Du, J. (2023a). Vegetation cover change and its response to climate extremes in the Yellow River Basin. Sci. Total Environ. 905, 167366. doi:10.1016/j.scitotenv.2023.167366
Liu, Y., Xu, W. H., Hong, Z. H., Wang, L., Ou, G., Lu, N., et al. (2023b). Integrating three-dimensional greenness into RSEI improved the scientificity of ecological environment quality assessment for forest. Ecol. Indic. 156, 111092. doi:10.1016/j.ecolind.2023.111092
Liu, H. M., Lu, J. Y., Li, X. C., Wang, Y., Xu, D., Yin, J., et al. (2025). Evaluating human-nature relationships at a grid scale in China, 2000–2020. Habitat Int. 156, 103282. doi:10.1016/j.habitatint.2024.103282
Lu, F. Y., Zhang, C., Cao, H. Y., Wang, X., Zheng, T., and Huang, Z. (2025). Assessment of ecological environment quality and their drivers in urban agglomeration based on a novel remote sensing ecological index. Ecol. Indic. 170, 113104. doi:10.1016/j.ecolind.2025.113104
Mathew, A., Khandelwal, S., Kaul, N., and Chauhan, S. (2018). Analyzing the diurnal variations of land surface temperatures for surface urban heat island studies: is time of observation of remote sensing data important? Sustain. Cities Soc. 40, 194–213. doi:10.1016/j.scs.2018.03.032
Nourani, V., Foroumandi, E., Sharghi, E., and Dąbrowska, D. (2021). Ecological-environmental quality estimation using remote sensing and combined artificial intelligence techniques. J. Hydroinform. 23 (1), 47–65. doi:10.2166/hydro.2020.048
Piao, S. L., Ciais, P., Huang, Y., Shen, Z., Peng, S., Li, J., et al. (2010). The impacts of climate change on water resources and agriculture in China. Nature 467 (7311), 43–51. doi:10.1038/nature09364
Qian, Y. P., and Wu, Z. H. (2019). Study on urban expansion using the spatial and temporal dynamic changes in the impervious surface in Nanjing. Sustainability 11 (3), 933. doi:10.3390/su11030933
Qin, G. X., Wang, N., Wu, Y. Y., Zhang, Z., Meng, Z., and Zhang, Y. (2024). Spatiotemporal variations in eco-environmental quality and responses to drought and human activities in the middle reaches of the yellow River basin, China from 1990 to 2022. Ecol. Inf. 81, 102641. doi:10.1016/j.ecoinf.2024.102641
Rao, Z., Wu, X. J., Zhang, W., He, J., Qin, Y., Li, Z., et al. (2024). Seasonally extreme temperature events accelerate in arid northwestern China during 1979–2018. Atmos. Res. 300, 107230. doi:10.1016/j.atmosres.2024.107230
Sahbeni, G., Ngabire, M., Musyimi, P. K., and Székely, B. (2023). Challenges and opportunities in remote sensing for soil salinization mapping and monitoring: a review. Remote Sens.15, 2540. doi:10.3390/rs15102540
Shao, Y. J., Liu, Y. S., Wang, X. C., and Li, S. (2024). Exploring the evolution of ecosystem health and sustainable zoning: a perspective based on the contributions of climate change and human activities. Sci. Total Environ. 951, 175674. doi:10.1016/j.scitotenv.2024.175674
Shi, F. G., and Li, M. S. (2021). Assessing land cover and ecological quality changes under the new-type urbanization from multi-source remote sensing. Sustainability 13 (21), 11979. doi:10.3390/su132111979
Shi, L., Fan, H. J., Yang, L. Y., Jiang, Y., Sun, Z., and Zhang, Y. (2023). NDVI-based spatial and temporal vegetation trends and their response to precipitation and temperature changes in the Mu Us Desert from 2000 to 2019. Water Sci. Technol. 88 (2), 430–442. doi:10.2166/wst.2023.212
Song, Y. Z., Wang, J. F., Ge, Y., and Xu, C. D. (2020). An optimal parameters-based geographical detector model enhances geographic characteristics of explanatory variables for spatial heterogeneity analysis: cases with different types of spatial data. GISci. Remote Sens. 57 (5), 593–610. doi:10.1080/15481603.2020.1760434
Tong, S. Q., Li, X. Q., Zhang, J. Q., Bao, Y., Bao, Y., Na, L., et al. (2019). Spatial and temporal variability in extreme temperature and precipitation events in Inner Mongolia (China) during 1960–2017. Sci. Total Environ. 649, 75–89. doi:10.1016/j.scitotenv.2018.08.262
Wan, L. L., Bento, V. A., Qu, Y. P., Qiu, J., Song, H., Zhang, R., et al. (2023). Drought characteristics and dominant factors across China: insights from high-resolution daily SPEI dataset between 1979 and 2018. Sci. Total Environ. 901, 166362. doi:10.1016/j.scitotenv.2023.166362
Wang, Z. R., and Hasi, E. D. (2023). Research on the development of deserticulture and desertification land use benefits evaluation in ordos city. Land 12 (6), 1254. doi:10.3390/land12061254
Wang, F., Yang, S. T., Yang, W., Yang, X., and Jianli, D. (2019). Comparison of machine learning algorithms for soil salinity predictions in three dryland oases located in Xinjiang Uyghur autonomous Region (XJUAR) of China. Eur. J. Remote Sens. 52 (1), 256–276. doi:10.1080/22797254.2019.1596756
Wang, J. J., Ding, J. J., Ge, X. J., Qin, S., and Zhang, Z. (2022). Assessment of ecological quality in northwest China (2000–2020) using the google Earth engine platform: climate factors and land use/land cover contribute to ecological quality. J. Arid. Land 14, 1196–1211. doi:10.1007/s40333-022-0085-x
Wang, S. N., Li, R. P., Wu, Y. J., and Zhao, S. (2022). Vegetation dynamics and their response to hydrothermal conditions in Inner Mongolia, China. Glob. Ecol. Conserv. 34, e02034. doi:10.1016/j.gecco.2022.e02034
Wang, C., Li, Z., Chen, Y., Ouyang, L., Li, Y., Sun, F., et al. (2023a). Drought-heatwave compound events are stronger in drylands. Weather Clim. Extrem. 42, 100632. doi:10.1016/j.wace.2023.100632
Wang, Z. W., Chen, T., Zhu, D. Y., Jia, K., and Plaza, A. (2023b). RSEIFE: a new remote sensing ecological index for simulating the land surface eco-environment. J. Environ. Manage. 326 (Part A), 116851. doi:10.1016/j.jenvman.2022.116851
Wang, J. F., Wang, Y. Q., and Xu, D. Y. (2024). Desertification in northern China from 2000 to 2020: the spatial-temporal processes and driving mechanisms. Ecol. Inf. 82, 102769. doi:10.1016/j.ecoinf.2024.102769
Wang, J. Y., Shao, Z. F., Fu, P., Zhuang, Q., Chang, J., Jing, P., et al. (2025a). Unraveling the impact of urban expansion on vegetation carbon sequestration capacity: a case study of the Yangtze river Economic Belt. Sustain. Cities Soc. 120, 106157. doi:10.1016/j.scs.2025.106157
Wang, R. B., Zou, J., Ding, J. L., Zou, W. S., Yang, M., Qin, M. Y., et al. (2025b). Soil moisture is the primary driving force of vegetation growth in arid regions of Central Asia. Acta Ecol. Sin. (9), 1–18. doi:10.20103/j.stxb.202407161662
WMO (2025). State of the Global Climate 2024 (WMO-No. 1368). Geneva: World Meteorological Organization.
Wu, H., Wu, F., Cai, Y., and Li, Z. H. (2024). Assessing the spatiotemporal impacts of land use change on ecological environmental quality using a regionalized territorial impact assessment framework. Sustain. Cities Soc. 112, 105623. doi:10.1016/j.scs.2024.105623
Xie, J. L., Lu, Z. X., Xiao, S. C., and Yan, C. (2023). The latest desertification process and its driving force in alxa league from 2000 to 2020. Remote Sens. 15, 4867. doi:10.3390/rs15194867
Xu, H. Q., Wang, M. Y., Shi, T. T., Guan, H., Fang, C., and Lin, Z. (2018). Prediction of ecological effects of potential population and impervious surface increases using a remote sensing based ecological index (RSEI). Ecol. Indic. 93, 730–740. doi:10.1016/j.ecolind.2018.05.055
Xu, Y. H., Zhang, T. B., Yi, G. H., Bie, X. J., Li, J. J., Dang, W. Y., et al. (2025). Spatiotemporal characteristics and influencing factors of ecological environment quality in the taihang Mountains. Environ. Sci., 1–17. doi:10.13227/j.hjkx.202403076
Yang, T. F., Xie, J. B., Song, P. L., Li, G., Mou, N., Gao, X., et al. (2022a). Monitoring ecological conditions by remote sensing and social media data—Sanya City (China) as case study. Remote Sens. 14, 2824. doi:10.3390/rs14122824
Yang, X. Y., Meng, F., Fu, P. J., Wang, Y., and Liu, Y. (2022b). Time-frequency optimization of RSEI: a case study of Yangtze River Basin. Ecol. Indic. 141, 109080. doi:10.1016/j.ecolind.2022.109080
Ye, B. W., Sun, B., Zhao, Y. L., Pang, J. Q., Guo, Y. Y., and Yao, W. Z. (2025). Temporal and spatial evolution of habitat quality and driving forces analysis in Inner Mongolia from 2000 to 2022. Huan Jing Ke Xue 46, 1–19. doi:10.13227/j.hjkx.202407134
Yin, X. W., Feng, Q., Li, Y., Deo, R. C., Liu, W., Zhu, M., et al. (2022). An interplay of soil salinization and groundwater degradation threatening coexistence of oasis-desert ecosystems. Sci. Total Environ. 806, 150599. doi:10.1016/j.scitotenv.2021.150599
Yu, X. W., Zhuo, Y., Liu, H. M., Wang, Q., Wen, L., Li, Z. Y., et al. (2020). Degree of desertification based on normalized landscape index of sandy lands in Inner Mongolia, China. Glob. Ecol. Conserv. 23, e01132. doi:10.1016/j.gecco.2020.e01132
Yuan, X., Wang, Y., Ji, P., Wu, P., Sheffield, J., and Otkin, J. A. (2023). A global transition to flash droughts under climate change. Science 380, 187–191. doi:10.1126/science.abn6301
Yue, A., and Zhang, Z. (2018). Analysis and research on ecological condition change based on EI value. J. Green Sci. Technol. 14 (182)–184. doi:10.16663/j.cnki.lskj.2018.14.071
Zhang, Y., and Shang, K. (2024). Evaluation of mine ecological environment based on fuzzy hierarchical analysis and grey relational degree. Environ. Res. 257, 119370. doi:10.1016/j.envres.2024.119370
Zhang, H., Zhang, X., Shang, Y., Kattel, G., and Miao, L. (2021a). Continuously vegetation greening over Inner Mongolia for the past three decades. Remote Sens. 13, 2446. doi:10.3390/rs13132446
Zhang, Q., Yang, J. H., Wang, W., Ma, P., Lu, G., Liu, X., et al. (2021b). Climatic warming and humidification in the arid region of Northwest China: Multi-scale characteristics and impacts on ecological vegetation. J. Meteorol. Res. 35, 113–127. doi:10.1007/s13351-021-0105-3
Zhang, L. J., Hu, Z. Q., Yang, D. Z., Li, H., Liu, B., Gao, H., et al. (2022). Land use dynamic evolution and driving factors of typical open-pit coal mines in Inner Mongolia. Int. J. Environ. Res. Public Health 19, 9723. doi:10.3390/ijerph19159723
Zhang, P. P., Chen, X. D., Ren, Y., Lu, S., Song, D., and Wang, Y. (2023a). A novel mine-specific eco-environment index (MSEEI) for mine ecological environment monitoring using Landsat imagery. Remote Sens. 15, 933. doi:10.3390/rs15040933
Zhang, J., Zhang, Y. X., Qin, Y., Lu, X., and Cao, J. (2023b). The spatiotemporal pattern of grassland NPP in Inner Mongolia was more sensitive to moisture and human activities than that in the Qinghai-Tibetan Plateau. Glob. Ecol. Conserv. 48, e02709. doi:10.1016/j.gecco.2023.e02709
Zhang, H. B., Ma, C., and Liu, P. (2024a). Dynamic evaluation of the ecological evolution and quality of arid and semi-arid deserts in the Aibugai River Basin based on an improved remote sensing ecological index. Ecol. Inf. 82, 102727. doi:10.1016/j.ecoinf.2024.102727
Zhang, Y. Q., Zhao, X., Gong, J., Luo, F., and Pan, Y. (2024b). Effectiveness and driving mechanism of ecological restoration efforts in China from 2009 to 2019. Sci. Total Environ. 910, 168676. doi:10.1016/j.scitotenv.2023.168676
Zhang, H. B., Wang, W., Song, Y. J., Miao, L. G., and Ma, C. (2024c). Ecological quality assessment in arid inland river basin based on improved remote sensing ecological index: a case study of Tabu River Basin in the northern foot of Yinshan Mountains. Acta Ecol. Sin. 44 (02), 523–543. doi:10.20103/j.stxb.202210132910
Zhang, L. Y., Li, X., Liu, X. H., Lian, Z., Zhang, G., and Liu, Z. (2025a). Dynamic monitoring and drivers of ecological environmental quality in the Three-North region, China: insights based on remote sensing ecological index. Ecol. Inf. 85, 102936. doi:10.1016/j.ecoinf.2024.102936
Zhang, Z. P., Hu, Y. F., and Batunacun, (2025b). Analysis of the driving mechanism of grassland degradation in Inner Mongolia grassland from 2015 to 2020 using interpretable machine learning methods. Land 14, 386. doi:10.3390/land14020386
Zhang, Y., Chen, X. Y., Zhang, Y., and Wang, B. (2025c). Quantitative contribution of climate change and vegetation restoration to ecosystem services in the Inner Mongolia under ecological restoration projects. Ecol. Indic. 171, 113240. doi:10.1016/j.ecolind.2025.113240
Zhao, X., Hao, Q. L., and Sun, Y. Y. (2017). Spatial heterogeneity of soil salinization and its influencing factors in the typical region of the Mu Us Desert-Loess Plateau transitional zone, Northwest China. Chin. J. Appl. Ecol. 28, 1761–1768. doi:10.13287/j.1001-9332.201706.034
Zhao, L. L., Jia, K., Liu, X., Li, J., and Xia, M. (2023). Assessment of land degradation in Inner Mongolia between 2000 and 2020 based on remote sensing data. Geogr. Sustain. 4, 100–111. doi:10.1016/j.geosus.2023.01.003
Zhao, C. R., Feng, Y., Liu, W. B., Wang, H., Wang, T., Liu, Y. H., et al. (2024). Provincial-scale assessment of vulnerability and resilience to drought in China. Sci. Total Environ. 934, 173199. doi:10.1016/j.scitotenv.2024.173199
Zheng, Y., Dong, L., Xia, Q., Liang, C., Wang, L., and Shao, Y. (2020). Effects of revegetation on climate in the Mu Us Sandy Land of China. Sci. Total Environ. 739, 139958. doi:10.1016/j.scitotenv.2020.139958
Zheng, Z. H., W, Z. F., Chen, Y. B., Guo, C., and Marinello, F. (2022). Instability of remote sensing-based ecological index (RSEI) and its improvement for time series analysis. Sci. Total Environ. 814, 152595. doi:10.1016/j.scitotenv.2021.152595
Keywords: Inner Mongolia western sandy area, eco-environmental quality, enhanced remote sensingecological index, spatiotemporal dynamics, driving factors
Citation: Yang S, Meng Z and Meng R (2025) Spatiotemporal dynamics and driving factors of eco-environmental quality in the sandy areas of Western Inner Mongolia (2000–2024). Front. Environ. Sci. 13:1658175. doi: 10.3389/fenvs.2025.1658175
Received: 02 July 2025; Accepted: 08 September 2025;
Published: 22 September 2025.
Edited by:
Tao Wang, Chinese Academy of Sciences (CAS), ChinaReviewed by:
Tumaini Erasto Robert Mazengo, Tanzania Agricultural Research Institute (TARI), TanzaniaXin Gao, Chinese Academy of Sciences (CAS), China
Huawei Pi, Henan University, China
Hongyu Cao, Chinese Academy of Forestry, China
Copyright © 2025 Yang, Meng and Meng. This is an open-access article distributed under the terms of the Creative Commons Attribution License (CC BY). The use, distribution or reproduction in other forums is permitted, provided the original author(s) and the copyright owner(s) are credited and that the original publication in this journal is cited, in accordance with accepted academic practice. No use, distribution or reproduction is permitted which does not comply with these terms.
*Correspondence: Zhongju Meng, bWVuZ3pob25nanVAMTI2LmNvbQ==