 Sanqing He
 Yanan Sun3*
- 1School of Design, Huazhong University of Science and Technology, Wuhan, China
- 2The Key Laboratory of Lighting Interactive Service and Technology for Ministry of Culture and Tourism, Huazhong University of Science and Technology, Wuhan, China
- 3Architectural Design Institute, China Railway Construction Corporation Limited, Beijing, China
- 4School of Architecture and Urban Planning, Huazhong University of Science and Technology, Wuhan, China
- 5College of Literature and Journalism, Jishou University, Jishou, China
Urban areas account for over 70% of global CO2 emissions. Recent studies show that urban morphology’s impact on carbon emissions is more complex than traditional linear models suggest, with critical implications for low-carbon urban planning in China. This study contrasts linear spatial regression models with non-linear geographical Gaussian process regression (GGPR) to analyze morphology-emission relationships across 286 Chinese cities (2005–2020). Linear spatial regression suggests that urban aggregation (UAI) consistently increases emissions with elasticity rising from 0.754 to 0.781, while synchronized vertical-horizontal development (UGSI) reduces emissions with tripling effectiveness from −0.096 to −0.297. However, GGPR with GeoShapley explainability exposes a fundamental paradox: the same morphological features show opposite effects depending on development stage and spatial context. While linear models and non-linear analysis both confirm UAI’s complex role, they reveal it through different mechanisms. Linear models capture average effects across cities showing positive correlations, while GeoShapley analysis unveils location-specific variations where UAI can reduce per capita emissions in certain contexts. Critical thresholds for key indicators like LPI remain relatively stable around 15, but cities’ sensitivity to these thresholds has intensified dramatically. Eastern coastal megacities have reached saturation where further densification increases emissions, while western cities still benefit from compact development. The emergence of 3D indicators as significant factors by 2015–2020 marks a fundamental shift from 2D to 3D morphological influence. Based on the above findings, cities are suggested to implement threshold-based zoning that triggers mixed-use requirements at locally-calibrated limits and synchronized floor-area-ratio systems linking vertical development rights to infrastructure maturity. Also, performance-based carbon intensity targets need to replace uniform morphological standards, enabling regionally-differentiated strategies aligned with local development stages and spatial contexts.
1 Introduction
Urban areas, while comprising only about 3% of the Earth’s surface, are responsible for over 70% of global CO2 emissions (Hong et al., 2022a). Understanding the relationship between urban morphology and carbon emissions is crucial for developing effective climate mitigation policies (Sun et al., 2022; Privitera et al., 2018; Kang et al., 2024). However, this relationship exhibits fundamental complexity that challenges traditional analytical approaches. Urban systems operate as complex adaptive systems where spatial dependencies, threshold effects, and scale-dependent relationships coexist, necessitating methodological approaches that can capture both global patterns and local variations (Batty, 2013; Portugali, 2016; Bettencourt, 2013).
The theoretical rationale for expecting complex relationships emerges from three interconnected frameworks. First, urban system complexity theory posits that cities undergo phase transitions as they develop, wherein efficiency gains from agglomeration are counterbalanced by congestion externalities (Batty, 2013; Martínez-Zarzoso and Maruotti, 2011). Second, the environmental Kuznets curve hypothesis suggests inverted U-shaped relationships between development and emissions, implying that morphology-emission relationships shift qualitatively at different development stages (Kar, 2024). Third, Tobler’s First Law of Geography dictates that spatial autocorrelation underlies all urban phenomena, which creates linear spatial dependencies that interact with local non-linearities (Tobler, 1970). These frameworks suggest that urban carbon dynamics operate through dual mechanisms: linear spatial processes creating regional patterns, and non-linear local dynamics generating threshold effects and context-specific variations (Newman and Kenworthy, 2015).
Earlier studies primarily examined urban form metrics from a two-dimensional perspective using linear regression models. Makido et al. established that CO2 emissions from transportation in compact cities were lower than in sprawled cities, providing an empirical foundation for the compact city hypothesis (Makido et al., 2012). Liu et al. quantified this relationship, estimating that a 1% increase in urban area correlated with a 0.901% increase in CO2 emissions, suggesting a sub-linear scaling effect (Liu et al., 2020). Fang et al. identified stronger linear correlations, revealing that urban land growth was positively associated with carbon emissions (Fang et al., 2015). These pioneering studies effectively captured spatial autocorrelation through regression models and provided interpretable coefficients essential for initial policy formulation. However, linear approaches proved fundamentally insufficient for capturing urban carbon complexity. Wu and Li synthesized this growing concern, observing that most existing research assumed linear relationships, thereby overlooking critical nuances that could better inform spatial planning strategies (Wu and Li, 2024).
As methodological sophistication increased, researchers began uncovering increasingly complex non-linear patterns that fundamentally challenged early assumptions. Li et al. demonstrated that creating cohesive building masses could significantly reduce CO2 emissions, with an additional 1% of landscape pattern index leading to a 1.3% decrease in emissions (Li et al., 2022). This finding suggested that spatial arrangement, not just quantity, critically influences carbon outcomes. Zheng et al. expanded this understanding by revealing complex relationships where CO2 emissions were strongly correlated with urban area and indicators of patchiness and irregularity, while showing inverse correlation with urban form compactness. Their research demonstrated an 8.8% reduction in petrol CO2 emissions through cohesive development, highlighting the role of urban cohesion (Zheng et al., 2022).
Meanwhile, the discovery of threshold effects marked a fundamental paradigm shift in understanding urban form-carbon relationships. Ding et al. pioneered this approach by identifying two critical compactness thresholds at 0.662 and 0.746, indicating that a 1% increase in urban form compactness resulted in a 1.8% reduction in emissions between these thresholds but only 0.9% beyond the upper threshold (Ding et al., 2022). This non-constant elasticity revealed that densification strategies’ effectiveness fundamentally depends on existing urban conditions. The following research has discovered multiple threshold dimensions operating across different scales. At the city scale, Ribeiro et al. established a critical threshold at population × area = 1.93 × 10⁸, above which the relationship between city size and emissions fundamentally reversed, where larger cities showed 1.17% emission increases per 1% population growth versus 0.92% for smaller cities (Ribeiro et al., 2019). Multiple studies now converge on a one-million population threshold as a fundamental breakpoint where urban density effects reverse, revealing a U-shaped relationship that completely contradicts linear assumptions (Gudipudi et al., 2016). The transcendental logarithm modeling approach by Ribeiro et al. represented a methodological breakthrough, revealing that urban emissions display non-constant elasticity of scale depending on city size and density interactions (Ribeiro et al., 2019). At neighborhood scale, threshold effects manifest in infrastructure and land use patterns with remarkable consistency across different contexts. Fan et al. identified optimal population density ranges of 2000–2500 persons/km2 and land-use mix entropy values of 0.8–0.9 for maximum carbon reduction, with diminishing or even negative returns beyond these ranges (Fan et al., 2025). These findings collectively suggest that incremental improvements may yield minimal benefits until critical mass is achieved, fundamentally challenging gradual transition strategies.
Geographic context critically moderates these relationships. Ou et al. demonstrated that dense urban forms raised emissions in tier-one Chinese cities while reducing them in lower-tier cities (Ou et al., 2019). Shi et al. employed geographically and temporally weighted regression (GTWR) across 256 Chinese cities, demonstrating compactness benefits only in eastern coastal cities, while inland regions showed opposite patterns (Shi et al., 2022). International evidence also confirms this heterogeneity, with European studies documenting North-South gradients (Cortinovis et al., 2019) and North American research revealing that 10-fold density increases correspond to only 25% emission reductions (Jones and Kammen, 2014).
The shift from two-dimensional to three-dimensional urban analysis revealed entirely new dynamics that traditional planning strategies had overlooked. He et al. demonstrated that optimizing 3D building compactness could lead to a 7% decrease in building operational energy consumption, suggesting vertical configuration matters as much as horizontal layout (He et al., 2024). Xu et al. provided precise quantification of these complex effects: a 1% increase in total building volume resulted in a 0.558% rise in emissions, while increases in building coverage ratio and density entropy index led to reductions of 0.382% and 0.072% respectively (Xu et al., 2021). Yang and Zhao noted that CO2 emissions increased linearly with population and built-up area but exhibited sub-linear growth between specific built-up area and volume, illustrating the carbon efficiency advantages of vertical development (Yang and Zhao, 2023). Wang et al.’s comprehensive analysis of 53 Chinese cities demonstrated that 3D morphology explained building energy efficiency better than traditional economic factors, with lower building height, larger volume, and compact morphology showing greater energy-saving potential (Wang et al., 2024). Huang et al. used random forest with partial dependence plots to discover platform, V-shaped, and N-shaped relationships between building form and emissions, identifying building congestion degree and sky view factor as pivotal determinants with specific threshold values (Huang et al., 2025). These findings highlight multi-scale dependencies and interaction effects between height, volume, and coverage that exhibit both linear and non-linear characteristics, requiring analytical frameworks that transcend traditional 2D planning approaches.
Yet, the literature reveals fundamental contradictions. Whereas Hong et al. found density and land use mix reduced emissions (Hong et al., 2022a), Ye et al. revealed positive correlations between compactness and household emissions (Ye et al., 2015). Hong et al. identified a one-million inhabitant threshold where density decreased emissions in smaller cities but increased them in larger ones (Hong et al., 2022a). Jin and Xu advocated for polycentric development in central cities but compact forms in peripheries (Jin and Xu, 2024). Liu et al. synthesized these contradictions, finding large compact cities may paradoxically generate higher emissions (Liu et al., 2025). These contradictions reflect not measurement error but the duality of morphology-emission relationships, simultaneously linear and non-linear, global and local, stable and threshold-dependent (Caprotti and Bailey, 2014). This necessitates methodological triangulation to capture different aspects of the same phenomenon (Carter et al., 2014; Noble and Heale, 2019; Denzin, 2017). Linear spatial models excel at identifying dependencies through spatial weight matrices but miss threshold effects (Wu et al., 2025; Jacobs et al., 2025). Machine learning captures non-linearities but often violates spatial principles and lacks interpretability (Santos et al., 2019; Georganos et al., 2021).
Analytical methods evolved from conventional statistics to sophisticated approaches. The stochastic impacts by regression on population, affluence and technology (STIRPAT) framework was refined through ridge regression and panel threshold regression to address multicollinearity and identify non-linear effects (Ding et al., 2022; Xu et al., 2021). Panel data methods enabled better temporal control, with Cai et al. employing year-fixed effects with Lasso regression (Cai et al., 2023) and Falahatkar and Rezaei utilizing fixed effects models (Falahatkar and Rezaei, 2020). Spatial regression models like the spatial Durbin model captured autocorrelation (Li et al., 2022). Geographically weighted regression (GWR) addressed spatial heterogeneity (Jin and Xu, 2024; Zuo et al., 2020), extended by GTWR for spatiotemporal non-stationarity (Shi et al., 2022; Zhang et al., 2025). Machine learning achieved unprecedented accuracy. For instance, Li et al.’s integrated spatiotemporal nonlinear regression (ISTNR) reached a R2 of 0.924 combining GTWR, random forest, and SHapley Additive exPlanations (SHAP) methods (Li et al., 2025). Wu et al. identified double-threshold effects (Wu et al., 2025). Zeng et al. compared multiple approaches across 337 cities (Zeng et al., 2024). However, spatial models assume local linearity while machine learning violates geographical principles (Tobler, 1970; Comber et al., 2011).
CO2 measurement methodologies vary across studies. Inventory approaches based on the intergovernmental panel on climate change (IPCC) guidelines relied on statistical yearbook data on energy consumption (Xu et al., 2021). Alternative satellite-based techniques, such as the open-data inventory for anthropogenic carbon dioxide and the visible infrared imaging radiometer suite (VIIRS) on board the suomi national polar-orbiting partnership (NPP) satellite for nighttime light data, offered higher spatial resolution (Yang and Zhao, 2023). Most studies focused on direct emissions within administrative borders, although some accounted for indirect emissions from electricity (Cai et al., 2023). Ahn et al. advanced satellite-based methods using spaceborne CO2 and NO2 observations to estimate emissions for 54 global cities, employing non-linear least squares methods and Gaussian fitting approaches (Ahn et al., 2025).
Despite advances, critical gaps persist. For example, studies employ linear or non-linear methods in isolation, preventing distinction between spatial variation and genuine thresholds (Hagenauer and Helbich, 2022). Integrated three-dimensional morphology effects remain underexplored. Temporal dynamics as cities evolve require investigation. This study addresses these gaps by systematically comparing linear spatial regression models (e.g., ordinary least squares, spatial lag model) with non-linear geographical Gaussian process regression (GGPR) enhanced by GeoShapley analysis across 286 Chinese cities from 2005 to 2020. This methodological triangulation recognizes that linear models identify global patterns essential for policy while non-linear methods detect thresholds critical for local planning (Li, 2024).
The research makes three contributions: First, it provides evidence for complementarity between linear and non-linear spatial methods, and demonstrates how contradictions result from methods capturing different relationship aspects. Second, it integrates comprehensive three-dimensional indicators revealing transition from 2D to 3D influence patterns. Third, it documents temporal evolution emphasizing synchronized vertical-horizontal development strategies. Through this dual framework, we advance theoretical understanding while informing context-specific interventions. In this study, “urban form” specifically refers to the physical configuration of built environments, encompassing both horizontal patterns (e.g., compactness, fragmentation) and vertical dimensions (e.g., building heights, volumes). This definition focuses on measurable morphological characteristics rather than socio-economic or functional dimensions, which distinguishes it from broader conceptualizations that include land use patterns or activity distributions.
2 Methodology
2.1 Assessment of linear morphology-carbon relationship with spatial regression models
We apply ordinary least squares (OLS) and three spatial regression models, including spatial lag model (SLM), spatial error model (SEM), and spatial Durbin model (SDM), to explore the linear relationships between urban form and CO2 emissions. The spatial models account for spatial dependence, which OLS overlooks. And below is a summary of the model formulations.
The SLM posits that a city’s CO2 emissions are influenced not only by its own morphological characteristics but also by the emissions of neighboring cities, thereby capturing the spatial autocorrelation of the dependent variable (Gao et al., 2020). The model is expressed as follows (Equation 1):
where
The SEM accounts for autocorrelation in error terms by assuming that unobserved factors influencing emissions are spatially correlated (Golgher and Voss, 2016). Its formulation is as follows (Equation 2):
where
The SDM extends the SLM by incorporating spatially lagged variables, acknowledging that emissions and morphological features of neighboring cities can influence the emissions of the target city (Li and Li, 2020). The model is expressed in Equation 3:
where
Model estimation is conducted using maximum likelihood, with the weight matrix
2.2 Assessment of non-linear morphology-carbon relationship with GGPR
Geographical Gaussian process regression (GGPR) represents an advanced extension of Gaussian process regression specifically designed to address fundamental challenges in geospatial data analysis, including spatial autocorrelation, small sample prediction, and model interpretability (Jiao and Tao, 2025). Traditional machine learning methods such as random forests operate under the assumption of independence and identical distribution (i.i.d.), which fundamentally contradicts the spatial autocorrelation principles described by Tobler’s First Law, consequently leading to biased predictions (Dale and Fortin, 2014). GGPR addresses this limitation through a non-parametric Gaussian process framework that explicitly captures spatial dependencies using specialized covariance functions.
The mathematical foundation of GGPR rests on the Gaussian process definition, characterized by a mean function
where K denotes the covariance matrix defined by the kernel functions. The key innovation of GGPR lies in its composite kernel design that effectively captures the multi-scale nature of urban carbon emissions. This approach combines a spatial similarity kernel (SSK) with a Matérn kernel (MK) through the formulation
where
where hyperparameters
The hyperparameter optimization procedure employs Bayesian optimization with Gaussian process priors over the hyperparameter space, utilizing expected improvement as the acquisition function. The optimization procedure runs for 100 iterations with 5-fold spatial cross-validation, searching across a carefully defined parameter space that includes
To enhance model interpretability, GGPR is integrated with GeoShapley, a game theory-based framework that extends the Shapley value methodology to quantify spatial effects in machine learning models (Li, 2024). GeoShapley conceptualizes location features as joint players in a model prediction game, treating coordinates such as latitude and longitude as a single joint player rather than individual features. This approach enables the quantification of both intrinsic location effects and synergies between location and other features. The GeoShapley value for location features is calculated using Equation 7:
where GEO denotes a set of location features of size
For non-spatial features, the GeoShapley value is given by Equation 8:
The interaction effect between the location feature set and a specific feature
where the interaction term
The final model prediction
where
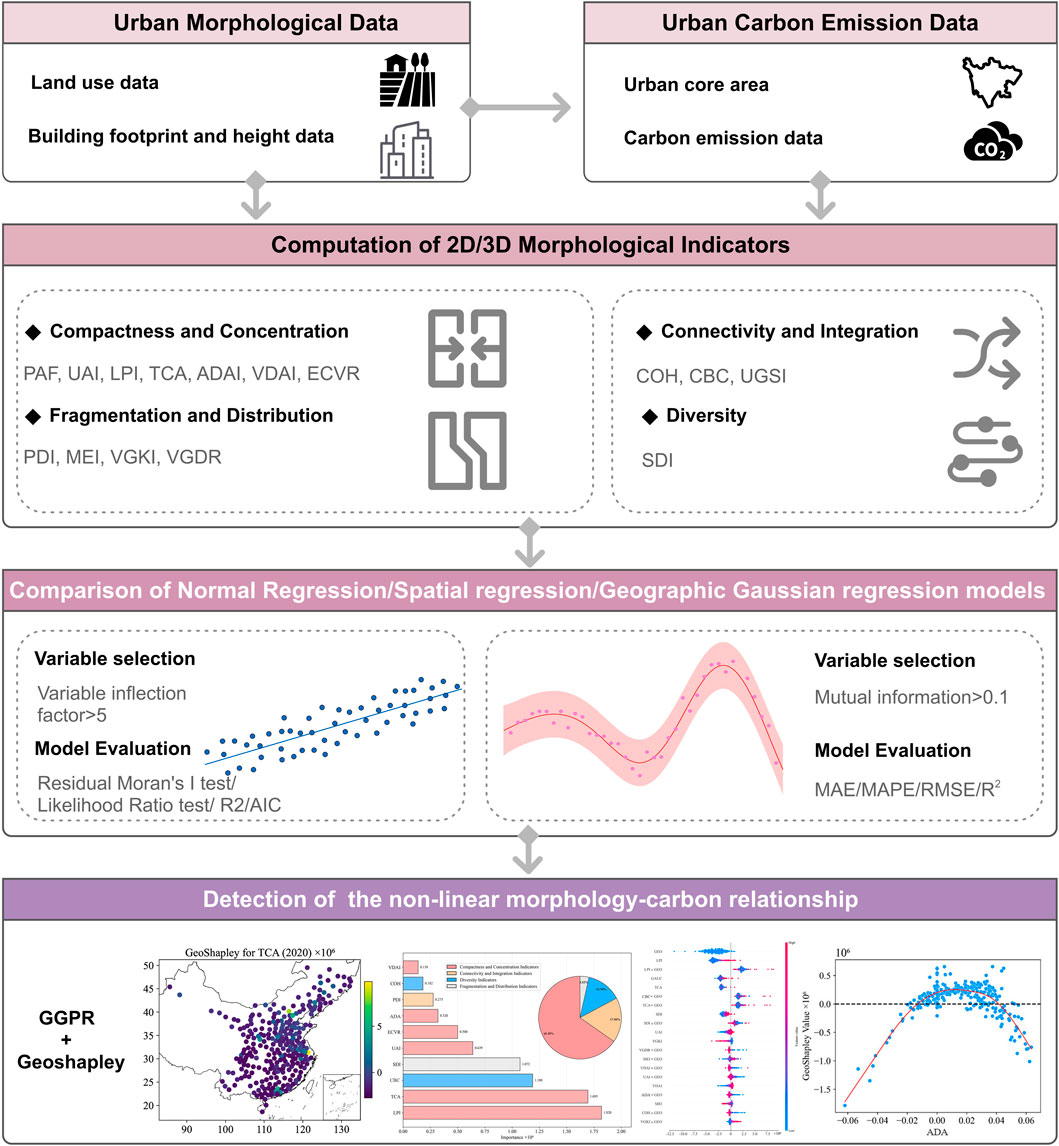
Figure 1. Research framework to analyze the linear and non-linear morphology-carbon relationship.
3 Urban morphological and emission data
3.1 2D urban morphological indices
The land use data from Yang and Huang is used to compute two-dimensional urban morphological indices that describe various aspects of urban spatial structure (Yang and Huang, 2021). These indices, derived from existing studies that measure the shape, arrangement, and diversity of impervious surfaces and land use types within a city (Moudon, 1994; McGarigal et al., 2002; Dai et al., 2018; Jia et al., 2019; Olsen et al., 2019; Ge et al., 2021), can be organized into four functional categories as indicated in Table 1. Compactness and concentration indicators capture how concentrated and compact the urban form is: the perimeter-area fractal dimension (PAF) measures the shape complexity of impervious surface patches, with higher values indicating more compact, less irregular shapes. Whilst the urban aggregation index (UAI) evaluates the clustering of patches, with higher values reflecting more aggregated, compact urban areas. The largest patch index (LPI) quantifies the dominance of the largest patch relative to the total urban area, where higher values suggest a consolidated urban core, whereas and the total core area (TCA) represents the sum of stable core areas within a 10 km buffer of the city center, reflecting the extent of robust urban patches. And the built area dynamic aggregation index (ADA) emphasizes the horizontal footprints of buildings and their radial concentration pattern. Fragmentation and distribution indicators measure dispersion and spatial distribution patterns. For instance, the patch density index (PDI) assesses fragmentation by calculating the number of patches per unit area, with higher values indicating a more dispersed urban form. While the mean elongation index (MEI) quantifies the average elongation of patches, where higher values suggest linear structures (e.g., roads) and lower values indicate compact forms (e.g., impervious surfaces). The patch cohesion index (COH), as a connectivity and integration indicator, measures the connectivity of patches, with higher values indicating well-connected urban areas that may enhance infrastructure efficiency, whilst the cumulative building coverage continuity (CBC) serves as an accumulated indicator of built density decay based on distance-weighted information concerning the area occupied by buildings. Finally, Shannon’s diversity index (SDI), representing the diversity indicator, evaluates the diversity of land use types within the urban boundary, with higher values indicating greater land use variety.
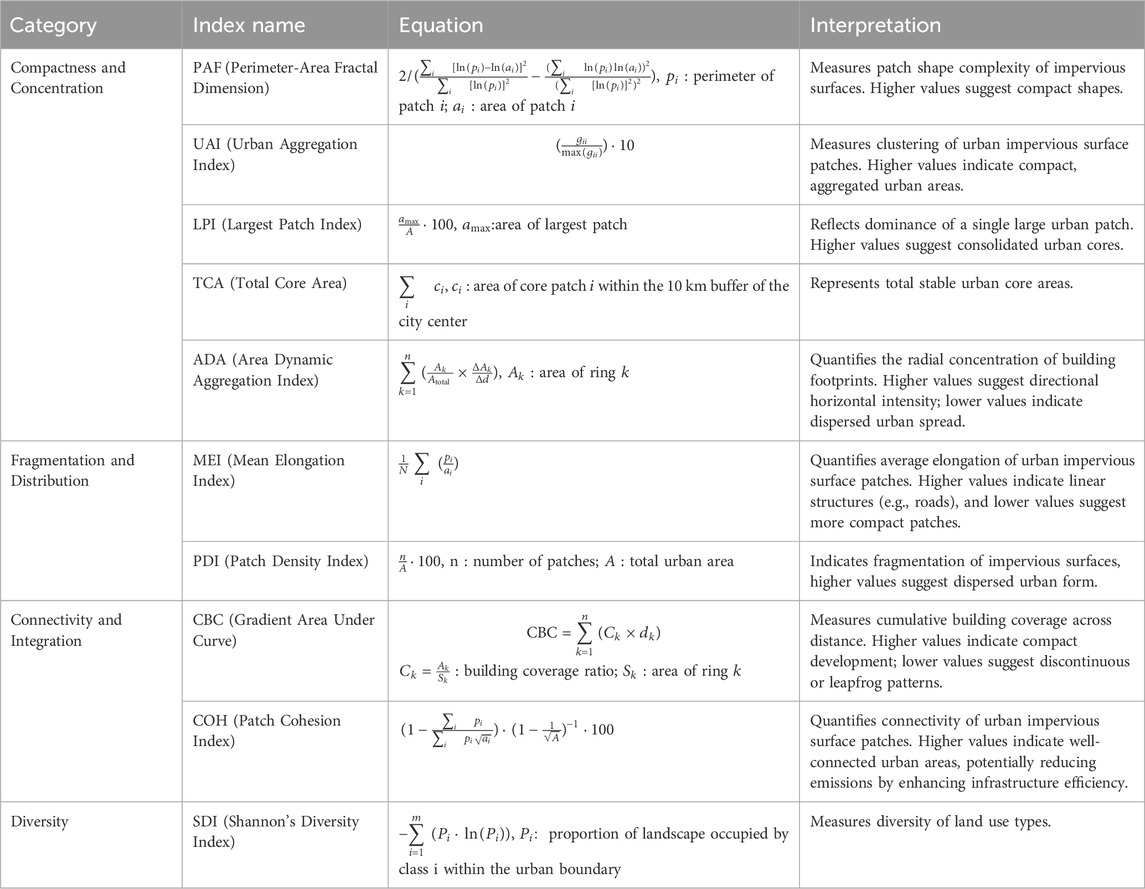
Table 1. Definitions of 2D urban morphological indices.
3.2 3D urban morphological indices
In this study, 3D morphological indices are computed using an innovative concentric zone approach. The analysis focuses on 286 Chinese cities and their government buildings as of 2005. We plot 30 concentric circles at 1 km intervals, radiating outward from the centers of these cities (Figure 2). The selection of government office locations as city center is significant, as urban development typically extends from historic city centers where municipal offices are located, thereby reflecting the spatial expansion patterns of Chinese cities. A 30 km concentric circular buffer is methodologically appropriate for delineating urban extent because it aligns with the spatial zone of most rapid land expansion. In Beijing, land development intensity peaked within the 10–30 km buffer from the city center, marking it as the core zone of outward urban growth and suburban transition (Huang et al., 2020). Similarly, gradient-based urban studies have operationalized buffers up to 30 km, categorizing 0–14 km as urban core, 14–24 km as suburban, and 24–30 km as fringe areas, effectively distinguishing morphological zones within the urban gradient (Ma et al., 2024). Moreover, the 30 km scale bridges neighborhood-focused analysis and city-region planning, offering both conceptual and empirical relevance.
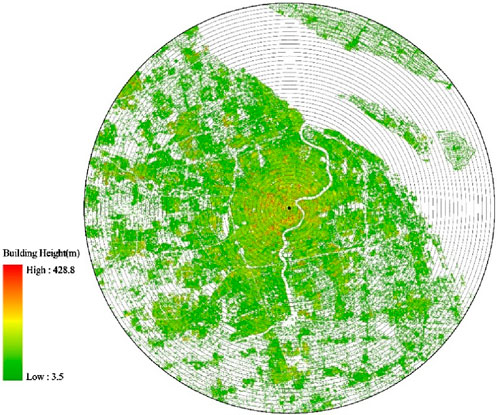
Figure 2. Building height distribution across city’s concentric zones (Shanghai as an example).
These circles define 30 circular geographic buffer zones surrounding each city’s core. We employ building footprints and height data from 2005 to 2020 in 5-year intervals, examining building coverage area, volume, and average height statistics across various buffer zones. Each city is represented by 30 measurements per year. Figure 2 illustrates the building height distribution across the concentric zones of Shanghai. Building height data were sourced from Chen et al. (Chen P. et al., 2025), who utilized the ALOS World 3D 30 m digital surface model (DSM) alongside NASA’s digital elevation model (DEM), global artificial impervious area, and global roads inventory project data. A normalized DSM was generated by calculating the difference between the digital terrain model (DTM) and DSM on Google Earth Engine, resulting in a 30 m national map. Validation against field measurements demonstrated good accuracy for flat/mixed roofs (R2 = 0.81, RMSE = 4.26–3.51 m) across 6 Chinese cities (R2 = 0.64–0.79, RMSE = 4.65–5.35 m), yielding an overall accuracy of RMSE = 4.98 m and R2 = 0.75 (Huang et al., 2022). Data for Chinese cities were collected for 2005, 2010, 2015, and 2020 for this analysis.
The 3D morphological indices employed in this study are determined by referring to similar 3D urban form measurement concepts from previous studies (Li and Zeng, 2024; Liu et al., 2021; Guo et al., 2022), and can be categorized into 3 groups (Table 2). Compactness and concentration indicators in three dimensions focus more on the radial concentration patterns. The volumetric dynamic aggregation index (VDAI) quantifies the radial decrease in volumetric mass of buildings, measuring how building volume is concentrated toward the urban center, and the edge-core volume ratio (ECVR) compares peripheral and core volumes to evaluate the extent of suburban sprawl relative to central concentration. Fragmentation and distribution indicators capture three-dimensional dispersion patterns: the volumetric gradient kurtosis (VGKI) assesses the peakedness of volume distribution along the urban gradient, facilitating differentiation between monocentric and polycentric structures. Whilst the volumetric gradient decay rate (VGDR) measures the average decrease in volume intensity from the city center to the surrounding areas. Connectivity and integration indicators measure synchronized development: the urban gradient synergy index (UGSI) captures the interaction between changes in building heights and coverage, revealing whether vertical and horizontal densities decline concurrently with distance.
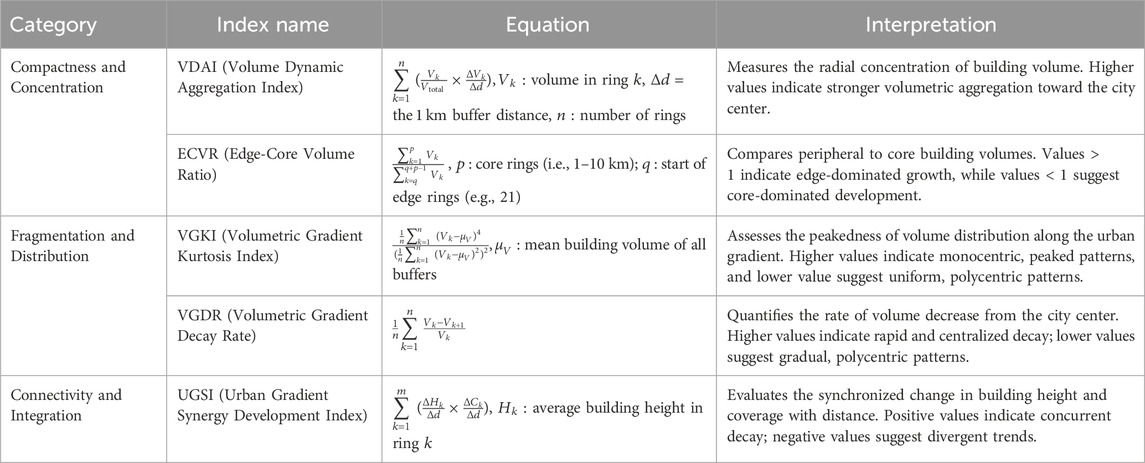
Table 2. Definitions of 3D urban morphological indices.
3.3 Carbon emission data
The open data inventory for anthropogenic CO2 (ODIAC) provides one of the most detailed global estimates of fossil fuel CO2 emissions, with a spatial resolution of 1 km2 (Oda and Maksyutov, 2011). Developed by Japan’s national institute for environmental studies, this inventory uniquely integrates satellite-based nighttime light data with an extensive database of individual power plant emissions and their locations. National totals, derived from energy statistics, are allocated to non-point sources based on calibrated nighttime light radiance, while emissions from more than 17,000 individual power plants are precisely located at their geographic coordinates. This hybrid approach transcends the spatial limitations of population-based or coarse-resolution inventories, accommodating both diffuse urban footprints and concentrated point sources. First published in 2011, ODIAC has undergone numerous refinements and updates since its inception. It now includes NASA’s Black Marble nighttime light product, enhancing estimates in response to recent developments in energy use and urbanization. The ODIAC data can support a variety of applications, including atmospheric CO2 flux inversions and city-scale emission mapping, and serves as a benchmark for fine spatial resolution, globally consistent anthropogenic CO2 modeling. For this study, we utilized a 30 km buffer around the city center for extracting CO2 emissions data from 2005 to 2020, to align with the spatial and temporal scopes of the urban morphological indices.
4 Spatial regression results
4.1 Global and local Moran’s I analysis of CO2 emissions
The global Moran’s I values for CO2 emissions in 2005, 2010, 2015, and 2020 ranged from 0.255 to 0.257, which indicated significant positive autocorrelation with z-scores exceeding 12.890 (Table 3). Local Moran’s I statistics revealed distinct spatial patterns across China. High-High clusters were concentrated in eastern and central provinces, with Shandong, Jiangsu, and Henan identified as high-emission areas. In contrast, Low-Low clusters dominated the western regions, particularly in Tibet and Qinghai, which were characterized as low-emission areas. High-Low and Low-High outliers were observed in transitional zones between these clusters, suggesting that the spatial aggregation of high CO2 emissions was significantly influenced by economic and industrial development patterns in eastern China, as illustrated in Figure 3.
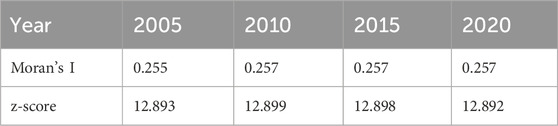
Table 3. Global Moran’s I statistics for CO2 emissions in Chinese cities (2005–2020).
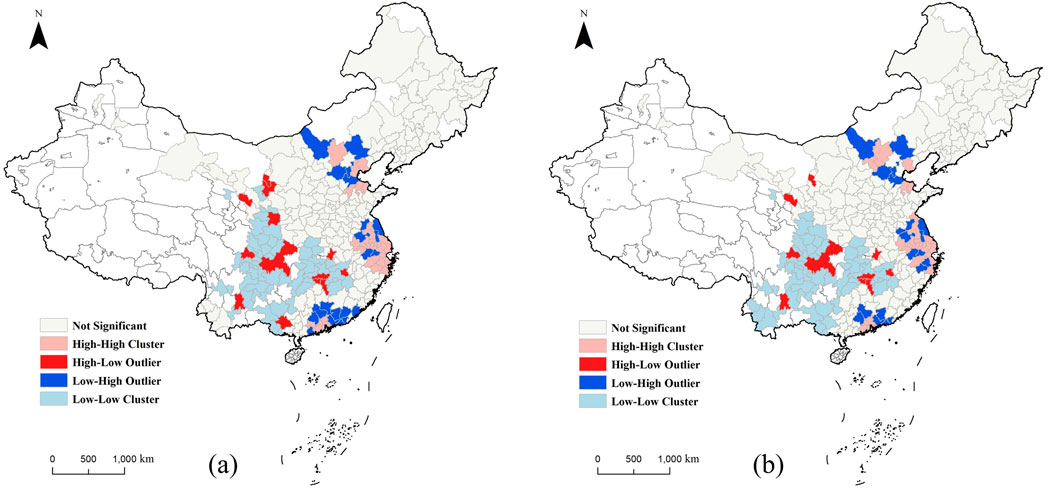
Figure 3. Local Moran’s I analysis results of carbon emissions for year 2005 (a) and year 2020 (b).
Morphological characteristics varied significantly among cities, as detailed in Table 4. PAF exhibited an average fusiform shape complexity with a mean of 1.33. MEI averaged 866.65, demonstrating drastic heterogeneity across cities. TCA was notably heterogeneous with a mean of 23,313.93, while PDI displayed a wide range, reflecting urban density variations. Aggregation and connectivity were strong across the studied cities. UAI showed a mean of 85.52, and COH averaged 98.03, indicating well-connected urban areas. LPI presented the greatest variability, reaching up to 50.04, whereas SDI showed a mean of 0.262, suggesting low to moderate diversity. Both VDAI and ADA were low and consistent, while the ECVR was highly variable.
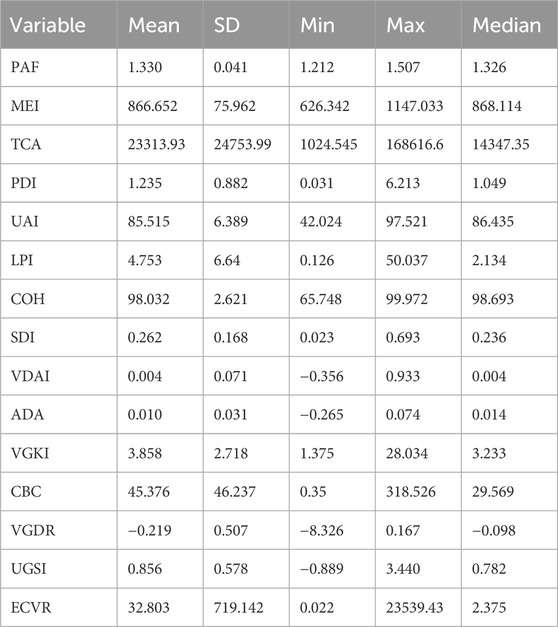
Table 4. Descriptive statistics of morphological indices.
CO2 emissions displayed significant positive correlations with several morphological indices. The strongest correlations were observed with TCA at 0.808, LPI at 0.805, and CBC at 0.739, suggesting that emissions increased with larger and more aggregated patches. Moderate correlations were found with UAI at 0.444 and SDI at 0.696, while weak-to-moderate correlations were observed with PDI at 0.121 and COH at 0.313. Weak negative correlations were noted with PAF and MEI, though the correlation with PAF was not significant. UGSI also showed a weak negative correlation at −0.199. The indices VDAI, ADA, VGDR, and ECVR showed very weak correlations with emissions. Notably, TCA emerged as a strong predictor of both LPI with a correlation of 0.954 and SDI with a correlation of 0.930, as shown in Figure 4.
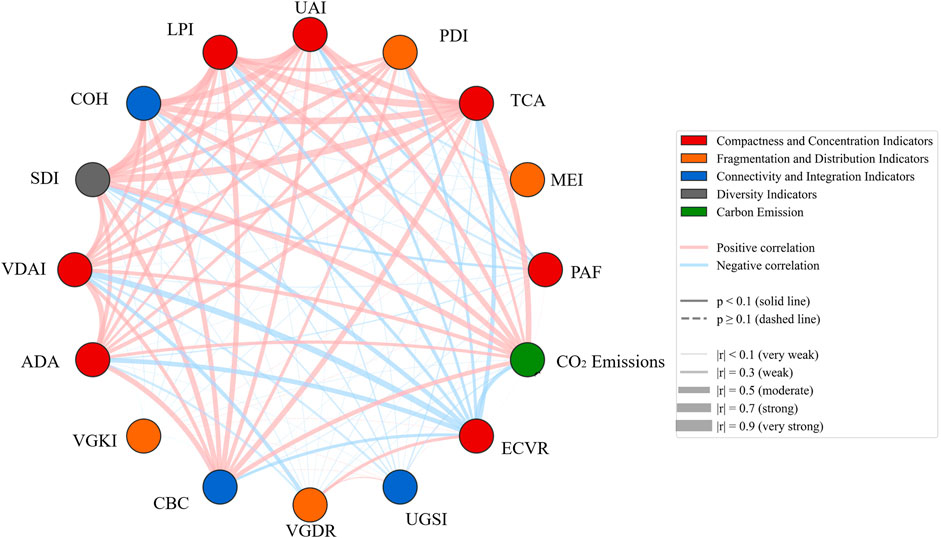
Figure 4. Correlations between urban morphological indices and carbon emissions.
4.2 Results of spatial regression models for CO2 emissions
The spatial regression analysis showed consistent patterns across the study period, with the SEM emerged as the superior model. These findings illuminated the fundamental spatial dependence structure underlying urban carbon emissions and showed how morphological factors operated through spatially mediated mechanisms. In 2005, whilst the OLS model yielded an R2 of 0.642, the SEM outperformed other models with an R2 of 0.701. The improvement over OLS (ΔR2 = 0.059) indicated that approximately 6% of emission variance was explained by spatially correlated unobserved factors, suggesting that urban carbon dynamics were fundamentally influenced by spillover effects from neighboring cities through shared infrastructure networks, economic linkages, and regional industrial policies. The SEM included a spatial error term λ of 0.487 and demonstrated an AIC of 485.56, thereby effectively eliminating the residual autocorrelation. Although the SDM performed slightly better with an R2 of 0.702, its higher AIC of 497.99 and the fact that only the lagged UAI proved significant reinforced the preference for the SEM (Table 5).
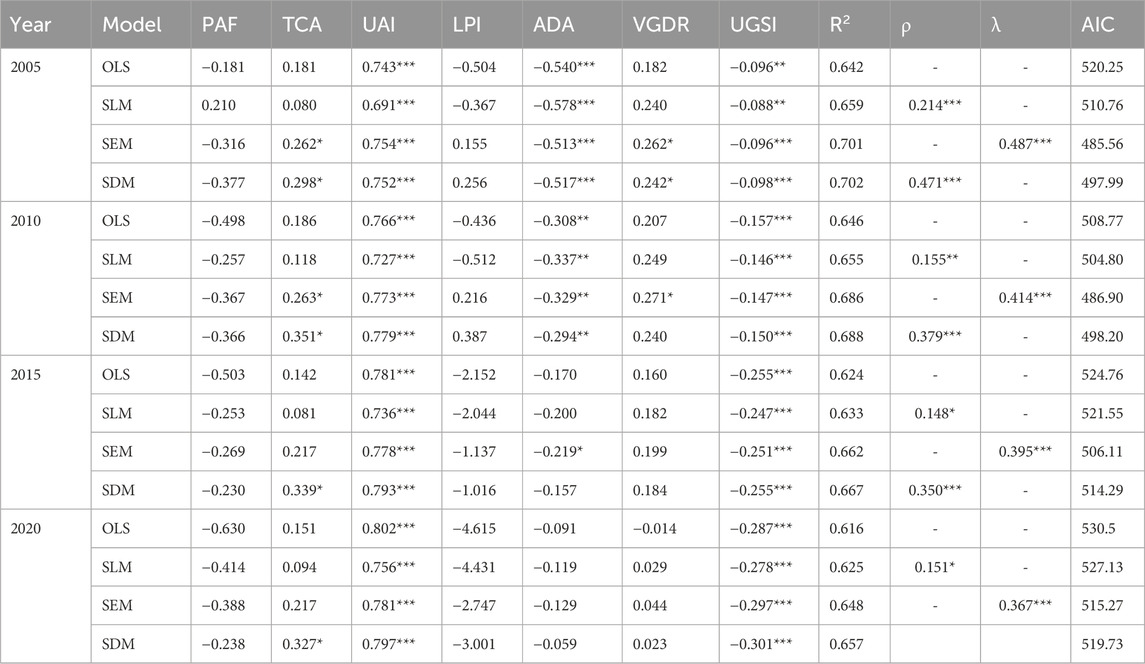
Table 5. Results of OLS, SLM, SEM, SDM regression models for CO2 emissions in year 2005,2010, 2015, and 2020.
The temporal evolution of model performance displayed critical insights into China’s changing urban carbon landscape. For 2010, the OLS model had an R2 of 0.646. The SEM produced an R2 of 0.686 with a λ of 0.414 and an AIC of 486.90, showing no residual autocorrelation. The decline in spatial error coefficient from 0.487 to 0.414 suggested that inter-city spatial dependence in carbon emissions had weakened over time, which potentially reflected the increasing importance of city-specific policies and technological innovations that had differentiated emission patterns across neighboring urban areas. In 2015, the OLS model recorded an R2 of 0.624. The SEM achieved an R2 of 0.662 with λ of 0.395 and AIC of 506.11. The continued decline in spatial dependence coupled with slightly reduced overall explanatory power suggested the increased urban carbon heterogeneity, where local morphological characteristics had begun to dominate regional patterns. By 2020, the OLS model had an R2 of 0.616. The SEM fitted with an R2 of 0.648, a λ of 0.367, and an AIC of 515.27. The further reduction in spatial dependence (λ = 0.367) reflected the maturation of China’s urban system, where cities had developed increasingly distinct carbon profiles based on their specific morphological characteristics and local policy environments.
Across all years studied, the SEM consistently provided the best fit. This superiority was evidenced by the lowest AIC values, ranging from 485.56 in 2005 to 515.27 in 2020, and a lack of residual spatial autocorrelation with Moran’s I p-values exceeding 0.5, compared to OLS, SLM, and SDM models. While the SDM offered marginal R2 improvements, these were accompanied by higher AIC values and generally insignificant lagged covariates. Likelihood ratio tests confirmed the significance of spatial effects. The SEM’s ability to account for spatially dependent errors while avoiding the empirical need for lagged covariates rendered it the most parsimonious model. Although the SLM outperformed the OLS model, it still exhibited residual autocorrelation, which further supported the choice of SEM. The insignificance of spatially lagged covariates (
4.3 Importance of the independent variables and trends over time
Elasticity, defined as the percentage change in CO2 emissions in response to a 1% change in the predictor variable, could be interpreted through the SEM coefficients as reflecting the relationship between urban compactness and CO2 emissions. Among compactness indicators, UAI emerged as the most influential predictor of CO2 emissions. The elasticity of emissions with respect to UAI increased from 0.754 in 2005 to 0.781 in 2020, indicating an intensifying relationship where urban clustering became increasingly carbon-intensive. This strengthening effect suggested that while compact development initially provided efficiency gains, Chinese cities may have been approaching or exceeding optimal density thresholds where agglomeration diseconomies, including congestion, concentrated industrial activities, and infrastructure stress, began to outweigh the carbon benefits of compactness.
TCA’s moderate significance primarily in 2010 reflected the critical period when China’s urbanization accelerated after 2008. During this phase, core area expansion became a key determinant of emission patterns, suggesting that the spatial organization of urban centers played a crucial role in carbon dynamics during rapid growth periods. The temporal dynamics of ADA demonstrated a fundamental transition in how directional urban expansion influenced emissions. ADA depicted significant negative effects in the early study years, with a 1% increase associated with 0.513% emission reduction in 2005 and 0.329% reduction in 2010. Nevertheless, this effect became insignificant by 2015–2020. This evolution suggested that during the initial phase (2005–2010), directional compact growth effectively reduced emissions through infrastructure efficiency and reduced sprawl. However, as cities matured and growth patterns stabilized, the carbon benefits of directional development diminished.
UGSI’s evolution represented perhaps the most significant finding for urban carbon management. Its negative impact intensified dramatically over time, with elasticity increasing from −0.096 in 2005 to −0.297 in 2020. This tripling effect revealed that synchronized vertical-horizontal development had become increasingly critical as Chinese cities transitioned from extensive to intensive growth models. The intensifying effectiveness suggested that as urban land became scarce and development became more three-dimensional, the coordination between building height and coverage became a primary determinant of carbon efficiency.
5 GeoShapley analysis of urban morphology and carbon emissions
5.1 Model fitting results of GGPR
The GGPR filtered morphological variables for each year of the study period by computing mutual information (MI) scores between CO2 emissions and all predictors. Morphological variables with MI scores above a threshold of 0.1 were selected, to ensure only those with significant predictive power were retained for modeling, while less informative variables were excluded if their MI scores fell below the threshold (Paninski, 2003). The GGPR model demonstrated exceptionally strong performance across all years with consistently low mean absolute percentage error (MAPE) values ranging from 1.6% to 2.4%, indicating excellent relative accuracy in predicting CO2 emissions. While absolute error metrics increased over time, with mean absolute error (MAE) rising from 43,634 in 2005 to 77,497 in 2020 (a 78% increase) and RMSE increasing from 76,432 to 122,961 (a 61% increase), the R2 values remained remarkably stable at 0.999 across all years from 2005 to 2020 (Table 6).
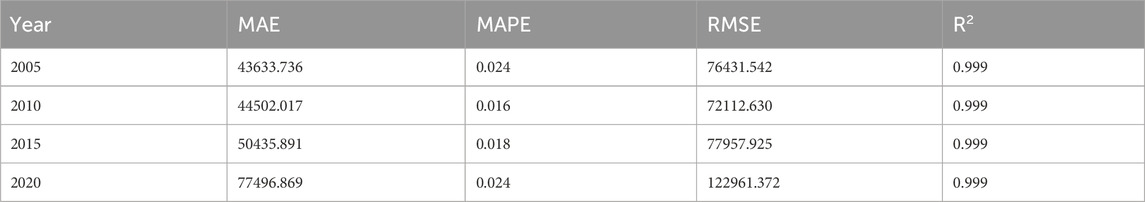
Table 6. Model fitting results of GGPR in year 2005,2010, 2015, and 2020.
The GeoShapley analysis revealed complex spatial patterns in how urban morphological characteristics influenced carbon emissions across Chinese cities between 2005 and 2020, as seen in Figures 5, 6, Supplementary Figures S1, S2. Contrary to conventional expectations, several key urban form indicators demonstrated predominantly negative contributions to emissions, suggesting that certain aspects of urbanization actually mitigated carbon output. LPI exhibited a consistently negative impact on emissions, with mean GeoShapley values of −1.924 × 10⁶ (±1.256 × 10⁶) in 2005 evolving to −1.300 × 10⁶ (±1.506 × 10⁶) in 2020. This finding indicated that larger continuous urban patches facilitated more efficient infrastructure and reduced per capita emissions. Only 12.9% of cities showed positive LPI values by 2020, concentrated primarily in rapidly expanding second-tier cities. The spatial distribution showed a clear east-west gradient, with eastern coastal megacities showing less negative values while western cities demonstrated strongly negative values.
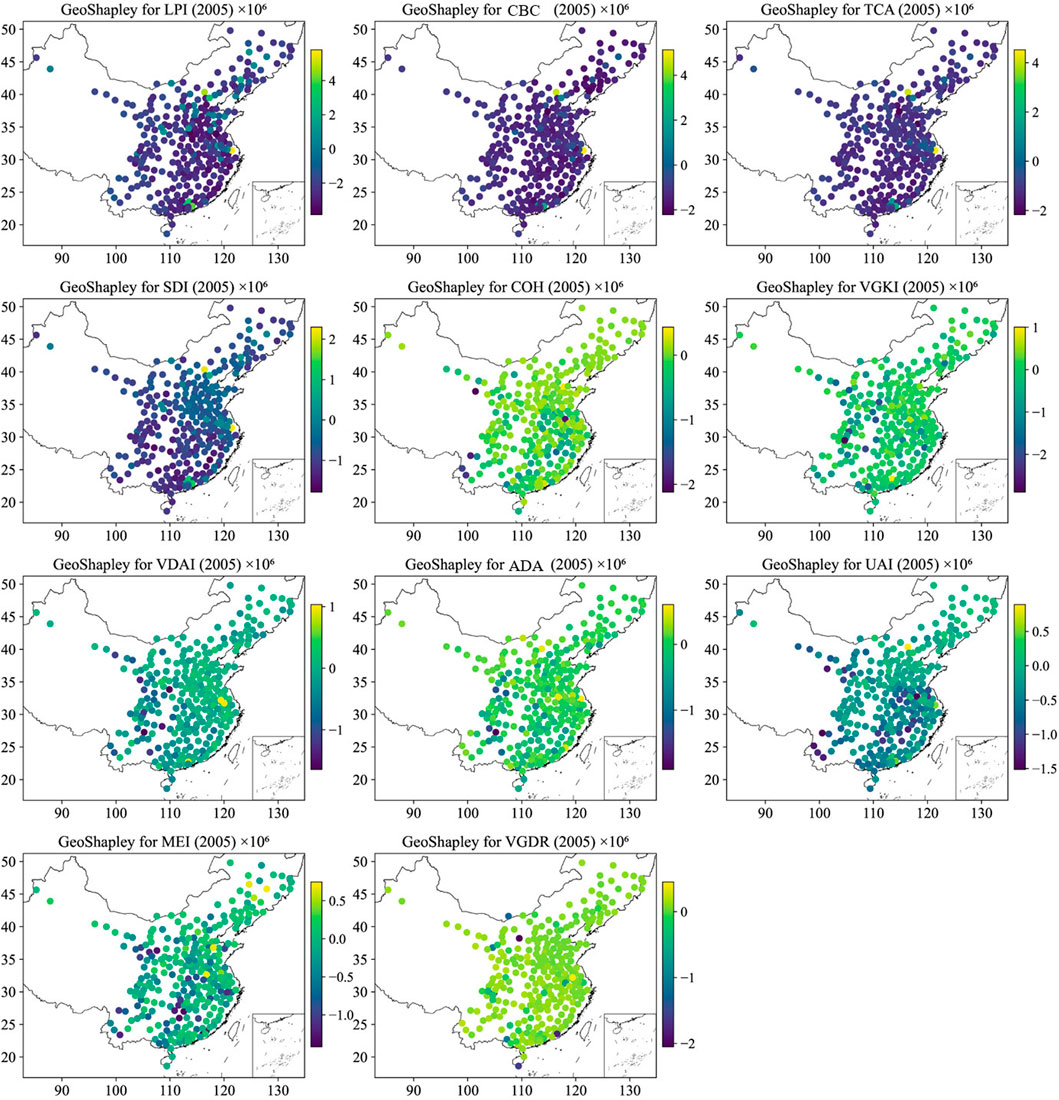
Figure 5. Summary of GeoShapley values for urban form indicators affecting carbon emissions in 2005 (Each point represents a city, with variables ordered by mean absolute GeoShapley value. Positive values indicate factors that increase carbon emissions, while negative values indicate factors that decrease emissions).
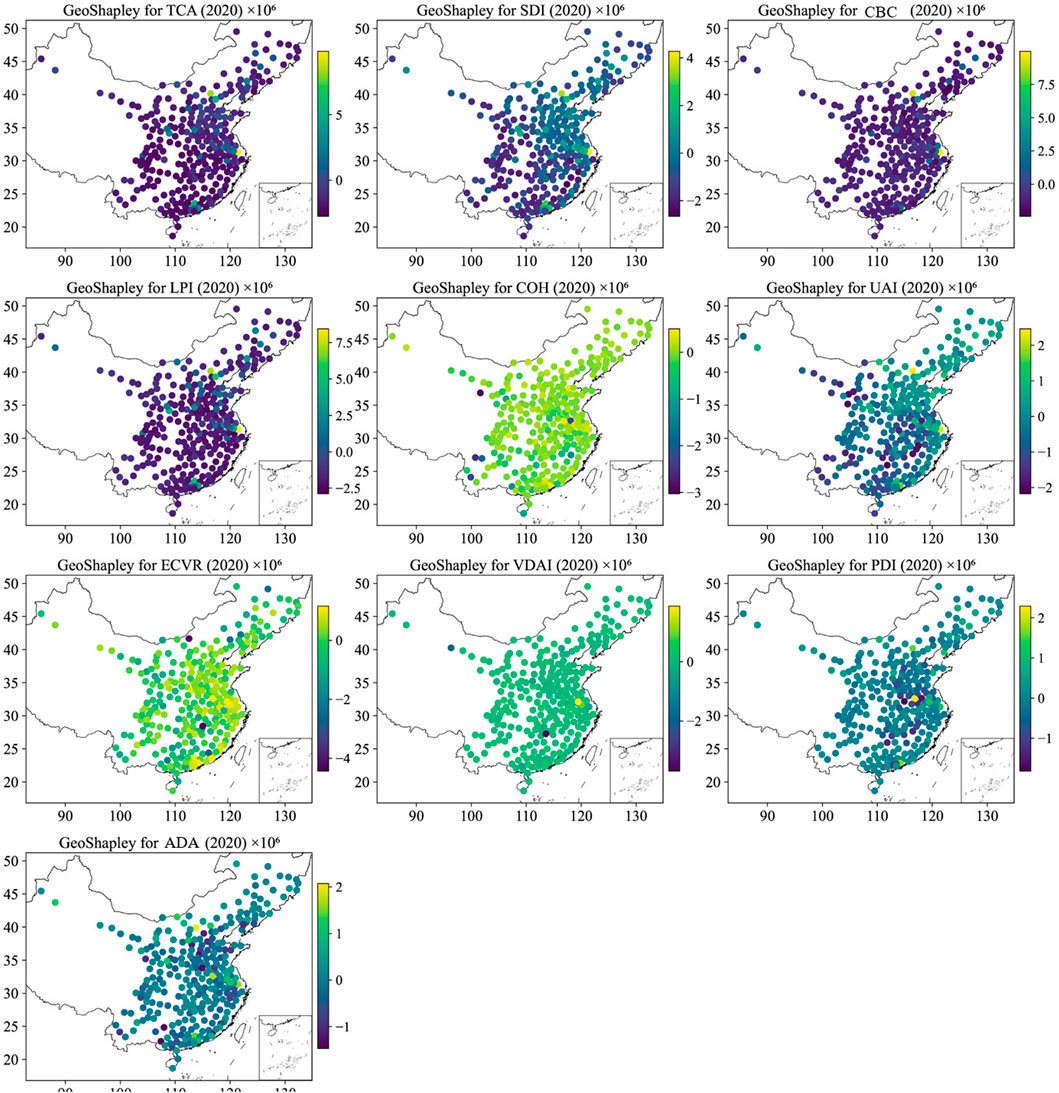
Figure 6. Summary of GeoShapley values for urban form indicators affecting carbon emissions in 2020.
COH presented a nuanced picture, transitioning from slightly negative mean values of −0.106 × 10⁶ (±0.337 × 10⁶) in 2005 to −0.103 × 10⁶ (±0.387 × 10⁶) in 2020. Approximately 48.6% of cities showed positive COH values by 2020, indicating substantial spatial heterogeneity. Eastern metropolitan areas demonstrated positive contributions, while central and western cities predominantly showed negative values, suggesting that urban connectivity’s impact on emissions was highly context-dependent. TCA showed the strongest negative association with emissions among compactness indicators, with mean values of −1.053 × 10⁶ (±0.610 × 10⁶) in 2005 deepening to −1.226 × 10⁶ (±1.503 × 106) by 2020. This increased variance indicated growing spatial differentiation, with only 21% of cities showing positive TCA values in 2020, primarily provincial capitals and major economic centers where larger urban cores concentrated high-emission activities. Fragmentation indicators revealed important regional variations. PDI demonstrated predominantly negative but weak effects with mean values of −0.069 × 10⁶ (±0.441 × 10⁶) in 2020. The quartile distribution (Q25 = −0.292 × 10⁶, Q50 = −0.059 × 10⁶, Q75 = 0.121 × 10⁶) revealed significant regional variation, with central Chinese cities, particularly in Henan and Hubei provinces showing positive PDI values, suggesting that fragmented development in these rapidly urbanizing regions increased emissions. SDI maintained consistently negative impacts, with mean values of −0.768 × 10⁶ (±0.512 × 10⁶) in 2005 shifting to −0.706 × 10⁶ (±1.059 × 10⁶) in 2020.
Meanwhile, 3D urban form indicators demonstrated evolving patterns. VDAI showed a notable reversal from negative values of −0.107 × 10⁶ (±0.335 × 10⁶) in 2005 to slightly positive values of 0.025 × 10⁶ (±0.326 × 106) by 2020, representing the only indicator to transition from negative to positive mean impact. This suggested that asymmetric vertical development patterns were increasingly associated with higher emissions, particularly in rapidly verticalizing cities. ECVR showed mean values of −0.055 × 10⁶ (±0.711 × 106) by 2020, with substantial spatial variation. Eastern coastal cities tended toward positive values while inland cities showed negative contributions, reflecting different peripheral development patterns.
The spatial distribution maps from 2005 to 2020 revealed evolving regional patterns. Eastern coastal regions consistently showed less negative or slightly positive GeoShapley values across most indicators, suggesting that mature urbanization in these areas had reached a point where further densification might increase emissions. Central regions exhibited high variance across all indicators, reflecting cities in rapid transition with diverse development trajectories. Western regions consistently showed strongly negative values across most indicators, showing that urbanization patterns in these cities helped mitigate emissions, possibly due to lower development intensity. Northeast regions demonstrated unique patterns with increasingly negative values over time, potentially reflecting economic restructuring and population decline. One of the most interesting findings was the paradigm shift in understanding urban compactness impacts. Moreover, compactness indicators (LPI, TCA, CBC) predominantly showed negative associations with emissions, with CBC values of −1.149 × 10⁶ (±0.681 × 10⁶) in 2005 evolving to −0.851 × 10⁶ (±1.191 × 10⁶) in 2020. The coefficient of variation for most indicators increased between 2005 and 2020, indicating growing spatial differentiation in how urban form influenced emissions. The impact of urban morphology on emissions proved highly dependent on regional development stage, with mature eastern cities showing different patterns than developing central and western cities. While horizontal compactness reduced emissions, asymmetric vertical development showed increasing positive associations with emissions, which clearly suggested the need for balanced three-dimensional urban planning.
5.2 Spatiotemporal changes in the morphology-emission relationship
Feature importance analysis revealed a fundamental reorganization of urban carbon drivers (Figure 7; Supplementary Figures S3–S5). The LPI consistently dominated as the most important predictor over the study period, with stable importance values ranging from 1.820 to 2.152 × 10⁶ between 2005 and 2020 (Figure 8). This consistency suggested that patch dominance served as a core organizing principle in urban carbon systems, persisting despite temporal variations in technology, policy, and economic conditions. The observed stability of LPI’s influence indicated that the spatial configuration of the largest urban patches produced path-dependent carbon emission patterns that remained robust in the face of shorter-term interventions. A dramatic rise of TCA was also detected: it grew from a secondary importance of 1.146 × 10⁶ in 2005 to nearly matching LPI (1.695 × 106) by 2020 (Figure 8). This approximately 48% increase indicated a critical transition in urban carbon dynamics. It suggested that as Chinese cities matured, the cumulative effect of multiple urban cores became more influential than that of a single large patch. This evolution mirrored China’s shift from monocentric to polycentric urban structures, wherein the aggregate carbon impact of distributed urban centers increasingly outperformed traditional core–periphery patterns. The categorical analysis found a fundamental shift in emission drivers, with compactness and concentration indicators increasing their collective contribution from 58.13% in 2005 to a peak of 69.54% in 2015, before moderating to 65.73% in 2020 (Figure 7; Supplementary Figures S3–S5). This trajectory indicates that urban compactness has become the overwhelmingly dominant morphological characteristic influencing emissions, while connectivity and integration indicators showed a corresponding decline from 20.47% in 2005 to 16.00% in 2015, suggesting that as cities densified, the role of inter-patch connectivity diminished relative to concentration effects.
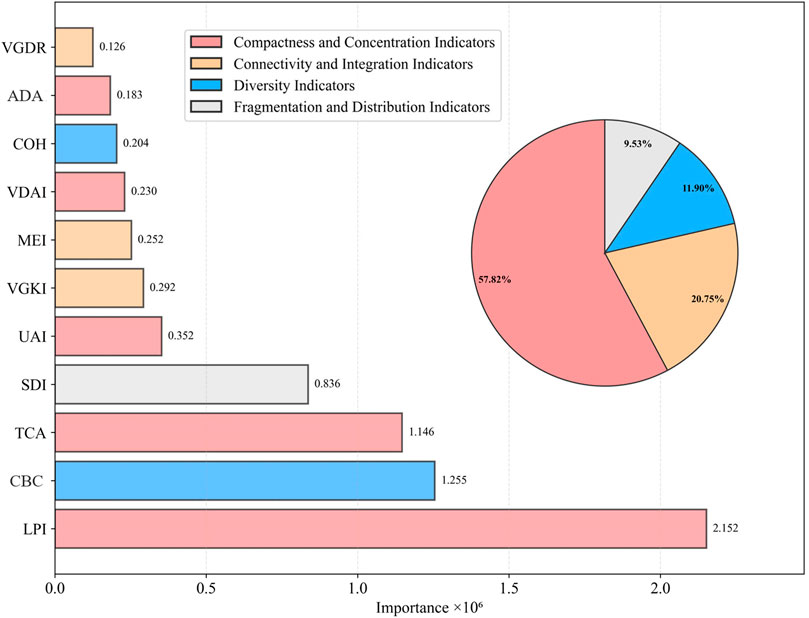
Figure 7. Feature importance ranking of urban form indicators based on mean absolute GeoShapley values and relative contribution of different urban form indicator categories to carbon emission predictions in 2005.
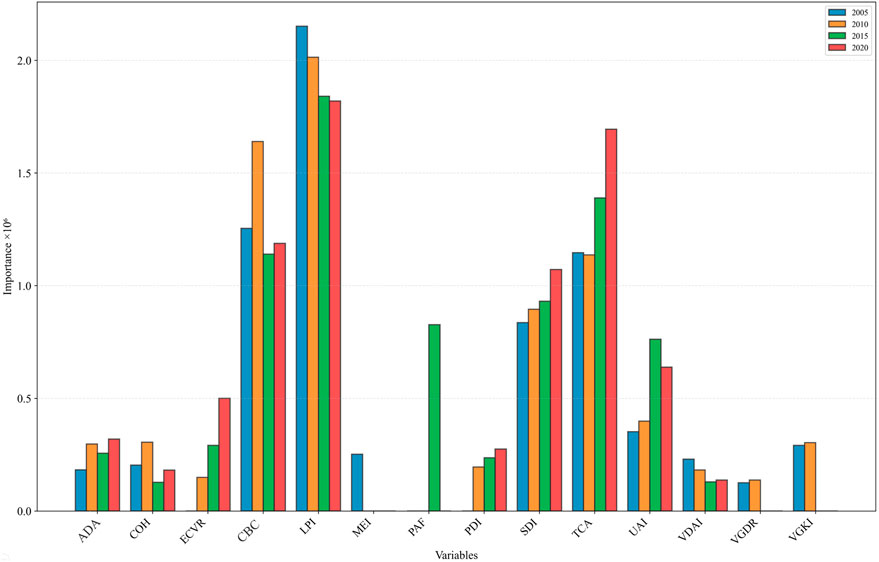
Figure 8. Temporal evolution of urban form indicator importance for carbon emission prediction from 2005 to 2020.
GeoShapley spatial interaction analysis indicated the emergence of location-dependent morphological effects that fundamentally challenged universal urban planning approaches. GEO exhibited the widest value distribution (−10.0 to 7.5 × 10⁶), confirming that geographical context acted as a meta-variable moderating all morphological relationships. This result implied that identical urban forms yielded markedly different carbon outcomes depending on their geographical location. Interaction terms further demonstrated the evolution toward spatially contingent urban carbon systems. The coefficient for LPI × GEO was predominantly positive and increased from approximately 2.5 × 10⁶ in 2005 to 5.0 × 106 by 2020 (Figure 9; Supplementary Figure S6). This doubling effect suggested that large urban patches increasingly incurred location-specific carbon penalties, likely reflecting regional variations in energy systems, industrial structures, and transportation networks as Chinese cities expanded. Finally, the emergence of 3D morphological interactions during 2015–2020 marked a paradigm shift in urban carbon determinants. Both VDAI × GEO and ECVR × GEO acquired measurable impacts (around 1.0 × 10⁶) that had been absent in earlier periods. This finding indicated that vertical urban development began producing regionally differentiated carbon impacts. It suggested that future urban carbon management must integrate vertical development patterns and geographical context—moving beyond traditional 2D planning frameworks.
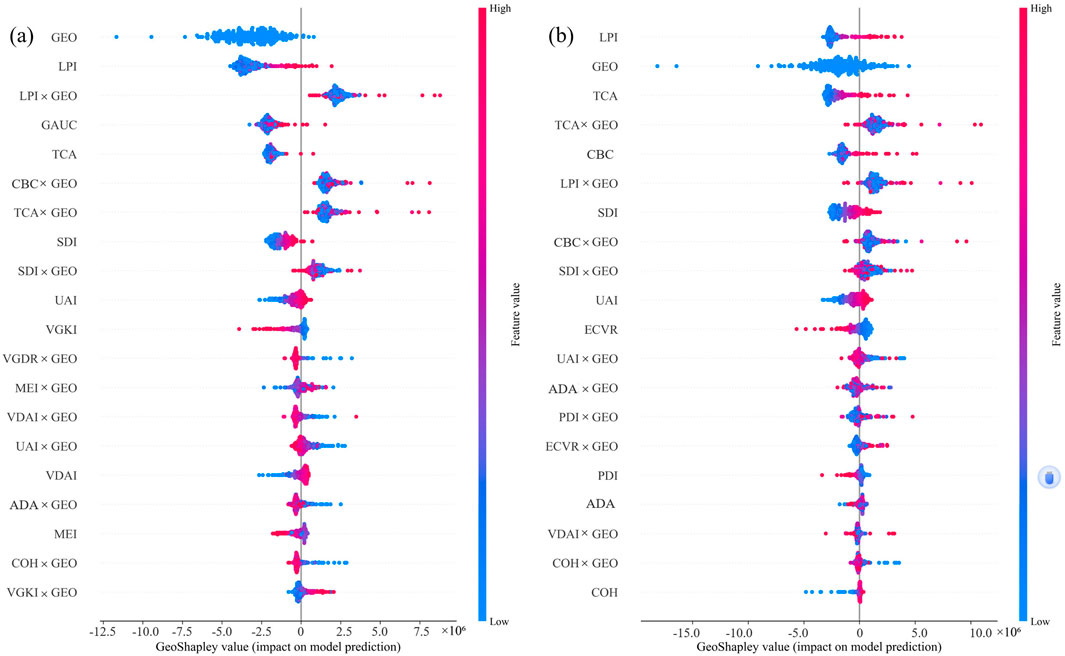
Figure 9. Partial dependence plots showing the marginal effects of urban form indicators on carbon emissions in (a) 2005 and (b) 2020.
5.3 Non-linearities and threshold effects
The threshold analysis discovered distinct patterns in the relationship between urban morphological indices and CO2 emissions over the study period (Figures 10, 11; Supplementary Figures S7, S8). Among the key findings, several morphological indices demonstrated evolving relationships with carbon emissions across the examined years. LPI exhibited positive GeoShapley values when exceeding thresholds of approximately 15. And TCA consistently showed positive contributions when exceeding thresholds ranging from 100,000 in 2005–2010 to 50,000 in 2015–2020, suggesting that extensive core urban areas were associated with higher emission levels. SDI showed monotonic increases with positive contributions above thresholds of 0.6 in 2005, progressively lowering to around 0.45 in 2015 and 2020. COH exhibited positive contributions with thresholds of around 97. UAI similarly maintained positive relationships when exceeding thresholds around 88–92 across all years. The temporal dynamics of 3D morphological indicators revealed particularly complex evolutionary patterns. VGKI underwent a notable transformation, showing positive contributions when values fell below 4 in 2005 and below 6 in 2010. VDAI demonstrated non-linear relationships that shifted dramatically over time, with positive contributions observed in the range of −0.03 to 0.14 in 2005, expanding to 0.0 to 0.2 in 2010, then shifting to −0.02 to 0.23 in 2015, before transitioning to a monotonic decrease pattern by 2020.
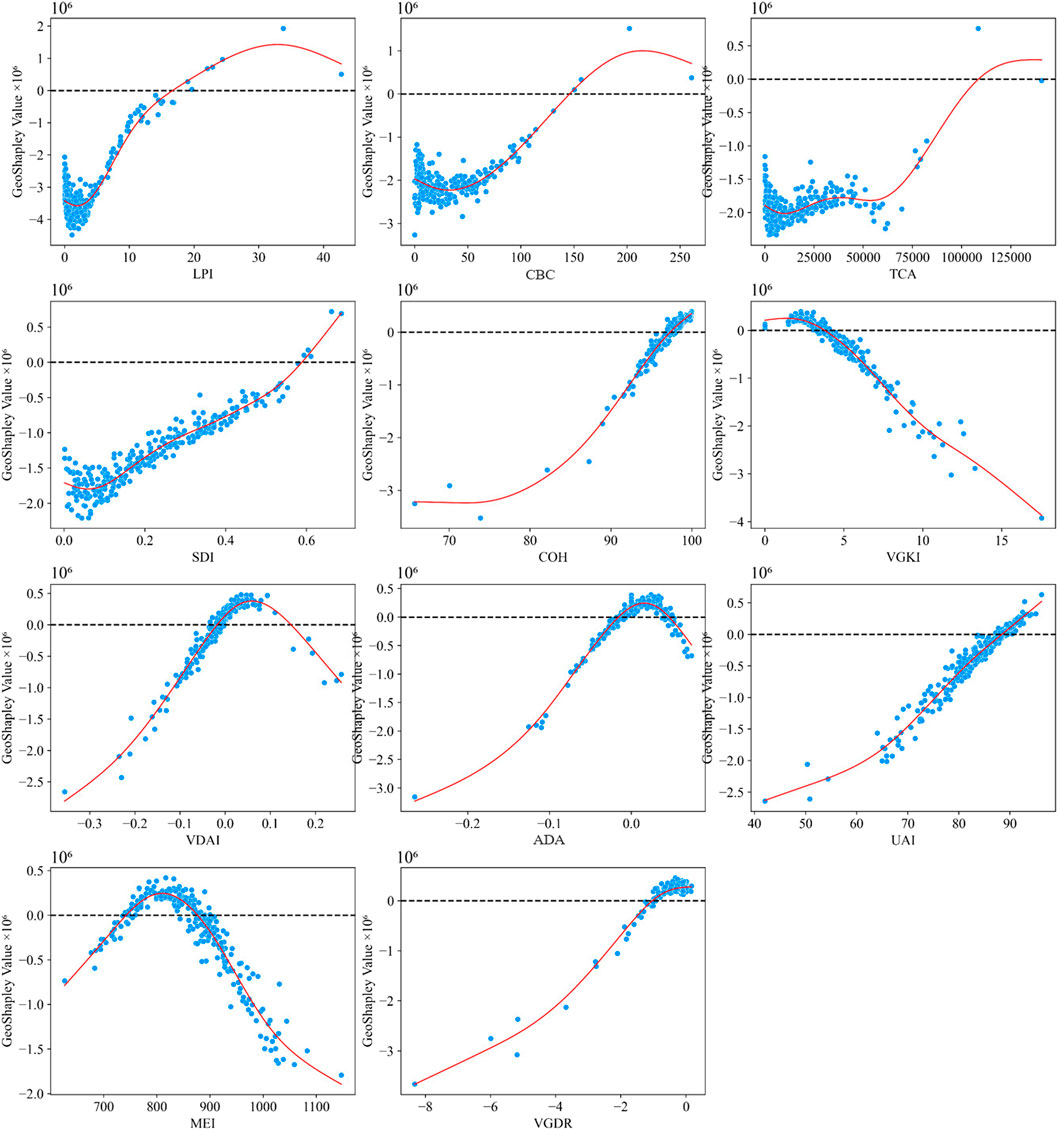
Figure 10. The relationship between morphological indices and urban carbon emissions (year 2005).
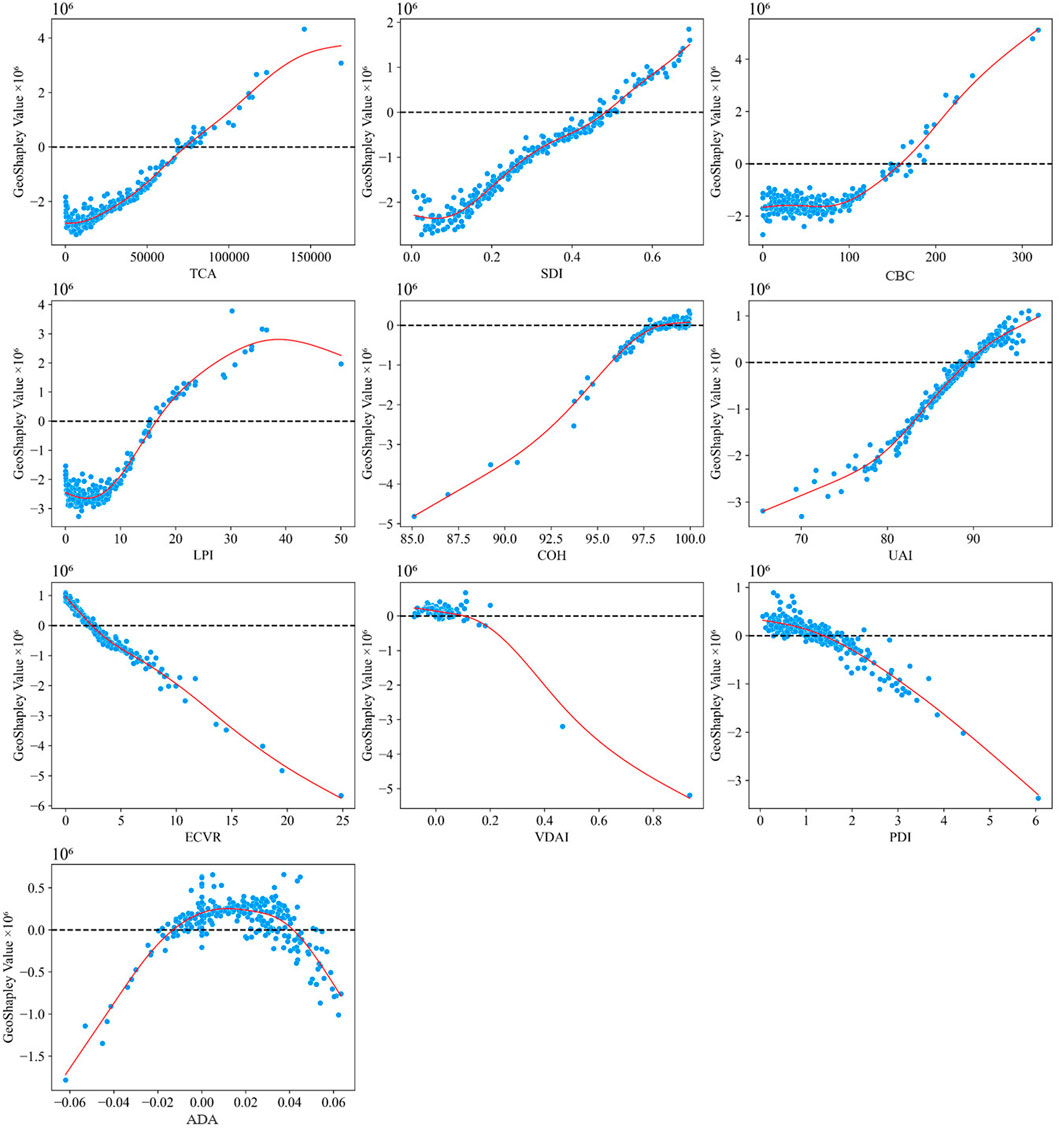
Figure 11. The relationship between morphological indices and urban carbon emissions (year 2020).
The analysis also revealed patterns of threshold evolution and emergence of new factors over time. PDI showed positive contributions below thresholds of 1.7 in 2010, within the range 1.1–1.9 in 2015, and below 1.4 in 2020, indicating that moderate patch density levels were associated with higher emissions. ECVR showed monotonic decrease patterns with positive contributions below 13 in 2010, dropping to below 4 in 2015 and below 2 in 2020, highlighting the growing importance but diminishing threshold of edge effects in urban carbon dynamics. ADA maintained relatively stable positive contribution ranges across all years, typically between −0.02 and 0.06, suggesting consistent impacts of directional horizonal urban development patterns on emissions. Most significantly, the analysis revealed that CBC consistently showed positive contributions above thresholds ranging from 213 in 2005 to values around 150–160 in later years, while VGDR transitioned from positive contributions above −0.3 in 2010 to showing no clear patterns in subsequent years. The general trend toward lower thresholds and narrower positive contribution ranges for many indices over time potentially indicated improved urban planning practices and more efficient urban forms that had successfully reduced fragmentation-related emissions by 2020.
Furthermore, bootstrap resampling with 1,000 iterations quantified threshold uncertainty and temporal stability of morphological metrics from 2005 to 2020. Coefficient of variation (CV) and 95% confidence intervals were computed, with stability classified based on cross-year CV and confidence interval (CI) overlap. LPI, COH, and UAI exhibited high temporal stability (CV < 0.10, CI overlap > 60%). LPI maintained a stable threshold around 15 (CV = 0.067), with narrow confidence intervals, confirming its reliability as a threshold indicator. COH and UAI showed stable thresholds (CV = 0.084 and 0.093, respectively). Whilst VDAI and ECVR displayed higher variability, indicating context-dependent thresholds. Of 15 metrics, 7 achieved high to very high stability, with CV < 0.10, 4 showed moderate stability, with CV ranges from 0.10 to 0.15), and 4 had low to very low stability, with CV > 0.15.
6 Discussions and limitations
This study significantly advances our understanding of how urban morphology affects CO2 emissions by addressing critical gaps identified through our literature review. Specifically, it explores the non-linear relationships between urban morphological parameters and carbon emissions within the urban core areas, as well as the temporal dynamics of these relationships. By employing a combination of linear spatial regression models (OLS, SLM, SEM, SDM) and contrasting their performances with GGPR and GeoShapley explainability methods, we observed both linear and non-linear, spatially varying associations between urban form and emissions across 286 Chinese cities from 2005 to 2020. In this section, we discuss how these findings address the identified gaps, their implications for carbon management in light of spatial heterogeneity, and potential limitations that require further investigations.
6.1 Reconciling linear and non-linear relationships in morphology-emission dynamics
This study discovers a fundamental duality in how urban morphological characteristics influence carbon emissions, as observed through a triangulation of spatial regression, threshold modeling, and GeoShapley analysis. While spatial regression models consistently identify UAI as the strongest positive predictor of emissions, with elasticity ranging from 0.754 to 0.781. GeoShapley analysis presents a contrasting picture, revealing predominantly negative UAI contributions (−0.312 × 10⁶ to −0.316 × 10⁶) across spatial contexts. Rather than contradiction, this divergence reflects the differing lenses of analysis: spatial regression captures system-wide average relationships, indicating that more aggregated cities emit more carbon in total due to economic clustering and intensified activity, whereas GeoShapley highlights local efficiency patterns, showing that aggregation often reduces per capita emissions by enabling infrastructure sharing, reduced travel distances, and spatial compactness.
This apparent paradox extends to other compactness indicators such as LPI, TCA, and CBC. GeoShapley reveals negative associations between these metrics and emissions, yet threshold analysis shows that once values exceed critical limits, such as LPI > 15 or TCA > 50,000, these same traits begin to increase emissions. This nonlinear tipping behavior suggests that cities initially benefit from agglomeration economies, but beyond certain morphological thresholds, diseconomies such as congestion, longer intra-urban trips, and concentrated industrial outputs offset early gains. Over time, these thresholds have shifted, TCA’s critical value declined from 100,000 to 50,000 between 2005 and 2020, which indicates adaptive morphological recalibrations under policy and land-use constraints.
6.2 The evolving role of 2D versus 3D morphological indicators in carbon management
Our finding that 3D morphological indicators emerged as significant carbon emission predictors by 2015–2020 represents a critical advancement beyond traditional 2D-focused studies. While earlier research by Fang et al. analyzing 30 Chinese provincial capitals relied exclusively on 2D morphological variables achieving R2 values of 0.13–0.18 (Fang et al., 2015), our GGPR approach incorporating 3D morphological variables achieved R2 values consistently above 0.99. This surpasses even recent studies like Tian et al. examining Wuhan, which introduced advanced 3D indicators including sky view factor and street topology but achieved lower explanatory power using random forest models (Tian et al., 2024). Particularly critical is our discovery that UGSI’s emission reduction impact tripled from −0.096 to −0.297, demonstrating that synchronized vertical-horizontal development has become the most powerful morphological mitigation factor, a finding that extends beyond Wang et al.’s analysis of 53 Chinese cities, which found building height increased energy consumption while building volume reduced it, but did not capture the synergistic effects of synchronized development (Wang et al., 2024).
The transition we document from 2D to 3D dominance aligns with but extends beyond recent methodological advances in the field. Hong et al.’s literature review noted that although most past research has focused on 2D metrics to describe urban layout and density, 3D measures such as volumetric density and building elevation are gaining importance in shaping policy frameworks (Hong et al., 2022b). Our temporal analysis reveals the dynamic nature of this transition: VDAI shifted from negative to positive impacts over the study period, marking a critical threshold where asymmetric vertical development transformed from an efficiency strategy to an emission liability. This temporal dimension was overlooked in Wang et al.’s commercial building analysis in Beijing, which established correlations between building shape factor and carbon emissions but remained static in approach (Wang et al., 2023).
Our GeoShapley analysis advances the field by revealing location-specific variations that reconcile conflicting findings in previous research. Our findings demonstrate that the same 3D indicators can reduce per capita emissions in developing western cities while increasing them in saturated eastern megacities. The emergence of significant 3D interaction terms (VDAI × GEO, ECVR × GEO) by 2015–2020 confirms Tian et al.’s assertion that the configuration of the built environment plays a more substantial role in shaping emissions than classic determinants such as land use or population density (Tian et al., 2024).
6.3 Policy implications for carbon-responsive urban planning
Our findings suggest several transformative policy interventions that could reshape urban carbon management in China. Cities are suggested to implement performance-based planning frameworks that establish carbon intensity benchmarks linked to morphological thresholds. When LPI approaches critical values (15 for eastern cities, lower for western regions), planning authorities could require mandatory mixed-use development and green corridor integration to prevent over-concentration. These thresholds would serve as performance indicators rather than rigid boundaries, allowing flexibility in how cities achieve carbon reduction goals while respecting local development contexts. Furthermore, the strong negative impact of UGSI suggests cities should adopt synchronized height-density frameworks through performance-based floor-area-ratio systems. This approach would link vertical development rights to demonstrated infrastructure capacity and carbon performance metrics. New urban districts would begin with baseline height allowances that increase based on achieved performance in transportation connectivity, utility provision, and measured carbon intensity reductions. Areas experiencing rapid horizontal expansion would face height limitations until meeting specific infrastructure and carbon performance benchmarks. This performance-oriented approach ensures that vertical development proceeds in tandem with horizontal infrastructure readiness without requiring complex real-time adjustment mechanisms.
The regional heterogeneity revealed by our analysis demands differentiated performance targets rather than uniform morphological standards. Eastern megacities approaching saturation could establish carbon intensity reduction targets achievable through polycentric restructuring and vertical optimization strategies. Central cities in transition could set moderate performance goals attainable through selective densification combined with green infrastructure integration. Western cities maintaining development potential could adopt absolute emission caps while continuing compact development, with regular performance reviews to identify when diminishing returns emerge. These insights contribute to a broader theoretical shift toward adaptive urban carbon science. The first key contribution is the recognition of scale-dependent optimization: while system-level aggregation may increase total emissions, it can simultaneously enhance local carbon efficiency, requiring policies that balance absolute and per capita targets. Second, the analysis highlights threshold-mediated nonlinearity, where seemingly linear relationships break down once morphological indicators cross critical values, prompting the need for graduated response strategies. Finally, the study establishes the principle of spatially intelligent morphology, showing that identical urban forms can yield divergent carbon outcomes depending on their geographic and infrastructural context. Collectively, these findings challenge the prevailing logic of uniform planning standards and advocate for a new paradigm in which urban form is governed not by fixed metrics or automatic mechanisms, but by performance-based targets, spatial contingencies, and development-stage-specific interventions that remain implementable within existing governance frameworks.
6.4 Limitations and generalizability of findings
Our study offers significant insights into urban morphology-emission dynamics in 286 Chinese cities from 2005 to 2020, yet its scope is bounded by several limitations that shape its generalizability. The reliance on city-level data, while robust for broad trends, may mask intra-urban heterogeneity, as Luqman et al. demonstrated that urban CO2 emissions patterns differ significantly according to development level across their global city analysis (Luqman et al., 2023). Potential biases in our data sources, such as inconsistencies in satellite-derived morphological metrics or incomplete emissions inventories, could further skew results, a concern echoed by Privitera et al. in their global review of urban climate studies (Privitera et al., 2018). Moreover, the specific thresholds identified (e.g., for LPI or TCA) are tied to China’s unique urbanization trajectory, marked by rapid growth and state-driven planning, which may not translate to regions with slower development paces or decentralized governance.
Despite these constraints, the core mechanisms we discover, namely, the non-linear relationships, the rise of 3D morphology, and evolving thresholds, offer transferable value. The tension between compactness and emission efficiency could inform urban strategies in other developing nations, as Li et al. suggest in their cross-sectional analysis of urban form and socioeconomic drivers (Li et al., 2022). Similarly, the increasing relevance of vertical development might resonate in global cities embracing high-rise typologies, a trend Frolking et al. quantified by showing a profound global shift from lateral urban expansion to vertical development across around 1,550 cities, with growth rates in building volume increasing in essentially all regions even as horizontal expansion rates declined (Frolking et al., 2024). Generalizability hinges on contextual factors such as economic development, governance structures, and cultural attitudes toward sustainability. For instance, our findings may apply less readily to cities with robust green infrastructure or stringent environmental policies, where morphology-emission links might be mediated differently. Future research could address these limitations by testing our framework across diverse regions, incorporating micro-scale data, and expanding the suite of morphological indicators to include transportation networks or building efficiency, thereby refining and broadening the applicability of our conclusions for global carbon mitigation efforts.
7 Conclusion
This study discovers a fundamental paradox in urban morphology-carbon emission relationships through a dual analytical framework combining linear spatial regression with non-linear GGPR analysis across 286 Chinese cities from 2005 to 2020. Our contrasting methodologies expose how conventional linear approaches mask critical threshold dynamics and spatial heterogeneity essential for effective urban carbon management. The spatial error model emerged as the superior linear approach, identifying UAI as the dominant emission driver with elasticity increasing from 0.754 to 0.781. Simultaneously, UGSI demonstrated dramatically amplifying mitigation potential, with its negative impact tripling from −0.096 to −0.297, establishing synchronized vertical-horizontal development as an increasingly powerful carbon reduction mechanism.
Non-linear GGPR analysis, achieving R2 values consistently exceeding 0.99, demonstrated hidden complexity through three paradigm-shifting discoveries. First, profound spatial heterogeneity characterizes morphology-emission relationships, as GeoShapley analysis reveals that 51.4% of cities exhibit negative UAI contributions, concentrated in less-developed western regions. This demonstrates that aggregation’s carbon impact fundamentally depends on local development context. Second, regional divergence has crystallized, with eastern coastal megacities reaching saturation thresholds where additional densification exacerbates emissions, whereas western cities retain substantial emission reduction potential through continued compact development. Third, the emergence of 3D morphological indicators as significant predictors by 2015–2020 represents a fundamental shift in urban carbon dynamics, with VDAI transitioning from negative to positive impacts and location-specific 3D interaction terms gaining measurable influence.
These findings necessitate a shift from prescriptive morphological standards to performance-based carbon management strategies. Cities are suggested to adopt carbon intensity targets establishing emission benchmarks per unit of built area or economic output, enabling locally-appropriate morphological pathways. Eastern megacities could meet targets through polycentric restructuring and vertical optimization, central cities through selective densification with green infrastructure, and western cities through continued compact development with performance monitoring. Moreover, carbon emission performance targets should be calibrated regionally, with stringent intensity reductions for saturated eastern cities and absolute emission caps for developing western cities to prevent high-carbon lock-in. Future research should develop robust carbon accounting methodologies linking morphological configurations to measured emissions and create decision-support tools translating threshold findings into practical planning guidance. As cities navigate increasingly constrained carbon futures, effective mitigation requires spatially-intelligent, performance-oriented strategies that harness the fundamental non-linearity and geographical contingency of urban carbon systems.
Data availability statement
The raw data supporting the conclusions of this article will be made available by the authors, without undue reservation.
Author contributions
SH: Validation, Visualization, Conceptualization, Funding acquisition, Writing – review and editing, Methodology, Writing – original draft. YS: Resources, Project administration, Supervision, Formal Analysis, Writing – original draft, Writing – review and editing, Funding acquisition. NZ: Investigation, Methodology, Writing – original draft, Formal Analysis, Data curation. LW: Writing – review and editing, Formal Analysis, Software, Visualization. ZC: Investigation, Formal Analysis, Writing – original draft, Data curation. ZH: Resources, Validation, Writing – review and editing.
Funding
The author(s) declare that financial support was received for the research and/or publication of this article. This study was funded by the National Arts Fund Young Artistic Creative Talent Funding Project (No. 2023-A-06-064-619) and Research Fund of China Railway Construction Corporation Limited (LX24–25b).
Conflict of interest
Authors YS and LW were employed by China Railway Construction Corporation Limited.
The remaining authors declare that the research was conducted in the absence of any commercial or financial relationships that could be construed as a potential conflict of interest.
The authors declare that this study was funded by Railway Construction Corporation Limited. The funder was involved in data collection, data analysis, manuscript preparation, and project supervision.
Generative AI statement
The author(s) declare that no Generative AI was used in the creation of this manuscript.
Any alternative text (alt text) provided alongside figures in this article has been generated by Frontiers with the support of artificial intelligence and reasonable efforts have been made to ensure accuracy, including review by the authors wherever possible. If you identify any issues, please contact us.
Publisher’s note
All claims expressed in this article are solely those of the authors and do not necessarily represent those of their affiliated organizations, or those of the publisher, the editors and the reviewers. Any product that may be evaluated in this article, or claim that may be made by its manufacturer, is not guaranteed or endorsed by the publisher.
Supplementary material
The Supplementary Material for this article can be found online at: https://www.frontiersin.org/articles/10.3389/fenvs.2025.1658538/full#supplementary-material
References
Ahn, D. Y., Goldberg, D. L., Liu, F., Anderson, D. C., Coombes, T., Loughner, C. P., et al. (2025). Satellite-based analysis of CO2 emissions from global cities: regional, economic, and demographic attributes. AGU Adv. 6 (4), e2025AV001747. doi:10.1029/2025av001747
Bettencourt, L. M. (2013). The origins of scaling in cities. Science 340 (6139), 1438–1441. doi:10.1126/science.1235823
Cai, M., Ren, C., Shi, Y., Chen, G., Xie, J., and Ng, E. (2023). Modeling spatiotemporal carbon emissions for two mega-urban regions in China using urban form and panel data analysis. Sci. Total Environ. 857, 159612. doi:10.1016/j.scitotenv.2022.159612
Caprotti, F., and Bailey, I. (2014). Making sense of the green economy. Geogr. Ann. Ser. B, Hum. Geogr. 96 (3), 195–200. doi:10.1111/geob.12045
Carter, N., Bryant-Lukosius, D., DiCenso, A., Blythe, J., and Neville, A. J. (2014). The use of triangulation in qualitative research. Oncol. Nurs. Forum 41 (5), 545–547. doi:10.1188/14.onf.545-547
Chen, Y., Ye, Y., Liu, X., Yin, C., and Jones, C. A. (2025a). Examining the nonlinear and spatial heterogeneity of housing prices in urban beijing: an application of GeoShapley. Habitat Int. 162, 103439. doi:10.1016/j.habitatint.2025.103439
Chen, P., Huang, H., Qin, P., Liu, X., Wu, Z., Zhao, F., et al. (2025b). Characterizing dynamics of built-up height in China from 2005 to 2020 based on GEDI, landsat, and PALSAR data. Remote Sens. Environ. 325, 114776. Manuscript under review. doi:10.1016/j.rse.2025.114776
Comber, A. J., Brunsdon, C., and Radburn, R. (2011). A spatial analysis of variations in health access: linking geography, socio-economic status and access perceptions. Int. J. Health Geogr. 10 (1), 44. doi:10.1186/1476-072x-10-44
Cortinovis, C., Haase, D., Zanon, B., and Geneletti, D. (2019). Is urban spatial development on the right track? comparing strategies and trends in the european union. Landsc. Urban Plan. 181, 22–37. doi:10.1016/j.landurbplan.2018.09.007
Dai, E., Wu, Z., and Du, X. (2018). A gradient analysis on urban sprawl and urban landscape pattern between 1985 and 2000 in the pearl river Delta, China. Front. Earth Sci. 12, 791–807. doi:10.1007/s11707-017-0637-0
Dale, M. R., and Fortin, M. J. (2014). Spatial analysis: a guide for ecologists. Cambridge University Press.
Denzin, N. K. (2017). The research act: a theoretical introduction to sociological methods. New York: Routledge.
Ding, G., Guo, J., Pueppke, S. G., Yi, J., Ou, M., Ou, W., et al. (2022). The influence of urban form compactness on CO2 emissions and its threshold effect: evidence from cities in China. J. Environ. Manag. 322, 116032. doi:10.1016/j.jenvman.2022.116032
Falahatkar, S., and Rezaei, F. (2020). Towards low carbon cities: spatio-Temporal dynamics of urban form and carbon dioxide emissions. Remote Sens. Appl. Soc. Environ. 18, 100317. doi:10.1016/j.rsase.2020.100317
Fan, T., Ren, Y., and Chapman, A.(2025). Unveiling the carbon neutrality pathways of compact cities: a simulation-based scenario analysis from China. Humanit. Soc. Sci. Commun. 12 (1), 1–21. doi:10.1057/s41599-025-05545-w
Fang, C., Wang, S., and Li, G. (2015). Changing urban forms and carbon dioxide emissions in China: a case study of 30 provincial capital cities. Appl. Energy 158, 519–531. doi:10.1016/j.apenergy.2015.08.095
Frolking, S., Mahtta, R., Milliman, T., Esch, T., and Seto, K. C. (2024). Global urban structural growth shows a profound shift from spreading out to building up. Nat. Cities 1 (9), 555–566. doi:10.1038/s44284-024-00100-1
Gao, C., Feng, Y., Tong, X., Lei, Z., Chen, S., and Zhai, S. (2020). Modeling urban growth using spatially heterogeneous cellular automata models: Comparison of spatial lag, spatial error and GWR. Comput. Environ. Urban Syst. 81, 101459. doi:10.1016/j.compenvurbsys.2020.101459
Ge, M., Fang, S., Gong, Y., Tao, P., Yang, G., and Gong, W. (2021). Understanding the correlation between landscape pattern and vertical urban volume by time-series remote sensing data: a case study of Melbourne. ISPRS Int. J. Geo-Information 10 (1), 14. doi:10.3390/ijgi10010014
Georganos, S., Grippa, T., Niang Gadiaga, A., Linard, C., Lennert, M., Vanhuysse, S., et al. (2021). Geographical random forests: a spatial extension of the random forest algorithm to address spatial heterogeneity in remote sensing and population modelling. Geocarto Int. 36 (2), 121–136. doi:10.1080/10106049.2019.1595177
Golgher, A. B., and Voss, P. R. (2016). How to interpret the coefficients of spatial models: spillovers, direct and indirect effects. Spat. Demogr. 4, 175–205. doi:10.1007/s40980-015-0016-y
Gudipudi, R., Fluschnik, T., Ros, A. G. C., Walther, C., and Kropp, J. P. (2016). City density and CO2 efficiency. Energy Policy 91, 352–361. doi:10.1016/j.enpol.2016.01.015
Guo, Y., Ren, Z., Dong, Y., Hu, N., Wang, C., Zhang, P., et al. (2022). Strengthening of surface urban heat island effect driven primarily by urban size under rapid urbanization: national evidence from China. GIScience and Remote Sens. 59 (1), 2127–2143. doi:10.1080/15481603.2022.2147301
Hagenauer, J., and Helbich, M. (2022). A geographically weighted artificial neural network. Int. J. Geogr. Inf. Sci. 36 (2), 215–235. doi:10.1080/13658816.2021.1871618
He, H., Zhao, Z., Yan, H., Zhang, G., Jing, R., Zhou, M., et al. (2024). Urban functional area building carbon emission reduction driven by three-dimensional compact urban forms' optimization. Ecol. Indic. 167, 112614. doi:10.1016/j.ecolind.2024.112614
Hong, S., Hui, E. C. M., and Lin, Y. (2022a). Relationships between carbon emissions and urban population size and density, based on geo-urban scaling analysis: a multi carbon source empirical study. Urban Clim. 46, 101337. doi:10.1016/j.uclim.2022.101337
Hong, S., Hui, E. C. M., and Lin, Y. (2022b). Relationship between urban spatial structure and carbon emissions: a literature review. Ecol. Indic. 144, 109456. doi:10.1016/j.ecolind.2022.109456
Huang, D., Tan, X., Liu, T., Chu, E., and Kong, F. (2020). Effects of hierarchical city centers on the intensity and direction of urban land expansion: a case study of beijing. Land 9 (9), 312. doi:10.3390/land9090312
Huang, H., Chen, P., Xu, X., Liu, C., Wang, J., Liu, C., et al. (2022). Estimating building height in China from ALOS AW3D30. ISPRS J. Photogrammetry Remote Sens. 185, 146–157. doi:10.1016/j.isprsjprs.2022.01.022
Huang, Y., Li, S., Lin, J., Zheng, L., Zhuang, C., Guan, C., et al. (2025). Nonlinear and threshold effects of urban building form on carbon emissions. Energy Build.329, 115243. doi:10.1016/j.enbuild.2024.115243
Jacobs, A., Top, S., Vergauwen, T., Suomi, J., Käyhkö, J., and Caluwaerts, S. (2025). Filling gaps in urban temperature observations by debiasing ERA5 reanalysis data. Urban Clim. 58, 102226. doi:10.1016/j.uclim.2024.102226
Jia, Y., Tang, L., Xu, M., and Yang, X. (2019). Landscape pattern indices for evaluating urban spatial morphology—A case study of Chinese cities. Ecol. Indic. 99, 27–37. doi:10.1016/j.ecolind.2018.12.007
Jiao, Z., and Tao, R. (2025). Geographical gaussian process regression: a spatial machine-learning model based on spatial similarity. Geogr. Anal. 57, 507–520. doi:10.1111/gean.12423
Jin, Y., and Xu, Y. (2024). Carbon reduction of urban form strategies: regional heterogeneity in yangtze river Delta, China. Land Use Policy 141, 107154. doi:10.1016/j.landusepol.2024.107154
Jones, C., and Kammen, D. M. (2014). Spatial distribution of US household carbon footprints reveals suburbanization undermines greenhouse gas benefits of urban population density. Environ. Sci. and Technol. 48 (2), 895–902. doi:10.1021/es4034364
Kang, S. W., Lee, M. S., and Jung, J. C. (2024). Analysis of sustainable urban forms for climate change adaptation and mitigation. Environ. Sustain. Indic. 22, 100337. doi:10.1016/j.indic.2024.100337
Kar, A. K. (2024). Investigating the environmental kuznets curve hypothesis for CO2 emissions in nordic countries. Int. J. Environ. Stud. 81 (4), 1637–1652. doi:10.1080/00207233.2023.2263250
Li, Z. (2024). Geoshapley: a game theory approach to measuring spatial effects in machine learning models. Ann. Am. Assoc. Geogr. 114 (7), 1365–1385. doi:10.1080/24694452.2024.2350982
Li, J., and Li, S. (2020). Energy investment, economic growth and carbon emissions in china—empirical analysis based on spatial durbin model. Energy Policy 140, 111425. doi:10.1016/j.enpol.2020.111425
Li, K., and Zeng, H. (2024). Multidisciplinary parameters for characterizing the 3D urban morphology: an overview based on the relational perspective. Sustain. Cities Soc. 106, 105364. doi:10.1016/j.scs.2024.105364
Li, Z., Wu, H., and Wu, F. (2022). Impacts of urban forms and socioeconomic factors on CO2 emissions: a spatial econometric analysis. J. Clean. Prod. 372, 133722. doi:10.1016/j.jclepro.2022.133722
Li, L., Sun, S., Zhong, L., Han, J., and Qian, X. (2025). Novel spatiotemporal nonlinear regression approach for unveiling the impact of urban spatial morphology on carbon emissions. Sustain. Cities Soc. 125, 106381. doi:10.1016/j.scs.2025.106381
Liu, X., Wang, M., Qiang, W., Wu, K., and Wang, X. (2020). Urban form, shrinking cities, and residential carbon emissions: evidence from Chinese city-regions. Appl. Energy 261, 114409. doi:10.1016/j.apenergy.2019.114409
Liu, S., Yang, G., Wu, Z., Mao, F., Qu, Z., Ge, Y., et al. (2021). Studying the distribution patterns, dynamics and influencing factors of city functional components by gradient analysis. Sci. Rep. 11 (1), 17802. doi:10.1038/s41598-021-97208-4
Liu, Z., Xu, Q., Lyu, S., Yang, R., and Wan, Z. (2025). A review of the impact of urban form on building carbon emissions. Buildings 15 (15), 2604. doi:10.3390/buildings15152604
Luqman, M., Rayner, P. J., and Gurney, K. R. (2023). On the impact of urbanisation on CO2 emissions. NPJ Urban Sustain. 3 (1), 6. doi:10.1038/s42949-023-00084-2
Ma, X., Yang, J., Zhang, R., Yu, W., Ren, J., Xiao, X., et al. (2024). XGBoost-based analysis of the relationship between urban 2-D/3-D morphology and seasonal gradient land surface temperature. IEEE J. Sel. Top. Appl. Earth Observations Remote Sens. 17, 4109–4124. doi:10.1109/jstars.2023.3348476
Makido, Y., Dhakal, S., and Yamagata, Y. (2012). Relationship between urban form and CO2 emissions: evidence from fifty Japanese cities. Urban Clim. 2, 55–67. doi:10.1016/j.uclim.2012.10.006
Martínez-Zarzoso, I., and Maruotti, A. (2011). The impact of urbanization on CO2 emissions: evidence from developing countries. Ecol. Econ. 70 (7), 1344–1353. doi:10.1016/j.ecolecon.2011.02.009
McGarigal, K., Cushman, S. A., Neel, M. C., and Ene, E. (2002). FRAGSTATS: spatial pattern analysis program for categorical maps. Amherst: Computer software program produced by the authors at the University of Massachusetts.
Morita, Y., Rezaeiravesh, S., Tabatabaei, N., Vinuesa, R., Fukagata, K., and Schlatter, P. (2022). Applying Bayesian optimization with gaussian process regression to computational fluid dynamics problems. J. Comput. Phys. 449, 110788. doi:10.1016/j.jcp.2021.110788
Moudon, V. (1994). “Getting to know the built landscape: typomorphology,” in Type and the ordering of space.
Newman, P., and Kenworthy, J. (2015). The end of automobile dependence. Washington, DC: Island Press.
Noble, H., and Heale, R. (2019). Triangulation in research, with examples. Evidence-Based Nurs. 22 (3), 67–68. doi:10.1136/ebnurs-2019-103145
Oda, T., and Maksyutov, S. (2011). A very high-resolution (1 km×1 km) global fossil fuel CO2 emission inventory derived using a point source database and satellite observations of nighttime lights. Atmos. Chem. Phys. 11 (2), 543–556. doi:10.5194/acp-11-543-2011
Olsen, J. R., Nicholls, N., and Mitchell, R. (2019). Are urban landscapes associated with reported life satisfaction and inequalities in life satisfaction at the city level? A cross-sectional study of 66 European cities. Soc. Sci. and Med. 226, 263–274. doi:10.1016/j.socscimed.2019.03.009
Ou, J., Liu, X., Wang, S., Xie, R., and Li, X. (2019). Investigating the differentiated impacts of socioeconomic factors and urban forms on CO2 emissions: empirical evidence from Chinese cities of different developmental levels. J. Clean. Prod. 226, 601–614. doi:10.1016/j.jclepro.2019.04.123
Paninski, L. (2003). Estimation of entropy and mutual information. Neural Comput. 15 (6), 1191–1253. doi:10.1162/089976603321780272
Portugali, J. (2016). “What makes cities complex?,” in Complexity, cognition, urban planning and design (Springer), 3–19.
Privitera, R., Palermo, V., Martinico, F., Fichera, A., and La Rosa, D. (2018). Towards lower carbon cities: urban morphology contribution in climate change adaptation strategies. Eur. Plan. Stud. 26 (4), 812–837. doi:10.1080/09654313.2018.1426735
Ribeiro, H. V., Rybski, D., and Kropp, J. P. (2019). Effects of changing population or density on urban carbon dioxide emissions. Nat. Commun. 10 (1), 3204. doi:10.1038/s41467-019-11184-y
Santos, F., Graw, V., and Bonilla, S. (2019). A geographically weighted random forest approach for evaluate forest change drivers in the northern ecuadorian amazon. PLOS ONE 14 (12), e0226224. doi:10.1371/journal.pone.0226224
Shi, F., Liao, X., Shen, L., Meng, C., and Lai, Y. (2022). Exploring the spatiotemporal impacts of urban form on CO2 emissions: evidence and implications from 256 Chinese cities. Environ. Impact Assess. Rev. 96, 106850. doi:10.1016/j.eiar.2022.106850
Sun, C., Zhang, Y., Ma, W., Wu, R., and Wang, S. (2022). The impacts of urban form on carbon emissions: a comprehensive review. Land 11 (9), 1430. doi:10.3390/land11091430
Tian, P., Cai, M., Sun, Z., Liu, S., Wu, H., Liu, L., et al. (2024). Effects of 3D urban morphology on CO2 emissions using machine learning: towards spatially tailored low-carbon strategies in central wuhan, China. Urban Clim. 57, 102122. doi:10.1016/j.uclim.2024.102122
Tobler, W. R. (1970). A computer movie simulating urban growth in the Detroit region. Econ. Geogr. 46 (Suppl. 1), 234–240. doi:10.2307/143141
Wang, J., Liu, W., Sha, C., Zhang, W., Liu, Z., Wang, Z., et al. (2023). Evaluation of the impact of urban morphology on commercial building carbon emissions at the block scale—A study of commercial buildings in beijing. J. Clean. Prod. 408, 137191. doi:10.1016/j.jclepro.2023.137191
Wang, Y., Sun, G., Wu, Y., and Rosenberg, M. W. (2024). Urban 3D building morphology and energy consumption: empirical evidence from 53 cities in China. Sci. Rep. 14 (1), 12887. doi:10.1038/s41598-024-63698-1
Wu, J., and Li, C. (2024). Illustrating the nonlinear effects of urban form factors on transportation carbon emissions based on gradient boosting decision trees. Sci Total Environ. 929, 172547. doi:10.1016/j.scitotenv.2024.172547
Wu, Z., Xu, X., and He, M. (2025). The impact of green finance on urban carbon emission efficiency: threshold effects based on the stages of the digital economy in China. 17 (3), 854. doi:10.3390/su17030854
Xu, X., Ou, J., Liu, P., Liu, X., and Zhang, H. (2021). Investigating the impacts of three-dimensional spatial structures on CO2 emissions at the urban scale. Sci. Total Environ. 762, 143096. doi:10.1016/j.scitotenv.2020.143096
Yang, J., and Huang, X. (2021). 30 m annual land cover and its dynamics in China from 1990 to 2019. Earth Syst. Sci. Data Discuss. 2021, 1–29. doi:10.5194/essd-13-3907-2021
Yang, C., and Zhao, S. (2023). Scaling of Chinese urban CO2 emissions and multiple dimensions of city size. Sci. Total Environ. 857, 159502. doi:10.1016/j.scitotenv.2022.159502
Ye, H., He, X., Song, Y., Li, X., Zhang, G., Lin, T., et al. (2015). A sustainable urban form: the challenges of compactness from the viewpoint of energy consumption and carbon emission. Energy Build. 93, 90–98. doi:10.1016/j.enbuild.2015.02.011
Zeng, X., Fan, D., Zheng, Y., and Li, S. (2024). Exploring the differentiated impact of urban spatial form on carbon emissions: evidence from Chinese cities. Land 13 (6), 874. doi:10.3390/land13060874
Zhang, J., Bai, C., Zhou, L., and Yin, S. (2025). Low-carbon transformation of China's cities: evaluation and spatiotemporal pattern evolution. Humanit. Soc. Sci. Commun. 12 (1), 597–19. doi:10.1057/s41599-025-04918-5
Zheng, S., Huang, Y., and Sun, Y. (2022). Effects of urban form on carbon emissions in China: implications for low-carbon urban planning. Land 11 (8), 1343. doi:10.3390/land11081343
Keywords: carbon emission, urban form, 3D morphological indicators, geographical Gaussian process regression, non-linear effect
Citation: He S, Sun Y, Zeng N, Wang L, Cao Z and He Z (2025) Regional divergence in the urban form-carbon emission nexus: a comparative analysis of linear and non-linear spatial modeling approaches for 286 Chinese cities. Front. Environ. Sci. 13:1658538. doi: 10.3389/fenvs.2025.1658538
Received: 02 July 2025; Accepted: 13 August 2025;
Published: 19 September 2025.
Edited by:
Zhiheng Yang, Shandong University of Finance and Economics, ChinaReviewed by:
Yanming Sun, Shandong University of Science and Technology, ChinaJinfang Pu, Renmin University of China, China
Copyright © 2025 He, Sun, Zeng, Wang, Cao and He. This is an open-access article distributed under the terms of the Creative Commons Attribution License (CC BY). The use, distribution or reproduction in other forums is permitted, provided the original author(s) and the copyright owner(s) are credited and that the original publication in this journal is cited, in accordance with accepted academic practice. No use, distribution or reproduction is permitted which does not comply with these terms.
*Correspondence: Yanan Sun, c3VueWFuYW4wODI4QGhvdG1haWwuY29t