 Xiaojing Zhao
 Xuke Li1
 Yanling Xi
- 1Business School and MBA Education Center, Henan University of Science and Technology, Luoyang, China
- 2Institute of Ecological Civilization, Tianjin Academy of Social sciences, Tianjin, China
Water resource scarcity is a major obstacle to the sustainable development of the Yellow River Basin (YRB). Accurately identifying the decoupling pathways of water resources ecological footprint (WEF) and economic growth is crucial in resolving the dilemma of water resource utilization and economic development in the YRB. To explore the decoupling states of WEF and the economic growth in cities within the YRB, this study proposed a new two-dimensional decoupling model with 24 different decoupling states, based on the Tapio decoupling model and the environmental Kuznets curve (EKC) hypothesis. Using the panel data from 60 cities in the YRB from 2010–2021, this study found that the relationship between WEF and per capita GDP followed an N-shape pattern. Decoupling performance shows clear regional differentiation: downstream cities exhibited the best decoupling performance, followed by the midstream cities, while the upstream cities showed the poorest performance. The change trajectory of decoupling states showed a clear tendency toward desirable decoupling: the proportion of cities achieving high-economic-level decoupling states (HE-SD and HE-WD) increased markedly from 18.33% to 43.33%. However, this transition was highly dynamic and non-linear, nearly 95% of cities experienced changes in their decoupling states during the study period. These results highlight the urgency of decoupling water resource utilization from economic growth throughout the YRB. In light of the aforementioned discoveries, this paper proposed corresponding policy recommendations aimed at achieving the ideal decoupling of WEF and economic growth in the Yellow River Basin.
1 Introduction
Water resources are crucial for human survival and socioeconomic development (Li and Lu, 2024). As an indispensable natural resource for urban development, it is a rigid constraint on urban development (Wang et al., 2025).The United Nations has identified rational planning and effective management of water resources as a crucial element of Sustainable Development Goal 6. However, due to rapid urbanization under high compression of time and space, cities have expanded in size and economic activity, resulting in a sharp increase in water demand (Qiu and Zhang, 2019; Yang and Qin, 2024). According to China Statistical Yearbook on Environment, urban water supply rose from 50.79 billion m3 in 2010 to 67.33 billion m3 in 2021. Meanwhile, urban water consumption has increased even more, from 95.59 billion m3 to 135.92 billion m3, creating a significant gap between supply and demand. This has led to almost two-thirds of cities in China experiencing water shortages, and one-sixth of cities suffering from severe water shortages (Zhang, 2023). Furthermore, per capita water resources have continued to decrease (Chen and Feng, 2020), highlighting the growing disparity between limited water resources and the rapid growth of water demand. The intensifying contradiction between water supply and demand may lead to issues such as restrictions on industrial development and economic slowdown, and may even trigger public health incidents and social conflicts (Liu, 2025).As a result, the issue of water scarcity has intensified, presenting a significant challenge to regional sustainable development (Huang et al., 2021).
The Yellow River Basin (YRB) stretches across three key economic zones from west to east in China. It serves as an essential ecological security shield and economic belt, but also faces acute water supply and demand issues. The YRB covers an area of 79.5 × 10⁴ km2, predominantly characterized by arid and semi-arid zones. The total water resources in the YRB are limited and unevenly distributed in both time and space. Economic growth and population concentration have exacerbated the water scarcity issue (Sui, 2025). The total water resources in the basin account for only 2.6% of the national total, and the per capita water resources occupancy is a mere 27% compared to the national average. However, the exploitation of water resources has reached up to 86%, far exceeding the ecological warning line of 40% (Sun et al., 2024). This high-intensity development and utilization, coupled with intensified competition for water resources among various industries within the basin, has exacerbated the imbalance between water supply and demand. This has placed the Yellow River water resources system under extreme pressure, not only hindering regional economic development but also posing a threat to the ecological security of the YRB (Bo et al., 2025; Jing and Tian, 2025).The scarcity of water resources has greatly hindered the socioeconomic development and ecological civilization security of not only the YRB but also the country (Hu et al., 2012; Liao et al., 2024; Liu L. et al., 2023).
Water is a vital ecological element and a significant constraint for the high-quality development of the YRB (Lu et al., 2023; Xie et al., 2024). As the urban economy in the YRB continues to rapidly grow, achieving sustainable water resource utilization is crucial for the high-quality development progress of cities. It is important to note that economic development varies greatly from city to city in the YRB (Wang et al., 2023).
However, the compatibility between economic growth and water resource utilization in cities with different levels of economic development was poorly understood. Therefore, this study aims to transcend the limitations by introducing an integrated analytical framework that incorporates the economic development stage into the decoupling model. This enables not only a more accurate distinction of decoupling states in cities at varying development levels but also an analysis of their dynamic trajectory over time. Consequently, our research offers targeted insights that are essential for guiding differentiated policy recommendations and achieving harmonious water-economic development in the YRB.
2 Literature review
The environmental Kuznets curve (EKC) hypothesis is a widely accepted framework for examining the relationships between resource consumption, environmental pollution, and economic growth (Grossman and Krueger, 1995; Song et al., 2020). Its core premise is that environmental degradation intensifies in the early stages of economic development but may eventually diminish as per capita GDP exceeds a certain threshold, forming an inverted U-shaped pattern (Grossman and Krueger, 1991; Tenaw and Beyene, 2021).
However, the EKC exhibited varying patterns when examining different pollutants and sample areas, including U-shape, inverted U-shape, N-shape, and inverted N-shape (Fang and Gao, 2023; Gong et al., 2022; Huang et al., 2023; Li et al., 2021; Riti et al., 2017; Zhu, 2014). Economic growth has been a major driving force behind water resource consumption (Qin et al., 2015; Sun and Xie, 2011). Previous literature concluded that the EKC between tertiary industry water consumption and economic growth in China exhibited a linear increase, while the EKC patterns for the total, industrial, and agricultural water consumption all revealed an inverted N-shape (Li Y. et al., 2023). However, in Ningxia from 1980 to 2013 and in the United States from 1960 to 2005, the EKC for industrial water consumption both revealed N-shape patterns (Chen et al., 2021; Katz, 2015).
This heterogeneity in EKC patterns is not anomalous but rather expected, arising from contextual disparities in regional industrial structure, technological advancement, policy enforcement, and the specific water resource indicator examined. However, this indicates that the EKC’s enduring value lies not in its predictive precision but in its paradigm-shifting insight: the economic-development-environmental pressure relationship is dynamic and non-linear. However, by focusing predominantly on identifying long-term inflection points, EKC provides little insight into the short-term dynamics and transient decoupling or coupling states between economic growth and resource use.
The decoupling theory was initially proposed by the Organization for Economic Co-operation and Development (OECD) to describe the asynchronous changes between economic growth and environmental stress (OECD, 2002). The Tapio decoupling model, which introduced the elastic coefficient, offers a more detailed breakdown of the decoupling states (Tapio, 2005). This model also addresses the uncertainty that arises from selecting a base period (Cohen et al., 2019; Mikayilov et al., 2018; Sun and Li, 2011). Currently, the Tapio decoupling model is widely utilized to investigate the decoupling relationship between energy consumption, CO2 emission, resources environment and economic growth (Hu et al., 2023; Zhang Y. et al., 2022; Zhao et al., 2023). Similarly, in water resources research, the Tapio model has been effectively employed to assess the decoupling of water resources utilization and economic development (Jian et al., 2025; Wu et al., 2022; Xu et al., 2022).
In their study of the YRB, Zuo et al. (2021) utilized the Tapio decoupling model to analyze the relationship between water resource utilization and socioeconomic development in five provinces. They concluded that these provinces have not yet achieved ideal decoupling (Zuo et al., 2021). However, some scholars found evidence of a gradual shift from weak to strong decoupling between water footprint and economic growth in the YRB (Li R. et al., 2023; Lu and Zhao, 2020). While these studies provided valuable insights into the relationship between water resources and economic growth in the YRB, they failed to consider the decoupling relationship in cities with varying levels of economic development. In other words, cities with similar decoupling states may differ in their economic development levels. Unfortunately, the Tapio decoupling model alone is unable to identify the impact of economic development on the decoupling states across different cities and time periods.
While the EKC and decoupling analysis are often treated separately, they are conceptually complementary. The EKC provides a long-term, stage-based theoretical perspective but lacks short-term diagnostic power. Conversely, the Tapio model offers a precise, short-term snapshot of the economic-environmental relationship but does not inherently contextualize this state within a broader developmental trajectory. Therefore, simply using either model in isolation presents limitations. To address this, recent studies have begun integrating both frameworks. Xia and Zhong (2016) integrated the two to reclassify the decoupling relationship between pollution emissions and economic development in 271 Chinese cities (Xia and Zhong, 2016). Similarly, Song et al. (2019) developed a two-dimensional decoupling model with 16 different decoupling states to explore the relationship between CO2 emissions and economic development in China and the United States (Song et al., 2019). Since then, there has been a growing number of studies using two-dimensional decoupling model to analyze the relationship between CO2 emissions and economic growth in China, Gansu, and the YRB, as well as the relationship between the grey water footprint and economic growth in the Yangtze River Economic Belt (He et al., 2022; Kong et al., 2022; Song et al., 2020; Xin et al., 2021). This integration is crucial because it allows researchers to not only diagnose the current decoupling status but also to interpret that status in relation to a city’s level of economic development. Thus, a combined framework provides a more robust, multi-dimensional understanding that can better inform differentiated policy responses across heterogeneous regions.
The water resources ecological footprint (WEF) is a widely used method for assessing human dependence on water resources (Zhu et al., 2019; Zuo et al., 2020). It was developed from the ecological footprint model (Huang et al., 2008; Ouyang et al., 2023; Qin et al., 2023). Although the ecological footprint model includes water area as one of its six categories of bioproductive land areas, it fails to reflect the ecological impact of water resource utilization. To address this issue, the WEF incorporates a water resource land account into the ecological footprint (Huang et al., 2008). This makes the WEF a valuable tool for assessing the ecological services and socio-economic functions of water resources (Čuček et al., 2012; Liu Z. et al., 2023).
In summary, previous studies have examined the relationship between water usage and economic growth in the YRB from various perspectives, including water quantity, water quality, water resources utilization efficiency, and water footprint (Gao and Lu, 2021; Zhang and Zhou, 2023; Zhang h et al., 2022; Zuo et al., 2021). In recent years, some scholars have conducted research on decoupling relationship between the water resources ecological footprint and economic growth (Lai et al., 2024; Zhong et al., 2024). Understanding this relationship is crucial for promoting the sustainable utilization of water resources and the high-quality development of cities in the YRB. Therefore, this study calculated the WEF of 60 cities in the YRB from 2010 to 2021. Then, a new two-dimensional decoupling model, which integrated the EKC and Tapio decoupling model, was developed with the economic development level as a key criterion. This model aimed to comprehensively explore the decoupling relationship and evolutionary trajectory between WEF and economic growth.
3 Methods and data
3.1 Two-dimensional decoupling model
3.1.1 EKC hypothesis
As EKC can take on various forms, this article referred to the previous studies (Katz, 2008; Kong et al., 2022; Zhang et al., 2017) and set the EKC of WEF as a continuous function:
Among them,
3.1.2 Two-dimensional decoupling model
In this section, we presented a new two-dimensional decoupling analysis framework by establishing a link between the EKC and the Tapio decoupling theory. To achieve this, we first took a derivative of Equation 1 with respect to
Then, Equation 2 can be transformed into Equation 3.
According to the relevant literature (Kong et al., 2022; Song et al., 2020), this study assumed that the population growth rate was 0. That was to say
Combining Equation 3 and Equation 4, the Tapio decoupling index also can be written as:
The inflection points of the EKC are equal to the extreme values of Equation 1. Thus, let
This paper used the methodology established by previous studies (Song et al., 2019; Xia and Zhong, 2016) to incorporate the inflection point of the EKC into the decoupling criteria of the Tapio model. As a result, a new two-dimensional decoupling analysis framework is presented in Figure 1. This study employs panel data from 60 prefecture-level cities in the YRB covering the period 2010–2021, conducting regression analysis using Stata software. The results indicated that there was an N-shaped curve that represented the correlation between WEF and the per capita GDP of cities in the YRB. Based on this, the framework in this paper includes 24 different decoupling states.
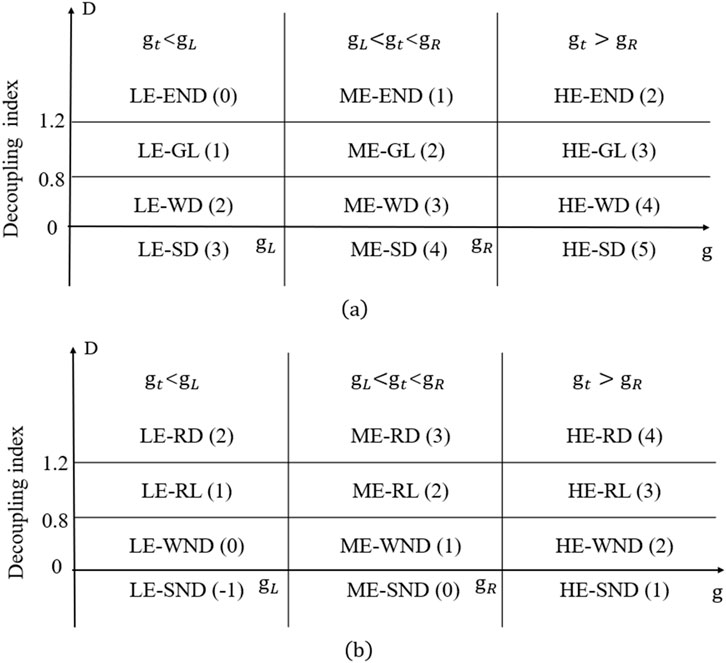
Figure 1. Two-dimensional decoupling classification and decoupling scores. (a)
The Tapio decoupling model contains eight decoupling states: strong decoupling (SD), weak decoupling (WD), recessive decoupling (RD), expansive negative decoupling (END), strong negative decoupling (SND), weak negative decoupling (WND), recession link (RL), and growth link (GL). As shown in Fiure 1, the two critical points (
According to previous research (Kong et al., 2022; Song et al., 2020), each decoupling state shown in Figure 1 was assigned a numerical score. This resulted in seven different scores for all 24 types of decoupling states. The most ideal decoupling state, HE-SD, was given a score of 5. ME-SD was given a score of four and LE-SD was given a score of 3. Similarly, HE-WD, HE-GL, and HE-END were given scores of 4, 3, and 2, respectively. The scores for ME-WD, LE-WD, ME-GL, LE-GL, ME-END, and LE-END were 3, 2, 2, 1, 1, and 0, respectively. If
3.2 Water resources ecological footprint
WEF is a measure used to convert the water resources usage into a standardized unit of bioproductive land area, enabling easy comparison across various regions (Huang et al., 2008). Previous literature (Huang et al., 2008; Zhang et al., 2024) outlined the following formula for calculating the WEF.
Among them,
3.3 Study area and data sources
The Yellow River, China’s second longest river, is also a representative example of a resource-based water-deficient river. Using the Outline for Ecological Protection and High-quality Development of the Yellow River Basin as a guide, this study encompassed 60 cities in eight provinces, as depicted in Figure 2. These cities were carefully selected based on three criteria: the integrity of administrative area units, the relevance of regional functions to the Yellow River, and the availability of data. The research focused on 18 upstream, 22 midstream, and 20 downstream cities. It is important to note that cities in Sichuan Province were not included in this study, as the Yellow River only runs through five counties (Aba, Hongyuan, Ruoergai, Songpan, and Shiqu) in that province.
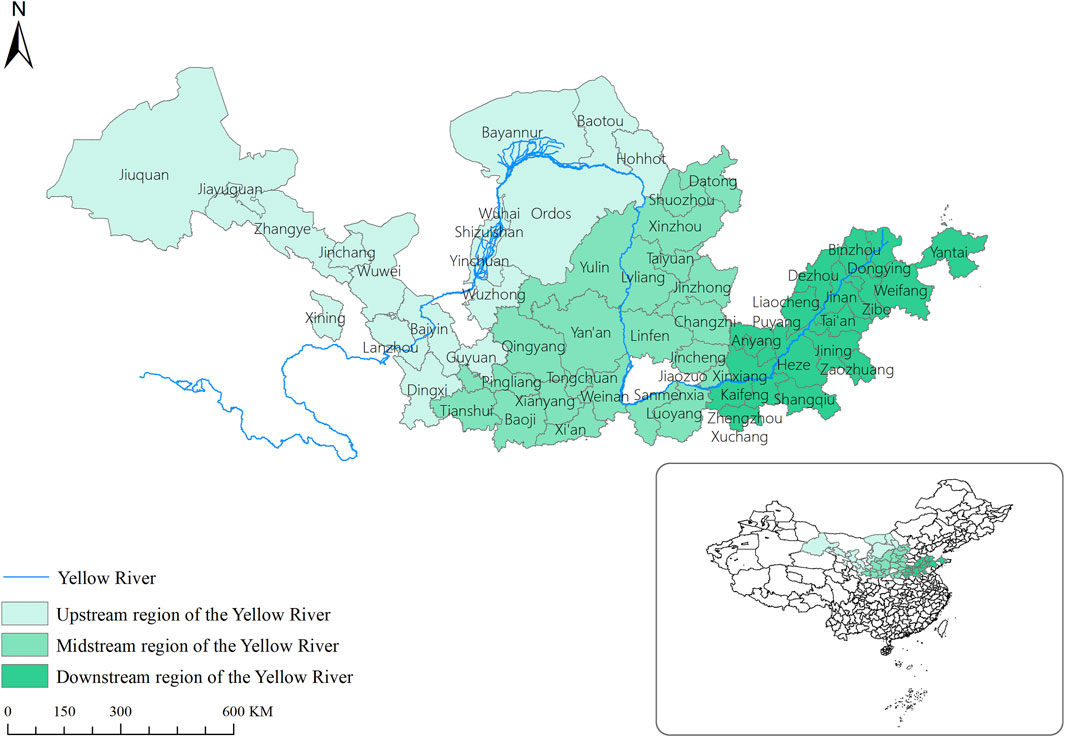
Figure 2. Schematic diagram of the research region.
The data on GDP, population and water consumption of each city from 2010 to 2021 were extracted from the China City Statistical Yearbook, the Statistical Yearbook of the eight provinces and the Water Resources Bulletin of each city. At the same time, the GDP was adjusted to the real terms using 2010 as the base year.
4 Results and discussion
4.1 Per capita GDP and water resources ecological footprint in the YRB
From 2010 to 2021, the per capita GDP in the YRB experienced a significant increase, rising from 34,031 yuan to 72,843 yuan, as depicted in Figure 3. Meanwhile, the WEF decreased from 114.43 million hm2 to 112.65 million hm2, indicating a fluctuating downward trend that aligned with previous findings (Gan et al., 2024a).
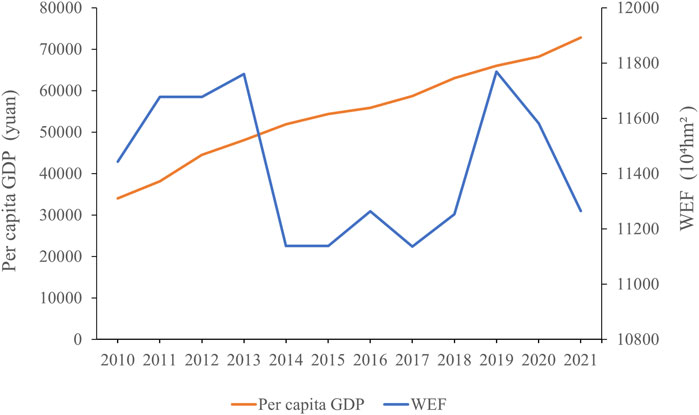
Figure 3. The per capita GDP and WEF in the YRB from 2010 to 2021.
Since 2013, there has been a sharp decline in the WEF. This decline could be attributed to the 18th National Congress of the Communist Party of China in 2012. Following the congress, China implemented the ideas of “giving priority to water conservation, seeking spatial equilibrium, implementing systematic governance, and achieving government-market synergy” in its water governance actions. As a result, the WEF fluctuated slightly between 2014 and 2017. However, from 2017 to 2019, it entered another period of rapid escalation. Since 2019, the WEF once again experienced a rapid decline period. This can be attributed to the promotion of ecological conservation and high-quality development in the YRB as a principal national strategy.
Furthermore, this study employed the mean−standard deviation method to divide the WEF and per capita GDP into five distinct grades: low, medium-low, medium, medium-high, and high grade. The heat maps of per capita GDP and WEF in the YRB were illustrated in Fiure four to visually represent the distribution of these grades.
Figure 4 showed a decrease in the number of cities with low and medium-low per capita GDP grades over time, while there was an increase in the number of cities with medium-high and high grades. Throughout the study period, approximately 45% of cities maintained a medium grade. In terms of spatial distribution, cities with high per capita GDP were primarily located in Inner Mongolia and Shandong, while cities with low per capita GDP were mainly concentrated in Gansu. It is noteworthy that there was a considerable disparity in per capita GDP among cities in the YRB. For example, Dingxi had the lowest average annual per capita GDP, which was only 6% of the highest annual average per capita GDP in Ordos.
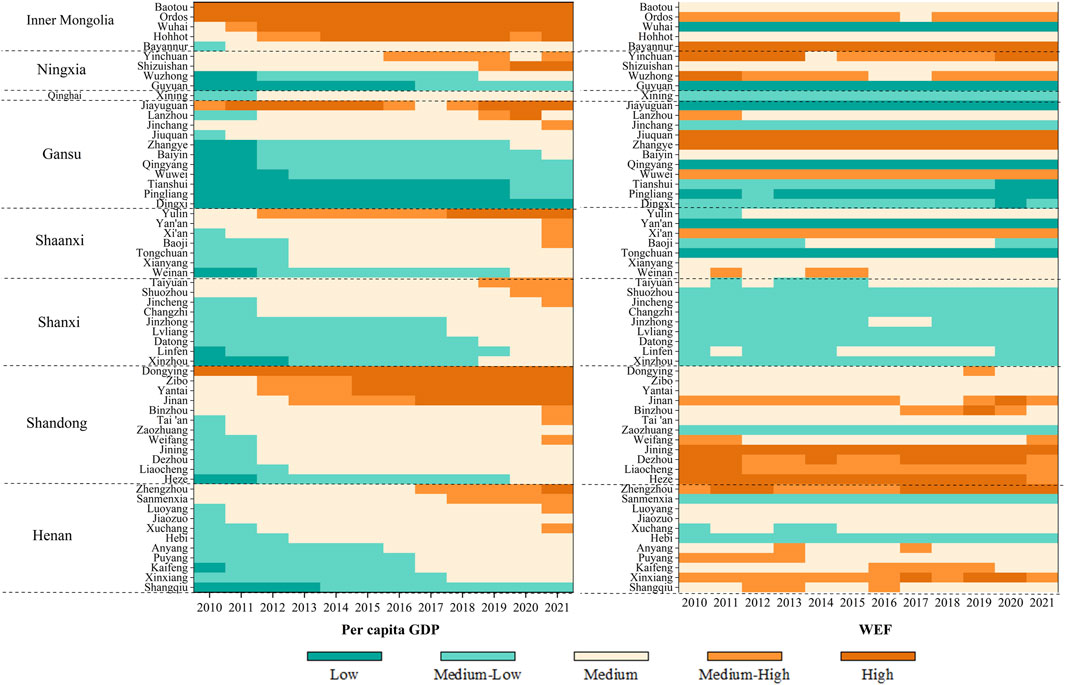
Figure 4. The prefectural per capita GDP and WEF in the YRB.
In terms of WEF, there was no significant change in the number of cities at low and medium-low grades during the period. However, there was a gradual decrease in the number of cities with medium-high and high grades. On the other hand, the proportion of cities with medium grade increased from 28% to 35%. The majority of cities with high WEF were located in Shandong, which can be attributed to its strong economic development. This finding was consistent with previous literature (Gan et al., 2024a). In contrast, cities with low WEF were primarily located in Shanxi and Qinghai. Notably, Bayannur had the highest annual average WEF in the YRB, reaching 8.117 million hm2. This can be attributed to the presence of the Hetao Irrigation District, the largest gravity irrigation district in Asia. Additionally, Bayannur is known for being the largest dairy production area and the only four-season sheep farm among prefectural cities in China. In summary, there was a significant variation in WEF among cities in the YRB, with Tongchuan having the lowest annual average WEF, which was only 2% of the highest city, Bayannur.
Overall, there was a significant imbalance in the per capita GDP and WEF among cities in the YRB. More specifically, Figure 4 showed that four cities (Bayannur, Jiuquan, Zhangye, and Jining) had a per capita GDP below the medium grade while maintaining a high grade for WEF. However, Wuhai had a per capita GDP above the medium grade but consistently received a low grade for WEF. Additionally, the per capita GDP of Wuwei fluctuated between low and medium-low grades, but its WEF consistently remained at a high grade. This suggested that cities with varying levels of economic development may exhibit the same Tapio decoupling correlation between per capita GDP and WEF. To further understand this decoupling, a two-dimensional decoupling model was used to examine the relationship between economic growth and WEF in cities at different stages of economic growth in the YRB.
4.2 Two-dimensional decoupling analysis of cities in the YRB
4.2.1 EKC estimation for the WEF
According to the EKC set in Equation 1, a panel regression analysis was conducted using data from 60 cities in the YRB from 2010 to 2021. Figure 5 showed the fitted curve of lnWEF on lng.
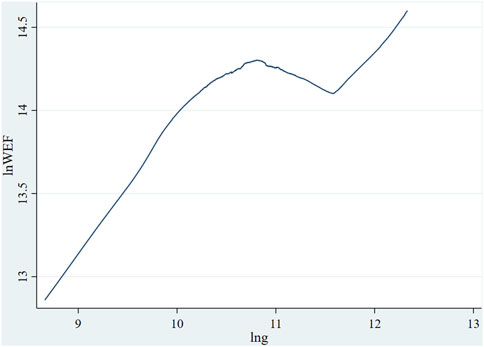
Figure 5. The fitted curve of lnWEF on lng
As illustrated in Figure 5, there was an N-shaped curve that represented the correlation between WEF and the per capita GDP of cities in the YRB. The regression coefficient for the primary term (
The rapid expansion of economic activity triggered a corresponding surge in WEF. As per capita GDP passed the first inflection point, the technique effect and structure effect became prominent. Specifically, the technological progress and upgrading industrial structure prompted a reduction in water consumption in both production and daily life, resulting in a decrease in WEF. However, as output continued to rise, the inhibitory effects of technological progress and industrial structure upgrading on water resources utilization were outweighed by the pulling effect induced by scale expansion (Li R. et al., 2023; Lu and Guo, 2008), leading to a rebound in WEF.
4.2.2 Two-dimensional decoupling score in the YRB
The economic level in the YRB was divided into three stages based on the two inflection points of the EKC. Then, according to Figure 1, the two-dimensional decoupling states and decoupling scores of 60 cities in the YRB during the following three periods: 2010–2014, 2014–2018 and 2018–2021, were obtained respectively (as shown in Supplementary Table SA1).
Referring to the previous studies (Haberl et al., 2020; Huang, 2024; Kong et al., 2022), this study categorized the total decoupling score of cities into three intervals: (1–5), (6–10), and (11–15). These intervals corresponded to the three levels of sustainable water resource utilization: low, medium, and high. The number of cities in each level of sustainable water resource utilization was shown in Figure 6.
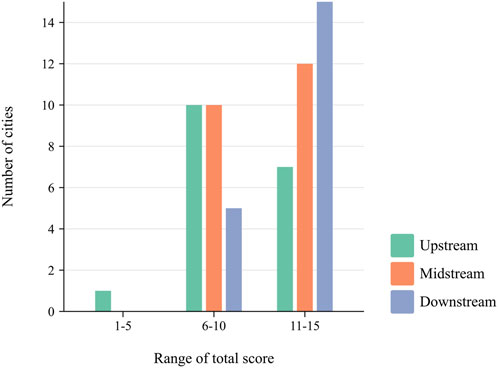
Figure 6. Number of cities in the three levels of sustainable water resources utilization.
Figure 6 highlighted the two-dimensional decoupling performance of downstream cities was the best, followed by those in the midstream. However, the performance of upstream cities was the worst. Specifically, there were more cities in the upstream and midstream with total decoupling scores between 6 and 10 compared to those in the downstream. The number of cities with total decoupling scores between 11 and 15, showed a descending order: downstream, midstream, and upstream. As shown in Figure 6, out of the 60 cities in the YRB, 34 cities had a high level of sustainable water resource utilization, while 25 cities were at a medium level. Only Bayannur, located upstream, had a low level of sustainable water resource utilization. These disparities may stem from the distinct water resource endowments, industrial structures, and policy orientations across regions, as well as the resources and capabilities of individual economic entities (Chen et al., 2025; Grossman and Krueger, 1995; Ma and Appolloni, 2025). Downstream regions have achieved dual efficiency in water resource utilization and economic development through their more advanced industrial structure and robust capabilities in policy implementation and technology application. Midstream regions face dual challenges of path dependence on heavy industry and water scarcity, remaining reliant on traditional resource-based economic growth models. Upstream regions, constrained by “ecological priority” policies, experience limited economic development space and sluggish growth (Gao, 2025; Ren and Wang, 2025; Zhang et al., 2025).
Existing literature, which primarily focused on the Tapio decoupling model, concluded that the performance of decoupling between water resources utilization and economic development in the YRB was positive, with a prevalence of both weak and strong decoupling (Yang et al., 2025). However, in this paper, we provided a more comprehensive and precise analysis of this relationship.
Table 1 displayed the two-dimensional decoupling states of typical cities in the YRB. Zibo achieved the highest two-dimensional decoupling score in the YRB. Its per capita GDP surpassed the second inflection point in 2010–2014, indicating a significant increase in economic development. The decoupling state was dominated by HE-SD, indicating that it successfully achieved the dual goals of economic development and absolute decoupling. Zibo has actively promoted the intensive and conservation-oriented use of water resources, resulting in notable improvements in the conservation and intensive capacity of water resources each year (Gan et al., 2024b). In 2021, Zibo began to implement integrated water resources management for a moistened Zibo, with the aim of promoting the synchronized advancement of economic progress and the conservation of water resources.
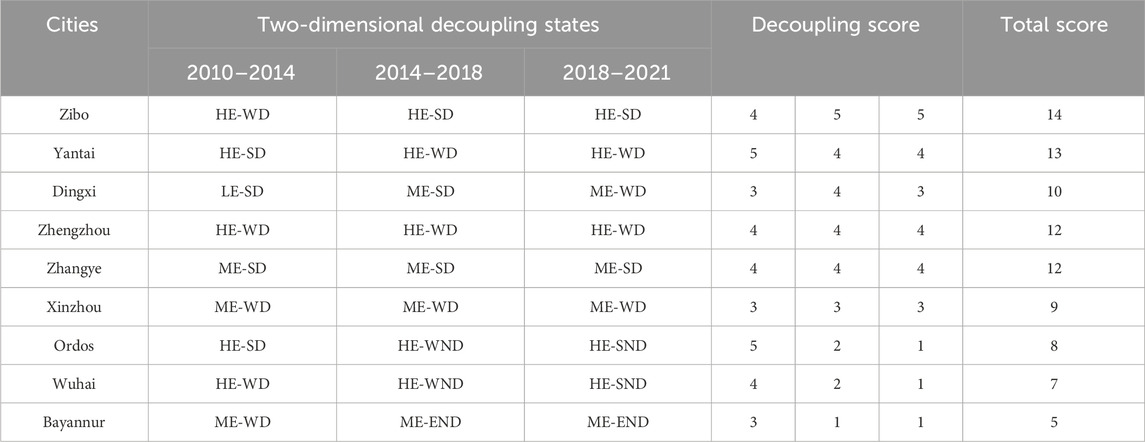
Table 1. Two-dimensional decoupling scores of typical cities in the YRB.
On the contrary, Bayannur got the lowest decoupling score and its decoupling state was dominated by ME-END, indicating that its economic growth was highly dependent on water resource consumption. In other words, Bayannur was a city that experienced extensive economic growth.
As illustrated in Table 1, all cities except for Dingxi had a per capita GDP that exceeded the first threshold. However, in 2014, Dingxi’s per capita GDP reached 9,935.15 yuan, surpassing the first inflection point of the EKC. It continued to gradually rise, reaching 17,058.03 yuan in 2021. Despite this growth, Dingxi, located at the intersection of the Loess Plateau and Qinling Mountains, faced challenges due to its limited water resources and an unsustainable water consumption structure, with agriculture accounting for 69.2% of the total water usage. From 2010 to 2014, Dingxi’s decoupling state between the WEF and economic growth was classified as LE-SD, indicating that its economic growth was lagging behind its decoupling state. Since 2014, Dingxi’s per capita GDP has crossed the first inflection point of the EKC, and its decoupling state has shifted from ME-SD to ME-WD.
It is worth noting that the two-dimensional decoupling state of Yantai deteriorated from HE-SD to HE-WD. In the first period, Ordos and Wuhai had two-dimensional decoupling states of HE-SD and HE-WD, respectively. However, in the second period, both cities changed to HE-WND, and in the third period, they became HE-SND. This indicated that these two cities were experiencing unsustainable urban development. The economic growth in both Ordos and Wuhai shifted from positive to negative, while the WEF in the two cities changed from decreasing to increasing. Previous literature also revealed that the water resource constraint effect in Wuhai was higher than the overall level of the YRB (Chen et al., 2024). Additionally, the two-dimensional decoupling state in Zhengzhou, Zhangye, and Xinzhou remained at HE-WD, ME-SD, and ME-WD, respectively.
4.2.3 Trajectory characteristics of the decoupling states in the YRB
This paper presented a transformation diagram that analyzed the trajectory of the two-dimensional decoupling states for 60 cities in the YRB during the three distinct periods: 2010–2014 (P1), 2014–2018 (P2), and 2018–2021 (P3). The diagram was shown in Figure 7.
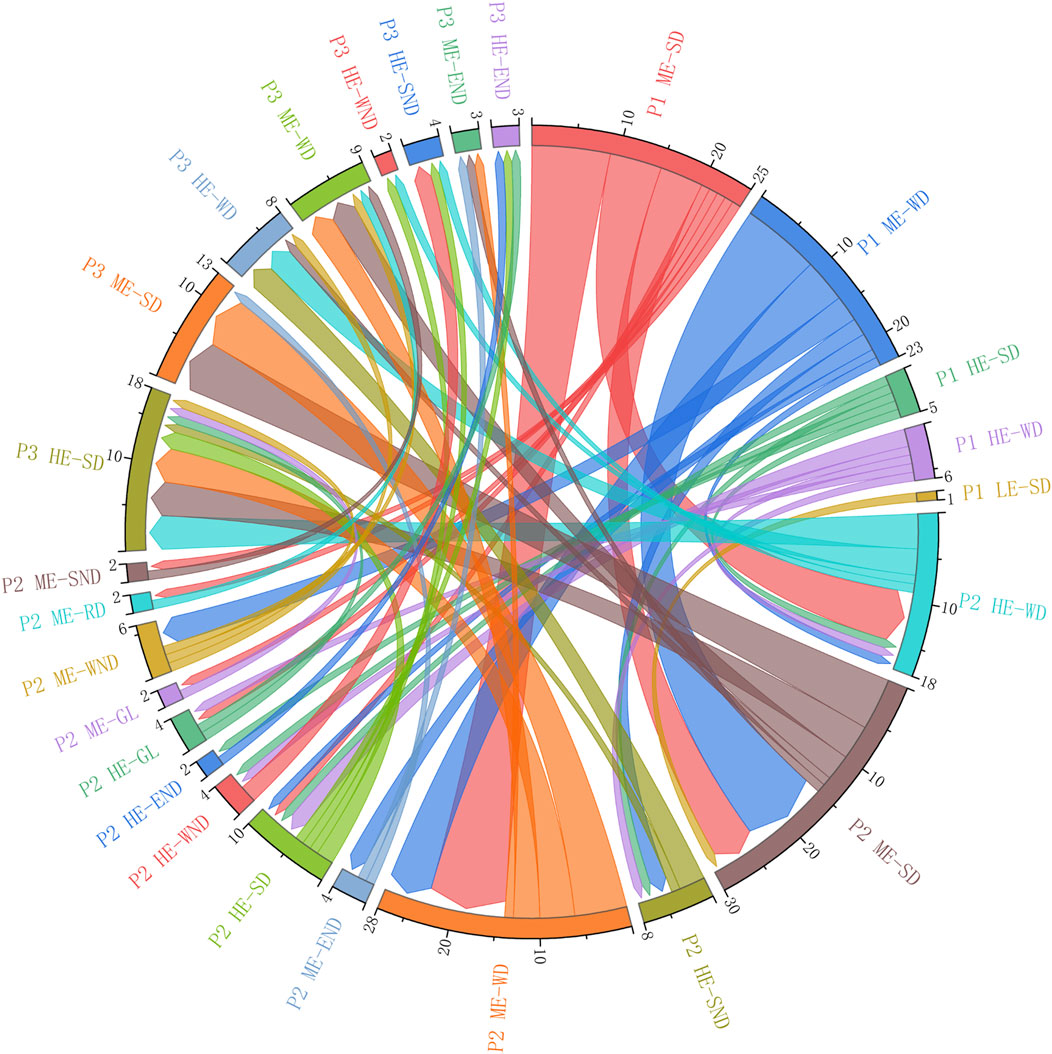
Figure 7. Trajectories of the two-dimensional decoupling states in the YRB.
Figure 7 showed that during period P1, there were five types of two-dimensional decoupling among cities: LE-SD, ME-SD, ME-WD, HE-SD, and HE-WD. Among these, ME-SD and ME-WD accounted for 80%, while HE-SD and HE-WD accounted for 18.33%. In period P2, there were 13 different two-dimensional decoupling states in the YRB. ME-SD and ME-WD accounted for 48.33%, while HE-SD and HE-WD accounted for 23.33%. During this period, Qingyang’s decoupling state performed the worst, which was classified as ME-SND, indicating negative economic growth but a significant increase in WEF.
In period P3, there were a total of eight two-dimensional decoupling states observed in the YRB. Among these, HE-SD, ME-SD, HE-WD, and ME-WD accounted for 80% of the total. Specifically, HE-SD and HE-WD accounted for 43.33% of the total. It is worth noting that the proportion of HE-SD and HE-WD increased gradually over time. In period P3, 18 cities, including Zibo, Taiyuan, and Baotou, achieved the most desirable two-dimensional decoupling state (HE-SD). This means that these cities successfully achieved absolute decoupling between economic growth and WEF. On the other hand, Wuhai, Ordos, Jinan, and Yinchuan had the poorest decoupling state (HE-SND). Despite the per capita GDP in these four cities passing the second inflection point, their economic growth was negative while the WEF continued to increase.
In summary, the cities in the YRB showed a tendency towards decoupling. Previous studies found that the water resources carrying capacity and high-quality development in the YRB have gradually improved from the dysregulated recession and barely coordinated development stage to the primary coordinated development stage, which was similar to the conclusion of this study (Xie et al., 2024). However, the two-dimensional decoupling states of cities in the YRB were unstable. Except for Zhengzhou, Zhangye, and Xinzhou, the decoupling state of the other cities has changed. Specifically, the five cities with HE-SD in the P1 period all showed varying degrees of deterioration in the following two periods. In addition, three of the six cities with HE-WD in the P1 period experienced a deterioration in the subsequent two periods. Over time, 58.33% of the cities in the YRB exceeded the second inflection point. Among them, 25.71% have still not reached the HE-SD and HE-WD states. Therefore, the coordination of decoupling and economic development in the YRB needed to be further improved.
5 Discussion
5.1 Relationship between water resource ecological footprint and economic growth
This study constructed a novel two-dimensional decoupling framework for targeted analysis of the relationship between the water resource ecological footprint (WEF) and economic growth in the Yellow River Basin. While extensive research either concentrated on EKC to examine nonlinear links between single indicators and GDP or adopted the conventional Tapio model with 8 decoupling types for single-dimensional analysis(Gao and Lu, 2021; Ji and Sun, 2024; Li R. et al., 2023; Xia et al., 2022), this study proposed a two-dimensional framework based on N-shaped EKC to conduct a more precise classification of decoupling states (24 states), which can capture complex dynamics, such as recoupling that occurs at higher development stages.
The study found that the decoupling state between WEF and economic growth in the YRB has improved, and the decoupling performance in the lower reaches of the YRB is better than that in the middle and upper reaches, which is consistent with previous studies (Li R. et al., 2023; Yang et al., 2025). Moreover, by analysing data at the prefecture-level city scale, this study found there was an N-shaped curve relationship in YRB, which suggested that water resource pressure may re-emerge after exceeding a certain economic threshold, meaning that environmental governance needs to be continuously strengthened along with economic development rather than relaxed.
5.2 Limitations and future recommendations
Due to the limitation of data availability, the analysis was conducted up to 2021. The absence of the latest data after 2021 limited the ability to capture the latest decoupling states under the new water resource governance policies. Although this study provided a detailed analysis at the basin level, the conclusions were based on the specific background of the Yellow River Basin. Caution should be exercised when extending the conclusions to other river basins with different economic structures, hydrological conditions and policy environments.
Promising research directions may include the following aspects, such as collecting updated data, examining the inequality of decoupling processes in different regions, identifying the key factors driving the state transitions and evaluating the effectiveness of specific regional policies aimed at achieving strong decoupling. These efforts will help formulate more tailored and effective water resource management strategies in the YRB.
6 Conclusion and recommendations
6.1 Conclusion
Water resources are essential for the YRB and play a crucial role in supporting its high-quality economic development. To maintain a balance between economic growth and the preservation of water resources, it is imperative to achieve a decoupling between WEF and economic growth. To address this issue, this study utilized a combination of the EKC and Tapio models to construct a new two-dimensional decoupling model with 24 different states. This model was then used to analyze the two-dimensional decoupling states of WEF and per capita GDP in the YRB, as well as their trajectories. The main findings were outlined below:
1. Between 2010 and 2021, the per capita GDP of cities in the YRB exhibited a significant growth trend, indicating promising economic development for the region. However, there were notable differences in spatial distribution. Inner Mongolia and Shandong were high-value agglomerations, while Gansu was characterized as a low-value agglomeration region. In the meantime, the WEF in the YRB displayed a fluctuating trend. In terms of spatial distribution, Shandong was the region with a high-value cluster, while Shanxi was the region with a low-value cluster. Overall, the per capita GDP and WEF in the YRB revealed a clear imbalance in both spatial and temporal distribution.
2. The relationship between WEF and per capita GDP in cities in the YRB followed an N-shaped curve, with inflection points at 8,518.5 yuan and 56,954 yuan, indicating that environmental pressure re-emerges after certain economic thresholds. Decoupling performance varied spatially: the downstream cities showed the best decoupling performance, followed by the midstream cities, while the upstream cities performed the poorest. Among the cities, Zibo stood out as the top performer in two-dimensional decoupling, successfully balancing economic development with sustainable water resource usage. On the other hand, Bayannur, whose economic growth was highly dependent on water resource consumption, scored the lowest.
3. The two-dimensional decoupling states of cities in the YRB were found to be unstable, with only three cities (Zhengzhou, Zhangye, and Xinzhou) maintaining their decoupling states. The remaining 57 cities experienced shifts in their decoupling states. Although the proportion of the two ideal decoupling states, HE-SD and HE-WD, increased from 18.33% to 43.33%. one-quarter of the cities whose GDP crossed the second inflection point still failed to achieve sustainable decoupling. In addition, the decoupling state is prone to change, especially the ideal decoupling state is difficult to maintain. Therefore, decoupling WEF from economic growth remains an urgent issue in the YRB.
6.2 Recommendations
Reducing the dependence of economic growth on WEF is a pressing concern that we must address in the sustainable development of the Yellow River Basin. Based on the above research findings, the following policy recommendations were proposed:
1. Water conservation is a promising solution to address the water scarcity in the YRB. It is crucial to reinforce the strict limitations on water resources in the region. Urban development and production must avoid exploiting water resources in a harmful manner. In particular, water-intensive industries and projects should be phased out. When determining urban water consumption indicators, emphasis should be placed on achieving a balance between water usage and economic development. Thus, establishing an information-sharing platform for the YRB will aid in coordinating inter-regional water use conflicts and improving the allocation of water resources within the basin, ultimately reducing disparities in the WEF.
2. Cities with a per capita GDP surpassing the second inflection point (56,954 yuan) are more likely to rely on water resources for their economic development. Therefore, when improving the eco-sustainable usage of water resources in cities in the YRB, economic development must be taken into account. This means that cities should not prioritize economic growth at the expense of over-consuming water resources, nor should they overlook the disparity between decoupling and economic development. In particular, for the upstream cities and midstream cities, several key measures can help alleviate the contradiction between the WEF and economic growth. These measures include rational city planning, improving industrial water use technology and water resources utilization efficiency, and fostering the construction of water-saving cities.
3. The coordination between economic development and decoupling in the YRB needs to be improved. Currently, 41.67% of the cities in the YRB are facing the challenge of balancing economic growth with sustainable water resource consumption. To address this issue, cities must modify their economic development patterns and accelerate the advancement of water-saving industries. However, the two-dimensional decoupling state of WEF in the YRB was found to be unstable. Cities that have successfully achieved the dual goals of economic development and ideal decoupling should focus on further improving the quality of economic development. This can be achieved by implementing strategies such as fostering the application of water-saving technology and continuously optimizing the economic development mode. In addition, cities like Wuhai, Ordos, Jinan, and Yinchuan, characterized as unsustainable development types, still face the dual task of sustaining economic growth and facilitating decoupling. These cities must prioritize enhancing the marginal benefit of water resources to achieve sustainable usage while maintaining economic growth.
Data availability statement
The raw data supporting the conclusion of this article will be made available by authors, without undue reservation,please contact to the corresponding author if you need the raw data.
Author contributions
XZ: Conceptualization, Methodology, Writing – review and editing. XL: Data curation, Formal Analysis, Writing – review and editing. YX: Validation, Visualization, Writing – original draft.
Funding
The author(s) declare that financial support was received for the research and/or publication of this article. This research was funded by Key Research and Development and Promotion (Soft Science) Projects in Henan Province (Research on the coupling effects and symbiotic path of industrial green development in the Yellow River Basin empowered by the digital economy, No. 252400410592).
Conflict of interest
The authors declare that the research was conducted in the absence of any commercial or financial relationships that could be construed as a potential conflict of interest.
Generative AI statement
The author(s) declare that no Generative AI was used in the creation of this manuscript.
Any alternative text (alt text) provided alongside figures in this article has been generated by Frontiers with the support of artificial intelligence and reasonable efforts have been made to ensure accuracy, including review by the authors wherever possible. If you identify any issues, please contact us.
Publisher’s note
All claims expressed in this article are solely those of the authors and do not necessarily represent those of their affiliated organizations, or those of the publisher, the editors and the reviewers. Any product that may be evaluated in this article, or claim that may be made by its manufacturer, is not guaranteed or endorsed by the publisher.
Supplementary material
The Supplementary Material for this article can be found online at: https://www.frontiersin.org/articles/10.3389/fenvs.2025.1658998/full#supplementary-material
References
Bo, L., Zhao, L., Yin, L., Zhang, X., and Wei, W. (2025). Evolution of hydroecological spatiotemporal pattern and its influencing factors in the yellow river basin in the context of the territorial spatial planning. ResearchofSoilandWaterConservation 32, 178–190. doi:10.13869/j.cnki.rswc.2025.02.016
Chen, Y., and Feng, Y. (2020). Assessment and prediction of water resource vulnerability based on RS-SVR model: a case study of the yellow river basin. Resour. Environ. Yangtze Basin 29, 137–149.
Chen, X., Hou, B., Chen, L., Wang, J., Wang, L., and Huang, Y. (2021). Formation mechanism and future development trend of industrial water environment kuznets curve in Ningxia. South-to-North Water Transfers Water Sci. and Technol. 19, 342–351. doi:10.13476/j.cnki.nsbdqk.2021.0036
Chen, L., Yu, W., Zhang, X., Song, J., and Jia, L. (2024). Research on the water resources constraint effect and spatial association network for the high-quality development of urbanization in the yellow river basin. World Reg. Stud. doi:10.3969/j.issn.1004-9479.2025.06.20230674
Chen, F., Zhu, L., Zhang, H., and Li, Y. (2025). Innovation-driven cities: reconciling economic growth and ecological sustainability. Sustain. Cities Soc. 121, 106230. doi:10.1016/j.scs.2025.106230
Cohen, G., Jalles, J. T., Loungani, P., Marto, R., and Wang, G. (2019). Decoupling of emissions and GDP: evidence from aggregate and provincial Chinese data. Energy Econ. 77, 1–118. doi:10.5089/9781484351000.001
Čuček, L., Klemeš, J. J., and Kravanja, Z. (2012). A review of footprint analysis tools for monitoring impacts on sustainability. J. Clean. Prod. 34, 9–20. doi:10.1016/j.jclepro.2012.02.036
Fang, X., and Gao, S. (2023). An empirical study on relationship between island ecological environment and socio-economic development from perspective of environmental kuznets curve (EKC). Ocean Coast. Manag. 244, 106819. doi:10.1016/j.ocecoaman.2023.106819
Gan, R., Li, Y., Guo, L., and Tang, H. (2024a). Comprehensive evaluation of sustainable water resources utilization in nine provinces of the yellow river basin based on water footprint. Yellow River 46, 93–99. doi:10.3969/j.issn.1000-1379.2024.02.016
Gan, R., Zeng, L., Chen, Y., and Sun, D. (2024b). Water resources conservation and intensive utilization capability of cities in the middle and lower reaches of the yellow river basin. Environ. Sci. doi:10.13227/j.hjkx.202404124
Gao, Y. (2025). Spatial-temporal characteristics and influencing factors of high-quality development in the yellow river basin. Yellow River 47, 46–53. doi:10.3969/j.issn.1000-1379.2025.08.009
Gao, M., and Lu, Q. (2021). Study on the decoupling relationship between water resources utilization and economic development in the yellow river basin. Environ. Sci. and Technol. 44, 198–206. doi:10.19672/j.cnki.1003-6504.0506.21.338
Gong, W.-F., Fan, Z.-Y., Wang, C.-H., Wang, L.-P., and Li, W.-W. (2022). Spatial spillover effect of carbon emissions and its influencing factors in the yellow river basin. Sustainability 14, 3608. doi:10.3390/su14063608
Grossman, G. M., and Krueger, A. B. (1991). Environmental impacts of a North American free trade agreement. CEPR Discuss. Pap. 8, 223–250. doi:10.3386/w3914
Grossman, G. M., and Krueger, A. B. (1995). Economic growth and the environment. Q. J. Econ. 110, 353–377. doi:10.2307/2118443
Haberl, H., Wiedenhofer, D., Virág, D., Kalt, G., Plank, B., Brockway, P., et al. (2020). A systematic review of the evidence on decoupling of GDP, resource use and GHG emissions, part II: synthesizing the insights. Environ. Res. Lett. 15, 065003. doi:10.1088/1748-9326/ab842a
He, W., Kong, Y., and Shen, J. (2022). A two-dimensional decoupling analysis of grey water footprint and economic growth in the yangtze river economic Belt. J. Hohai Univ. Philosophy Soc. Sci. 24, 68–74. doi:10.3876/j.issn.1671-4970.2022.01.010
Hu, S., Chen, Q., Zhang, G., and Li, M. (2012). Analysis of water resources utilization trend in yellow River basin. J. Water Resour. Water Eng. 23, 112–115.
Hu, J., Chi, L., Xing, L., Meng, H., Zhu, M., Zhang, J., et al. (2023). Decomposing the decoupling relationship between energy consumption and economic growth in China's agricultural sector. Sci. Total Environ. 873, 162323. doi:10.1016/j.scitotenv.2023.162323
Huang, S. (2024). The origin and evolution of sustainability and sustainable development. Finance Account. Mon. 45, 3–9. doi:10.19641/j.cnki.42-1290/f.2024.01.001
Huang, L., Zhang, W., Jiang, C., and Fan, X. (2008). Water resources ecological footprint calculation method. Acta Ecol. Sin., 1279–1286. doi:10.3321/j.issn:1000-0933.2008.03.044
Huang, Z., Liu, X., Sun, S., Tang, Y., Yuan, X., and Tang, Q. (2021). Global assessment of future sectoral water scarcity under adaptive inner-basin water allocation measures. Sci. total Environ. 783, 146973. doi:10.1016/j.scitotenv.2021.146973
Huang, J., Zhang, D., Zhang, Z., Kong, W., Yan, J., and Xia, F. (2023). Trapped in dilemma: Inverted N-shaped EKC evidence of economic growth and ecological land in a spatial spillover perspective. Appl. Geogr. 161, 103145. doi:10.1016/j.apgeog.2023.103145
Ji, X., and Sun, P. (2024). Evolution, spatiotemporal variation, and driving factors of ecological footprint in the yellow river basin: with a discussion on the spatial effects of the environmental kuznets curve. J. DESERT Res. 44, 58–69. doi:10.7522/j.issn.1000-694X.2024.00068
Jian, S., Cheng, X., Wang, T., and Dou, S. (2025). The driving factors of water use and its decoupling relationship with economic development—A multi-sectoral perspective in the nine provinces of the yellow river basin. J. Hydrology Regional Stud. 59, 102338. doi:10.1016/j.ejrh.2025.102338
Jing, X., and Tian, G. (2025). Connotation analysis, core composition and implementation pathways of strictest water resources protection and utilization system in the yellow river basin. Water Resour. Prot. 41, 58–64+87.
Katz, D. (2015). Water use and economic growth: reconsidering the environmental kuznets curve relationship. J. Clean. Prod. 88, 205–213. doi:10.1016/j.jclepro.2014.08.017
Kong, Y., Liu, C., Liu, S., Feng, S., and Zhou, H. (2022). Two-dimensional decoupling and decomposition analysis of CO2 emissions from economic growth: a case study of 57 cities in the yellow river basin. Int. J. Environ. Res. Public Health 19, 12503. doi:10.3390/ijerph191912503
Lai, Z., Li, L., Huang, M., Tao, Z., Shi, X., and Li, T. (2024). Spatiotemporal evolution and decoupling effects of sustainable water resources utilization in the yellow river basin: based on three-dimensional water ecological footprint. J. Environ. Manag. 366, 121846. doi:10.1016/j.jenvman.2024.121846
Li, M., and Lu, C. (2024). Coupling and coordination relationship between new urbanization, economic development and water ecological environment in huaihe river eco-economic belt, and their driving factors. Bull. Soil Water Conservation, 1–12. doi:10.13961/j.cnki.stbctb.2023.06.034
Li, J., Hou, L., and Tang, L. (2021). Study on the relationship between ambient air quality and economic growth in key areas of air pollution control in China based on environmental kuznets curve. Acta Ecol. Sin. 41, 8845–8859. doi:10.5846/stxb202105121236
Li, R., Bai, Y., Zhou, Y., Huang, S., Yan, Z., Li, Y., et al. (2023a). Decoupling and decomposition of driving factors of water resources utilization and economic growth in the yellow river basin. Sci. Geogr. Sin. 43, 110–118. doi:10.13249/j.cnki.sgs.2023.01.012
Li, Y., Wang, H., Yang, M., Pan, X., and Xu, J. (2023b). Analysis of relationship between water consumption and industrial development in China based on multiple testing kuznets curve. Water Resour. Prot. 39, 190–198. doi:10.3880/j.issn.1004-6933.2023.02.023
Liao, Z., Lu, Y., Chen, Z., Ding, R., Wu, Y., Wei, D., et al. (2024). Spatial and temporal differentiation of ecological risks of ammonia-nitrogen aquatic organisms in the yellow river basin. Res. Environ. Sci. 37, 42–50. doi:10.13198/j.issn.1001-6929.2023.08.26
Liu, T. (2025). Analysis of the importance and practical measures of water resource management in the context of ecological civilization construction. Water Resour. Prot. 41, 268–269.
Liu, L., Xiao, C., and Liu, Y. (2023a). Projected water scarcity and hydrological extremes in the yellow river basin in the 21st century under SSP-RCP scenarios. Water 15, 446. doi:10.3390/w15030446
Liu, Z., Xi, R., Hei, Z., Lu, C., and Tang, L. (2023b). Carbon and water footprints of the yellow river urban belt in Ningxia and their correlations. J. Water Resour. Water Eng. 34, 1–8. doi:10.11705/j.issn.1672-643X.2023.02.01
Lu, Y., and Guo, L. (2008). Environmental kuznets inverted U-shaped curve and environmental expenditure S-shaped curve: a theoretical explanation within a neoclassical growth framework. J. World Econ., 82–92. doi:10.3969/j.issn.1002-9621.2008.12.008
Lu, R., and Zhao, Y. (2020). Evaluation of water resources utilization in yellow river basin based on water resources ecological footprint. Yellow River 42, 48–52+134.
Lu, R., Wei, D., Ma, L., and Xu, M. (2023). Strategy promoting high-quality development through water ecological environment protection in the yellow river basin. Environ. Prot. Sci. 49, 1–7. doi:10.16803/j.cnki.issn.1004-6216.2022060019
Ma, S., and Appolloni, A. (2025). Can financial flexibility enhance corporate green innovation performance? Evidence from an ESG approach in China. J. Environ. Manag. 387, 125869. doi:10.1016/j.jenvman.2025.125869
Mikayilov, J. I., Hasanov, F. J., and Galeotti, M. (2018). Decoupling of CO2 emissions and GDP: a time-varying cointegration approach. Ecol. Indic. 95, 615–628. doi:10.1016/j.ecolind.2018.07.051
OECD (2002). Indicators to measure decoupling of environmental pressure from economic growth. Paris.
Ouyang, X., Liao, H., Jiang, Q., and Wang, Z. (2023). Simulation and regulation of sustainable water resources use in China based on improved ecological footprint model of water resources. Environ. Sci. 44, 1368–1377. doi:10.13227/j.hjkx.202204267
Qin, C., Ge, C., Jia, Y., and Duan, Y. (2015). Driving mechanism analysis for productive water consumption changes in Shaanxi Province. China Population,Resources Environ. 25, 131–136. doi:10.3969/j.issn.1002-2104.2015.05.017
Qin, H., Huang, L., and Wang, J. (2023). Prediction and evaluation of ecological footprint of water resources in beijing under the influence of changing environment. Pearl River 44, 25–35. doi:10.3969/j.issn.1001-9235.2023.08.004
Qiu, G., and Zhang, X. (2019). The characteristics of urbanization and its ecological and environmental challenges in China in the 21st century. Adv. Earth Sci. 34, 640–649. doi:10.11867/j.issn.1001-8166.2019.06.0640
Ren, S., and Wang, Y. (2025). Research on the measurement of green development level and spatial convergence of prefecture-level cities in the yellow river basin. Arid. Land Geogr. 48, 1031–1042. doi:10.12118/j.issn.1000-6060.2024.702
Riti, J. S., Song, D., Shu, Y., and Kamah, M. (2017). Decoupling CO2 emission and economic growth in China: is there consistency in estimation results in analyzing environmental kuznets curve? J. Clean. Prod. 166, 1448–1461. doi:10.1016/j.jclepro.2017.08.117
Song, Y., Zhang, M., and Zhou, M. (2019). Study on the decoupling relationship between CO2 emissions and economic development based on two-dimensional decoupling theory: a case between China and the United States. Ecol. Indic. 102, 230–236. doi:10.1016/j.ecolind.2019.02.044
Song, Y., Sun, J., Zhang, M., and Su, B. (2020). Using the Tapio-Z decoupling model to evaluate the decoupling status of China's CO2 emissions at provincial level and its dynamic trend. Struct. Change Econ. Dyn. 52, 120–129. doi:10.1016/j.strueco.2019.10.004
Sui, L. (2025). Research on the coupled and coordinated development of population structure, economy, and ecological environment in the yellow river basin. Ecol. Econ. 41, 230–231.
Sun, Y., and Li, Z. (2011). Analysing on the decoupling relationship between carbon dioxide emissions and economic growth of each province in China. China Population,Resources Environ. 21, 87–92.
Sun, C., and Xie, W. (2011). Measurement of the driving effects on industrial water utilization change and its spatial difference analysis in China. Econ. Geogr. 31, 666–672. doi:10.15957/j.cnki.jjdl.2011.04.024
Sun, J., Yang, Y., Cao, X., Yuan, W., and Yue, B. (2024). Analysis of decoupling effect between water resources utilization and economic development in nine provinces (districts) of the yellow river basin. Yellow River 46, 80–86. doi:10.3969/j.issn.1000-1379.2024.02.014
Tapio, P. (2005). Towards a theory of decoupling: degrees of decoupling in the EU and the case of road traffic in Finland between 1970 and 2001. Transp. policy 12, 137–151. doi:10.1016/j.tranpol.2005.01.001
Tenaw, D., and Beyene, A. D. (2021). Environmental sustainability and economic development in Sub-Saharan Africa: a modified EKC hypothesis. Renew. Sustain. Energy Rev. 143, 110897. doi:10.1016/j.rser.2021.110897
Wang, Q., Cui, L., and Yan, H. (2023). Spatial heterogeneity of factors affecting regional economic disparities in the yellow river basin: an empirical study based on MGWR model. Areal Res. Dev. 42, 7–13. doi:10.3969/j.issn.1003-2363.2023.02.002
Wang, Y., Chao, J., Li, M., Zhao, D., and Bi, Y. (2025). Study on the coupling and coordination relationship between urbanization and water resources in Shanxi-Shaanxi gorge Region. Sci. Soil Water Conservation 1-12. doi:10.16843/j.sswc.2024130
Wu, H., Li, X., and An, H. (2022). Decoupling of water resources utilization and coordinated economic development in China’s Hexi corridor based on ecological water resource footprint. Environ. Sci. Pollut. Res. 29, 90936–90947. doi:10.1007/s11356-022-21732-7
Xia, Y., and Zhong, M. (2016). The relationship between the decoupling theory of economic development and environmental pollution and the EKC hypothesis--Also on the decoupling division of prefecture-level cities in China. China Population,Resources Environ. 26, 8–16. doi:10.3969/j.issn.1002-2104.2016.10.002
Xia, L., Du, S., and Tian, D. (2022). Analysis of the environmental kuznets curve in cities along the yellow river basin. Technol. Innovation Appl. 12, 24–28. doi:10.19981/j.CN23-1581/G3.2022.11.003
Xie, Q., Lu, Z., and Yun, X. (2024). Research on coupling coordination and driving mechanism of water resource carrying capacity and high-quality development in the yellow river basin. Chin. J. Agric. Resour. Regional Plan., 1–14. doi:10.7621/cjarrp.1005-9121.20250408
Xin, L., Jia, J., Hu, W., Zeng, H., Chen, C., and Wu, B. (2021). Decomposition and decoupling analysis of CO2 emissions based on LMDI and two-dimensional decoupling model in Gansu province, China. Int. J. Environ. Res. Public Health 18, 6013. doi:10.3390/ijerph18116013
Xu, Y., Man, X. X., Fu, Q., Li, M., Li, H., and Li, T. (2022). A decoupling analysis framework for agricultural sustainability and economic development based on virtual water flow in grain exporting. Ecol. Indic. 141, 109083. doi:10.1016/j.ecolind.2022.109083
Yang, Y., and Qin, Y. (2024). Evaluation and influence path analysis of the water resources utilization fairness in the urban agglomerations of the yellow river basin. Acta Sci. Circumstantiae 44, 449–462. doi:10.13671/j.hjkxxb.2023.0344
Yang, Y., Wang, Y., and Xu, Q. (2025). Driving factors and decoupling effect of water resources utilization in the yellow river basin. Arid. Land Geogr. 48, 20–30. doi:10.12118/j.issn.1000-6060.2024.073
Zhang, C., and Zhou, Y. (2023). Decoupling of water consumption from economic growth and its driving mechanism in the yellow river basin. Yellow River 45, 79–85+115. doi:10.3969/j.issn.1000-1379.2023.07.015
Zhang, Y., Pan, B., Li, J., and Gu, A. (2017). Study on the relationship between industrial water use and economic growth in China based on kuznets curve. Resour. Sci. 39, 1117–1126. doi:10.18402/resci.2017.06.11
Zhang, h., Wu, y., and Wang, x. (2022a). Study on the decoupling mechanism of heavy metal water pollutants discharge in yellow river basin. Hubei Agric. Sci. 61, 213–221. doi:10.14088/j.cnki.issn0439-8114.2022.10.038
Zhang, Y., Yu, Z., and Zhang, J. (2022b). Spatiotemporal evolution characteristics and dynamic efficiency decomposition of carbon emission efficiency in the yellow river basin. PLoS One 17, e0264274. doi:10.1371/journal.pone.0264274
Zhang, H., Xu, K., Guo, F., and Liu, A. (2024). Study on sustainable utilization of water resources in yellow river basin based on ecological footprint of water resources. J. Environ. Eng. Technol., 1–16. doi:10.12153/j.issn.1674-991X.20230857
Zhang, Z., Zhang, Y., Lv, S., Sun, Y., and Yan, X. (2025). Spatiotemporal evolution and driving factors of water footprint in the yellow river basin based on multi-regional input-output and LMDI models. J. Northwest Univ. Nat. Sci. Ed., 1–17. doi:10.16152/j.cnki.xdxbzr.2025-04-002
Zhao, X., Li, X., Deng, G., and Xi, Y. (2023). Decoupling relationship between resource environment and high-quality economic development in the yellow river basin. Sustainability 15, 9385. doi:10.3390/su15129385
Zhong, N., Xia, R., Zhang, H., Dou, J., Chen, Y., Jia, R., et al. (2024). Research on the decoupling relationship between water resources utilization and economic development in urban agglomerations of the yellow river basin. Res. Environ. Sci. 37, 102–113. doi:10.13198/j.issn.1001-6929.2023.09.07
Zhu, Y. (2014). Study on econometric model of economic growth and water environmental pollution level in bohai rim region of Liaoning Province. China Population,Resources Environ. 24, 65–68.
Zhu, Y., Jiang, S., Han, X., Gao, X., He, G., Zhao, Y., et al. (2019). A bibliometrics review of water footprint research in China: 2003–2018. Sustainability 11, 5082. doi:10.3390/su11185082
Zuo, Q., Jiang, L., Feng, Y., and Diao, Y. (2020). Spatial and temporal characteristics of water resource ecological footprint in provinces along the yellow river. J. Irrigation Drainage 39, 1–8+34. doi:10.13522/j.cnki.ggps.2019479
Keywords: tapio decoupling model, water resources ecological footprint (WEF), environmental kuznets curve (EKC), two-dimensional decoupling model, the yellow river basin
Citation: Zhao X, Li X and Xi Y (2025) Water resources ecological footprint in the Yellow river Basin: a two-dimensional decoupling analysis and its change trajectory. Front. Environ. Sci. 13:1658998. doi: 10.3389/fenvs.2025.1658998
Received: 04 July 2025; Accepted: 11 September 2025;
Published: 01 October 2025.
Edited by:
Miao Zhang, Shaanxi Normal University, ChinaReviewed by:
Weifeng Gong, Qufu Normal University, ChinaFei Chen, Hunan Institute of Science and Technology, China
Copyright © 2025 Zhao, Li and Xi. This is an open-access article distributed under the terms of the Creative Commons Attribution License (CC BY). The use, distribution or reproduction in other forums is permitted, provided the original author(s) and the copyright owner(s) are credited and that the original publication in this journal is cited, in accordance with accepted academic practice. No use, distribution or reproduction is permitted which does not comply with these terms.
*Correspondence: Yanling Xi, eGl5YW5saW5nMzIzQDE2My5jb20=