 Yaolu Xu
- College of Landscape Architecture and Art, Fujian Agriculture and Forestry University, Fuzhou, Fujian, China
Rapid global urbanization has reshaped urban morphology and intensified environmental challenges, while research on factors influencing land surface temperature (LST) in island cities remains limited. We investigated seasonal variations in LST across four urban functional zones (UFZs) on Xiamen Island, China—residential blocks (RBs), public administration and public service blocks (PABs), commercial and business service blocks (CBSBs), and warehouse and storage blocks (WSBs)—using multiple stepwise regression to analyze 18 natural and anthropogenic factors for their seasonal effects on LST. Natural and anthropogenic factors influenced LST across all seasons, with higher explanatory power in spring and summer (R2 > 0.6 for RBs and WSBs) but lower in winter across most UFZs (R2 ≈ 0.22–0.46). For RBs, LST was primarily influenced by the Y coordinate, with higher temperatures in northern areas, and by anthropogenic factors such as building density (BD) and population density (PD). In PABs, LST was mainly driven by the Y coordinate and PD. The Y coordinate, BD, floor area ratio, and PD influenced CBSBs. WSBs showed strong urban heat island effects, mainly driven by the Y coordinate and PD, while landscape diversity reduced these effects in warehouse blocks. These findings suggest that urban planning should adopt seasonally adaptive, land-use-specific strategies aligned with the thermal response characteristics of different UFZs to enhance heat mitigation and environmental quality.
1 Introduction
Xiamen—an island city experiencing rapid urbanization and intense land development in China—presents a unique spatial context where geographic isolation, limited land availability, and dense urban form amplify the impacts of the urban heat island (UHI) effect (Jun et al., 2013; Zhao et al., 2014; Angel and Blei, 2016; Seto et al., 2022). While land surface temperature (LST) is widely recognized as a key indicator of UHI intensity and urban thermal conditions (Santamouris, 2014; Wang et al., 2023; Rees et al., 2024), existing studies have largely concentrated on mainland cities (Li et al., 2011; Ai et al., 2022), often neglecting the spatial constraints and environmental dynamics specific to island setting. Furthermore, the seasonal variability of LST—driven by changes in solar radiation, vegetation phenology, and human activity patterns—has been increasingly emphasized in recent literature (Liu et al., 2023; Amantai and Ding, 2021), yet remains insufficiently explored in high-density island cities. Anthropogenic factors such as building density (BD), population density (PD), and land use configuration can exert different influences on LST across seasons, particularly in compact urban areas with complex thermal behavior (Nanayakkara et al., 2023). Without seasonally disaggregated analysis, urban thermal assessments risk overlooking critical intra-annual variations, leading to flawed interpretations and ineffective planning responses (Palou and Mahalov, 2019; Yang et al., 2020). This study aims to fill these knowledge gaps by identifying the key natural and anthropogenic drivers of LST across seasons in various UFZs on Xiamen Island. It also compares their effects across different seasons. The results are expected to contribute to climate-resilient, evidence-based urban planning strategies tailored to island environments.
Numerous studies have investigated the factors influencing LST; however, most have focused on mainland urban areas, with few examining island cities. The urbanization processes in these two types of cities differ considerably (Ai et al., 2022). Unlike mainland cities, island cities are geographically constrained by natural boundaries (Li et al., 2011), making outward expansion more difficult. Additionally, land reclamation is expensive and raises ecological sustainability concerns, limiting its feasibility as a long-term strategy (Xu L et al., 2021). Consequently, these cities primarily rely on the island’s existing land for development or establish connections with nearby mainland municipalities (Vera Cruz and Amado, 2015). These unique constraints lead to distinct urban morphological patterns in island cities compared to those in mainland cities. For island cities, urban planning and management should focus not only on land-use and land-cover changes related to urbanization but also on the interactions between marine environments and urban morphology (Zhang L et al., 2022). These geographic and urbanization constraints highlight the need for a methodological approach that integrates natural and anthropogenic factors, enabling a detailed analysis of spatially heterogeneous thermal responses.
Urbanization in island cities results from complex interactions between natural constraints—such as topography, elevation, and proximity to the ocean—and anthropogenic expansion (Xiao et al., 2021). Unlike mainland cities, island cities face unique geographic limitations, including restricted land resources and strong marine environmental influences, which have received limited attention in previous LST studies primarily focused on continental urban areas (Odunuga and Badru, 2015; Jabbar and Yusoff, 2022). Furthermore, most prior research has emphasized the impact of individual factors, such as BD or green space coverage, without comprehensively integrating natural elements with human activities such as land-use change and urban expansion patterns (Abdullah et al., 2022). This gap is particularly notable in economically advanced island cities like Xiamen, China, where research on thermal environments remains insufficient despite rapid urbanization and its designation as a Special Economic Zone (Liu and Yang, 2020). Seasonal climatic variables—including solar radiation, precipitation, and temperature—further influence LST variability, with urban functional zones (UFZs) exhibiting distinct thermal responses (Zhang and Cheng, 2018). To address these challenges, this study adopts the primary classification framework of China’s territorial spatial planning system, which categorizes land use based on dominant spatial utilization, land–sea management, and surface coverage, organizing 24 first-level categories. We selected four representative UFZs—residential block (RB), public administration and public service block (PAB), commercial business service block (CBSB), and warehouse storage block (WSB)—were selected for analysis (Hu J et al., 2024) and investigated the seasonal drivers of LST across these UFZs. By using clearly defined urban blocks rather than large grids or generalized zones, this approach enhances spatial resolution and enables a more detailed examination of LST spatial heterogeneity and seasonal dynamics. While seasonal LST responses in RBs have been partially characterized (Liu et al., 2024), limited research exists for PAB, CBSB, and WSB. Systematic cross-seasonal comparisons of these UFZs’ thermal characteristics can elucidate spatial heterogeneity in urban heat dynamics and inform targeted management strategies. This novel methodology, which leverages functional land blocks as analytical units within China’s territorial spatial planning framework, improves micro-scale urban thermal environment assessments and supports more precise climate-adaptive urban planning.
Overall, to address the growing challenges of climate adaptation in urban island environments and fill the current knowledge gaps, we first aimed to evaluate the spatiotemporal characteristics of LST across four UFZs on Xiamen Island—RB, PAB, CBSB, and WSB—and then explored the seasonal variations in their driving factors. Specifically, we evaluated the spatial and seasonal dynamics of LST across the four UFZs using remote sensing data and spatial analysis techniques, and examined the seasonal differences in LST and their correlations with both natural and anthropogenic factors through Pearson correlation analysis. Finally, we applied multiple stepwise regression models to identify the dominant drivers of LST in each season and to reveal how their explanatory power shifts across different periods. The findings aim to provide scientific guidance for heat environment regulation in island cities and contribute to the development of effective urban climate management strategies.
2 Materials and methods
2.1 Study area
Xiamen Island, located on the southeastern coast of China (Figure 1), spans an area of 158 km2 and features a subtropical maritime monsoon climate, with an average annual precipitation of approximately 1,200 mm (Zhang N et al., 2022). As one of the earliest SEZs in China, Xiamen has experienced rapid economic development and is home to a population of 1.2807 million (Chai et al., 2022). The city’s terrain, consisting of coastal plains, terraces, and hills, offers considerable natural advantages. By 2021, Xiamen’s gross domestic product (GDP) had reached 703.389 billion Renminbi (RMB), and its urbanization rate had climbed to 89.41%, cementing its status as a prominent first-tier city.
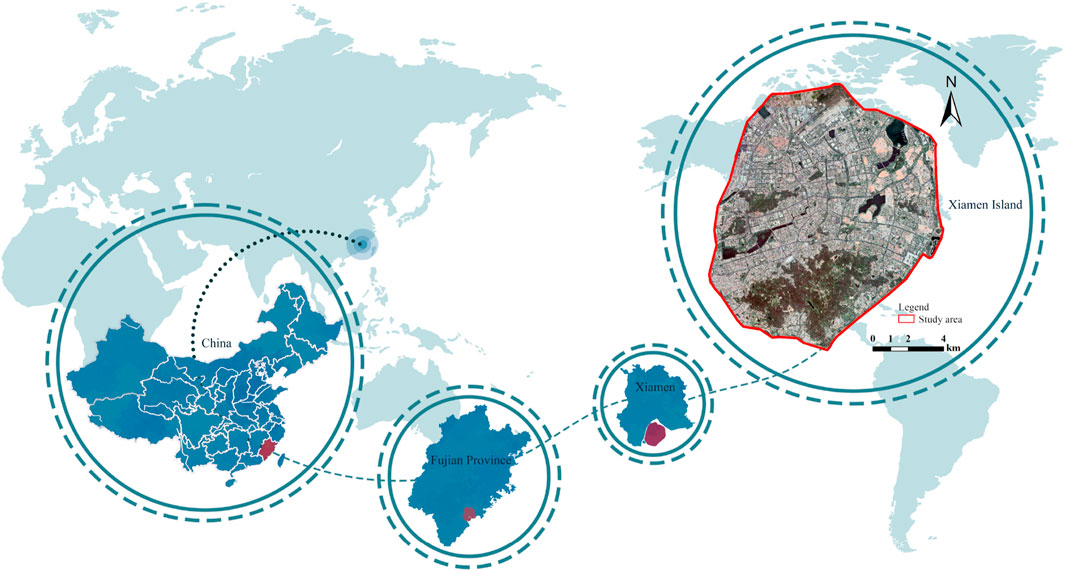
Figure 1. Geographical location map of the study area and blocks.
The city’s core urban area has been indicating increasing UHI effects due to continuous population growth and rising development density (Irawati et al., 2023). These effects vary across different UFZs, each exhibiting distinct characteristics. Therefore, comprehensive research on the seasonal UHI effects on Xiamen Island is essential to guide effective mitigation measures, optimize urban and green space planning, and devise adaptive management strategies to minimize the adverse impacts of the UHI effect on the urban environment.
2.2 Data collection
Remote sensing data from the Geospatial Data Cloud platform (https://earthexplorer.usgs.gov/), specifically Landsat 8 OLI/TIRS (Operational Land Imager and Thermal Infrared Sensor) imagery with a spatial resolution of 30 m, were used in this study. After performing radiometric and atmospheric corrections, we processed the remote sensing data to extract relevant surface biophysical parameters. To ensure data accuracy, we applied the following criteria were applied: (1) images with less than 10% cloud cover were selected to minimize cloud interference; (2) preference was given to clear-sky images to reduce temperature errors caused by weather conditions; and (3) data from the same time points were used to eliminate temperature discrepancies due to temporal differences.
We classified seasons on China’s climate characteristics and the Xiamen Climate Yearbook, with spring defined as March–May, summer as June–August, autumn as September–November, and winter as December–February. The following four imagery dates were selected: 17 April 2020 (spring); 25 July 2021 (summer); 26 October 2020 (autumn); and 30 January 2021 (winter). These images were captured on clear days without interference from extreme weather conditions such as heavy rain, hail, typhoons, droughts or pollution, ensuring they accurately represented local climate characteristics. Owing to cloud interference and the temporal coverage limitations of the Landsat 8 OLI/TIRS LST dataset, we used images from different years. To assess the impact of interannual variation, historical climate data for Xiamen in 2020 and 2021 were analyzed, showing consistency between the climate conditions during the selected study seasons and long-term averages, minimizing the influence of interannual variation on the research conclusions. We carefully verified the timestamps of the selected data to ensure they did not coincide with the COVID-19 lockdown period in Xiamen. Consequently, the dataset accurately captured LST variations under normal socioeconomic conditions, free from the influence of reduced anthropogenic heat emissions, thereby enhancing the reliability of the findings.
High-resolution satellite imagery from Google Earth’s open data platform (panchromatic band resolution = 0.7 m) was obtained for 31 July 2021. Using these data, the land was systematically classified into six categories: farmland, grassland, woodland, construction land, unused land, and water bodies. To improve classification accuracy, machine learning was employed for image classification (Ouchra et al., 2023). Specifically, principal component analysis (PCA), a technique in image processing, was first used to extract key features and reduce data dimensionality (Rahmat et al., 2023). Then, a Random Forest model was trained on these extracted features for automated classification (Bi et al., 2020). Finally, visual interpretation, combined with field survey data, was used to correct misclassified areas, ensuring that the classification results accurately reflected actual land cover (Mas et al., 2017). The kappa coefficient was used to measure the consistency between classification results and actual data, ranging from −1 to 1, with higher values indicating better agreement (Um, 2013). The classification in this study achieved an overall accuracy of 87%, with a kappa coefficient of 0.85, demonstrating high reliability and consistency.
Additional data sources included (1) terrain information derived from the digital elevation model (DEM) provided by the Geospatial Data Cloud platform (http://www.gscloud.cn), used to extract elevation as a natural topographic factor influencing LST distribution; (2) nighttime light data obtained from the National Earth System Science Data Center’s National Polar-Orbiting Partnership Visible Infrared Imaging Radiometer Suite (NPP–VIIRS) (https://www.geodata.cn/main/), serving as a proxy for anthropogenic activity intensity and the level of urbanization; (3) population density data from the WorldPop project (https://www.worldpop.org), used to represent the spatial distribution of human settlements and assess their impact on surface thermal environments; and (4) building morphology data, including building footprints and heights, retrieved from the Amap platform (https://lbs.amap.com/api/javascript-api/reference/layer), used to calculate building volume ratios and building density (BD), which are key anthropogenic indicators reflecting the structural intensity and spatial configuration of the built environment affecting LST.
2.3 Characteristics and mapping of the four UFZs
In spatial planning, blocks serve as fundamental spatial units, providing a critical scale for analyzing local microclimate changes in urban living environments (Cheng et al., 2006). During the rapid urbanization of Xiamen, variations occurred in the spatial distribution, land use patterns, infrastructure development, and environmental impacts of RB, PAB, CBSB, and WSB. These differences directly influenced the region’s LST. These four UFZs were selected due to their representativeness in urban areas and their close association with human activities. These land types vary substantially in building layout, land use intensity, infrastructure support, and green coverage, all of which play a crucial role in influencing regional LST.
RB refers to blocks designated for housing, including residential buildings, apartments, villas, and supporting facilities such as schools, community hospitals, and small commercial services. Residential areas with higher population densities typically prioritize comfort and convenience, focusing on green spaces and public services to enhance residents’ quality of life (Takano et al., 2023). PAB includes blocks used for government offices, schools, hospitals, cultural facilities, and parks (Wang, 2023; Zhao et al., 2022). PABs are typically located in the city’s core or other well-connected areas and are designed to serve the public. CBSB refers to blocks used for commercial activities, including offices, finance, hotels, entertainment, and dining (Zhao et al., 2021). CBSBs are generally found in central business districts or transportation hubs, with high building densities and development intensities that drive the city’s economic growth (Hu and Han, 2019). WSBs are designated for the storage, transportation, and distribution of goods, including warehouses, logistics centers, and freight stations. Typically located on the city’s periphery or near transportation hubs such as ports and railways, WSBs have low building heights and densities but feature extensive impervious surfaces that exacerbate heat retention and release, contributing to the UHI effect.
Based on China’s territorial spatial planning classification system, which defines 24 primary land-use categories, this study selected four representative UFZs—RB, PAB, CBSB, and WSB—for analysis. National territorial spatial planning maps and field surveys were used to verify the actual land-use status of each block. To ensure data completeness and spatial representativeness for reliable micro-scale thermal environment assessment, only blocks larger than 0.9 ha, resulting in a total of 2,537 blocks: 994 RBs, 632 PABs, 812 CBSBs, and 99 WSBs. The block sizes ranging from 0.9 to 88.13 ha (average of 2.04 ha). These blocks served as the spatial units for subsequent LST analysis and evaluation of their contributions to the UHI effect.
2.4 LST retrieval
The radiative transfer equation was employed to retrieve LST values, a method that has demonstrated high precision in LST measurements (Yu et al., 2014). The retrieval process consisted of three primary stages. First, the digital numbers (DN values) from the thermal infrared bands were converted into radiance values using calibration coefficients. Next, the normalized difference vegetation index (NDVI), vegetation cover fraction (Fv), and surface emissivity (ε) were computed to characterize surface properties. Finally, LST values were derived by incorporating the brightness temperature and surface emissivity (ε). This approach enhances LST accuracy and provides a robust foundation for investigating the urban thermal environment.
Temperature variations in each scene were assessed using Landsat 8 TIRS Band 10. The thermal infrared radiation Bi(Ti) measured at the top of the atmosphere was calculated using the following equation (Ali et al., 2022, Equation 1):
where Lλ is the thermal radiance received by the TIRS sensor from the land surface; ε is the surface emissivity, calculated using the NDVI value; L↓, L↑, and τ are the downwelling radiance, upwelling radiance, and atmospheric transmittance, respectively, obtained from NASA’s atmospheric correction calculator (https://atmcorr.gsfc.nasa.gov/) (Yao et al., 2022a).
Ts is the surface temperature (in Kelvin); and B(Ts) is the blackbody radiative intensity, calculated using Planck’s law (Equation 2):
Finally, Ts was calculated as follows (Equation 3):
For Landsat 8 TIRS band 10, the constants K1 and K2 were set to 774.89 W/(m−2·sr·μm) and 1321.08 K, respectively.
2.5 Impact of different UFZs on LST
To explore the impact of different UFZs on LST across seasons, the distribution index (DI) (Yao et al., 2022b) was applied to assess the dominant role of each land type in high-temperature areas. This method classifies LST data into temperature levels and calculates the proportion of each land type within high-temperature zones (HTZs) to identify those that significantly influence the thermal environment. The high-temperature threshold for identifying HTZs was determined using the standard deviation method, where the critical value was defined as the mean LST plus 0.5 times the standard deviation (Yao et al., 2022c). Statistical analysis revealed that this threshold effectively captures the spatial pattern of high-temperature areas and aligns well with on-site conditions. The DI was calculated as follows (Equation 4):
where
2.6 Extraction of natural and human impact factors
Based on existing literature, 18 potential driving factors of LST were selected and categorized into natural and human factors (Zhao et al., 2021) (Table 1). Natural factors included geographical and environmental characteristics that influence local temperature patterns, including DEM, distance to the coastline (DTC), and X and Y coordinates. DEM reflects topographic variation, with higher elevation areas generally experiencing lower temperatures due to cooler air and reduced solar radiation absorption, while low-lying areas tend to exhibit higher temperatures due to heat trapping. DTC reflects the distance from the coast, with coastal areas typically having milder temperatures due to the heat-buffering effect of large water bodies. The X and Y coordinates are used as positional factors to represent the spatial locations of blocks, with X and Y corresponding to the east–west and north–south directions, respectively. On Xiamen Island, the Y coordinate reflects the north–south orientation from the southern coastline facing the Taiwan Strait to the northern side across the sea from Jimei District. The western part of the island is dominated by the old town and central urban districts, characterized by high levels of urbanization and population density, while the eastern part includes the Wuyuan Bay area, the Huandao Road area, and several newly developed zones. The east–west direction exhibits distinct characteristics in land use functions and spatial patterns, and the X coordinate is used to indicate this east–west distribution across the island.
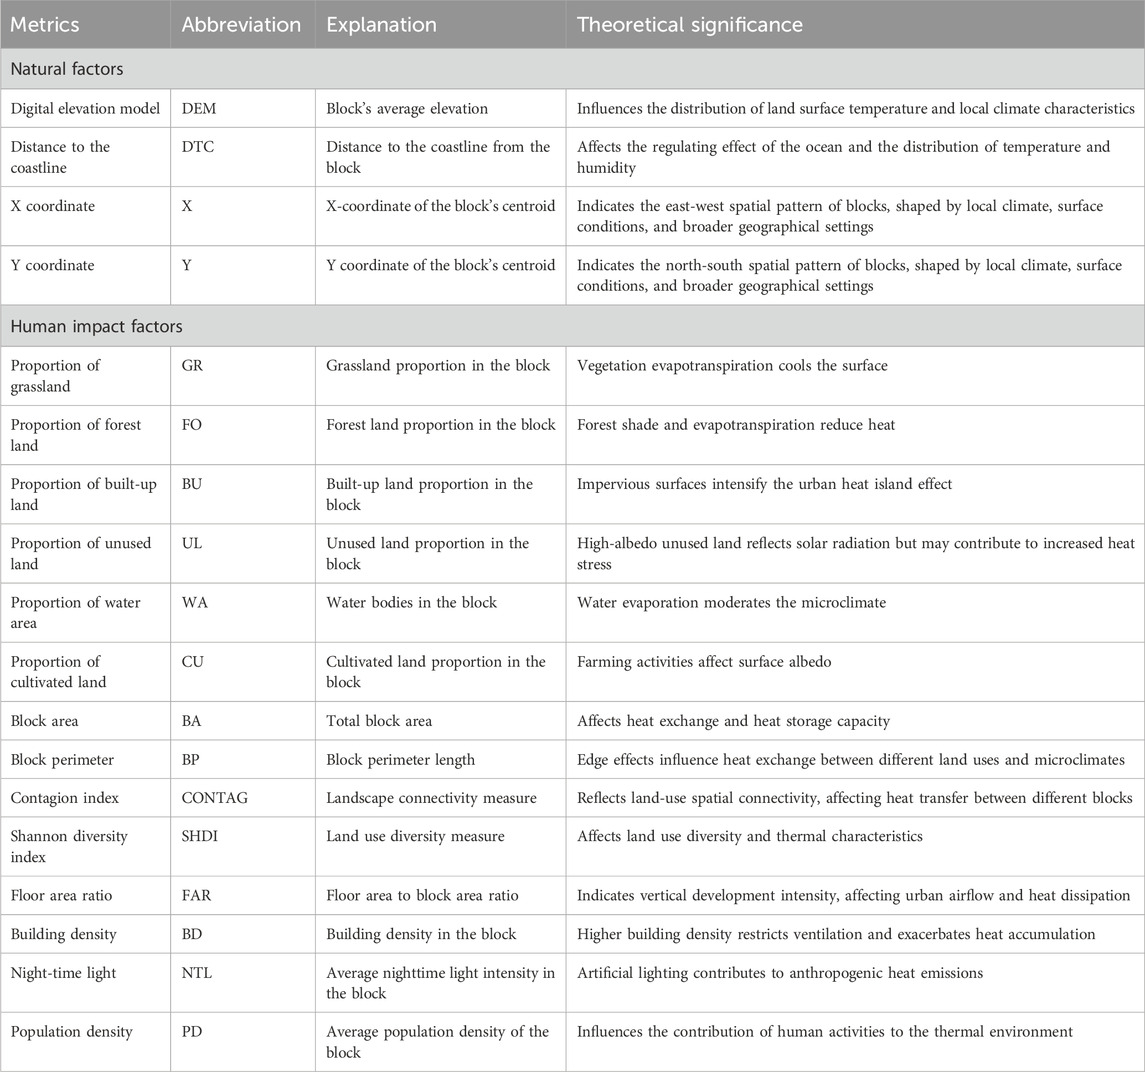
Table 1. Description and Calculation methods of natural and human impact factors.
Human-induced factors primarily consisted of three major categories: urbanization indicators, land cover types, and land parcel characteristics.Urbanization indicators included landscape indices, land parcel characteristics, building-related factors, and indicators of human activity intensity. Among them, the proportional composition of grassland (GR), forest (FO), built-up areas (BU), unused land (UL), water bodies (WA), and cultivated land (CU) within land cover types directly influences surface heat retention, radiation balance, and heat exchange efficiency (Ibrahim et al., 2016). Regarding land parcel characteristics, block area (BA) and block perimeter (BP) serve as key parameters for characterizing the spatial configuration of land parcels. BA reflects the spatial scale of heat capacity distribution, with larger areas often contributing to increased thermal environmental heterogeneity, while BP indicates the intensity of edge effects, where complex boundary morphology can enhance heat exchange with the surrounding environment (Ertunç, 2020).
Landscape indices, including the connectivity index (CONTAG) and Shannon diversity index (SHDI), effectively capture the impact of human activities on urban landscape structures (Hu et al., 2023). CONTAG measures the degree of connectivity between different landscape units, reflecting how urban development, land-use planning, and BD shape the spatial continuity of landscapes. SHDI quantifies the diversity of land-use types, thereby revealing the influence of human activities on land cover composition and landscape configuration. Higher vegetation cover and greater land-use heterogeneity contribute to mitigating urban heat by enhancing shading, evapotranspiration, and surface cooling effects. In addition, SHDI highlights the spatial heterogeneity of urban landscapes, providing insights into how the mosaic of built-up areas, vegetation, and other land-use categories collectively shapes local thermal environments.
For building-related factors, the floor area ratio (FAR, defined as the total building floor area divided by the block area) and BD (calculated as the building footprint area divided by the block area), as core indicators of urbanization intensity, jointly regulate the thermodynamic properties of the urban canopy (Kim and Kim, 2024). FAR determines the vertical heat storage capacity through building volume per unit area, directly influencing the three-dimensional distribution characteristics of the UHI. BD reflects the intensity of urban development and the built environment, affecting UHI effects, air circulation, and energy consumption.
For human activity intensity indicators, nighttime light intensity (NTL) precisely quantifies artificial heat source emissions through radiance values, with its spatial patterns effectively representing urban economic activity density (Pambuku et al., 2024). PD reflects the distribution of the population and the concentration of human activity, influenced by urbanization and population migration (Fujimoto et al., 2016). It directly affects the demand for housing, infrastructure, and public services, thereby influencing land-use patterns and development intensity.
Through multi-scale and multi-dimensional interactions, these driving factors collectively shape the spatiotemporal differentiation patterns of LST, with their relative influence dynamically varying according to climatic context, urban development stage, and spatial heterogeneity.
2.7 Driving factors of seasonal LST
To identify the main factors driving seasonal LST variations, Pearson correlation analysis was conducted using SPSS Statistics 21.0 (IBM Corp., Armonk, NY, USA), a widely used statistical software for data analysis, to examine the relationships between LST and the 18 selected driving factors (Yao et al., 2023). This analysis was used to preliminarily screen the most influential variables affecting LST, providing a foundation for subsequent regression analysis. Pearson correlation was chosen because it provides a straightforward measure of linear association and helps reduce noise by identifying variables with significant bivariate relationships to LST. Multiple stepwise regression analysis was then applied, with LST as the dependent variable and the 18 driving factors as independent variables. Stepwise regression was selected because it can effectively address multicollinearity and highlight the most important predictors, thereby ensuring both model stability and interpretability. This method optimizes the model by adding or removing variables based on statistical significance, thereby avoiding overfitting and redundancy. Variables with p-values less than 0.05 were included in the model, while those with p-values greater than 0.10 were excluded.
To improve the credibility of the regression analysis, multicollinearity tests were performed. The variance inflation factor (VIF) was used as the diagnostic metric, with a threshold of VIF <5 to prevent the influence of high correlations among independent variables on model robustness. Additionally, tolerance (tolerance = 1/VIF) was examined; a tolerance value below 0.2 indicated the potential presence of severe multicollinearity (Senaviratna and Cooray, 2019). Therefore, only variables with VIF <5 were retained to ensure model stability.
The contribution of each factor was assessed using standardized regression coefficients (β values) (Rinchumphu et al., 2024). The goodness-of-fit of the model was evaluated using adjusted R2, and residual diagnostics were conducted using the Kolmogorov–Smirnov (K–S) normality test (Godina and Matias, 2018) and Levene’s test for homoscedasticity (Gastwirth et al., 2010) to verify the validity of regression assumptions. Considering that RB, PAB, CBSB, and WSB have different heat absorption and release patterns across seasons, separate regression analyses were conducted for spring, summer, autumn, and winter to identify the dominant LST driving factors for each season. This approach provides a more accurate understanding of seasonal LST variations and offers scientific support for managing urban heat environments.
3 Results
3.1 Seasonal variability of LST
LST exhibited considerable variation across the four seasons, as shown in Figure 2. In spring, LST ranged from 21.38 °C to 54.11 °C, with some areas experiencing temperatures approaching summer highs, indicating substantial seasonal fluctuation. Summer showed the greatest variation in LST, ranging from 29.58 °C to 54.51 °C, making it the hottest season of the year with a pronounced high-temperature effect. In autumn, LST ranged from 24.89 °C to 47.05 °C, while winter recorded the lowest LST values, ranging from 17.65 °C to 34.34 °C. The seasonal trend in LST aligns with typical climatic patterns, with the highest values in summer and the lowest in winter. Substantial fluctuations are observed during spring and autumn, reflecting the complex processes of heat accumulation and release.
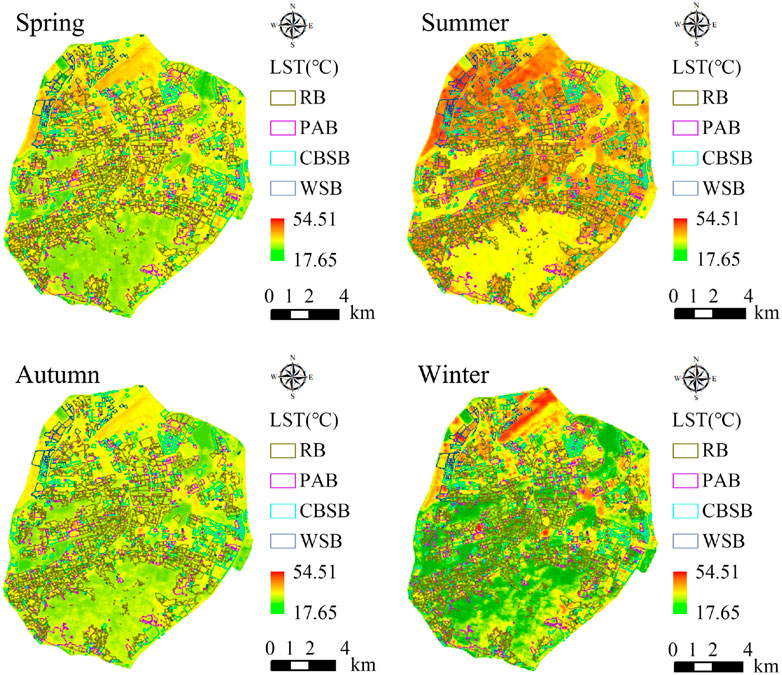
Figure 2. Spatial distribution of LST observed in different seasons: Spring (April 17, 2020), Summer (July 25, 2021), Autumn (October 26, 2020), and Winter (January 30, 2021).
3.2 Seasonal impact of different UFZs on LST
Figure 3 illustrates the relationships between UFZs and LST, highlighting seasonal variations and differences in average surface temperatures across the various UFZ categories. The temperature of RB varied seasonally, peaking at 40.99 °C in summer and dropping to 22.55 °C in winter. PAB exhibited a similar temperature pattern, reaching 40.52 °C in summer and 22.83 °C in winter. CBSB experienced higher temperatures in summer (41.84 °C) compared to winter (23.09 °C), reflecting the thermal influence of commercial activities. WSB recorded the highest temperatures throughout the year, reaching 44.13 °C in summer and dropping to 25.15 °C in winter. These elevated temperatures indicate greater heat retention in WSBs due to their structural characteristics and low levels of vegetation. Overall, all UFZs showed the highest temperatures in summer and the lowest in winter, consistent with seasonal trends. WSBs stood out with consistently higher temperatures, emphasizing their strong heat absorption and retention capacity.
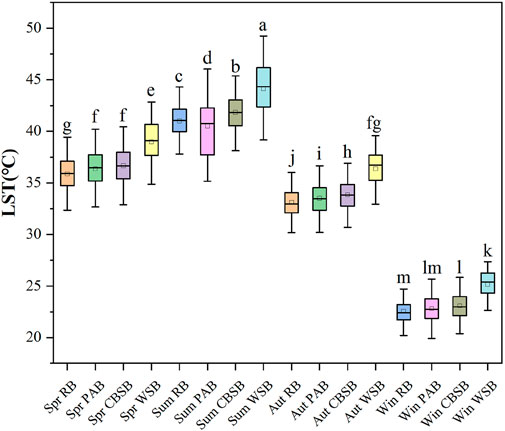
Figure 3. Effect of four UFZs on LST during the four observation seasons. Note: The black line and hollow squares represent the median and mean LST values, respectively, for the four UFZs. For each season, different letters (a–m) indicate statistically distinguishable LST differences among the four UFZs at the P < 0.05 level. Identical letters within the four UFZs denote statistically indistinguishable differences, while different letters mark statistically distinguishable variations.
Figure 4 presents the DI values of the four UFZs across the four seasons. The DI measures the concentration of a UFZ within high-temperature zones (HTZs), with values ranging from 0 to infinity. A DI greater than 1 indicates that the land type contributes above average to HTZs, whereas a value less than 1 indicates a below-average contribution. Each UFZ demonstrated notable seasonal differences. For RBs, DI values in spring, autumn, and winter were all below 1, This indicates a limited contribution to HTZs, particularly in winter, when the DI dropped to its lowest value (0.5250), It reflects a very weak UHI effect. In summer, the DI slightly increased to 1.0431, indicating a modest contribution of RBs to HTZs and a mild UHI effect. DI values for PABs ranged between 0.9543 and 1.2073 across the seasons, reflecting a relatively stable contribution to HTZs with minimal seasonal variation. CBSBs maintained DI values above 1 in all seasons, peaking at 1.4391 in summer, suggesting a stronger contribution to HTZs during this period. Although the DI decreased in winter, it remained above 1, This indicates that CBSBs continued to contribute to the UHI effect, albeit to a lesser extent. WSBs consistently had DI values greater than 2 across all seasons, surpassing those of the other UFZs. In winter, the DI peaked at 3.2579, indicating a particularly strong UHI effect from warehouse storage land during the winter months.
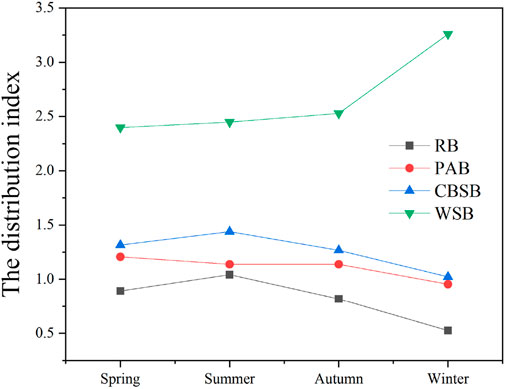
Figure 4. The distribution index (DI) of the four UFZs across four seasons.
3.3 Correlation between natural and human driving factors and seasonal LST
The relationships between LST and various natural and human impact factors for the four UFZs varied across seasons (Table 2). Based on the correlation analysis, among the natural factors, DEM showed a distinct negative correlation with the LST of RB, PAB, and WSB, indicating that higher elevations correspond to lower surface temperatures. DTC exhibited seasonal variations in its correlation with LST for certain UFZs (RB and PAB). The Y coordinate generally showed a clear positive correlation with LST across all UFZs and seasons. Among the human impact factors, GR and FO areas were negatively correlated with LST, with stronger correlations observed in spring and summer. BU showed a clear positive correlation with LST, particularly in RB and WSB, with the correlation being more pronounced during spring and summer. BD was positively correlated with LST in RBs. Regarding the landscape pattern indices, both CONTAG and SHDI exhibited distinct negative correlations with LST, a trend particularly evident for RB and WSB. NTL was positively correlated with LST in RB, PAB, and CBSB, while PD showed a positive correlation with LST across all UFZs. Both NTL and PD exhibited seasonal variations, with stronger correlations in spring and summer.
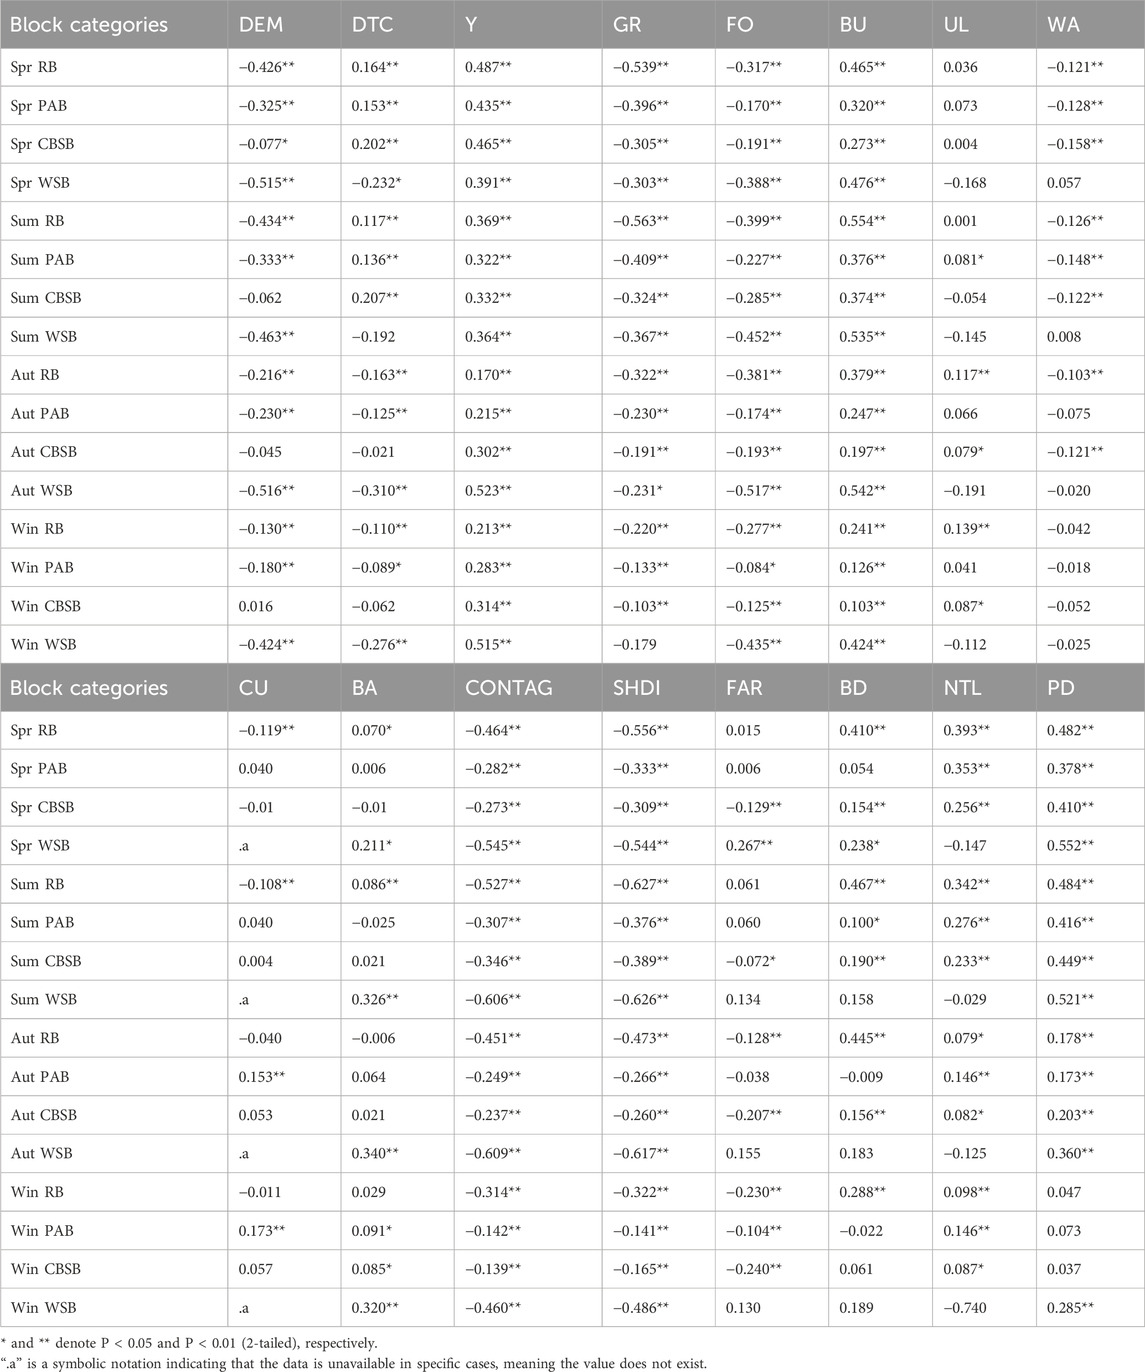
Table 2. Correlation between LST and both natural and human-influenced factors across different UFZs and seasons.
3.4 Seasonal driving force analysis of LST for different UFZs
The stepwise regression model indicated that in spring and summer, both natural and human factors influenced LST across the different UFZs (Table 3). This seasonal pattern of explanatory power is further illustrated in Figure 5, which presents the R2 values for the four UFZs across all four seasons. For RB, the R2 values in spring and summer were 0.643 and 0.638, respectively. For WSB, the corresponding values were 0.610 and 0.607, These results highlight the high explanatory power of the LST models during these two seasons. In autumn and winter, the driving factors of LST for the different UFZs exhibited more complex changes, especially in winter, when the models’ explanatory power decreased noticeably. In autumn, the R2 values for RB, PAB, and CBSB were 0.488, 0.233, and 0.319, decreasing to 0.368, 0.217, and 0.219 in winter, respectively. These results suggest that as temperatures decrease, the LST in RB, PAB, and CBSB becomes influenced by more complex or less consistent factors, reducing the models’ explanatory power. In contrast, WSB retained relatively higher R2 values in autumn and winter (0.599 and 0.456, respectively), indicating that LST changes in these zones remained relatively predictable during the colder months. These findings suggest that selecting appropriate driving factors based on seasonal conditions can more effectively capture LST variation. Such an approach also provides insights into the mechanisms behind seasonal thermal dynamics in urban environments.
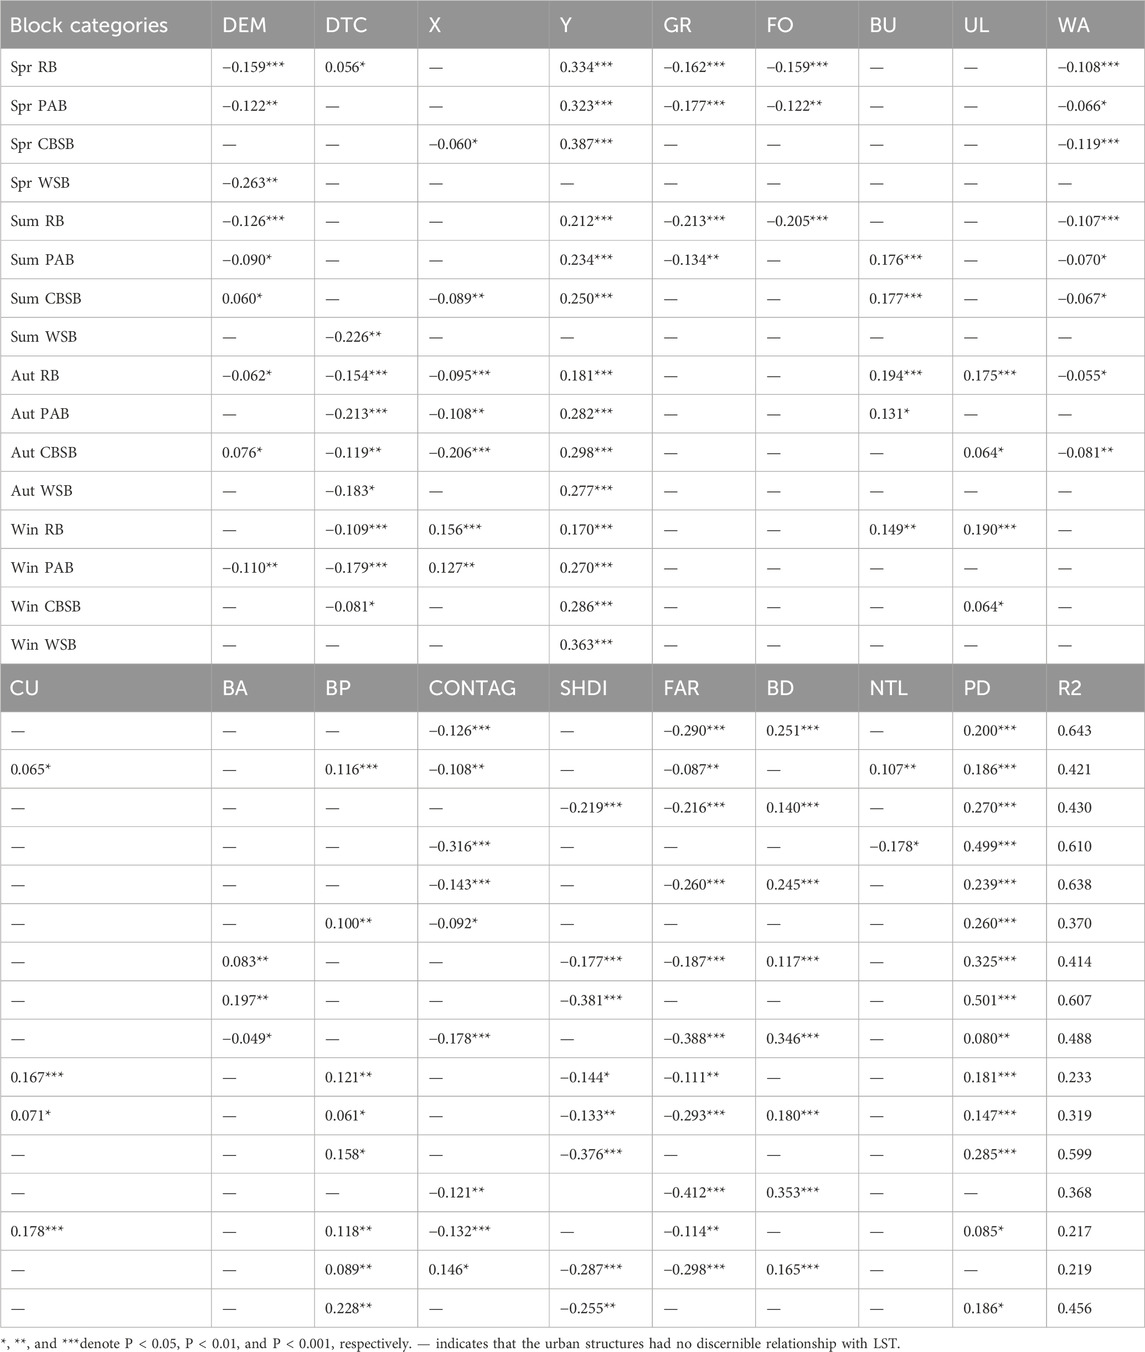
Table 3. Standardized regression coefficients between urban structure metrics and LST for different UFZs during the four seasons.
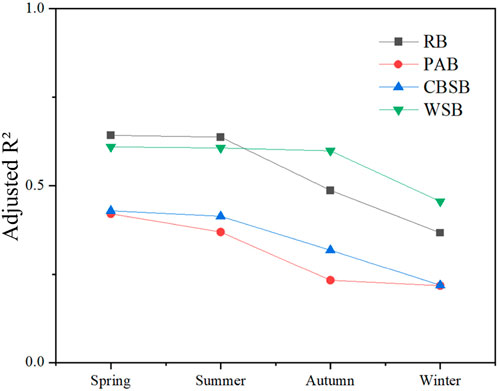
Figure 5. The adjusted coefficient of determination (adjusted R2) of the four UFZs across four seasons.
The seasonal LST of RB was primarily influenced by the natural factor of the Y coordinate, which showed a positive correlation, indicating that surface temperatures increased as the geographical location extended northward. Among human factors, CONTAG, FAR, BD, and PD demonstrated effects on RB LST. A high CONTAG value reflects a more continuous distribution of land-cover types, which helps to mitigate LST increases. FAR was negatively correlated with LST, while BD showed a positive impact, with higher BD contributing to stronger heat effects. PD notably influenced LST in spring and summer, with weaker effects in autumn and winter.
For PAB, LST was notably affected by both the Y coordinate and PD across all seasons. PAB areas, typically located in urban centers, exhibit high population densities due to a concentration of diverse public services. Consequently, high PD leads to intensified human activities, increased energy demand, and localized heat accumulation. These factors further exacerbate the UHI effect.
CBSB areas were concentrated in city centers with higher BD, and energy consumption was influenced by both natural and human factors. The effect of the Y coordinate was significant for CBSB, while SHDI, FAR, BD, and PD were key driving factors. A high SHDI indicates diversified land use, which helps lower LST, while a high FAR is associated with more high-rise buildings that promote air circulation and reduce surface temperatures (Srivastava et al., 2024). However, the relationship between BD and LST varied by season. BD was positively correlated with LST, as dense buildings typically reduce green space and exacerbate the UHI effect (Mo et al., 2024). In spring and summer, the widespread use of cooling equipment attached to buildings led to increased energy consumption and anthropogenic heat emissions, further elevating LST.
WSB land was influenced by multiple factors, particularly the positive correlation with the Y coordinate in autumn and winter. WSBs are often located on the outskirts of island cities, with low BD and limited green coverage. The effects of FAR and BD on LST were relatively weak. In summer and autumn, SHDI exhibited a distinct negative correlation with LST, indicating that higher landscape diversity is associated with lower LST and helps to mitigate temperature increases. The LST of WSB was notably influenced by PD in spring, summer, and autumn, although this influence weakened in winter.
In winter, a notable decline in R2 values was observed across all four UFZs, suggesting increased complexity in the drivers of LST. This reduction may be attributed to the combined effects of fluctuating meteorological conditions (e.g., solar radiation, wind speed, and humidity), intensified land-sea breeze circulation due to Xiamen’s island context, and the absence of centralized heating, which resulted in more dispersed anthropogenic heat sources. Additionally, seasonal shifts in human activity patterns—such as reduced mobility and outdoor presence—further contributed to the spatial variability of winter LST, thereby reducing model stability.
3.5 Seasonal divergence in LST driving factors across different UFZs
In RB, the primary driving factors in spring were the Y coordinate (18.67%), FAR (16.21%), BD (14.03%), and PD (11.18%), reflecting the combined influence of spatial location, built form, and human activity on LST (Figure 6). In summer, the pattern remained consistent, with the Y coordinate (12.11%), GR (12.17%), FO (11.71%), BD (14.00%), FAR (14.86%), and PD (13.66%) contributing notably, indicating the synergistic effects of greening, population, and morphology on thermal conditions. During autumn and winter, urban form became the dominant influence: FAR (22.68% and 29.64%), BD (20.22% and 25.40%), UL (10.23% and 13.67%), and the Y coordinate (10.58% and 12.23%) consistently played leading roles, suggesting that development intensity governs seasonal thermal dynamics in cooler months.
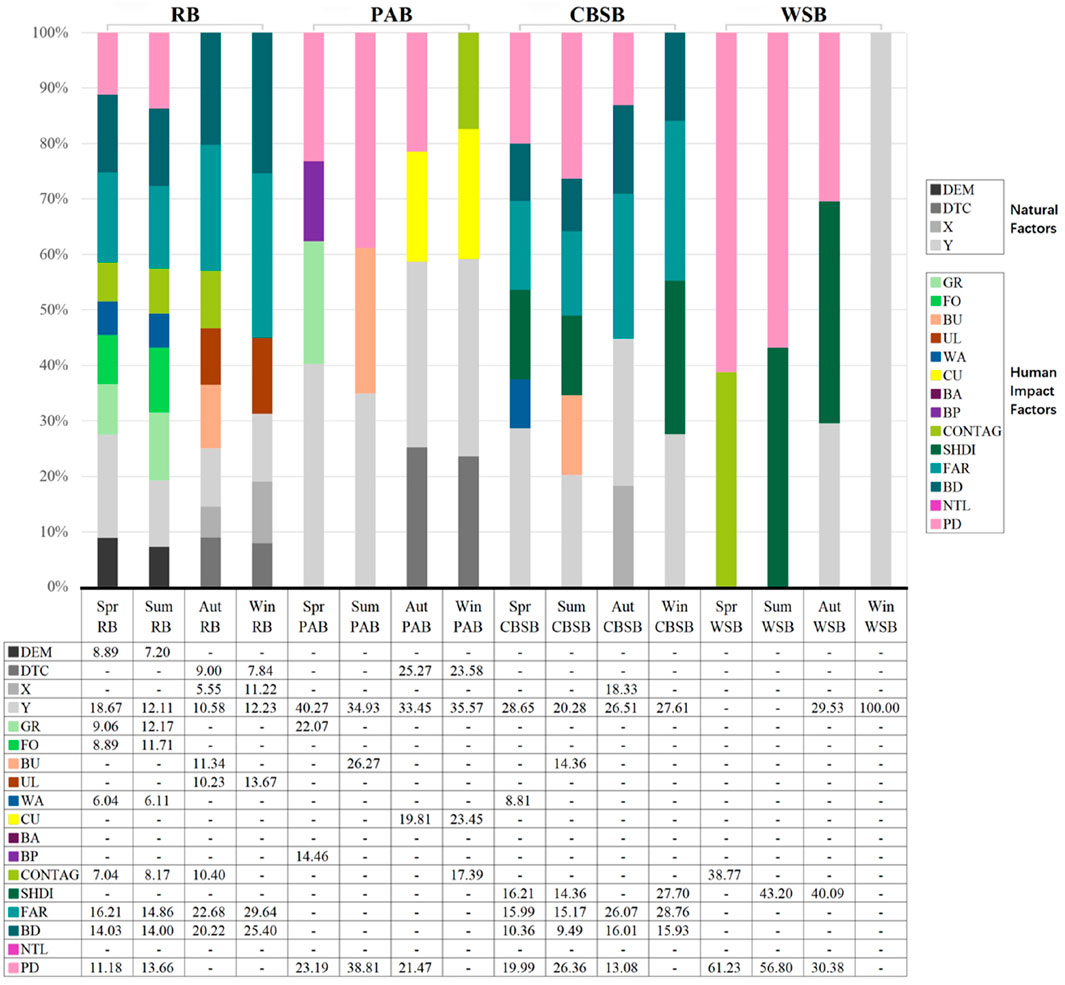
Figure 6. Seasonal divergence of LST driving factors across different UFZs.
In PAB, spring LST was mainly driven by the Y coordinate (40.27%) and PD (23.19%), with GR (22.07%) and BP (14.46%) also playing substantial roles. In summer, the Y coordinate (34.93%), PD (38.81%), and BU (26.27%) dominated, highlighting the thermal impact of anthropogenic intensity and construction. The autumn driving structure became more complex, with the Y coordinate (33.45%), DTC (25.27%), FAR (22.68%), and UL (20.76%) as key variables. In winter, the Y coordinate (35.57%), DTC (23.58%), and CU (23.45%) were dominant, CONTAG (17.39%) also played an important role, emphasizing the growing importance of landscape connectivity in cold-season thermal regulation. Notably, FAR and BD showed minimal influence across all seasons in PAB, indicating a divergent thermal response from other block types.
In CBSB, seasonal drivers varied distinctly. In spring, LST was shaped by the Y coordinate (28.65%), PD (19.99%), BD (10.36%), and SHDI (16.21%). In summer, the Y coordinate (20.28%), PD (26.36%), SHDI (14.36%), and FAR (15.17%) jointly influenced LST, underscoring the interplay of location, intensity, and landscape structure. In autumn, major contributors included FAR (26.07%), BD (16.01%), the Y coordinate (26.51%), and the X coordinate (18.33%). In winter, the dominant drivers were the Y coordinate (27.61%), FAR (28.76%), BD (15.93%), and SHDI (27.70%), indicating that building form and landscape diversity strongly regulate thermal conditions during the cold season.
In WSB, the driving structure was relatively simple and seasonally concentrated, primarily influenced by PD and morphological configuration. In spring, CONTAG (38.77%) and PD (61.23%) were dominant. In summer, SHDI (43.20%) and PD (56.80%) jointly shaped LST, while in autumn, the Y coordinate (29.53%), SHDI (40.09%), and PD (30.38%) shared importance. Notably, in winter, the Y coordinate (100%) became the sole dominant factor, revealing its overwhelming control over LST under low-temperature conditions.
Overall, different block types exhibited diverse seasonal thermal responses. RB and CBSB showed complex, multi-factorial patterns, particularly in summer and winter, where BD and FAR had considerable influence. In contrast, LST variation in PAB and WSB was primarily driven by a limited number of key factors, resulting in a relatively simple and singular driving structure.
4 Discussion
4.1 Comparative analysis of LST characteristics across different UFZs
In examining the seasonal dynamics of LST across the four UFZs, all exhibited a consistent trend, with peak values in summer and the lowest in winter, reflecting general climatic patterns. However, differences in LST magnitudes among UFZs highlight the influence of land-use functionality, surface material characteristics, and vegetation coverage. Overall, summer exhibited the highest LST values across all UFZs, indicating the most pronounced UHI effects during this season (Mo et al., 2024), while winter presented the lowest.
Throughout the year, HTZs were primarily concentrated in the northern part of Xiamen Island, particularly in areas dominated by warehouse storage land and around Gaoqi Airport. This area experiences heat accumulation due to frequent logistics activities and extensive impervious surfaces, although the low BD slightly mitigates this effect, resulting in a distinct UHI effect. Among the UFZs, WSB consistently recorded the highest average LST across all seasons, reaching up to 44.13 °C in summer. This can be attributed to its structural traits—large roof areas, limited vegetation, and a high proportion of impervious surfaces—that promote heat absorption and retention. Therefore, WSBs should be prioritized in urban heat mitigation strategies, such as adopting reflective roofing, expanding vegetated areas, and enhancing ventilation design (Zhu et al., 2023). Elsewhere on the island, low-temperature zones were mainly distributed in Wanshi Mountain, Yundang Lake, and Wuyuan Bay Wetland Park. The forests and water bodies in these areas provide a noticeable cooling effect in spring and summer, indicating that creating green corridors or ecological parks around WSBs could help enhance the local microclimate.
CBSB and PAB land showed intermediate LST values, suggesting that their temperatures are influenced by a combination of factors, such as BD and green space distribution. CBSB recorded elevated LSTs, particularly in summer (41.84 °C), likely due to high human activity, dense impervious coverage, and increased anthropogenic heat emissions. Compared to CBSB, PAB showed slightly lower summer LSTs, potentially due to greater integration of green infrastructure or lower heat-emitting surfaces.
4.2 Seasonal impacts of different UFZs on LST
The DI values for the four UFZs reveal distinct seasonal variations. The DI for RB was below 1 in spring, autumn, and winter, indicating a minimal contribution to the UHI effect during colder months. This suggests that residential areas on Xiamen Island are less thermally intensive in winter, potentially due to lower anthropogenic heat emissions. In summer, the DI for RB reached 1.0431, suggesting a mild UHI effect, possibly influenced by increased human activities such as cooling energy usage and transportation. The DI for PAB remained relatively stable, reflecting consistent thermal performance throughout the year. This may be attributed to the stable function of public service facilities and balanced energy consumption patterns across different seasons. The DI for CBSB showed noticeable fluctuations but remained above 1, indicating that CBSB consistently contributed to HTZs throughout the year. The DI was highest in summer, likely due to increased commercial activities, higher cooling energy consumption, and extensive impervious surfaces.
WSB consistently maintained high DI values across all four seasons. This could be attributed to factors such as large impervious surfaces, minimal vegetation coverage, and potentially high heat retention from industrial and storage facilities. The high DI values in WSB indicate that this UFZ plays a crucial role in the thermal environment of Xiamen Island, particularly in winter when other UFZs showed reduced contributions to the UHI effect (Xu et al., 2023). In general, RB, PAB, and CBSB showed moderate seasonal fluctuations in their influence on LST. In contrast, the distinctive functional and spatial characteristics of WSB led to its consistently greater contribution to LST across all seasons.
4.3 Driving factors of seasonal LST variations for different UFZs
The stepwise regression model results demonstrate that in spring and summer, both natural and human factors noticeably influenced LST across different UFZs. The high R2 values in these seasons suggest that the selected driving factors effectively explained LST variations. However, in fall and winter, the explanatory power of the models decreased—particularly in winter—where a drop in R2 was observed across most UFZs, indicating that the mechanisms governing LST variations became more complex.
The decreased explanatory power of the model in winter may be due to multiple interacting factors. Natural conditions such as solar radiation, wind speed, and humidity fluctuate more during this season, reducing model stability. As an island city, Xiamen experiences stronger land-sea breezes in winter, creating local microclimate effects that contribute to LST variability. Additionally, the absence of centralized heating in southern China leads to more dispersed heat sources, unlike in northern cities, where centralized heating significantly impacts the urban thermal environment (Liu et al., 2025). Changes in human activity patterns—such as reduced commuting and outdoor behavior—further alter heat distribution, making winter LST modeling more challenging.
For RB, seasonal LST was primarily and positively influenced by the Y coordinate; as the geographic location of the blocks extended farther north, surface temperatures tended to increase. The northern part of Xiamen Island is separated from the mainland by the sea and connected by bridges and tunnels. It is located on the inner side of the Xiamen Bay, an enclosed body of water, while the southern part faces the open Taiwan Strait, which exerts a greater climate-moderating effect. Due to its proximity to the mainland and weaker climatic regulation from the outer sea, the northern part generally experiences higher temperatures. As the Y coordinate increases, blocks farther from the Taiwan Strait are less influenced by the ocean’s moderating effects, resulting in elevated temperatures.
CONTAG, FAR, BD, and PD all showed clear effects on LST in residential areas. A high CONTAG value indicates a continuous distribution of land-cover types, including large areas of built-up land and extensive green spaces. Fragmented built environments contrast with well-planned infrastructure, such as drainage systems, which improve connectivity (Wei et al., 2021). Extensive green spaces contribute to cooling through transpiration and shading, helping dissipate heat and lower LST (Liu et al., 2022). Although FAR and BD are both indicators of urbanization intensity, they represent different aspects of urban form. FAR reflects the total building volume within a block, emphasizing vertical development, while BD measures the proportion of land occupied by buildings, highlighting horizontal density. A high FAR typically reflects vertical development strategies which, under urban planning regulations, release more ground-level space for greenery and open areas. These spaces enhance ecological buffering and promote ventilation (Song et al., 2024), thereby alleviating heat accumulation and reducing LST. In contrast, BD shows a noticeable positive relationship with LST. As BD increases, more buildings occupy limited land, often reducing green space and open areas (Hu Q et al., 2024). High-density buildings and hard surfaces tend to absorb more heat and release it more slowly (Luo et al., 2014), while the lack of adequate green cover or sufficient air circulation exacerbates the UHI effect. PD also influenced LST in spring and summer. During these seasons, the use of air conditioning and cooling devices rises noticeably in densely populated areas, leading to higher energy consumption and anthropogenic heat emissions, which directly increase LST (Moustaoui et al., 2015). However, the effect of PD on LST weakened in autumn and had a minimal observable impact in winter.
For PAB, seasonal LST variations demonstrated noticeable were noticeably associated with both the Y coordinate and PD. PAB areas are typically located in the city centers or near major transportation corridors to provide efficient public services (Chen, 2023). These areas often have high population densities due to their diverse functions, including government offices, schools, hospitals, and parks (Sun et al., 2023). Frequent social activities in PABs result in heat accumulation, while higher PD leads to increased energy demand. Dense human activity also generates additional heat through traffic flow, vehicle emissions, and heating, further intensifying the UHI effect (Liu et al., 2021).
For CBSB, which is generally concentrated in urban centers or transportation hubs, LST is influenced by both natural and human factors (He and Zhang, 2012). Notably, the Y coordinate played a prominent role in shaping CBSB LSTs, while SHDI, FAR, BD, and PD were also key driving factors. High-density development and human activity contribute to a pronounced UHI effect in CBSB (Tang et al., 2017). SHDI, as an indicator of landscape diversity, showed a negative correlation with LST. Higher SHDI values, which indicate more diverse land uses, tend to reduce LST (Yeh and Huang, 2009). In commercial areas, diversified land use (e.g., well-planned vegetation, public spaces, and water features) can help to mitigate the UHI effect. FAR was negatively correlated with LST, not because tall buildings themselves improve airflow, but because vertical development frees up ground space for vegetation and ventilation corridors, which facilitate better circulation and natural cooling (Zhou et al., 2014). In contrast, BD showed a positive correlation with LST. Additionally, PD influenced LST during spring and summer, particularly especially in central commercial districts where elevated pedestrian and vehicular activity contributed to greater energy use and anthropogenic heat.
For WSB, LST variations were influenced by a combination of factors, with the main drivers varying seasonally. In autumn and winter, the Y coordinate showed a clear relationship with WSB LSTs, indicating warmer temperatures in more northerly locations. WSBs are usually located near ports or transport hubs (Pamadi and Sari, 2022). The northern part of Xiamen Island, which is closer to the mainland and faces an enclosed bay, accumulates heat more easily due to weaker climatic regulation, resulting in higher temperatures.In terms of human activities, warehouse buildings are primarily used for storage with low vertical development intensity, rather than for dense residential or office purposes (Bartolini et al., 2019). Their low FAR and BD result in minimal impacts on LST. SHDI exhibited a noticeable inverse relationship with LST in summer and autumn, indicating that higher landscape diversity helps to alleviate temperature increases. The widespread use of heat-retentive materials in WSB areas, such as concrete and asphalt, leads to heat accumulation; however, the presence of diverse landscape elements (e.g., small grasslands or forests) can create local cooling effects, reducing heat buildup. This effect had a noticeable influence on LST in spring, summer, and autumn. PD exhibited positive correlations during spring, summer, and autumn. Increased logistics and transportation activities during these seasons drive higher energy consumption and anthropogenic heat emissions (Wu et al., 2018; Devlin and Yee, 2005).
Across all four UFZs, the Y coordinate consistently emerged as an important factor influencing seasonal LST variations. This dominance of the Y coordinate—rather than the X coordinate—can be attributed to Xiamen’s unique geographical setting. The northern part of Xiamen Island is adjacent to the mainland, where the regulating effect of the open sea is relatively weak, leading to higher surface temperatures. In contrast, the southern part faces the Taiwan Strait, where stronger oceanic regulation exerts a cooling effect. On the western side, Xiamen Island is separated from Haicang District by the sea, while in the southwest, the presence of Kinmen Island provides partial shelter in winter, altering local airflow and weakening direct marine influence. These geographical factors collectively explain why the Y coordinate, reflecting the north–south gradient, plays a more dominant role in shaping LST variations than the X coordinate.
4.4 Implications for urban planning
Based on the analysis of seasonal divergence in LST driving factors across different UFZs, we identified heterogeneous thermal response mechanisms among various block types under seasonal change. RB and CBSB exhibited multidimensional and complex driving characteristics, suggesting that urban design must integrate multiple elements such as BD, PD, and GR to enhance thermal regulation capacity. In contrast, due to functional attributes and structural limitations, PAB and WSB demonstrated relatively singular thermal response mechanisms, requiring targeted regulation strategies focusing on dominant influencing factors. Therefore, in urban planning, seasonally adaptive and land-use-specific design approaches should be adopted to align with the morphological and functional characteristics of different UFZs, thereby improving environmental quality, enhancing urban resilience, and promoting sustainable urban development (Figure 7).
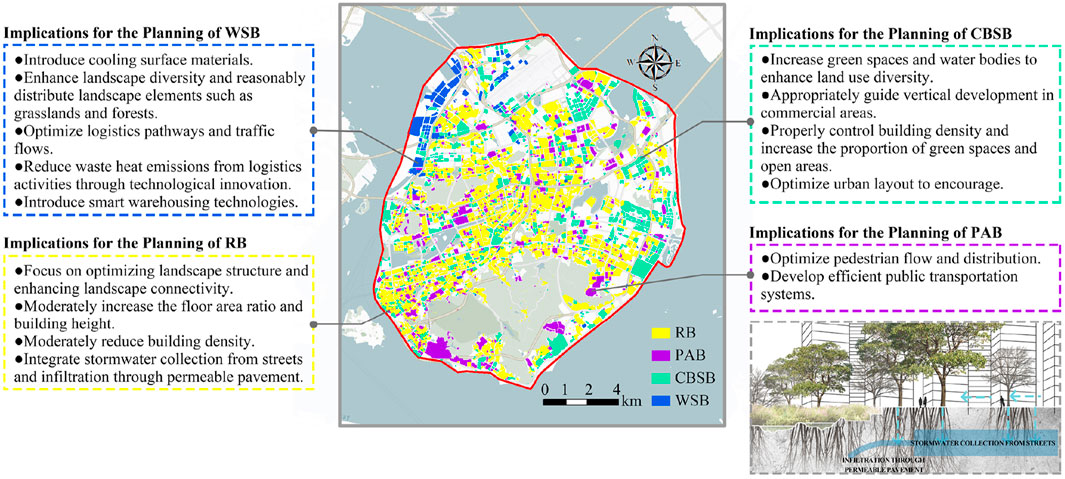
Figure 7. Planning measures for different UFZs.
In the northern part of the study area, the Gaoqi Airport’s extensive infrastructure and continuous aircraft operations generate anthropogenic heat through engine emissions and thermal accumulation on hard surfaces, substantially elevating LST across the surrounding landscapes (Wang et al., 2015). The future commissioning of Xiang’an International Airport and its relocation to a suburban area may reduce LST in the adjacent RB and WSB zones.
The study revealed that RBs generally exhibit strong temperature-regulation capacity, especially in summer, likely due to well-planned layouts and substantial green coverage. Urban planning should optimize residential land-use structures to mitigate summer heat and ensure year-round thermal comfort. Within residential areas, higher BD correlates positively with LST, indicating stronger UHI effects. To address this issue, strategies such as stormwater collection and permeable pavements can enhance cooling through improved infiltration and reduced runoff. Moderately reducing BD and increasing green, open spaces can promote air circulation and evapotranspiration, thereby improving thermal comfort (Zölch et al., 2019). Conversely, FAR is negatively correlated with LST, indicating that higher FAR achieved through vertical development can release more ground-level space for greenery, ventilation, and public use, which in turn mitigates urban heat. The negative correlation between LST and CONTAG highlights the cooling benefits of connected green and hard surfaces. Planning should maintain green connectivity, avoid fragmentation, and create contiguous green belts to support ecological sustainability through evapotranspiration. In Xiamen, for example, introducing season-specific vegetation strategies—such as using drought-resistant tree species in summer and evergreen vegetation in winter—can improve resilience to seasonal heat fluctuations. Moreover, targeted interventions like creating shaded pedestrian corridors in high-density residential areas along Siming District can directly enhance thermal comfort.
For PAB, DI values remained stable across seasons, indicating a consistent thermal impact. Planning should control BD and enhance greenery to further reduce the UHI effect. As PD influences LST in PAB areas, optimizing pedestrian flow, improving public transportation, and promoting green travel (Wang et al., 2024) can help reduce localized heat accumulation. For coastal PAB areas in Xiamen, establishing continuous waterfront green corridors can combine ecological functions with cooling services, while redesigning bus hubs with integrated shading and ventilation can reduce concentrated heat buildup around transport facilities.
CBSB showed the highest DI in summer and remained heat-intensive year-round. The negative correlation between SHDI and LST underscores the value of land-use diversity. Enhancing greenery and water bodies in commercial zones can promote cooling through transpiration (Lin et al., 2017) and evaporation (Gupta et al., 2019). Encouraging high-rise development can reduce surface heat by limiting low-rise, high-density configurations. Reducing BD and increasing open spaces can further improve air circulation and decrease heat buildup. Additionally, optimizing urban layouts to decentralize human and vehicular activities and improving public transportation accessibility can help to mitigate emissions and heat generation. For instance, in Xiamen’s CBD around Lujiang Road and the Huli District, prioritizing rooftop gardens, pocket parks, and seasonal cooling installations (e.g., misting systems in summer) could effectively reduce concentrated thermal stress in commercial clusters.
The WSB, with DI values exceeding 2 in all seasons, had the greatest thermal impact. Typically located on urban fringes, WSB areas feature low BD, large block sizes, and limited greenery, making them prone to heat accumulation. Key influencing factors include SHDI, CONTAG, the Y coordinate, and PD. The dominance of concrete and asphalt surfaces exacerbates heat retention. To counter this effect, cooling materials such as permeable pavements, reflective surfaces, and integrated greenery should be adopted (Li et al., 2013; Santamouris, 2013). Furthermore, logistics activities intensify anthropogenic heat emissions. Planning should optimize logistics routes, promote low-emission vehicles, and adopt smart logistics technologies to enhance efficiency and reduce heat (Chen et al., 2022; Chen et al., 2024; Liu et al., 2024). For logistics hubs in northern Xiamen, targeted cooling interventions such as shaded loading/unloading areas, seasonal scheduling of heavy transport at cooler times of the day, and dedicated vegetated buffer zones between warehouses and adjacent RBs could substantially mitigate localized overheating.
To emphasize the importance of seasonal dynamics, we propose differentiated and adaptive regulatory strategies tailored to the unique thermal characteristics of each UFZ type across seasons. For RBs, where summer temperatures present the greatest challenge, integrating seasonal vegetation rotation, dynamic shading systems, and passive cooling technologies can help maintain comfort. In PABs, the emphasis should be on maintaining ecological continuity year-round through resilient green corridors and seasonally programmable public spaces that can adjust their usage and thermal functions with changing weather. CBSBs, characterized by year-round high DI values, require smart shading infrastructure, seasonally adjustable rooftop greenery, and microclimate-enhancing public amenities to better mitigate summer heat. As for WSBs, which consistently dominate HTZs, adopting seasonal surface treatments, logistics scheduling adjustments, and rotational greening zones can improve heat dissipation without disrupting industrial efficiency.These strategies, when localized to Xiamen’s context, could include season-specific greening programs for residential blocks, targeted cooling measures in commercial cores, and smart logistics management at airport-adjacent industrial parks, thereby offering actionable pathways for other island cities facing similar thermal challenges.
4.5 Limitations and future directions
We examined seasonal variations in LST and their driving factors across four UFZs—RB, PAB, CBSB, and WSB. These findings can inform targeted strategies to mitigate urban thermal threats. However, few limitations and uncertainties must be acknowledged. First, the study relied on Landsat 8 remote sensing data, which have a 30-m spatial resolution and a 16-day temporal resolution. While these data effectively capture large-scale LST changes, they may underestimate fine-scale thermal heterogeneity, including street canyon effects and small-scale green infrastructure. In this study, Landsat 8 data were chosen for their consistent temporal coverage and wide availability across seasons, which is essential for seasonal comparative analysis. To address this limitation, future studies should incorporate higher-resolution thermal datasets, such as UAV-based thermal infrared imagery, ECOSTRESS or Sentinel-3 data, to validate and refine the assessment of micro-scale thermal patterns (Ren et al., 2015; Xu S et al., 2021). Second, this study primarily focused on UFZs dominated by human activities, excluding other categories such as forest land, grassland, and agricultural facility zones. However, these excluded UFZs may also influence the urban thermal environment, especially in regions with substantial green coverage or ecological and agricultural functions. Expanding future research to include a broader spectrum of UFZs could enhance our understanding of urban thermal patterns and offer more refined guidance for sustainable urban planning and heat mitigation strategies. Third, the data used in this study were limited to specific seasons and single-day observations, which may not fully capture the dynamic characteristics of year-round climate variations. Among the potential directions, the most urgent improvement is the systematic integration of meteorological data (e.g., solar radiation, humidity, wind speed, and sea breeze effects), since these factors directly drive seasonal LST variability and are particularly critical for island cities. Key meteorological conditions—such as solar radiation, humidity, and wind speed—exhibit notable seasonal differences (e.g., enhanced solar radiation in spring and summer or intensified land-sea temperature contrasts and sea breeze effects in winter, particularly in island cities), which may result in more complex LST patterns. However, these factors were not systematically incorporated into the analysis. Therefore, future research should utilize year-round climate data to provide a more comprehensive understanding of how climate variability affects LST. Fourth, socioeconomic factors received limited attention. Although some aspects of human activity were included, the impacts of energy consumption patterns (e.g., air-conditioning use), anthropogenic heat emissions, and traffic density on LST were not explored in detail. These factors can play pivotal roles in shaping urban thermal environments, particularly in CBSB and PAB areas, where energy-intensive activities are common. Future studies should integrate more socioeconomic variables to build comprehensive models that evaluate the long-term impacts of human activities on LST and provide robust theoretical foundations for managing urban thermal environments (Gao et al., 2024). Fifth, the sample size for WSB was substantially than that for the other UFZs, primarily because WSBs typically occupy larger land areas, resulting in fewer individual blocks. However, despite the smaller number of samples, each WSB block covered a relatively large area, which allows it to adequately capture the thermal environment characteristics of this UFZ. Therefore, we consider the WSB sample reasonably representative in terms of spatial distribution and land use characteristics. Nevertheless, the limited sample size may still affect the stability and generalizability of the results. Future studies should incorporate a larger WSB sample by including data from additional regions to further validate these findings.
Finally, a key limitation of this study is the use of stepwise regression analysis. While effective in identifying linear relationships, it fails to capture the complex non-linear interactions between LST and its influencing factors. Additionally, the inability to directly incorporate the sea breeze effect—a notable influence on island cities such as Xiamen—due to the lack of high-resolution meteorological data further limits the accuracy of the model. Therefore, while finer temporal resolution and machine learning models remain promising directions, the integration of high-resolution meteorological data should be prioritized as the most urgent step to enhance the accuracy and robustness of urban thermal environment modeling. Future research should explore non-linear approaches, such as machine learning, and incorporate dynamic meteorological factors—including sea breeze, humidity, and solar radiation—to enhance the understanding of urban thermal dynamics and improve model precision (Mutani et al., 2024).
5 Conclusion
We examined the seasonal variations in LST across different UFZs (RB, PAB, CBSB, and WSB) on Xiamen Island, exploring the spatial heterogeneity of the urban thermal environment and its driving factors.
First, clear differences in seasonal LST changes were observed across functional zones. WSBs are the most prominent contributors to HTZs throughout the year, especially in winter, when their DI is markedly higher than that of other land-use categories, highlighting their dominant influence on LST. In contrast, RBs have relatively low contributions to LST, demonstrating strong temperature-regulating capabilities, with UHI effects observed only in summer. PABs exhibited stable and balanced impacts on LST across all seasons, whereas CBSBs displayed seasonal variations with high contributions to LST.
Second, both natural and anthropogenic factors shaped LST dynamics, but their importance varied by zone and season. The Y coordinate consistently acted as a key natural factor influencing the LST of all four UFZs, with higher temperatures observed in more northerly block locations. PD showed seasonal variation in its impact on LST across all UFZs. In PABs, LST was influenced by both the Y coordinate and PD. In RBs, BD, FAR, and CONTAG had important impacts on LST. CBSBs experienced major LST effects from SHDI, BD, and FAR due to high PD, traffic, and development intensity. Although WSBs have lower BD, they exhibit notable heat island effects throughout the year, driven by frequent logistics activities and extensive impervious surfaces. Higher SHDI values help mitigate this effect by enhancing landscape diversity.
Third, the seasonal differences in driving mechanisms underscore the necessity of developing land-use-specific and adaptive urban planning strategies. In RB and CBSB areas, where multiple factors—including BD and FAR—exert significant influences on LST during summer and winter, targeted interventions such as increasing vegetation coverage, constructing landscape water features, and controlling BD and regulating FAR on newly developed parcels during the planning phase can effectively mitigate heat accumulation. In contrast, PAB and WSB exhibit relatively stable thermal patterns driven by a limited number of key factors; therefore, targeted measures such as enhancing green spaces, maintaining open areas, and optimizing land-use layouts can facilitate efficient seasonal temperature regulation. Collectively, these strategies provide practical, theory-informed guidance for adaptive urban thermal management across diverse functional zones.
Fourth, unique geographical effects amplified the spatial heterogeneity of LST in this island setting. The northern part of the island, being closer to the mainland, experiences weaker sea breeze and humidity regulation, resulting in higher LST. In contrast, the southern part is more influenced by the open-sea climate of the Taiwan Strait, leading to relatively lower LST. This geographical disparity further intensifies the spatial heterogeneity of LST in island cities.
Finally, the findings emphasize the importance of urban planning in regulating thermal environments. Strategies such as optimizing UFZ layouts, enhancing green coverage, and adjusting building density are vital for mitigating UHI effects.
The novelty of this study lies mainly in two aspects: (1) it conducts a systematic cross-seasonal analysis of the thermal environment in an island city, integrating both natural factors and human impact factors; and (2) by adopting China’s territorial spatial planning framework and using clearly defined UFZs (e.g., RB, PAB, CBSB, WSB) as analytical units, it enables a finer-grained exploration of the spatial attributes and heterogeneity of functional land, thereby enhancing the precision and applicability of the results.
Future research should aim to overcome current limitations by utilizing high-resolution and high-frequency remote sensing data, such as ECOSTRESS or Sentinel, to improve the detection of fine-scale and short-term LST variations. Expanding the study scope to include ecologically important UFZs, such as forest land, grassland, and agricultural zones, would provide a more holistic understanding of urban thermal environments. Additionally, integrating year-round meteorological variables (e.g., solar radiation, humidity, wind speed, and sea-breeze effects) and socioeconomic factors (e.g., energy use, traffic density, and anthropogenic heat emissions) is essential for capturing the dynamic nature of LST and its drivers. Increasing the sample size for underrepresented UFZs like WSB and applying advanced non-linear modeling techniques, such as machine learning, could further enhance model accuracy and the applicability of findings. These improvements will support the development of comprehensive, data-driven strategies for managing urban heat in diverse functional zones, especially in coastal and island cities.
Moreover, the methodological framework established in this study demonstrates strong transferability to other regions. By combining UFZ-based spatial units, multi-seasonal LST monitoring, and integrated analyses of natural and anthropogenic factors, this approach provides a replicable template for assessing urban thermal environments in diverse contexts worldwide. Its adaptability allows city planners and policymakers across different climatic, geographic, and socio-economic settings to diagnose local heat dynamics, design targeted mitigation measures, and promote sustainable urban development.
The results of this study enhance our understanding of the thermal environment in island cities and provide a scientific basis for the formulation of differentiated urban cooling strategies. Importantly, the demonstrated methodology not only benefits Xiamen but also serves as a transferable framework for cities worldwide, offering valuable insights for improving urban livability and sustainability.
Data availability statement
Publicly available datasets were analyzed in this study. This data can be found here: Landsat 8 OLI/TIRS imagery was obtained from the United States Geological Survey (USGS): https://earthexplorer.usgs.gov Population density data was obtained from WorldPop: https://www.worldpop.org Digital Elevation Model (DEM) data was sourced from the Geospatial Data Cloud: http://www.gscloud.cn Nighttime light data (NPP–VIIRS) was obtained from the National Earth System Science Data Center: https://www.geodata.cn.
Author contributions
YX: Visualization, Data curation, Formal Analysis, Methodology, Writing – review and editing, Software, Conceptualization, Investigation, Writing – original draft, Resources.
Funding
The author(s) declare that no financial support was received for the research and/or publication of this article.
Conflict of interest
The author declares that the research was conducted in the absence of any commercial or financial relationships that could be construed as a potential conflict of interest.
Generative AI statement
The author(s) declare that no Generative AI was used in the creation of this manuscript.
Any alternative text (alt text) provided alongside figures in this article has been generated by Frontiers with the support of artificial intelligence and reasonable efforts have been made to ensure accuracy, including review by the authors wherever possible. If you identify any issues, please contact us.
Publisher’s note
All claims expressed in this article are solely those of the authors and do not necessarily represent those of their affiliated organizations, or those of the publisher, the editors and the reviewers. Any product that may be evaluated in this article, or claim that may be made by its manufacturer, is not guaranteed or endorsed by the publisher.
References
Abdullah, S., Barua, D., Abdullah, S. M. A., and Rabby, Y. W. (2022). Investigating the impact of land use/land cover change on present and future land surface temperature (LST) of Chittagong, Bangladesh. Earth Syst. Environ. 6, 221–235. doi:10.1007/s41748-021-00291-w
Ai, J., Yu, K., Zeng, Z., Yang, L., Liu, Y., and Liu, J. (2022). Assessing the dynamic landscape ecological risk and its driving forces in an island city based on optimal spatial scales: haitan island, China. Ecol. Indic. 137, 108771. doi:10.1016/j.ecolind.2022.108771
Ali, S. A., Parvin, F., and Ahmad, A. (2022). Retrieval of land surface temperature from landsat 8 OLI and TIRS: a comparative analysis between radiative transfer equation-based method and split-window algorithm. Remote Sens. Earth Syst. Sci. 6 (1–2), 1–21. doi:10.1007/s41976-022-00079-0
Amantai, N., and Ding, J. (2021). Analysis on the spatio-temporal changes of LST and its influencing factors based on VIC model in the arid Region from 1960 to 2017: an example of the ebinur Lake Watershed, Xinjiang, China. Remote Sens. 13 (23), 4867. doi:10.3390/rs13234867
Angel, S., and Blei, A. M. (2016). The spatial structure of American cities: the great majority of workplaces are no longer in CBDs, employment sub-centers or live-work communities. Cities 51, 21–35. doi:10.1016/j.cities.2015.11.031
Bartolini, M., Bottani, E., and Grosse, E. H. (2019). Green warehousing: systematic literature review and bibliometric analysis. J. Clean. Prod. 226, 242–258. doi:10.1016/j.jclepro.2019.04.055
Bi, Y., Xue, B., and Zhang, M. (2020). “Evolving deep Forest with automatic feature extraction for image classification using genetic programming,” in Lecture notes in computer science (Cham: Springer), 3–18. doi:10.1007/978-3-030-58112-1_1
Chai, C., He, Y., Yu, P., Zheng, Y., Chen, Z., Fan, M., et al. (2022). Spatiotemporal evolution characteristics of urbanization in the Xiamen Special Economic Zone based on nighttime-light data from 1992 to 2020. Land 11 (8), 1264. doi:10.3390/land11081264
Chen, C. (2023). Discussion on the optimization method of public service facility layout from the perspective of spatial equity: a Study based on the central City of Shanghai. Land 12 (9), 1780. doi:10.3390/land12091780
Chen, J., Xu, S., Liu, K., Yao, S., Luo, X., and Wu, H. (2022). Intelligent transportation logistics optimal warehouse location method based on internet of things and blockchain technology. Sensors 22 (4), 1544. doi:10.3390/s22041544
Chen, J., Xu, S., Liu, K., Yao, S., Luo, X., and Wu, H. (2024). HAC-Based adaptive combined Pick-Up path optimization strategy for intelligent warehouse. Intell. Serv. Robot. 17, 1031–1043. doi:10.1007/s11370-024-00556-z
Cheng, J., Turkstra, J., Peng, M., Du, N., and Ho, P. (2006). Urban land administration and planning in China: opportunities and constraints of spatial data models. Land Use Policy 23 (4), 604–616. doi:10.1016/j.landusepol.2005.05.010
Devlin, J., and Yee, P. (2005). Trade logistics in developing countries: the case of the Middle East and North Africa. World Econ. 28 (3), 435–456. doi:10.1111/j.1467-9701.2005.00620.x
Ertunç, E. (2020). Analysis of the effect of land consolidation projects in terms of land fragmentation and parcel shapes: the case of Konya, Turkey. Arabian J. Geosciences 13 (10), 378. doi:10.1007/s12517-020-05344-4
Fujimoto, S., Mizuno, T., Ohnishi, T., Shimizu, C., and Watanabe, T. (2016). Relationship between population density and population movement in inhabitable lands. Evol. Institutional Econ. Rev. 14 (1), 117–130. doi:10.1007/s40844-016-0064-z
Gao, Y., Li, N., Gao, M., Hao, M., and Liu, X. (2024). Modelling future land surface temperature: a comparative analysis between parametric and non-parametric methods. Sustainability 16, 8195. doi:10.3390/su16188195
Gastwirth, J. L., Gel, Y. R., and Miao, W. (2010). The impact of Levene’s test of equality of variances on statistical theory and practice. arXiv Prepr. arXiv:1010.0308. doi:10.48550/ARXIV.1010.0308
Godina, R., and Matias, J. C. O. (2018). “Improvement of the statistical process control through an enhanced test of normality,” in 2018 7th international conference on industrial technology and management (ICITM), 17–21. doi:10.1109/ICITM.2018.8333912
Gupta, N., Mathew, A., and Khandelwal, S. (2019). Analysis of cooling effect of water bodies on land surface temperature in nearby region: a case study of Ahmedabad and Chandigarh cities in India. Egypt. J. Remote Sens. Space Sci. 22 (1), 81–93. doi:10.1016/j.ejrs.2018.03.007
He, M., and Zhang, W. Y. (2012). Discussion on basic modes of CBD construction in regional central cities in China: a case study of Chengdu. Appl. Mech. Mater. 253-255, 219–228. doi:10.4028/www.scientific.net/AMM.253-255.219
Hu, Y., and Han, Y. (2019). Identification of urban functional areas based on POI data: a case study of the Guangzhou Economic and Technological Development Zone. Sustainability 11 (5), 1385. doi:10.3390/su11051385
Hu, C., Wu, W., Zhou, X., and Wang, Z. (2023). Spatiotemporal changes in landscape patterns in karst mountainous regions based on the optimal landscape scale: a case study of Guiyang City in Guizhou Province, China. Ecol. Indic. 150, 110211. doi:10.1016/j.ecolind.2023.110211
Hu, J., Zhang, F., Qiu, B., Zhang, X., Yu, Z., Mao, Y., et al. (2024). Green-gray imbalance: rapid urbanization reduces the probability of green space exposure in early 21st century China. Sci. Total Environ. 933, 173168. doi:10.1016/j.scitotenv.2024.173168
Hu, Q., Zhang, Y., Wang, J., Huo, R., and Feng, Z. (2024). The evaluation of territorial spatial planning from the perspective of sustainable development goals. Sustainability 16 (7), 2965. doi:10.3390/su16072965
Huang, X., and Wang, Y. (2019). Investigating the effects of 3D urban morphology on the surface urban heat island effect in urban functional zones by using high-resolution remote sensing data: a case study of Wuhan, Central China. ISPRS J. Photogrammetry Remote Sens. 152, 119–131. doi:10.1016/j.isprsjprs.2019.04.010
Ibrahim, I., Abu Samah, A., Fauzi, R., and Noor, N. M. (2016). The land surface temperature impact on land cover types. The International Archives of the Photogrammetry. Remote Sens. Spatial Inf. Sci. XLI-B3, 871–876. doi:10.5194/isprs-archives-XLI-B3-871-2016
Irawati, D., Noviani, R., and Rindarjono, M. G. (2023). Effect urban development on urban heat island in Depok Subdistrict, Sleman Regency, Yogyakarta. IOP Conf. Ser. Earth Environ. Sci. 1180 (1), 012021. doi:10.1088/1755-1315/1180/1/012021
Jabbar, M., and Yusoff, M. M. (2022). Assessing the spatiotemporal urban green cover changes and their impact on land surface temperature and urban heat island in Lahore (Pakistan). Geogr. Environ. Sustain. 15 (1), 130–140. doi:10.24057/2071-9388-2021-005
Jun, C., Hanwei, L., and Junyan, Y. (2013). The expansion model and inner mechanism of city spatial structure system. Mod. Urban Res. 8, 14–18. doi:10.3969/j.issn.1009-6000.2013.08.003
Kim, Y., and Kim, Y. (2024). Deep learning-based analytic framework using comprehensive urbanization index for heat vulnerability assessment in urban areas. Expert Syst. Appl. 235, 121140. doi:10.1016/j.eswa.2023.121140
Li, X., Lin, T., Zhang, G., Xiao, L., Zhao, Q., and Cui, S. (2011). Dynamic analysis of urban spatial expansion and its determinants in Xiamen Island. Chin. Geogr. Sci. 21 (5), 503–520. doi:10.1007/s11442-011-0860-7
Li, H., Harvey, J. T., Holland, T. J., and Kayhanian, M. (2013). The use of reflective and permeable pavements as a potential practice for heat island mitigation and stormwater management. Environ. Res. Lett. 8 (1), 015023. doi:10.1088/1748-9326/8/1/015023
Lin, H., Chen, Y., Zhang, H., Fu, P., and Fan, Z. (2017). Stronger cooling effects of transpiration and leaf physical traits of plants from a hot dry habitat than from a hot wet habitat. Funct. Ecol. 31 (12), 2202–2211. doi:10.1111/1365-2435.12923
Liu, C., and Yang, M. (2020). An empirical analysis of dynamic changes in ecological sustainability and its relationship with urbanization in a coastal city: the case of Xiamen in China. J. Clean. Prod. 256, 120482. doi:10.1016/j.jclepro.2020.120482
Liu, B., Xie, Z., Qin, P., Liu, S., Li, R., Wang, L., et al. (2021). Increases in anthropogenic heat release from energy consumption lead to more frequent extreme heat events in urban cities. Adv. Atmos. Sci. 38 (3), 430–445. doi:10.1007/s00376-020-0139-y
Liu, K., Li, X., Wang, S., and Gao, X. (2022). Assessing the effects of urban green landscape on urban thermal environment dynamic in a semiarid city by integrated use of airborne data, satellite imagery and land surface model. Int. J. Appl. Earth Observation Geoinformation 107, 102674. doi:10.1016/j.jag.2021.102674
Liu, J., Zhang, S., Yin, L., Li, B., and Zhang, B. (2023). Exploring the relationship between seasonal variations of land surface temperature and urban morphological factors in complex urban areas. Environ. Sci. Pollut. Res. 30 (21), 59861–59876. doi:10.1007/s11356-023-26781-0
Liu, Y., Zhang, W., Liu, W., Tan, Z., Hu, S., Ao, Z., et al. (2024). Exploring the seasonal effects of urban morphology on land surface temperature in urban functional zones. Sustain. Cities Soc. 103, 105268. doi:10.1016/j.scs.2024.105268
Liu, H., Du, Z., Xue, T., and Jiang, T. (2025). Enhancing smart building performance with waste heat recovery: Supply-side management, demand reduction, and peak shaving via advanced control systems. Energy Build. 327, 115070. doi:10.1016/j.enbuild.2024.115070
Luo, X. Y., Ge, J., and Zhang, Y. (2014). Simulation study about impact of building density on heat island effect. Appl. Mech. Mater. 590, 353–357. doi:10.4028/www.scientific.net/AMM.590.353
Mas, J.-F., Lemoine-Rodríguez, R., González-López, R., López-Sánchez, J., Piña-Garduño, A., and Herrera-Flores, E. (2017). Land use/land cover change detection combining automatic processing and visual interpretation. Eur. J. Remote Sens. 50 (1), 626–635. doi:10.1080/22797254.2017.1387505
Mo, Y., Bao, Y., Wang, Z., Wei, W., and Chen, X. (2024). Spatial coupling relationship between architectural landscape characteristics and urban heat island in different urban functional zones. Build. Environ. 257, 111545. doi:10.1016/j.buildenv.2024.111545
Mo, G., Yan, L., Li, Z., Wang, Z., Chen, S., Li, H., et al. (2024). Spatiotemporal changes of urban heat island effect relative to land surface temperature: a case study of Jinan City, China. Environ. Sci. Pollut. Res. 31, 51902–51920. doi:10.1007/s11356-024-34638-3
Moustaoui, M., Salamanca, F., Mahalov, A., and Georgescu, M. (2015). Summertime response of temperature and cooling energy demand to urban expansion in a semiarid environment. J. Appl. Meteorology Climatol. 54 (9), 1756–1772. doi:10.1175/JAMC-D-14-0313.1
Mutani, G., Scalise, A., Sufa, X., and Grasso, S. (2024). Synergising machine learning and remote sensing for urban heat island dynamics: a comprehensive modelling approach. Atmosphere 15 (12), 1435. doi:10.3390/atmos15121435
Nanayakkara, S., Wang, W., Cao, J., Wang, J., and Zhou, W. (2023). Analysis of urban heat island effect, heat stress and public health in Colombo, Sri Lanka and Shenzhen, China. Atmosphere 14 (5), 839. doi:10.3390/atmos14050839
Odunuga, S., and Badru, G. (2015). Landcover change, land surface temperature, surface albedo and topography in the Plateau region of North-Central Nigeria. Land 4 (2), 300–324. doi:10.3390/land4020300
Ouchra, H., Belangour, A., and Erraissi, A. (2023). Machine learning algorithms for satellite image classification using Google Earth Engine and Landsat satellite data: morocco case study. IEEE Access 11, 71127–71142. doi:10.1109/ACCESS.2023.3293828
Palou, F. S., and Mahalov, A. (2019). Summer- and wintertime variations of the surface and near-surface urban heat island in a semiarid environment. Weather Forecast. 34 (6), 1849–1865. doi:10.1175/WAF-D-19-0054.1
Pamadi, M., and Sari, Y. A. (2022). Challenges of developing a logistics hub case Study: batu ampar port. TATALOKA 24 (3), 249–256. doi:10.14710/tataloka.24.3.249-256
Pambuku, A., Elia, M., Gardelli, A., Giannico, V., Sanesi, G., Bergantino, S., et al. (2024). Assessing urbanization dynamics using a pixel-based nighttime light indicator. Ecol. Indic. 166, 112486. doi:10.1016/j.ecolind.2024.112486
Rahmat, F., Zulkafli, Z., Ishak, A. J., Abdul Rahman, R. Z., Stercke, S. D., Buytaert, W., et al. (2023). Supervised feature selection using principal component analysis. Knowl. Inf. Syst. 66 (3), 1955–1995. doi:10.1007/s10115-023-01993-5
Rees, G., Hebryn-Baidy, L., and Belenok, V. (2024). Temporal variations in land surface temperature within an urban ecosystem: a comprehensive assessment of land use and land cover change in Kharkiv, Ukraine. Remote Sens. 16 (9), 1637. doi:10.3390/rs16091637
Ren, P., Meng, Q., Zhang, Y., Zhao, L., Yuan, X., and Feng, X. (2015). An unmanned airship thermal infrared remote sensing system for low-altitude and high spatial resolution monitoring of urban thermal environments: integration and an experiment. Remote Sens. 7 (10), 14259–14275. doi:10.3390/rs71014259
Rinchumphu, D., Srivanit, M., Iamchuen, N., and Aryupong, C. (2024). Exploring summer variations of driving factors affecting land use zoning based on the surface urban heat island in Chiang Mai, Thailand. ISPRS Int. J. Geo-Information 13 (7), 228. doi:10.3390/ijgi13070228
Santamouris, M. (2013). Using cool pavements as a mitigation strategy to fight urban heat island—A review of the actual developments. Renew. Sustain. Energy Rev. 26, 224–240. doi:10.1016/j.rser.2013.05.047
Santamouris, M. (2014). Cooling the cities – a review of reflective and green roof mitigation technologies to fight heat island and improve comfort in urban environments. Sol. Energy 103, 682–703. doi:10.1016/j.solener.2012.07.003
Senaviratna, N. A. M. R., and Cooray, T. M. J. (2019). Diagnosing multicollinearity of logistic regression model. Asian J. Probab. Statistics 5 (2), 1–9. doi:10.9734/AJPAS/2019/v5i230132
Seto, K. C., Güneralp, B., and Hutyra, L. R. (2022). Global forecasts of urban expansion to 2030 and direct impacts on biodiversity and carbon pools. Proc. Natl. Acad. Sci. 109 (40), 16083–16088. doi:10.1073/pnas.1211658109
Song, D., Lu, M., and Xing, J. (2024). Impact of spatial layout on vertical wind conditions and comfort levels in high-rise residential buildings in Shenzhen. Urban Clim. 55, 101949. doi:10.1016/j.uclim.2024.101949
Srivastava, V., Sharma, A., and Jadon, S. S. (2024). Understanding the dynamics of urban heat island as a function of development regulations. J. Environ. Eng. Landsc. Manag. 32 (2), 93–103. doi:10.3846/jeelm.2024.20969
Sun, A., Huang, Y., Yang, L., Huang, C., and Xiang, H. (2023). Assessment of the impact of basic public service facility configuration on social–spatial differentiation: taking the Zhaomushan District of Chongqing, China. Sustainability 16 (1), 196. doi:10.3390/su16010196
Takano, T., Morita, H., Nakamura, S., Togawa, T., Kachi, N., Kato, H., et al. (2023). Evaluating the quality of life for sustainable urban development. Cities 142, 104561. doi:10.1016/j.cities.2023.104561
Tang, J., Di, L., Xiao, J., Lu, D., and Zhou, Y. (2017). Impacts of land use and socioeconomic patterns on urban heat island. Int. J. Remote Sens. 38 (11), 3445–3465. doi:10.1080/01431161.2017.1295485
Um, Y. (2013). Assessing classification accuracy using Cohen's kappa in data mining. J. Korea Soc. Comput. Inf. 18 (1), 177–183. doi:10.9708/jksci.2013.18.1.177
Vera Cruz, R., and Amado, M. P. (2015). Construction of a sustainable island city: the case of Cape Verde. Energy Procedia 74, 1476–1489. doi:10.1016/j.egypro.2015.07.797
Wang, Y. (2023). Coordination of public service facilities and greening in residential communities in Beijing. Proc. Int. Conf. Soc. Psychol. Humanity Stud. 10, 358–368. doi:10.54254/2753-7048/10/20230384
Wang, Z., Zhao, H., Lin, B., Zhu, Y., Ouyang, Q., and Yu, J. (2015). Investigation of indoor environment quality of Chinese large-hub airport terminal buildings through longitudinal field measurement and subjective survey. Build. Environ. 94, 593–605. doi:10.1016/j.buildenv.2015.10.014
Wang, J., Zhou, W., and Zhao, W. (2023). A synthetical analysis of urban heat environment in urban megaregion: higher UHI intensity, higher urban temperature? Remote Sens. 15 (24), 5696. doi:10.3390/rs15245696
Wang, A., Wang, J., Zhang, R., and Cao, S.-J. (2024). Mitigating urban heat and air pollution considering green and transportation infrastructure. Transp. Res. Part A Policy Pract. 184, 104079. doi:10.1016/j.tra.2024.104079
Wei, C., Wang, J., Li, P., Wu, B., Liu, H., Jiang, Y., et al. (2021). A new strategy for sponge city construction of urban roads: combining the traditional functions with landscape and drainage. Water 13 (23), 3469. doi:10.3390/w13233469
Wu, H., Sun, B., Li, Z., and Yu, J. (2018). Characterizing thermal behaviors of various pavement materials and their thermal impacts on ambient environment. J. Clean. Prod. 172, 1358–1367. doi:10.1016/j.jclepro.2017.10.182
Xiao, X., Li, Y., Shu, F., Wang, L., He, J., Zou, X., et al. (2021). Coupling relationship of human activity and geographical environment in stage-specific development of urban coastal zone: a case study of Quanzhou Bay, China (1954-2020). Front. Mar. Sci. 8, 781910. doi:10.3389/fmars.2021.781910
Xu, X., Pei, H., Wang, C., Xu, Q., Xie, H., Jin, Y., et al. (2023). Long-term analysis of the urban heat island effect using multisource Landsat images considering inter-class differences in land surface temperature products. Sci. Total Environ. 858, 159777. doi:10.1016/j.scitotenv.2022.159777
Xu L, L., Ding, S., Nitivattananon, V., and Tang, J. (2021). Long-term dynamic of land reclamation and its impact on coastal flooding: a case study in Xiamen, China. Land 10 (8), 866. doi:10.3390/land10080866
Xu, S., Yang, K., Xu, Y., Zhu, Y., Luo, Y., Shang, C., et al. (2021). Urban land surface temperature monitoring and surface thermal runoff pollution evaluation using UAV thermal remote sensing technology. Sustainability 13 (20), 11203. doi:10.3390/su132011203
Yang, C., Yan, F., and Zhang, S. (2020). Comparison of land surface and air temperatures for quantifying summer and winter urban heat island in a snow climate city. J. Environ. Manag. 265, 110563. doi:10.1016/j.jenvman.2020.110563
Yao, X., Yu, K., Zeng, X., Lin, Y., Ye, B., Shen, X., et al. (2022a). How can urban parks be planned to mitigate urban heat island effect in “Furnace cities”? An accumulation perspective. J. Clean. Prod. 330, 129852. doi:10.1016/j.jclepro.2021.129852
Yao, X., Zhu, Z., Zeng, X., Huang, S., Liu, Q., Yu, K., et al. (2022b). Linking maximum-impact and cumulative-impact indices to quantify the cooling effect of waterbodies in a subtropical city: a seasonal perspective. Sustain. Cities Soc. 82, 103902. doi:10.1016/j.scs.2022.103902
Yao, X., Zhu, Z., Zhou, X., Shen, Y., Shen, X., and Xu, Z. (2022c). Investigating the effects of urban morphological factors on seasonal land surface temperature in a “Furnace city” from a block perspective. Sustain. Cities Soc. 86, 104165. doi:10.1016/j.scs.2022.104165
Yao, X., Zeng, X., Zhu, Z., Lan, Y., Shen, Y., Liu, Q., et al. (2023). Exploring the diurnal variations of the driving factors affecting block-based LST in a “Furnace city” using ECOSTRESS thermal imaging. Sustain. Cities Soc. 98, 104841. doi:10.1016/j.scs.2023.104841
Yeh, C.-T., and Huang, S.-L. (2009). Investigating spatiotemporal patterns of landscape diversity in response to urbanization. Landsc. Urban Plan. 93 (3-4), 151–162. doi:10.1016/j.landurbplan.2009.07.002
Yu, X., Guo, X., and Wu, Z. (2014). Land surface temperature retrieval from Landsat 8 TIRS—Comparison between radiative transfer equation-based method, split window algorithm and single channel method. Remote Sens. 6 (10), 9829–9852. doi:10.3390/rs6109829
Zhang, Y., and Cheng, J. (2018). Analysis of seasonal characteristics of thermal environment based on urban sub-pixel land use types. J. Comput. Commun. 6 (11), 77–90. doi:10.4236/jcc.2018.611007
Zhang, L., Yuan, J., and Kim, C. (2022). Sustainable planning and design of ocean city spatial forms based on space syntax. Sustainability 14 (24), 16620. doi:10.3390/su142416620
Zhang, N., Zhang, J., Chen, W., and Su, J. (2022). Block-based variations in the impact of characteristics of urban functional zones on the urban heat island effect: a case study of Beijing. Sustain. Cities Soc. 76, 103529. doi:10.1016/j.scs.2021.103529
Zhao, L., Lee, X., Smith, R. B., and Oleson, K. (2014). Strong contributions of local background climate to urban heat islands. Nature 511 (7508), 216–219. doi:10.1038/nature13462
Zhao, X., Liu, J., and Bu, Y. (2021). Quantitative analysis of spatial heterogeneity and driving forces of the thermal environment in urban built-up areas: a case study in Xi'an, China. Sustainability 13 (4), 1870. doi:10.3390/su13041870
Zhao, S., Zhao, K., Yan, Y., Zhu, K., and Guan, C. (2022). Spatio-temporal evolution characteristics and influencing factors of urban service-industry land in China. Land 11 (1), 13. doi:10.3390/land11010013
Zhou, C., Wang, Z., Chen, Q., Jiang, Y., and Pei, J. (2014). Design optimization and field demonstration of natural ventilation for high-rise residential buildings. Energy Build. 82, 457–465. doi:10.1016/j.enbuild.2014.06.036
Zhu, R., Liu, Y., Yan, B., Zhang, X., Yuan, L., Wang, Y., et al. (2023). Effects of district parameters, green space, and building density on thermal comfort – a case study of Badaguan District in Qingdao. Case Stud. Therm. Eng. 42, 102705. doi:10.1016/j.csite.2023.102705
Keywords: land surface temperature, urban functional zones, driving factors, seasonal variation, multiple stepwise regression analysis
Citation: Xu Y (2025) Identifying the dominant seasonal drivers of land surface temperature on Xiamen Island: an urban functional zone perspective. Front. Environ. Sci. 13:1661441. doi: 10.3389/fenvs.2025.1661441
Received: 07 July 2025; Accepted: 16 September 2025;
Published: 29 September 2025.
Edited by:
Sawaid Abbas, University of the Punjab, PakistanReviewed by:
Nicole Cristine Laureanti, Potsdam Institute for Climate Impact Research (PIK), GermanyMamta Bansal, Maharaja Agrasen University, India
Copyright © 2025 Xu. This is an open-access article distributed under the terms of the Creative Commons Attribution License (CC BY). The use, distribution or reproduction in other forums is permitted, provided the original author(s) and the copyright owner(s) are credited and that the original publication in this journal is cited, in accordance with accepted academic practice. No use, distribution or reproduction is permitted which does not comply with these terms.
*Correspondence: Yaolu Xu, Z3JlZW55d2luZDIzM0BnbWFpbC5jb20=