 Junpei Huang
 Ruofei Lin
- 1Department of Physical Education, Tongji University, Shanghai, China
- 2International College of Football, Tongji University, Shanghai, China
Mega Sports Events draw global attention and engagement but also result in substantial environmental costs, primarily through significant carbon emissions generated during the preparatory phase. This research specifically examines the carbon emissions associated with the preparation stage of international Mega Sports Events, assessing their environmental impacts and exploring effective strategies for mitigation. Using the 2022 Beijing Winter Olympics as a case study, this paper employs the Synthetic Control Method (SCM) and the Logarithmic Mean Divisia Index (LMDI) to analyze the impact of the Olympic preparations on Beijing’s carbon emissions. The findings indicate that from 2015 to 2022, the preparations contributed approximately 118 million tons of additional carbon emissions. The emission rate initially rose but subsequently decreased, corresponding to the completion of major infrastructure projects for the event. The LMDI decomposition highlights that economic activities spurred by the Olympics primarily drove these emissions.
1 Introduction
Developing low-carbon practices in sports aligns with China’s dual-carbon goals and mirrors global sustainability trends. Since the inclusion of environmental protection principles into the Olympic Charter in 1996, sustainability has increasingly dominated international sports event planning. Notably, events such as the Beijing Olympics, Hangzhou Asian Games, and World University Games have prioritized ecological sustainability.
Mega sports events (MSEs) are defined as government-hosted activities. MSEs involve the construction of venues, personnel and logistics transportation, and are recognized as ‘carbon-intensive industries’ (Müller, 2015). Compared to the hosting phase, the construction during the preparatory phase is more ecologically destructive (Stephen and Chalkley, 2004). To host MSEs, the city or country hosting the event needs to refurbish and construct sports facilities and upgrade power generation capacities, which may notably raise local carbon emissions throughout the preparation stage. Furthermore, MSEs can indirectly impact the host’s carbon emissions through urban renewal, industrial development, structural changes, urban branding, and green behavior demonstration.
During the 75th United Nations General Assembly, China committed itself to reaching a carbon emission peak by 2030 and achieving carbon neutrality by 2060. Consequently, China has implemented policies across various sectors. For instance, during the 2022 Beijing Winter Olympics, stringent carbon emission control measures were adopted to minimize environmental impact, including the use of cleaner energy, improved transportation efficiency, and other eco-friendly measures to ensure environmental sustainability during the event. However, these measures may not reflect the overall carbon impact, as high-carbon activities during the long preparatory phase still exist and could significantly affect local carbon emissions. The Beijing Winter Olympics in 2022 occurred from February 4 to 20 February 2022, lasting only about half a month, but the preparatory phase spanned 7 years since its successful bid in 2015.
Accounting for carbon emissions from MSEs has been a global challenge (Gallo and Arcioni, 2020). In the sports field, as of 2022, there were 79 English-language papers, 24 of which were conceptual or review articles. Of these, 49 papers discussed policies, organizational mechanisms, and green behaviors for sports carbon reduction, while 30 focused on carbon emission calculations in sports (Wilby et al., 2023). Research on sports carbon emissions mainly involves specific aspects of major events such as the Olympics, football, skiing, and golf, including travel emissions of teams and spectators, venue construction and operation, sports tourism, and sports equipment emissions (Wu et al., 2011; Wicker, 2018).
Existing literature on how Mega Sports Events affect host carbon emissions remains sparse and scattered. Most studies analyze the ecological impacts, including carbon emissions, in three main areas: 1) the impact of venue and transportation infrastructure construction or renovation on the environment (Chen and Jin, 2013; Ventura and Ramos, 2019), 2) the effectiveness of temporary environmental control measures during the event, which are seen as short-term without long-term effects, and 3) comparisons of air quality indicators before and after events at specific locations (Wang et al., 2014).
This research takes the Beijing Winter Olympics as an example to explore how sports events affect carbon emissions during their preparatory stages, considering the event’s unique characteristics of strict control during the hosting phase and an extended preparatory phase. Through detailed analysis of data and trends, this study aims to uncover insightful findings that not only pertain to a single sports event but also address global environmental and sustainability issues.
This paper makes three distinct contributions to the literature. First, it shifts attention from the widely studied hosting phase to the preparatory phase of mega sports events, demonstrating that long-term construction and service expansion leave a more persistent carbon footprint than short-lived event-time measures. This study extends the literature by bringing the underexplored preparatory phase into the center of analysis. Second, the paper introduces a methodological innovation by integrating the Synthetic Control Method (SCM) with the Logarithmic Mean Divisia Index (LMDI). SCM enables robust counterfactual analysis of single events, while LMDI disentangles the contribution of affluence, population, technology, and energy structure, thus offering a more comprehensive understanding of emission drivers. Third, by compiling detailed provincial-level fuel consumption and energy conversion data, the study provides empirical evidence from the Beijing Winter Olympics that not only enriches the literature on sports and the environment but also delivers practical implications for designing low-carbon pathways in future mega events.
The paper’s organization is as follows: Section 2 provides literature review; Section 3 describes research methodologies (including SCM and LMDI) and investigates the impacts using the Beijing Winter Olympics as a practical example; Section 4 discusses results, including the early impacts of the 2022 Beijing Winter Olympics, placebo tests, ordering tests, and the channels through which the event influenced carbon emissions and Section 5 ends with policy recommendations.
2 Literature review
Mega sports events (MSEs) are held globally and have significant impacts on host cities, extending beyond sports to boost visibility and tourism, enhance administrative efficiency, foster economic development, upgrade infrastructure, and generate employment opportunities. The relationship between sports events and the environment is increasingly prominent in today’s world, as climate change and environmental issues become global focal points, these MSEs can also result in substantial carbon emissions and depletion of natural resources resulting from constructing large-scale facilities, significant transportation needs, and extensive media coverage (Pourpakdelfekr and Oboudi, 2022). Events like the Olympics and the World Cup typically involve numerous venues requiring extensive energy resources for their construction and operations. Additionally, the influx of large spectator crowds places enormous pressure on transportation systems, increasing carbon emissions. The 1964 Tokyo Olympics exemplified the concept of “luxury,” investing significantly in urban renewal and local ecological interventions, including a costly Olympic village later abandoned. Following this, the International Olympic Committee (IOC), as a prominent sports governing body, set various criteria for cities intending to host events. Cities applying to host must present realistic environmental objectives and detailed action plans. Historically, host cities have implemented significant environmental improvements, such as Beijing shutting down many inefficient factories during the 2008 Olympics, temporarily reducing local carbon emissions, although a significant portion of these benefits diminished shortly after the games (Zhang et al., 2016).
This review specifically examines how MSEs influence carbon emissions, covering four primary dimensions: emissions during preparation, emissions during the event, emissions post-event, and methodologies used in prior studies.
Regarding emissions during the preparatory phase, studies are relatively scarce and typically employ qualitative methods such as interviews and questionnaires. These investigations generally conclude that emissions during the preparatory phase exceed those during or after the event. Pourpakdelfekr and Oboudi. (2022) highlighted that negative environmental impacts predominantly occur during infrastructure development, transport management, and waste handling, pinpointing key environmental stress areas during preparations. For example, Zhang et al. (2022) investigated local carbon emissions related to the 2014 Nanjing Youth Olympics (NYO) across different event phases, noting lower emissions during the event year compared to the preparation years.
Studies examining carbon emissions during the event-hosting phase are more common, emphasizing spectators’ transportation and participant-related activities. Dolf and Teehan. (2015) found that spectators’ travel significantly contributes to carbon emissions, with air travel representing a considerable share. Triantafyllidis and Davakos. (2019) also identified self-driving as a substantial emission source in developing cities during sports events. Edwards et al. (2016), studying major university events, similarly observed that travel significantly influenced emissions, followed by accommodation and energy use. Wicker (2018) explored carbon footprints of various sports events, finding individual sports typically generated higher emissions than team sports, such as marathons (Castaignède et al., 2021). McCullough et al. (2023) similarly observed that participant travel accounted for most emissions in North American running events.
There are discrepancies in the research on carbon emissions after sports events. Liu and Li. (2022) indicated that the carbon emissions of the studied province significantly decreased a year after major events, with the reduction exceeding the increase in emissions during the event year. However, Kellison and Casper, 2017 found that the promised environmental improvements before the 2016 Brazil Olympics were not realized, highlighting that minimizing the environmental impact of large events requires substantial planning and funding. The effectiveness of post-event environmental planning lies in its sustainability, which is a decades-long plan that cannot be hastily executed; otherwise, it leaves behind empty stadiums and degraded environments. Agha, Fairley, and Gibson (2012) showed that local Olympic organizing committees have little incentive to critically address post-event environmental issues, as their primary responsibility is to host the Olympics. Once the Olympics end, the organizing committee usually disbands, informally delegating the completion of planning to the local community. Organizational groups often propose broad but ambitious plans, but due to a lack of incentives and accountability, the execution is poor, or the implementation of environmental plans may be suspended to support other projects (Agha et al., 2012).
Research on carbon emissions utilizes multiple methodologies, including questionnaires, environmental input-output analysis, ecological footprint, index decomposition analysis, difference-in-differences (DID) approach, and logarithmic mean Divisia index (LMDI). Pourpakdelfekr and Oboudi. (2022) employed qualitative methods, library studies, and previous literature, adopting a snowball sampling technique to identify 15 specialists in sports and environmental disciplines for interviews until achieving theoretical saturation (each session lasting 20–40 min). The World Wildlife Fund. (2006) and Wiedmann et al. (2006) suggested two approaches for evaluating the environmental effects of Mega Sports Events (MSEs). The ecological footprint method provides a broader global impact assessment. Collins and Flynn. (2008) applied the ecological footprint to assess the environmental sustainability of the FA Cup final held in the United Kingdom. Nevertheless, Van Kooten and Bulte (2000) critiqued that the ecological footprint does not encompass all human environmental impacts or adequately consider whether reference consumption patterns affect the Earth’s biological capacity. Moreover, the environmental input-output method’s linear assumptions about price fluctuations and technical coefficients in industry production neglect nonlinearities and dynamic changes, as noted by Collins et al. (2009).
Recent scholarship has expanded beyond traditional approaches by incorporating more advanced decomposition and efficiency frameworks. Ang and Goh, 2019 employed index decomposition analysis, including both Laspeyres and Divisia index analyses, to thoroughly investigate the mechanisms influencing the environmental impacts of MSEs. Liu and Li. (2022) used a propensity score matching difference-in-differences (PSM-DID) model to examine how significant national events (such as political conferences, sports competitions, and cultural exchanges) influenced provincial-level carbon emissions. Zhou et al. (2019) decomposed carbon intensity into 18 factors using the logarithmic mean Divisia index (LMDI), subsequently utilizing the DID method to assess the effect of emission trading pilot projects on carbon intensity. Zhang et al. (2024) assessed the carbon emissions and efficiency of tourist hotels in China by combining the input–output method with a Super-SBM model, thereby offering a perspective on tourism-related carbon impacts through supply-chain analysis. Huang et al. (2025) applied decomposition analysis to explore regional differences in agricultural carbon emissions across China, revealing how spatial and economic heterogeneity shapes emission drivers. Likewise, Du (2022) developed a hybrid Trigonometric Envelopment Analysis model to evaluate ecological efficiency in 248 Chinese cities, integrating DEA with DID to capture both efficiency performance and policy impacts.
Among various analytical methods—including questionnaires, environmental input-output analysis, ecological footprint, index decomposition, DID, SCM, and LMDI—each presents certain advantages as well as inherent limitations: Questionnaires allow qualitative insights into perceptions, behaviors, and organizational practices; however, they are prone to subjective bias, sample selection issues, and limited generalizability. Environmental input-output analysis is effective at capturing broad domestic environmental impacts with sectoral detail, but its reliance on fixed technical coefficients and linear price assumptions limits its ability to reflect nonlinear technological change or sudden policy shifts. Ecological footprint methods provide a global perspective on resource and emission pressures, but they often oversimplify human–environment interactions and may not align well with local policy levers. Index decomposition analysis (such as LMDI) offers relatively modest data demands and clean “accounting” of drivers (affluence, population, energy intensity, etc.), making it powerful for tracking trends, but it does not inherently establish causality and can be sensitive to data scale and base-year selection. Difference-in-Differences (DID) approaches are strong in identifying policy effects when treatment and control groups are well matched; however, they face challenges with unobserved confounders, violation of parallel trends, and sometimes with selection of units. Synthetic Control Method (SCM) excels at estimating counterfactual trajectories for individual treated units, reducing bias from confounding events, but depends heavily on donor pool choice, pre-treatment fit, and may be vulnerable if key comparators are missing.
To address these methodological shortcomings, this study employs an integrated analytical framework, combining the Synthetic Control Method (SCM) and the Logarithmic Mean Divisia Index (LMDI). Unlike traditional parametric methods, SCM relies on observed data patterns to determine weights objectively, significantly reducing subjective bias and effectively tackling common issues of endogeneity and assumptions required in conventional DID analyses. In parallel, the LMDI method enables detailed breakdowns of carbon emissions, clarifying how various contributing factors interact and influence emission trends.
Building upon the methodological approach presented by Zhou and Zhang (2022), this research applies SCM and LMDI to explore specific factors influencing carbon emissions during the preparation phase of the Beijing Winter Olympics. By integrating these two complementary methods, the research provides clearer insights into balancing the hosting of large-scale sports events with environmental sustainability goals. Such analysis yields valuable recommendations for policy actions aimed at effectively managing carbon emissions, contributing to broader environmental management practices and advancing interdisciplinary scholarship in environmental and sports studies.
3 Research methods
The empirical analysis in this study adopts two primary approaches. The Synthetic Control Method (SCM) first assesses how mega sports events influence local carbon emissions. Next, the Logarithmic Mean Divisia Index (LMDI) decomposition method identifies the key mechanisms and individual factors through which mega sports events impact these emissions.
3.1 Synthetic control method (SCM)
The Difference-in-Differences (DID) approach is frequently employed in impact evaluation research. To resolve issues where DID may fail to fulfill random assignment criteria, this study applies SCM to analyze the effects of hosting MSEs on local carbon emissions. Practically, SCM assigns weights to multiple selected Decision-Making Units (DMUs) to construct an idealized control group. Typically, selected control units are assigned positive weights summing to one (Temple, 1999). Researchers can design experiments without prior knowledge of outcomes, enhancing the robustness of this method (Rubin, 2001), hence its broad adoption.
Assume that during the period
In Equation 1,
To evaluate the MSE’s effect on the initial DMU’s carbon emissions, we need to simulate
Assuming the existence of a vector set
The derived approximate values determine the synthetic control vector
3.2 Logarithmic mean divisia index method
To identify the pathways through which a Mega Sports Event (MSE) shapes carbon emissions, we first apply the Logarithmic Mean Divisia Index (LMDI) technique to break down the main drivers of those emissions—each driver indicating a potential impact channel. The Synthetic Control Method (SCM) is then used on these decomposed drivers to see how the event alters them and to derive our conclusions.
3.2.1 LMDI for analyzing potential impact channels
Previous research frequently employs the LMDI framework to isolate the forces behind different environmental outcomes (Chen and Lin, 2020; Jia et al., 2018; Liu et al., 2007). In this study, we use LMDI to quantify how energy structure, energy intensity, population, and economic output influence carbon emissions in 29 Chinese provinces and municipalities. Equation 4 expresses the decomposition:
Where
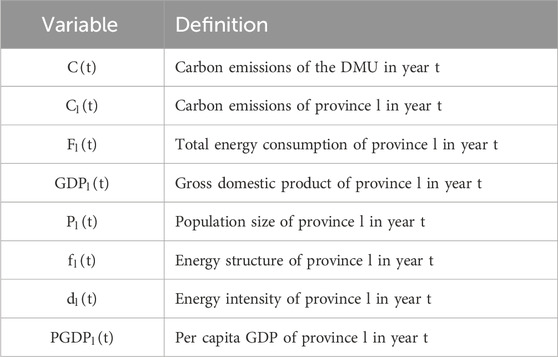
Table 1. Definitions of variables in the model.
The intensity change in carbon emissions is expressed by Equation 6:
Equation 6 shows how variations in energy structure, energy intensity, per capita GDP, and population collectively drive year-to-year changes in total carbon emissions. Table 2 summarizes the individual contribution of each driver to the annual emission change.
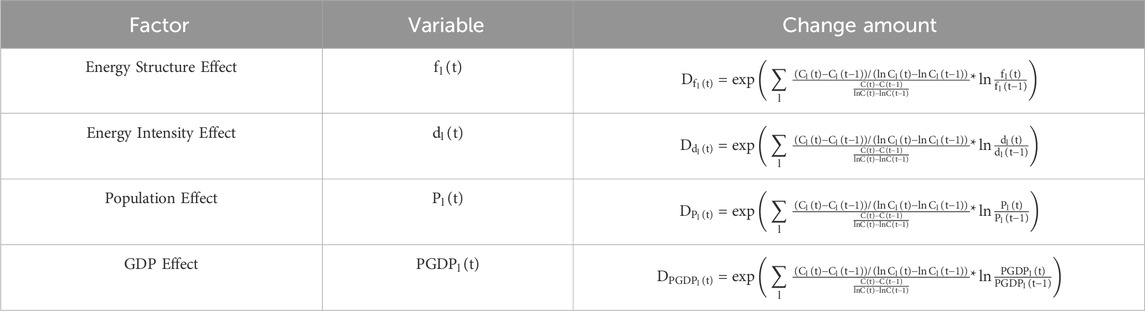
Table 2. Changes in the effects of each factor on carbon emissions.
By examining these variations, the study pinpoints the pathways through which Mega Sports Events may affect carbon emissions. If a change in one of these factors significantly affects carbon emissions, it is confirmed as a channel through which the Beijing Winter Olympics impacted carbon emissions.
Assuming each region’s carbon emissions at time t relative to time
In Equation 7,
This comprehensive model allows us to assess the total carbon emissions and understand how hosting an MSE, like the Beijing Winter Olympics, impacts the emissions through various channels.
3.3 Policy impact: the Beijing Winter Olympics
The Beijing 2022 Winter Olympics ran from 4 to 20 February 2022, marking the 24th edition of the Winter Games. Beyond the spectacle, it served as an international showcase for winter-sport athletes and reaffirmed the Olympic ideals. Bringing the Games back to China—after the 2008 Summer Olympics—re-energised domestic winter-sport development and drew fresh global attention to Beijing-based venues such as the Bird’s Nest, the Water Cube and the Capital Indoor Stadium.
Although the competition lasted just over 2 weeks, preparations stretched across 7 years. Those preparations covered far more than stadium construction: rehearsal events, security rehearsals, transport-network upgrades and environmental-protection projects all demanded extensive planning. Such sustained activity inevitably carried an environmental cost—particularly in terms of carbon output.
Because climate policy now sits at the forefront of world debate, every stage of the Beijing Games came under scrutiny. Separating the carbon footprint of an 18-day sporting festival from the multi-year build-up is difficult, yet it is clear that the long preparation window—new venues, energy-supply upgrades and large-scale logistics—left a measurable mark.
To explore that mark, our analysis treats Beijing municipality as the primary decision-making unit (DMU) influenced by the Olympics; the remaining provinces form a comparison pool. We take 2015—the year Beijing secured hosting rights—as the start of the “preparation period” and follow annual data through to 2021. This window allows us to isolate how the run-up to the Games shaped local carbon-emission trajectories.
3.4 Variables and data sources
Because Beijing last staged a major Olympic event in 2008, the city had already experienced a range of environmental, economic, and social after-effects. To avoid conflating those residual impacts with the preparations for the 2022 Winter Games, we limit our sample period to the years after 2008. Earlier work (Chen and Jin, 2013; Zhang et al., 2016) suggests that post-event environmental signals can linger for up to 2 years, so we adopt 2011–2021 as the most conservative window for modelling Beijing’s carbon trajectory.
Geographically, Beijing occupies just 0.17% of China’s landmass on the North-China Plain yet ranks among the country’s most urbanised and prosperous regions. In 2021, the municipality produced roughly 821 million t of CO2 while generating RMB 4.1 trillion of GDP—about 3.6% of the national total.
Carbon emissions are the primary variable in this study, calculated as terminal fuel use (all sectors except household) and energy conversion consumption. The fuels considered include coal, coke, oil, crude oil, gasoline, kerosene, diesel, fuel oil, liquefied petroleum gas, natural gas, and electricity consumption. According to the IPCC Fourth Assessment Report (2007), the burning of fossil fuels is a major source of greenhouse gas emissions. Therefore, this study estimates CO2 emissions based on annual terminal energy consumption data for each province, following the calculation methods outlined in the 2006 IPCC Guidelines for National Greenhouse Gas Inventories (IPCC, 2006).
Explanatory variables fall into three broad buckets, following the STIRPAT logic (Dietz and Rosa, 1994), which models environmental impacts as a function of Population (P), Affluence (A), and Technology (T):
Population (P): both size and structure. Prior studies (Asumadu-;Asumadu-Sarkodie and Owusu, 2016; Cole and Neumayer, 2004) link larger or more urbanised populations to higher emissions, although the relationship may be non-linear.
Affluence (A): proxied by GDP. Empirical evidence (Begum et al., 2015) often shows an inverted-U pattern between income and per capita CO2.
Technology (T): captured by energy intensity (energy use per unit of GDP). A downward trend in energy intensity usually signals efficiency gains and lower emissions (Xiao et al., 2015).
Given the recognized importance of energy structure and regulatory pressure in cutting emissions, we also control for (i) the coal share in each province’s energy mix and (ii) the ratio of local government spending on industrial-pollution abatement to GDP (Environmental Regulation Intensity).
Finally, descriptive statistics for all variables appear in Table 3. Provincial emissions range widely—from roughly 4.4 million t in Tibet to over 110 million t in Inner Mongolia—underscoring the diversity of China’s regional energy profiles. Data originate from the China Energy Yearbook, the China Statistical Yearbook, and individual provincial yearbooks. Hong Kong, Macau, Taiwan, and Tibet are excluded from the donor pool because of incomplete energy-balance information.
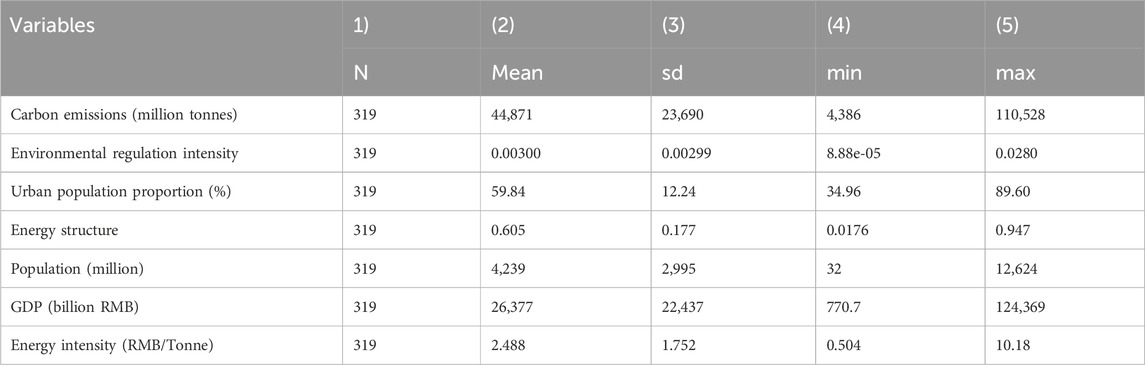
Table 3. Decriptive statistics.
4 Results
4.1 Impact of the 2022 Beijing Winter Olympics preparation phase
4.1.1 Validating the synthetic control method
Our first task is to check whether the “synthetic Beijing” we built looks like the real city before Winter-Games planning began. Table 4 reports the empirical outcome of the Synthetic Control Method (SCM), where weights are determined by minimizing the Root Mean Squared Prediction Error (RMSPE). Out of thirty candidate provinces, only Shanghai, Liaoning, and Hainan receive positive weights, with Shanghai taking the dominant share (0.565). The RMSPE of the synthetic Beijing before 2015 is 308.76, which represents less than 0.1% of Beijing’s annual carbon emissions (ranging from 689 Mt in 2015 to 821 Mt in 2021). This confirms a very close fit between the actual and synthetic series.
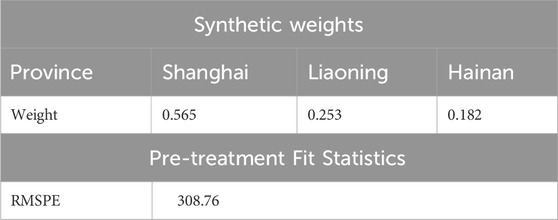
Table 4. Synthetic weights and pre-treatment fit for Beijing.
This weighting outcome is economically plausible. Shanghai shares Beijing’s high level of urbanization, advanced service sector, and stringent environmental regulation, making it the closest structural analogue. Liaoning represents heavy industry and an energy-intensive economy that mirrors aspects of Beijing’s pre-2015 profile, while Hainan captures the rapid expansion of service and tourism sectors. Although Shanghai’s weight is relatively high, robustness checks (including placebo and ordering-rank tests) demonstrate that the results are not driven by any single donor province, lending confidence to the validity of the synthetic Beijing.
When we line up the two CO2 series and the main covariates (Table 5), the fit is tight: the geometric-mean gap in carbon output prior to 2015 is roughly 0.22 percent. Six auxiliary indicators—including the log of per capita GDP and the proportion of the secondary sector—also match closely, and their discrepancies are much smaller than those obtained by simply averaging all donor provinces. In short, the weighted combination reproduces Beijing’s pre-bid economic and energy profile with high fidelity, giving us a credible counterfactual for gauging how Winter-Olympics preparations altered the city’s carbon trajectory.

Table 5. Results of the Applicability test for the synthetic control method.
4.1.2 Main findings
Figure 1 contrasts observed and synthetic CO2 trajectories for Beijing over 2011–2022, and Figure 2 plots their gap. We interpret that gap as the net effect of the Winter-Games project. From the 2015 bid announcement onward, measured emissions in Beijing outpace the synthetic counterfactual each year, implying that Olympics-related activity added to the city’s carbon load during 2015–2021. Cumulatively, the extra output is estimated at roughly 118 million t.

Figure 1. Actual and synthetic carbon emissions for Beijing (2011–2022).
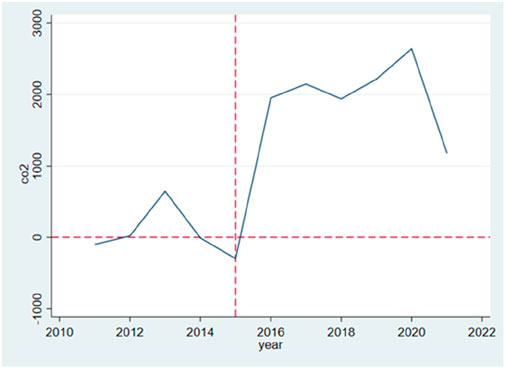
Figure 2. Difference between actual and synthetic carbon emissions for Beijing (2011–2022).
Although this value may appear modest in relative terms, it is statistically significant. The ordering-rank test (Section 4.2.3) shows that Beijing’s divergence from its synthetic control consistently ranks at the upper bound of placebo cases, confirming that the identified effect is unlikely to result from random variation or model artifacts.
It is also practically significant. The additional 118 Mt occurred during a period when Beijing was under policy pressure to peak emissions and demonstrate tangible progress toward its dual-carbon commitments. This increase represented a substantial offset to the city’s planned decarbonization pathway, underscoring the fact that mega-event preparations can impose a material burden on urban climate governance.
The build-up in emissions is linked to a surge in local demand for construction inputs—steel, cement, glass, and other materials—needed to refurbish and expand Winter-Games venues. Manufacturing those inputs raised industrial energy use. With the municipality funnelling large sums into venue upgrades after the successful bid, annual city-wide emissions climbed from 689 Mt in 2015 to 821 Mt in 2021, an average rise of 2.9 percent per year.
4.2 Robustness checks
The preceding comparison shows a clear post-2015 divergence between actual and synthetic Beijing. Yet we must test whether that divergence truly stems from the Games rather than unobserved shocks. To reinforce confidence in the result, we run three auxiliary experiments to screen out random noise.
4.2.1 Placebo test by region
The regional placebo exercise, originally advanced by Abadie and co-authors (Abadie et al., 2015; Hall et al., 2020), serves as a randomisation check on causal claims. Its logic is straightforward: pick provinces that, in principle, felt no influence from the 2022 Games, rebuild their synthetic controls, and then inspect whether the real-versus-synthetic gap diverges after the policy year. A large post-treatment divergence would suggest that our baseline synthetic-control evidence might be spurious.
For this study we examined two contrasting provinces. Shanghai received the heaviest donor weight in the main SCM, meaning its pre-2015 emission profile most closely mirrored Beijing’s. Chongqing, by contrast, carried a weight of zero, representing the greatest structural distance from the capital in terms of energy mix and economic composition. We therefore generated new synthetic emission paths for both Shanghai and Chongqing using the exact same SCM specification employed for Beijing.
Figure 3 summarises the results. After the 2015 bid announcement, the distance between observed and synthetic emissions for both placebo regions remains essentially flat. In other words, neither Shanghai nor Chongqing displays the post-2015 surge that characterises Beijing’s actual data. The absence of any pronounced divergence lends credibility to our main finding: the rise in emissions is tied to Olympic preparations unique to Beijing rather than to unobserved nationwide shocks or quirks in the SCM algorithm itself.
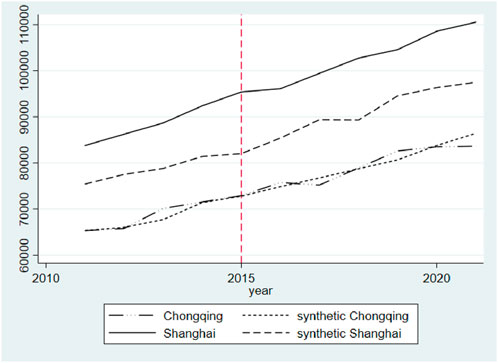
Figure 3. Results of the placebo test based on regions.
4.2.2 Placebo Test Based on Time
Because SCM cannot capture every underlying driver—particularly long-run trends—we also conduct a time-based placebo. The idea is to imagine that Beijing’s winning bid occurred 2 years later, in 2017, and to rerun the synthetic-control exercise under that counterfactual. Figure 4 presents the outcome. Even with the bid date pushed forward, the synthetic series still separates from the observed Beijing trajectory beginning in 2015, and the gap continues to widen thereafter, echoing the pattern in Figure 1. The persistence of this divergence suggests that the extra emissions we identify stem from the Olympics shock itself, not from quirks of the SCM specification or from unmodelled temporal drift. In short, the Winter-Games preparations remain the most plausible explanation for the post-2015 rise in Beijing’s carbon output.

Figure 4. Results of the placebo test based on time.
4.2.3 Ordering-rank test
The preceding evidence points to a post-2015 surge in Beijing’s CO2 output that coincides with Winter-Games preparations. To confirm that this rise is not only visible but also statistically robust, we adopt Abadie’s ordering-rank procedure (Abadie et al., 2010), which functions like a league-table comparison of treatment effects. The method imagines that every province in the donor pool secured the 2015 Winter-Games bid and then applies the same SCM routine to track its “pseudo-treatment” path. If Beijing’s actual-versus-synthetic gap consistently outranks those of the placebo regions, the Olympic effect is deemed significant.
Before running the ranking, we screen out control provinces with poor pre-2015 fits, using the RMSPE threshold recommended by Abadie. Any province whose pre-event RMSPE is more than five times Beijing’s is removed, following Kim and Kim (2016). This filter leaves seventeen credible comparators. Figure 5 plots their synthetic gaps alongside Beijing’s. Prior to the bid year, the capital’s emission trajectory overlaps the control curves; after 2015, however, Beijing’s line moves steadily to the upper margin, while most placebo gaps hover near zero. Only once in the sample do any placebo provinces exceed Beijing’s divergence. Consequently, the chance that a randomly chosen region would display an Olympic-sized jump is roughly 6 percent (1/17), meeting the 10 percent significance rule of thumb, which confirming that the post-treatment gap is highly unlikely to result from chance. This result also demonstrates the stability of the cumulative 118 Mt estimate: the observed effect does not hinge on the inclusion or exclusion of any single donor province, but rather reflects a systematic and statistically robust divergence between actual and synthetic Beijing.
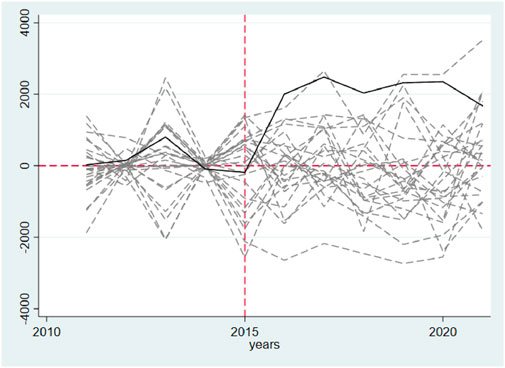
Figure 5. Ordering-rank test.
4.3 Channels of carbon emissions impact due to the 2022 Beijing Winter Olympics
This section critically explores the channels through which the 2022 Beijing Winter Olympics influenced carbon emissions, drawing on a detailed comparison between Beijing’s actual emissions and those of its synthetic control. We treat the annual gap between observed Beijing emissions and synthetic Beijing as the Olympic-preparation effect and apply an adaptive Logarithmic Mean Divisia Index (LMDI) to decompose this gap into four primary determinants: energy structure, energy intensity, population, and per capita GDP. Consistent with the SCM identification of the preparation window, the decomposition covers 2016–2021. The quantitative outcomes are summarized in Table 6.
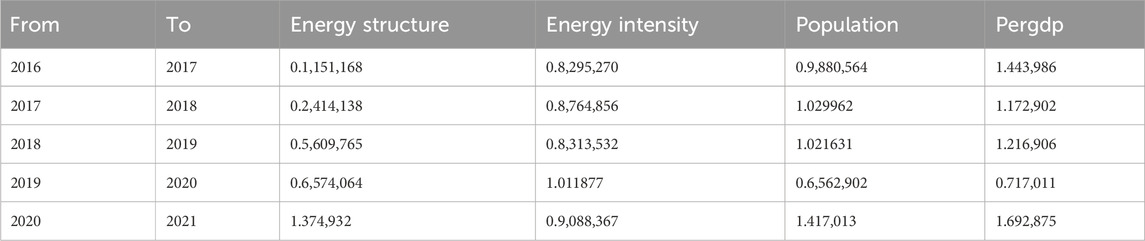
Table 6. LMDI decomposition of the Olympic-preparation emission (2016–2021).
Preparations for Beijing’s Winter Olympics left a clear imprint on the city’s carbon ledger. Four broad influences—fuel choices, energy productivity, demographic pressures, and rising incomes—shaped that footprint, each with distinct timing and intensity. According to the LMDI, framework, coefficients greater than 1 indicate that the factor contributed to emission increases, while coefficients less than 1 indicate that the factor helped reduce emissions. Most of these channels correspond directly to the STIRPAT, framework, where emissions are driven by population (P), affluence (A), and technology (T).
Affluence (A): Affluence was the dominant upward driver during the early preparation years. 2016–2017 (1.44), 2017–2018 (1.17), and 2018–2019 (1.22) all show values greater than 1, indicating that rising incomes and consumption fueled emissions through waves of venue construction, hotel development, and service expansion. In contrast, during 2019–2020 (0.72, <1), affluence shifted to a dampening role: the COVID-19 shock curtailed household incomes, restricted consumption, and delayed investment, thereby suppressing demand-side emissions. By 2020–2021 (1.69, >1), affluence rebounded sharply, reflecting economic recovery and the final sprint to complete Olympic projects.
Population (P): Population effects were limited in most years and turned negative during the first COVID year. Specifically: 2016–2017 (0.988 ≈ 1) was neutral; 2017–2018 (1.030 > 1) and 2018–2019 (1.022 > 1) were mildly positive. In 2019–2020 (0.656 < 1), population reduced emissions—consistent with strict mobility restrictions, interruptions to service employment, and partial demobilization on worksites at the onset of COVID-19. By 2020–2021 (1.417 > 1), population became a strong amplifier, reflecting the remobilization and concentration of on-site labor needed for the final sprint to complete Olympic projects under compressed timelines.
Technology (T): Technology generally mitigated emissions in the early years, with Eff_T < 1 across 2016–2017 (0.83), 2017–2018 (0.88), and 2018–2019 (0.83), showing that efficiency improvements offset some of the upward pressure from affluence and population. During 2019–2020 (Eff_T = 1.01, ≈1), efficiency gains stalled under pandemic disruptions, leaving technology essentially neutral in its impact. In 2020–2021 (Eff_T = 0.91, <1), mitigation returned, reflecting the reactivation of energy-efficiency measures and a partial normalization of industrial operations.
Energy Structure (extension of STIRPAT):Energy structure strongly reduced emissions in the early years, with Eff_ES = 0.12 (2016–2017), 0.24 (2017–2018), and 0.56 (2018–2019), consistent with coal-to-clean energy substitution and “Blue Sky Defense” initiatives. In 2019–2020 (Eff_ES = 0.66, <1), the mix continued to alleviate emissions, partly because the pandemic reduced coal use and energy demand from heavy industry. However, in 2020–2021 (Eff_ES = 1.37, >1), the effect reversed, as reliance on coal-based electricity and diesel-powered machinery increased under compressed construction timelines, while renewable contributions remained limited.
Overall, the decomposition shows that affluence was the principal upward driver, while technology and energy structure provided intermittent relief but were vulnerable to shocks from construction surges and the pandemic. Population was normally secondary. The COVID-19 period thus produced a dual effect: temporary reductions in affluence-driven emissions and stronger mitigation from energy structure, but also weakened efficiency improvements and elevated population pressures. Moreover, in the post-pandemic phase, the need to accelerate construction and compensate for delays intensified energy demand, thereby further amplifying carbon emissions. These patterns underscore that mega-event preparations can interact with external shocks to generate complex emission dynamics.
5 Conclusion
Beijing’s successful bid for the 2022 Winter Olympics set in motion a sweeping program of construction and service expansion that left a measurable carbon imprint well before the opening ceremony. By pairing the synthetic-control technique with logarithmic mean Divisia decomposition, this paper traces that imprint and disentangles the roles played by affluence, population, technology, and energy structure.
Annual city-level emissions climbed steadily after 2015, the year the bid was approved, and the cumulative addition attributable to Olympic preparations is estimated at roughly 118 million tonnes through 2022. The trajectory, however, was not uniform: emissions spiked during the early construction surge, moderated as projects approached completion, and then shifted again during the COVID years. The decomposition shows that per capita GDP (affluence) was the principal upward driver, with strong increases in 2016–2019, a temporary decline below unity during the first COVID shock in 2019–2020, and a sharp rebound in 2020–2021 as recovery and deadline pressures accelerated demand. Population effects were usually modest, but turned negative in 2019–2020 under mobility restrictions and strongly positive in 2020–2021 when labor was remobilized to catch up with delayed projects. Technology (energy intensity) typically mitigated emissions, but efficiency gains stalled during the pandemic, showing how external shocks can blunt policy effectiveness. Energy structure initially reduced emissions through coal-to-clean transitions, yet reversed in 2020–2021 as coal-fired power and diesel machinery were redeployed under compressed timelines.
Taken together, these results show that mega-event preparations interact with external shocks to generate complex, shifting emission dynamics. The pandemic produced both temporary mitigation (through suppressed affluence and constrained mobility) and subsequent rebound (through intensified labor demand and reliance on high-carbon fuels to make up lost time).
These findings point to several actionable lessons for future mega events:
Early integration of carbon management. Emission control must begin as soon as a bid is secured, not only in the final run-up to the event. Long lead times for construction and infrastructure development should be factored into carbon budgets.
Low-carbon supply chains. Venue and infrastructure design should prioritize materials and processes with verified low-carbon footprints, supported by green procurement standards.
Staggered labor mobilization. To avoid concentrated surges in population-driven emissions, workforce inflows should be smoothed and coordinated with project timelines.
Resilient efficiency policies. Efficiency standards for machinery, construction sites, and energy systems should be enforced continuously, with contingency plans to prevent backsliding during disruptions such as pandemics.
Accelerated energy transition. Event-related facilities should be tied directly to renewable energy sources. Temporary reliance on coal or diesel to meet compressed deadlines should be strictly avoided, with grid planning aligned to renewable expansion.
Legacy planning. Beyond the event itself, infrastructure should be designed for post-event use to ensure that investments deliver long-term social value while minimizing “stranded” carbon costs.
When implemented together, these measures can substantially reduce the carbon footprint of showcase events while maintaining their symbolic and cultural significance.
While this paper provides robust evidence on the carbon impacts of Olympic preparations, several limitations should be acknowledged. The analysis relies on provincial-level energy consumption data, which may mask finer-grained spatial heterogeneity within Beijing. In addition, the SCM and LMDI frameworks, though powerful, are sensitive to data quality and donor pool selection. Future research could benefit from integrating high-resolution datasets, such as satellite-based energy proxies or firm-level activity data, and from applying alternative causal inference methods to triangulate the findings. Comparative studies across different mega-events would also help to generalize the insights and refine policy recommendations.
Data availability statement
The raw data supporting the conclusions of this article will be made available by the authors, without undue reservation.
Author contributions
JH: Validation, Writing – original draft. RL: Conceptualization, Data curation, Methodology, Software, Writing – review and editing.
Funding
The author(s) declare that no financial support was received for the research and/or publication of this article.
Conflict of interest
The authors declare that the research was conducted in the absence of any commercial or financial relationships that could be construed as a potential conflict of interest.
Generative AI statement
The author(s) declare that no Generative AI was used in the creation of this manuscript.
Any alternative text (alt text) provided alongside figures in this article has been generated by Frontiers with the support of artificial intelligence and reasonable efforts have been made to ensure accuracy, including review by the authors wherever possible. If you identify any issues, please contact us.
Publisher’s note
All claims expressed in this article are solely those of the authors and do not necessarily represent those of their affiliated organizations, or those of the publisher, the editors and the reviewers. Any product that may be evaluated in this article, or claim that may be made by its manufacturer, is not guaranteed or endorsed by the publisher.
References
Abadie, A., Diamond, A., and Hainmueller, J. (2010). Synthetic control methods for comparative case studies: estimating the effect of California’s tobacco control program. J. Am. Stat. Assoc. 105 (490), 493–505. doi:10.1198/jasa.2009.ap08746
Abadie, A., Diamond, A., and Hainmueller, J. (2015). Comparative politics and the synthetic control method. Am. J. Political Sci. 59 (2), 495–510. doi:10.1111/ajps.12116
Agha, N., Fairley, S., and Gibson, H. (2012). Considering legacy as a multi-dimensional construct: the legacy of the olympic games. Sport Manag. Rev. 15 (1), 125–139. doi:10.1016/j.smr.2011.08.004
Ang, B. W., and Goh, T. (2019). Index decomposition analysis for comparing emission scenarios: applications and challenges. Energy Econ. 83, 74–87. doi:10.1016/j.eneco.2019.06.013
Asumadu-Sarkodie, S., and Owusu, P. A. (2016). Carbon dioxide emissions, GDP, energy use, and population growth: a multivariate and causality analysis for Ghana, 1971–2013. Environ. Sci. Pollut. Res. 23 (13), 13508–13520. doi:10.1007/s11356-016-6511-x
Begum, R. A., Sohag, K., Abdullah, S. M. S., and Jaafar, M. (2015). CO2 emissions, energy consumption, economic and population growth in Malaysia. Renew. Sustain. Energy Rev. 41, 594–601. doi:10.1016/j.rser.2014.07.205
Castaignède, L., Veny, F., Edwards, J., and Billat, V. (2021). The carbon footprint of marathon runners: training and racing. Int. J. Environ. Res. Public Health 18 (5), 2769. doi:10.3390/ijerph18052769
Chen, Y., Jin, G. Z., Kumar, N., and Shi, G. (2013). The promise of beijing: evaluating the impact of the 2008 olympic games on air quality. J. Environ. Econ. Manag. 66 (3), 424–443.
Chen, Y. T. (2020). A distributional synthetic control method for policy evaluation. J. Appl. Econom. 35 (5), 505–525.
Chen, Y., and Lin, B. (2020). Decomposition analysis of patenting in renewable energy technologies: from an extended LMDI approach perspective based on three Five-Year Plan periods in China. J. Clean. Prod. 269, 122402.
Cole, M. A., and Neumayer, E. (2004). Examining the impact of demographic factors on air pollution. Popul. Environ. 26 (1), 5–21. doi:10.1023/b:poen.0000039950.85422.eb
Collins, A., and Flynn, A. (2008). Measuring the environmental sustainability of a major sporting event: a case study of the FA cup final. Tour. Econ. 14 (4), 751–768. doi:10.5367/000000008786440120
Collins, A., Jones, C., and Munday, M. (2009). Assessing the environmental impacts of mega sporting events: two options? Tour. Manag. 30 (6), 828–837. doi:10.1016/j.tourman.2008.12.006
Dietz, T., and Rosa, E. A. (1994). Rethinking the environmental impacts of population, affluence and technology. Hum. Ecol. Rev. 1 (2), 277–300.
Dolf, M., and Teehan, P. (2015). Reducing the carbon footprint of spectator and team travel at the university of British Columbia's varsity sports events. Sport Manag. Rev. 18 (2), 244–255. doi:10.1016/j.smr.2014.06.003
Edwards, L., Knight, J., Handler, R., Abraham, J., and Blowers, P. (2016). The methodology and results of using life cycle assessment to measure and reduce the greenhouse gas emissions footprint of “Major Events” at the university of Arizona. Int. J. Life Cycle Assess. 21, 536–554. doi:10.1007/s11367-016-1038-4
Gallo, M., Arcioni, L., Leonardi, D., Moreschi, L., and Del Borghi, A. (2020). GHG accounting for sustainable mega-events: how lessons learnt during the milan expo 2015 world fair could lead to less carbon-intensive future mega-events. Sustain. Prod. Consum. 22, 88–109.
Hall, J. C., Matti, J., and Zhou, Y. (2020). The economic impact of city–county consolidations: a synthetic control approach. Public Choice 184, 43–77. doi:10.1007/s11127-019-00699-z
Huang, J., Lu, H., and Du, M. (2025). Regional differences in agricultural carbon emissions in China: measurement, decomposition, and influencing factors. Land 14 (4), 682. Article 682. doi:10.3390/land14040682
IPCC (2006). 2006 IPCC guidelines for national greenhouse gas inventories. Editors H. S. Eggleston, L. Buendia, K. Miwa, T. Ngara, and K. Ngara (Hayama, Japan: Institute for Global Environmental Strategies (IGES)), 465–472. Available online at: https://www.ipcc-nggip.iges.or.jp/public/2006gl/.
Jia, J., Gong, G. L., Xie, D., Chen, J., and Chen, C. (2018). Analysis of drivers and policy implications of carbon dioxide emissions of industrial energy consumption in an underdeveloped city: the case of Nanchang, China. J. Clean. Prod. 183, 843–857.
Kellison, T. B., and Casper, J. M. (2017). Environmental legacy of mega sport events. Legacies mega events Fact or fairy tales, 445–455.
Kim, M. K., and Kim, T. (2016). Estimating impact of regional greenhouse gas initiative on coal to gas switching using synthetic control methods. Energy Econ. 59, 328–335. doi:10.1016/j.eneco.2016.08.019
Liu, J., and Li, Q. (2022). Impact of major events on interprovincial carbon emissions—based on PSM-DID analysis. Sustainability 14 (12), 7459. doi:10.3390/su14127459
Liu, L. C., Fan, Y., Wu, G., and Wei, Y. M. (2007). Using LMDI method to analyze the change of China’s industrial CO2 emissions from final fuel use: an empirical analysis. Energy Policy 35 (11), 5892–5900.
McCullough, B. P., Collins, A., Roberts, J., and Villalobos, S. (2023). Sport events and emissions reporting: an analysis of the council for responsible sport standard in running events. Sustainability 15 (19), 14375. doi:10.3390/su151914375
Müller, M. (2015). What makes an event a mega-event? Definitions and sizes. Leis. Stud. 34 (6), 627–642. doi:10.1080/02614367.2014.993333
Pourpakdelfekr, T., and Oboudi, B. (2022). Overview of sustainable solutions to improve the environmental impacts of mega sporting events. Athens J. Sport 9, 215–230. doi:10.30958/ajspo.9-4-2
Rubin, D. B. (2001). Using propensity scores to Help design observational studies: application to the tobacco litigation. Health Serv. Outcomes Res. Meth. 2, 169–188.
Stephen, E., and Chalkley, B. (2004). Mega-sporting events in urban and regional policy: a history of the Winter Olympics. Plan. Perspect. 19 (2), 201–204. doi:10.1080/0266543042000192475
Triantafyllidis, S., and Davakos, H. (2019). Growing cities and mass participant sport events: traveling behaviors and carbon dioxide emissions. C 5 (3), 49. doi:10.3390/c5030049
van Kooten, G. C., and Bulte, E. H. (2000). The ecological footprint: useful science or politics?. Ecol. Econ. 32 (3), 385–389.
Ventura, L. M. B., Gioda, A., França, B. B., and de Oliveira Godoy, J. M. (2019). Air quality monitoring assessment during the 2016 Olympic Games in Rio de Janeiro, Brazil. Environ. Monit. Assess. 191, 369.
Wang, Y., Zhang, Y., Zhang, Y., Li, Z., and Huang, X. (2014). Characteristics of carbonaceous aerosol pollution in the atmosphere before and after the Shenzhen universiade. China Environ. Sci. 34 (08), 1972–1978. Chinese.
Wicker, P. (2018). The carbon footprint of active sport tourists: an empirical analysis of skiers and boarders. J. Sport & Tour. 22 (2), 151–171. doi:10.1080/14775085.2017.1313706
Wiedmann, T., Minx, J., Barrett, J., and Wackernagel, M. (2006). Allocating ecological footprints to final consumption categories with input–output analysis. Ecol. Econ. 56 (1), 28–48. doi:10.1016/j.ecolecon.2005.05.012
Wilby, R. L., Orr, M., Depledge, D., Giulianotti, R., Havenith, G., Kenyon, J. A., et al. (2023). The impacts of sport emissions on climate: measurement, mitigation, and making a difference. Ann. N. Y. Acad. Sci. 1519 (1), 20–33. doi:10.1111/nyas.14925
Wu, D., Zhang, S., Xu, J., and Zhu, T. (2011). The CO2 reduction effects and climate benefit of Beijing 2008 summer olympics green practice. Energy Procedia 5, 280–296. doi:10.1016/j.egypro.2011.03.050
Xiao, F., Hu, Z. H., Wang, K. X., and Fu, P. H. (2015). Spatial distribution of energy consumption and carbon emission of regional logistics. Sustainability 7 (7), 9140–9159. doi:10.3390/su7079140
Zhang, C., Wang, Q., Shi, D., Li, P., and Cai, W. (2016). Scenario-based potential effects of carbon trading in China: an integrated approach. Appl. Energy 182, 177–190. doi:10.1016/j.apenergy.2016.08.133
Zhang, C., Zhou, X., Zhou, B., and Zhao, Z. (2022). Impacts of a mega sporting event on local carbon emissions: a case of the 2014 Nanjing youth olympics. China Econ. Rev. 73, 101782.
Zhang, J., Yu, T., and Chen, X. (2024). Carbon emissions and their efficiency of tourist hotels in China from the supply chain: based on the input–output method and Super-SBM model. Sustainability 16 (21), 9489.
Keywords: mega sports events, synthetic control method, logarithmic mean divisia index, carbon emissions, Beijing WinterOlympics
Citation: Huang J and Lin R (2025) The impact of preparatory work for mega sports events on carbon emissions: a case study of the Beijing Winter Olympics. Front. Environ. Sci. 13:1665438. doi: 10.3389/fenvs.2025.1665438
Received: 14 July 2025; Accepted: 29 September 2025;
Published: 13 October 2025.
Edited by:
Delu Wang, China University of Mining and Technology, ChinaReviewed by:
Minzhe Du, South China Normal University, ChinaMustafa Necati Çoban, Gaziosmanpaşa University, Türkiye
Copyright © 2025 Huang and Lin. This is an open-access article distributed under the terms of the Creative Commons Attribution License (CC BY). The use, distribution or reproduction in other forums is permitted, provided the original author(s) and the copyright owner(s) are credited and that the original publication in this journal is cited, in accordance with accepted academic practice. No use, distribution or reproduction is permitted which does not comply with these terms.
*Correspondence: Ruofei Lin, MjMxMTNAdG9uZ2ppLmVkdS5jbg==